Article

Dietary n-6:n-3 PUFA Ratio Modulates Inflammation-Related Gene Expression and Influences Improvements in Biochemical Parameters in a Murine Model of Diet-Induced Obesity

by
Alejandro Gutierrez-Guerra
1,2,
Diego Cambron-Mora
1,3,
Roberto Rodriguez-Echevarria
1,
Jorge Hernández-Bello
4,
Wendy Campos-Pérez
1,
Alejandro A. Canales-Aguirre
5,
Mariana Pérez-Robles
1 and
Erika Martinez-Lopez
1,*
1
Instituto de Nutrigenética y Nutrigenómica Traslacional, Departamento de Biología Molecular y Genómica, Centro Universitario de Ciencias de la Salud, Universidad de Guadalajara, Guadalajara 44340, Mexico
2
Doctorado en Ciencias Biomédicas, Centro Universitario de Ciencias de la Salud, Universidad de Guadalajara, Guadalajara 44340, Mexico
3
Doctorado en Ciencias en Biologia Molecular en Medicina, Centro Universitario de Ciencias de la Salud, Universidad de Guadalajara, Guadalajara 44340, Mexico
4
Instituto de Investigación en Ciencias Biomédicas, Departamento de Clínicas Médicas, Centro Universitario de Ciencias de la Salud, Universidad de Guadalajara, Guadalajara 44340, Mexico
5
Unidad de Evaluación Preclínica, Unidad de Biotecnología Médica y Farmacéutica, Centro de Investigación y Asistencia en Tecnología y Diseño del Estado de Jalisco, CIATEJ, Guadalajara 44270, Mexico
*
Author to whom correspondence should be addressed.
Nutrients 2025, 17(12), 1996; https://doi.org/10.3390/nu17121996
Submission received: 17 May 2025 / Revised: 6 June 2025 / Accepted: 10 June 2025 / Published: 13 June 2025
(This article belongs to the Section Nutrition and Obesity)

Abstract

Background: An unbalanced dietary intake of omega-6 (n-6) and omega-3 (n-3) polyunsaturated fatty acids (PUFAs) has been associated with chronic inflammation and oxidative stress, both of which contribute to the pathophysiology of obesity. Objective: We aimed to evaluate the effects of a diet with an n-6:n-3 PUFA ratio of 5:1 on body composition, biochemical parameters, and the gene expression of cytokines and antioxidant enzymes in a murine model of diet-induced obesity. Methods: A diet-induced obesity model was established in C57BL6/J mice over 17 weeks. Mice were then fed different diets for 8 weeks: a control diet (chow), a high-fat diet with a 30:1 n-6:n-3 ratio (HFD-30:1), and a high-fat diet enriched with n-3 fatty acids, with a 5:1 n-6:n-3 ratio (HFD-5:1). Body weight and food intake were monitored throughout this study. Biochemical parameters were measured, and the expression of antioxidant enzymes and cytokine genes was analyzed by qPCR. Data were analyzed using GraphPad Prism software. Results: The HFD-5:1 group exhibited a significant reduction in body weight (p = 0.0182), liver tissue weight (p = 0.01), serum glucose levels (p = 0.010), area under the curve (AUC) (p = 0.0161), cholesterol (p < 0.0001), and triglycerides (p = 0.0069) compared to the HFD-30:1 group. The body weight in the HFD-5:1 group decreased to levels comparable to the control group. Additionally, the expression of the inflammatory cytokine genes Ccl2 (p = 0.0389) and Tgfb1 (p = 0.0226) was significantly reduced. Conclusions: These findings suggest that adjusting the dietary n-6:n-3 ratio to 5:1 modulates inflammation-related gene expression and improves metabolic markers in obese mice, supporting its potential relevance for future translational research.

Graphical Abstract

1. Introduction

Obesity is defined by the World Health Organization (WHO) as an abnormal or excessive accumulation of fat, typically identified by a body mass index (BMI) of 30 kg/m2 or greater [1,2]. In 2022, it was reported that 890 million people worldwide were living with obesity, equating to one in eight individuals [3]. Obesity is a major public health problem, as the accumulation of intra-abdominal and intravascular fat is linked to serious comorbidities, including type 2 diabetes mellitus (T2DM), hypertension, coronary heart disease, hyperlipidemia, and an increased risk of certain cancer types, such as colon, prostate, endometrial, and breast cancer [4].
Obesity is characterized by chronic low-grade inflammation, with elevated serum levels of pro-inflammatory cytokines [5]. It is also associated with oxidative stress, marked by an imbalance between the amount of reactive oxygen species (ROS) and the antioxidant defenses that neutralize them [6]. These processes are closely interconnected, as inflammatory mediators can induce oxidative stress, creating a self-perpetuating feedback loop [7].
One strategy to address obesity involves dietary interventions aimed at modifying food intake patterns and adjusting calories and macronutrient composition, particularly the types of fat consumed [8]. Polyunsaturated fatty acids (PUFAs) are essential nutrients that must be obtained from the diet [9]. They are classified into two main families: omega-6 (n-6) and omega-3 (n-3). A higher proportion of n-6 intake has been associated with pro-inflammatory effects, potentially contributing to the development of obesity, atherosclerosis, and T2DM. In contrast, n-3 fatty acids exhibit regulatory activity in hepatic lipogenesis, as well as anti-inflammatory and antithrombotic properties. A beneficial n-6:n-3 ratio has been proposed in a range from 1:1 to 5:1 [10,11].
The beneficial effects of a higher intake of n-3 fatty acids, especially when the n-6:n-3 ratio approaches a balance, are linked to the antioxidant activities of n-3 derivatives. Specifically, eicosapentaenoic acid (EPA) and docosahexaenoic acid (DHA) have been shown to exert antioxidant effects via the Nrf2 pathway in adipocytes. This pathway plays a critical role in cellular defense mechanisms by regulating the expression of antioxidant proteins that protect against oxidative damage induced by inflammatory processes and metabolic stress [12].
Some studies suggest that a lower n-6:n-3 ratio may improve metabolic parameters in adolescents with obesity and fatty liver disease [13], enhance glucose and lipid metabolism in T2DM [14], and decrease serum levels of TNF-α, IL-1β, IL-6, and MCP-1 [15].
Achieving an optimal n-6:n-3 ratio remains challenging due to modern dietary patterns, particularly the widespread consumption of processed foods and cooking oils rich in n-6 fatty acids. This imbalance is compounded by the limited intake of n-3-rich sources such as fish, flaxseeds, and nuts [11,16,17]. Nonetheless, several studies have demonstrated that dietary interventions aiming to achieve a 5:1 n-6:n-3 ratio can attenuate the adverse metabolic and inflammatory effects associated with an excessive intake of n-6 fatty acids [18]. This raises the following research question: Can a dietary n-6:n-3 PUFA ratio of 5:1 improve metabolic parameters and modulate the expression of genes related to inflammation and antioxidant activity in a murine model of diet-induced obesity? Therefore, the aim of this study was to evaluate the impact of a diet with an n-6:n-3 PUFA ratio of 5:1 on body composition, biochemical parameters, cytokines levels, and antioxidant enzyme expression in a murine model of diet-induced obesity compared with a diet with an n-6:n-3 PUFA ratio of 30:1.
We hypothesized that this dietary ratio would improve metabolic profiles, accompanied by reduced inflammation and oxidative stress through the regulation of key molecular pathways. To our knowledge, few studies have assessed these specific ratios in an obesity model focusing on gene expression in adipose tissue.

2. Materials and Methods

2.1. Animals and Groups

For this study, male C57BL/6J mice, aged 5–6 weeks and weighing 20–25 g, were obtained from the Institute of Neurobiology at the Universidad Autónoma de México (Mexico City, Mexico). The mice were housed in groups of five per cage in a temperature- and humidity-controlled room, under a 12 h light/dark cycle, with access to standard chow and water ad libitum. After one week of acclimatization, the animals were randomly assigned to two equal groups. The first group (n = 10, control) was fed a standard diet (D12450H, Research Diets, New Brunswick, NJ, USA) consisting of 10% lipids, 70% carbohydrates, and 20% protein. The second group (HFD 30:1, n = 15) received a customized high-fat diet (D21022504, Research Diets, based on the D12451 formula), which contained 45% lipids, 35% carbohydrates, and 20% protein. The HFD 30:1 diet represents a Westernized dietary pattern, characterized by a high n-6 to n-3 fatty acid ratio of 30:1. After 17 weeks of feeding, five mice from each group were sacrificed to collect blood and adipose tissue samples for model validation. The remaining HFD-fed mice were subdivided into two groups: one continued on an HFD-30:1 diet, while the other was switched to the HFD-5:1 formulation. Mice in the control group continued on the control diet for an additional 8 weeks. Euthanasia was performed using a carbon dioxide chamber with a flow rate of 20% of the chamber volume per min until a CO2 concentration of 70% was reached, ensuring rapid loss of consciousness.

2.2. Diets

The HFD-5:1 (D21022505) and the HFD-30:1 (D21022504) diets were formulated by the research team to optimize macronutrient distribution and ensure a precise n-3 fatty acid content in each formulation. These two high-fat diets with differing n-3 contents, along with the control diet (D12450H), were ordered from Research Diet, Inc. (New Brunswick, NJ, USA). Table 1 presents the ingredients, macronutrient distribution (kcal/g), and n-6:n-3 ratio of each diet.

2.3. Fasting Glucose and Insulin Tolerance Test (ITT)

Mice were fasted for 4 h before the procedure. A small distal incision was made in the tail to obtain blood samples. Glucose levels were measured at week 17 and at the end of the 8-week intervention using a glucometer (ACCU-CHEK Active, Roche, Mannheim, Germany). The insulin tolerance test (ITT) was performed at 0, 15, 30, 45, 60, 75, and 90 min following intraperitoneal injection of insulin (1 U/kg body weight) diluted in 0.9% saline solution. The area under the curve (AUC) was calculated using the trapezoidal method for each experimental group.

2.4. Serum Biochemistry Analysis

Plasma and collected tissues were immediately snap-frozen and stored at −80 °C until analysis. Blood samples were collected after a 4–6-h fasting period to measure triglycerides and total cholesterol using a standard clinical analyzer (Vitros 350, Ortho Clinical Diagnostics, Raritan, NJ, USA) according to the manufacturer’s protocol.

2.5. Analysis of Gene Expression by Quantitative Real-Time PCR

Adipose tissue samples were ground using a POLYTRON® PT 2500 E (Kinematica, Malters, Switzerland) and subsequently homogenized in TRIzol® reagent (Invitrogen, Carlsbad, CA, USA). Total RNA was isolated from 100 mg of cold-homogenized adipose tissue. After incubation on ice, chloroform was added, and the sample was mixed manually and vortexed. The aqueous phase was extracted and precipitated with isopropanol, followed by incubation and centrifugation. The sample was washed with 75% ethanol, the ethanol was removed, and the pellet was resuspended in 0.1% DEPC-treated water. The RNA concentration and purity were assessed using a MultiScan Sky spectrophotometer (Thermo Fisher Scientific®, Waltham, MA, USA). RNA integrity was evaluated in 1% agarose gel electrophoresis.
Complementary DNA (cDNA) was synthesized using 2 μL of total RNA (500 ng/μL). M-MLV reverse transcriptase (Invitrogen™, Carlsbad, CA, USA) was used under the following conditions: incubation at 25 °C for 10 min, followed by reverse transcription at 37 °C for 60 min. The enzyme was subsequently inactivated by heating the mixture to 95 °C for 10 min. Synthesized cDNA was stored at −80 °C until further use.
qPCR was performed using TaqMan probes (2×) according to the manufacturer’s instructions. Gene expression analysis included markers associated with inflammation (Il1a, Il1b, Il4, Il6, Il10, Il13, Tnfa, Ccl2, Tgfb1, Ifng) and with the antioxidant system (Gpx1, Sod1, Cat). The catalog numbers and Assay IDs of each TaqMan probe used are detailed in Supplementary Table S1.
All samples were run in duplicate and normalized to the housekeeping gene Eif3f (Cat. No. 4448490; Assay ID: Mm00517953_m1). Quantification of target gene expression was performed on a LightCycler® 96 instrument (Roche, Mannheim, Germany) using the following cycling conditions: initial incubation at 50 °C for 2 min, followed by 40 cycles of 95 °C for 15 s and 60 °C for 60 s. The reaction mixture consisted of 1 μL of molecular biology-grade water, 2.5 μL of FastStart Essential DNA Probes Master Mix (TaqMan® Universal PCR, 1×), 0.5 μL of TaqMan® probe (2×), and 1 μL of cDNA. Relative gene expression levels were calculated using the 2−∆Cq method [19].

2.6. Statistical Analysis

All data were assessed for normality using the Shapiro–Wilk test to determine the appropriate statistical tests for subsequent analyses. Comparisons between two independent experimental groups were performed using either the unpaired Student’s t-test (for normally distributed data) or the Mann–Whitney U test (for non-normally distributed data), to assess differences in central tendency. For comparisons involving more than two groups, one-way analysis of variance (ANOVA) was used when parametric assumptions were met, followed by Bonferroni’s post hoc test to assess pairwise differences. When data did not meet parametric assumptions, the Kruskal–Wallis test was applied as a non-parametric alternative, followed by Dunn’s post hoc test for multiple comparisons. To correct for multiple testing, a Bonferroni adjustment was applied for five comparisons, resulting in an adjusted significance threshold of p < 0.05. All statistical analyses were conducted using GraphPad Prism version 8. Data are presented as the mean ± standard deviation (SD), unless otherwise specified. A p-value < 0.05 was considered statistically significant.

3. Results

3.1. Impact of n-6:n-3 Fatty Acid Ratios on Body Weight Progression, Tissue Weights, Cytokine Expression, and Antioxidant Enzyme Profiles

From the first week of the experiment, animals were divided into two groups and fed either a control diet or a high-fat diet (HFD). Body weight was monitored in both groups over 17-week period. At the end of the obesity induction period, HFD-fed animals exhibited a 27% increase in body weight compared to the control group (p < 0.0001; Figure S1). Additionally, increased weights of epididymal adipose tissue (p = 0.001) and liver (p = 0.005) and an increased relative liver weight (p = 0.039) were observed (Table S2), confirming the successful establishment of the obesity model. In this model, the HFD group exhibited significantly higher levels of triglycerides (Figure S2A), cholesterol (Figure S2B), and glucose (Figure S2C) compared to the control group (p = 0.0104).
Cytokine expression profiling in adipose tissue revealed elevated mRNA levels of Il1a, Il1b, Il4, Il6, Il10, Tgfb1, and Il13 in the HDF-30:1 group compared to the control group (Figure S3A–E,H,I). Although expression levels of Tnfa and Ccl2 were evaluated in HFD-30:1 mice, the differences did not reach statistical significance (Figure S3F,G). No significant differences were observed in the expression of antioxidant-related genes (Gpx1, Sod1, and Cat) (Figure S4A–C).

3.2. Effect of the 8-Week Dietary Intervention with HFD-5:1

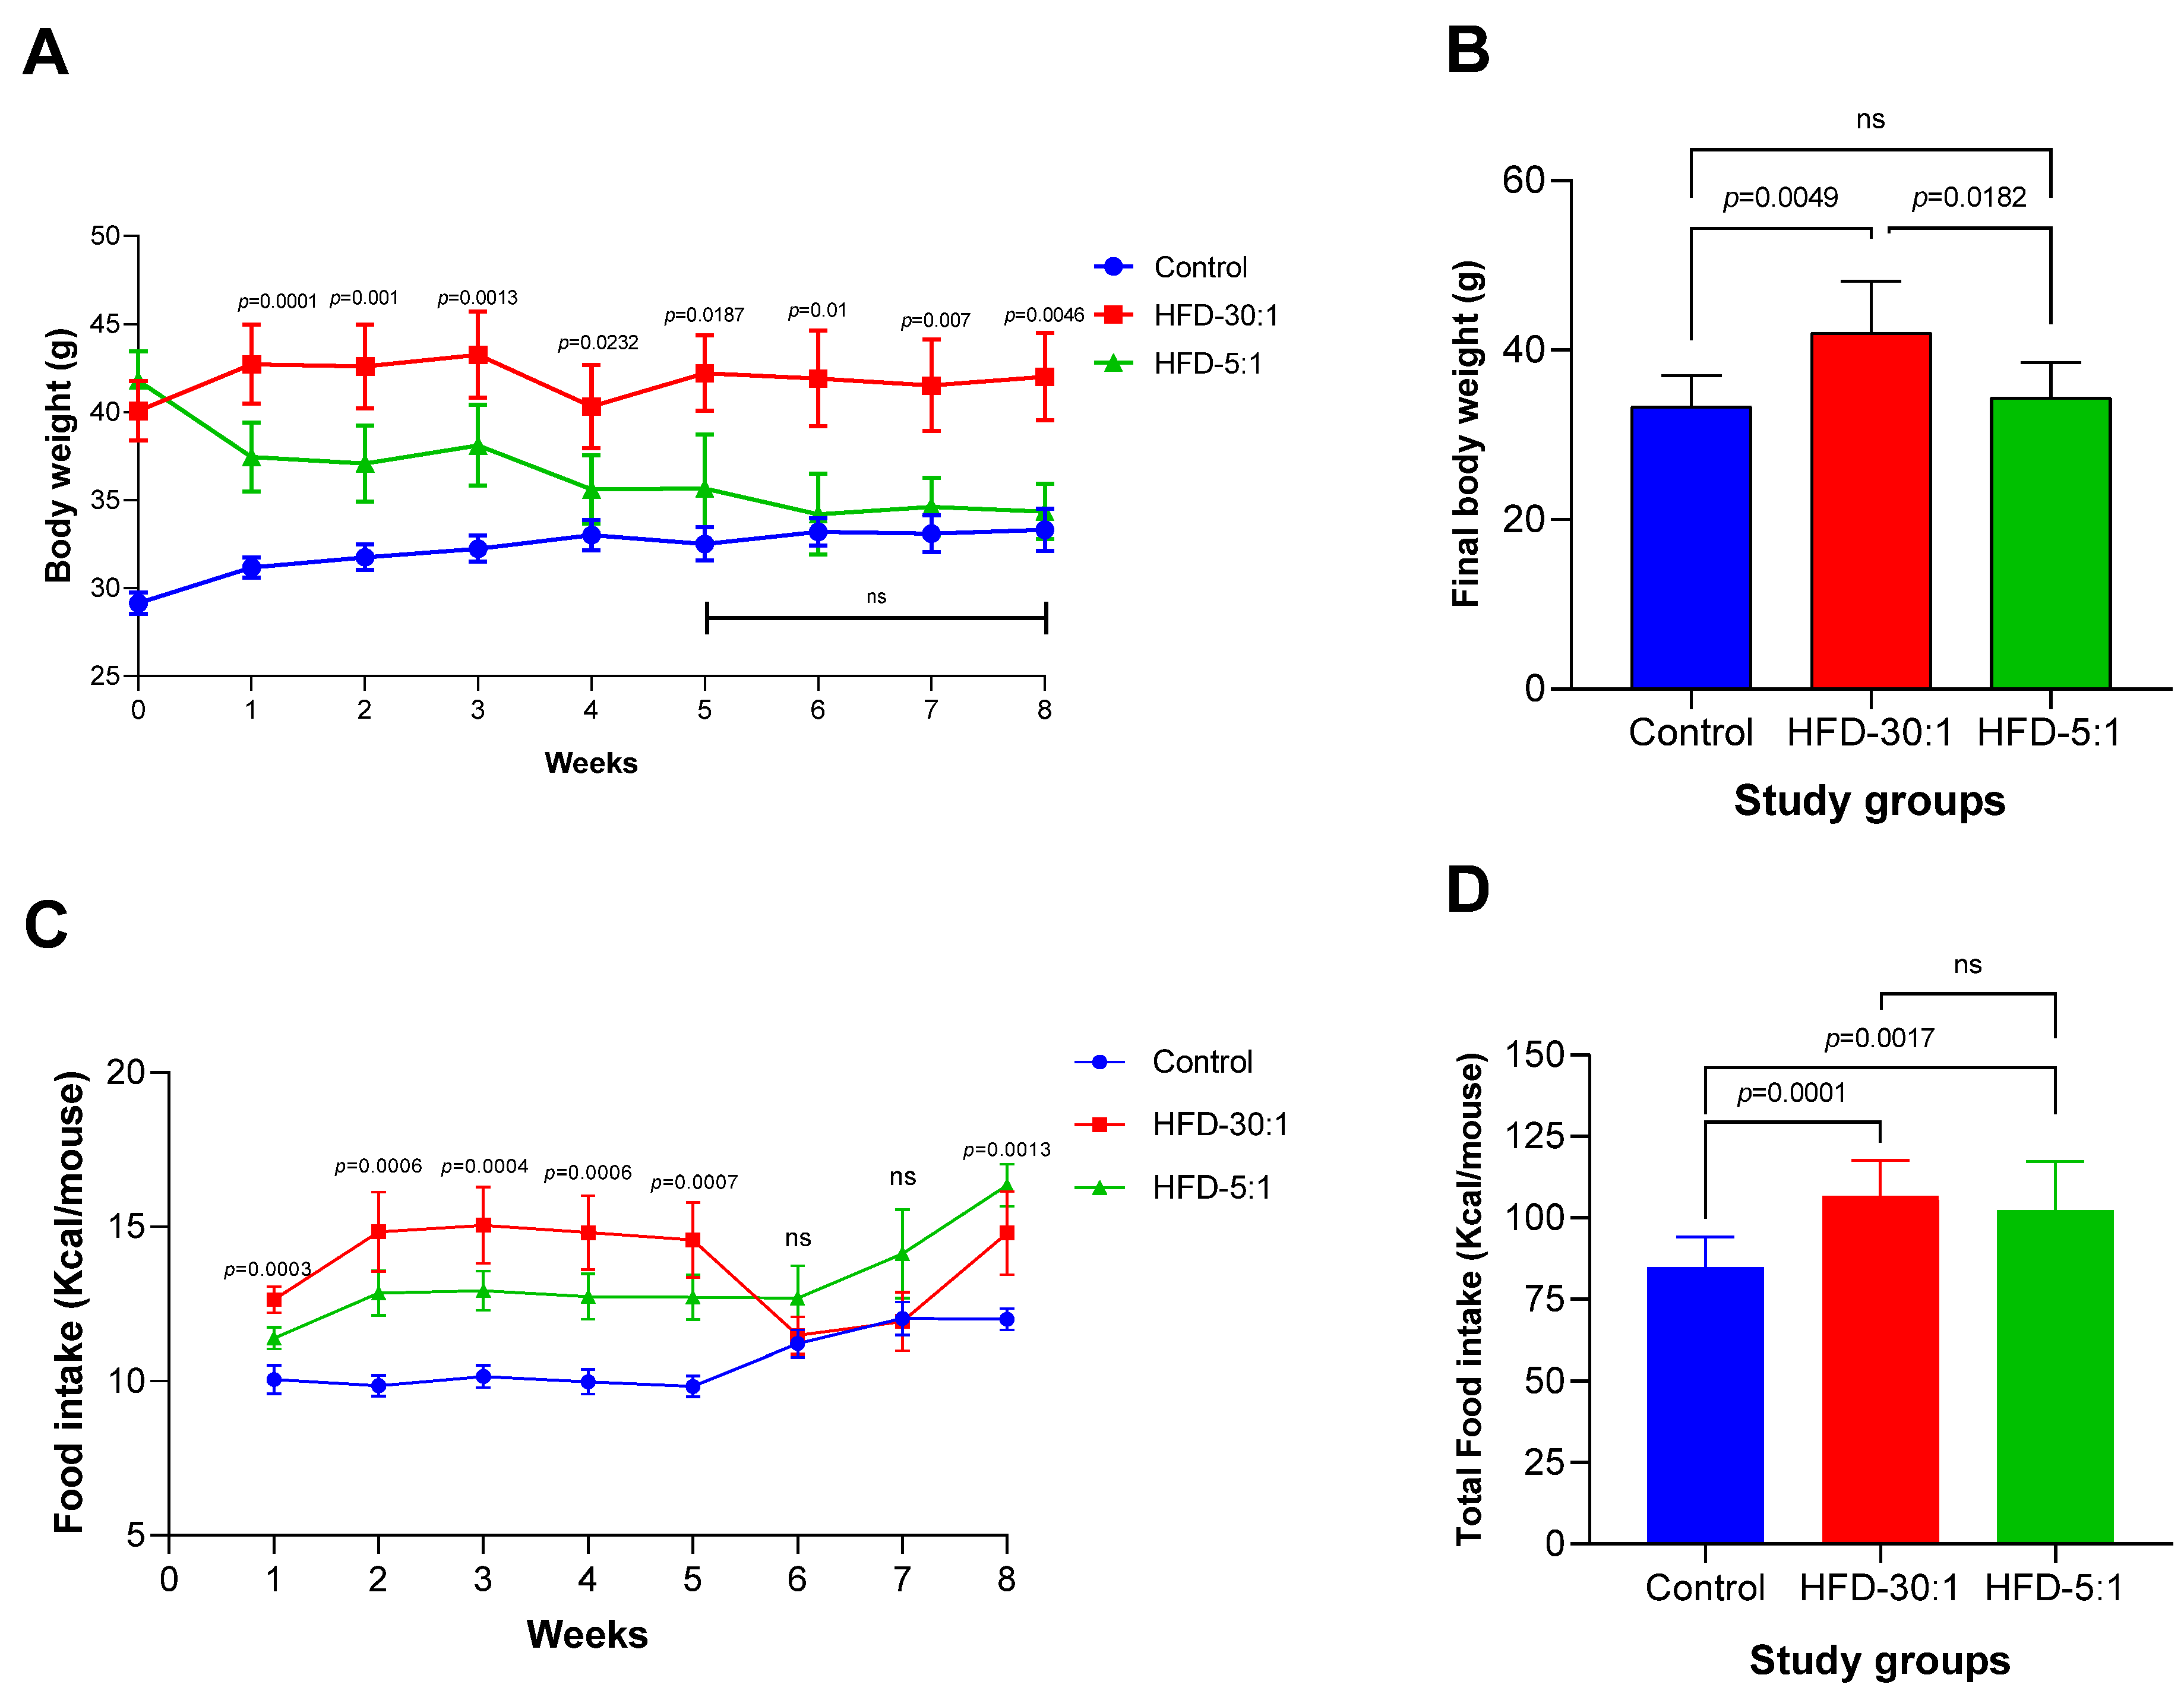
3.2.1. Body Weight and Caloric Intake

After confirming the establishment of the obesity model, body weight was monitored throughout the 8-week intervention period in the three study groups (Figure 1A). At the end of the 8-week treatment, a significant reduction in body weight was observed in the HFD-5:1 group compared to the HFD-30:1 group; body weight in the HFD-5:1 group decreased to levels similar to those of the control group (Figure 1B). To assess whether these results were influenced by caloric intake, food consumption was evaluated. However, no significant differences in food intake were observed between the two HFD groups (Figure 1C,D).
Upon completion of the 8-week intervention, no significant differences were observed in epididymal adipose tissue among the groups (p = 0.4). However, consistent with the reduction in body weight (Figure 1B), the group receiving the 5:1 n-6:n-3 PUFA intervention exhibited a significant decrease in both absolute and relative liver weights (Table 2).

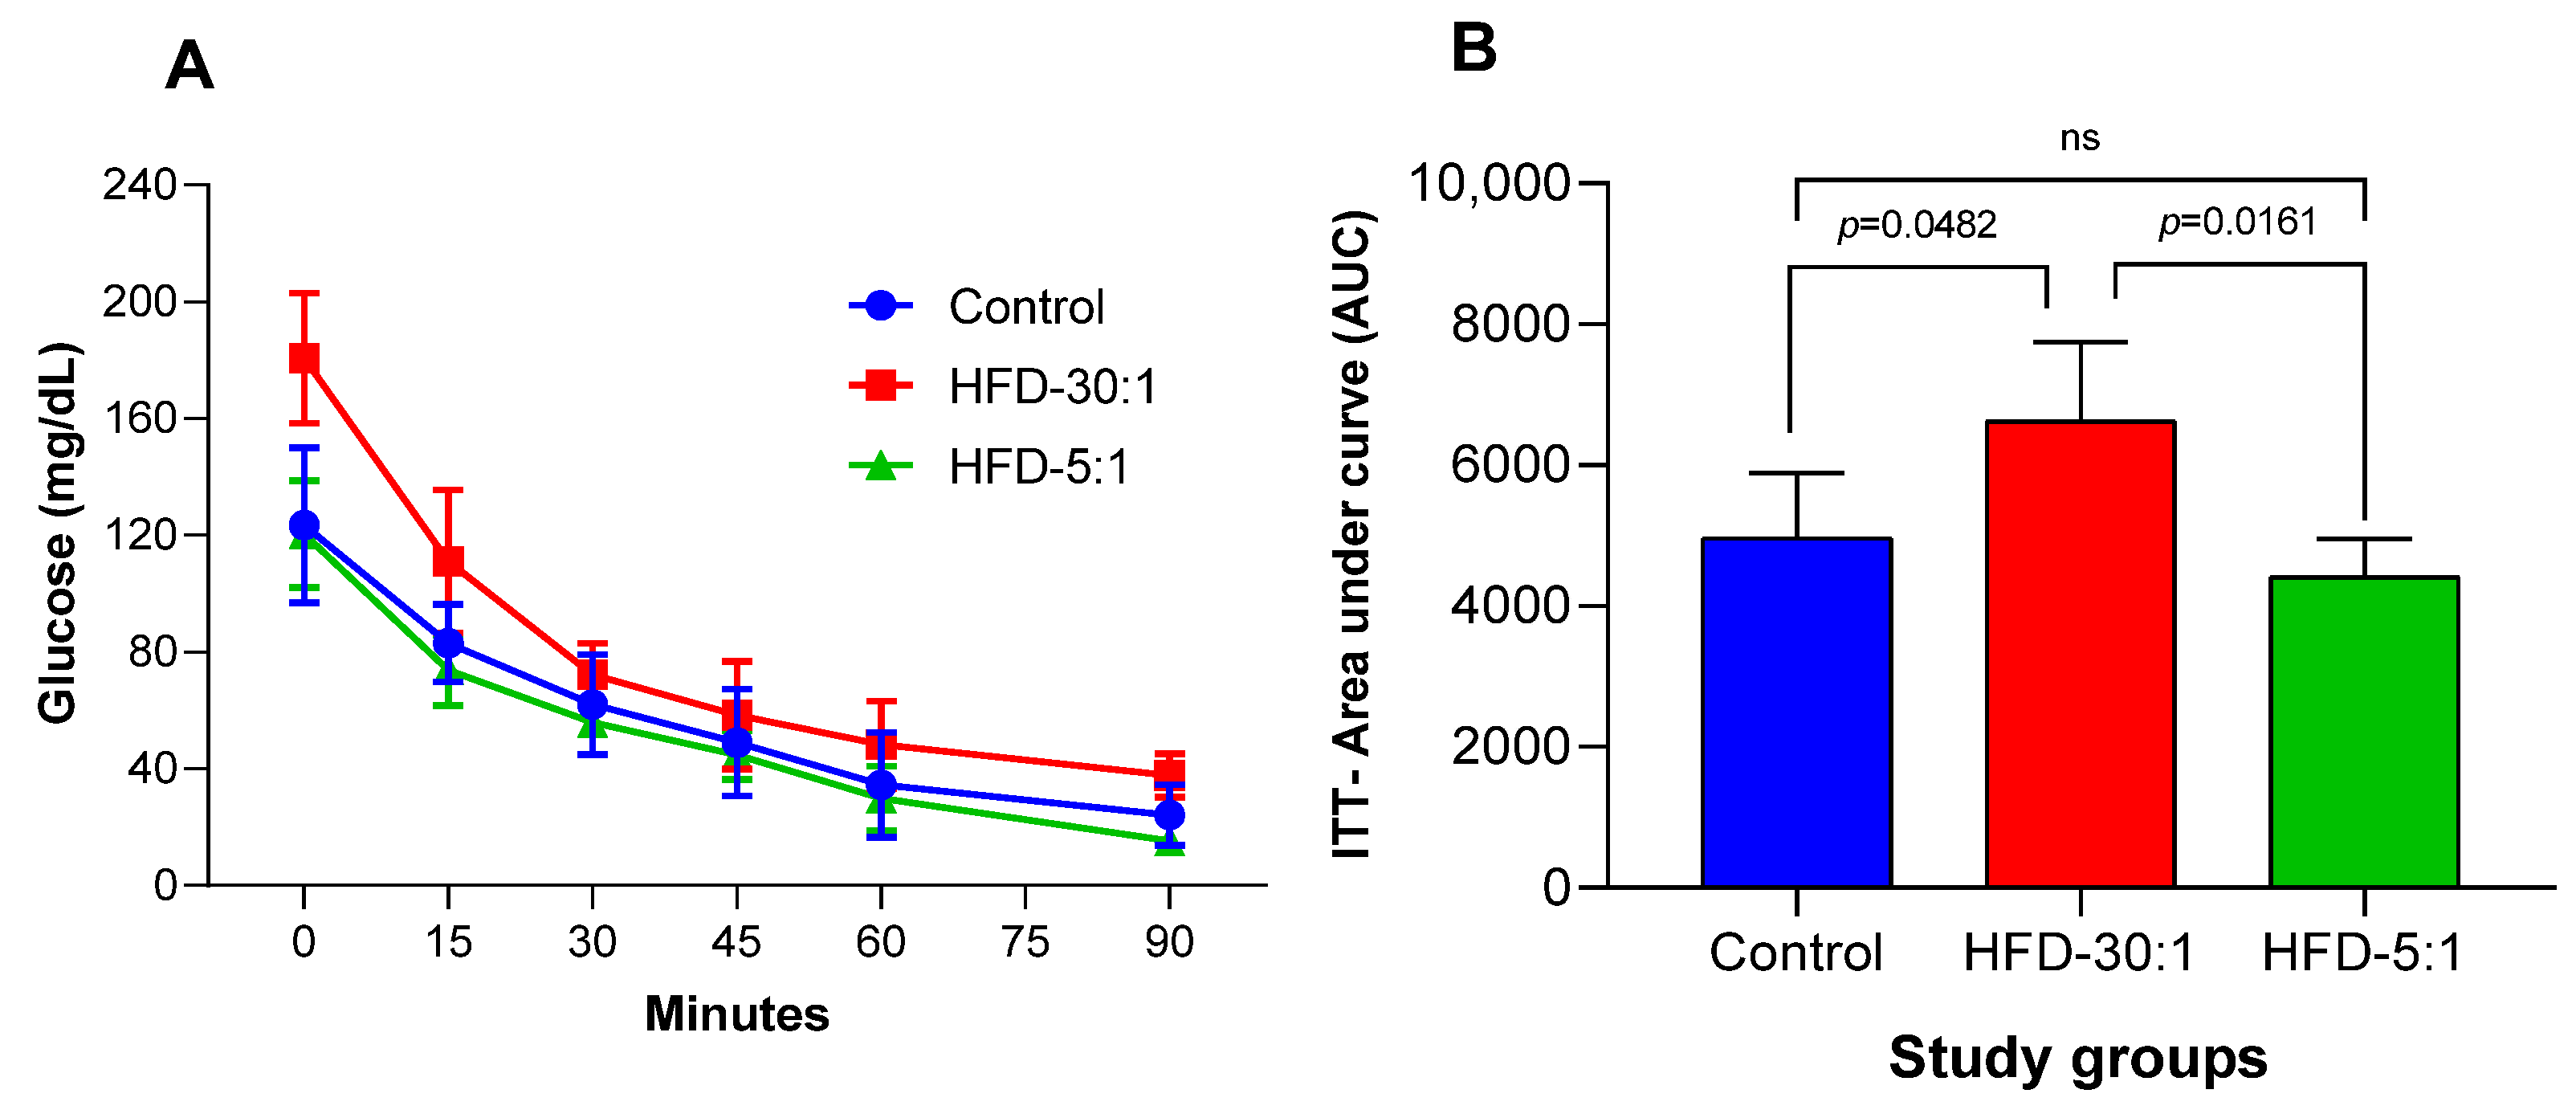
3.2.2. Insulin Tolerance Test (ITT)

The ITT was conducted to calculate the area under the curve (AUC) for glucose, with samples collected every 15 min over a 90 min period (at 0, 15, 30, 45, 60, and 90 min). A significant reduction in glucose AUC was observed in the HDF-5:1 group, reaching levels lower than those of the control group, as shown in Figure 2A,B.

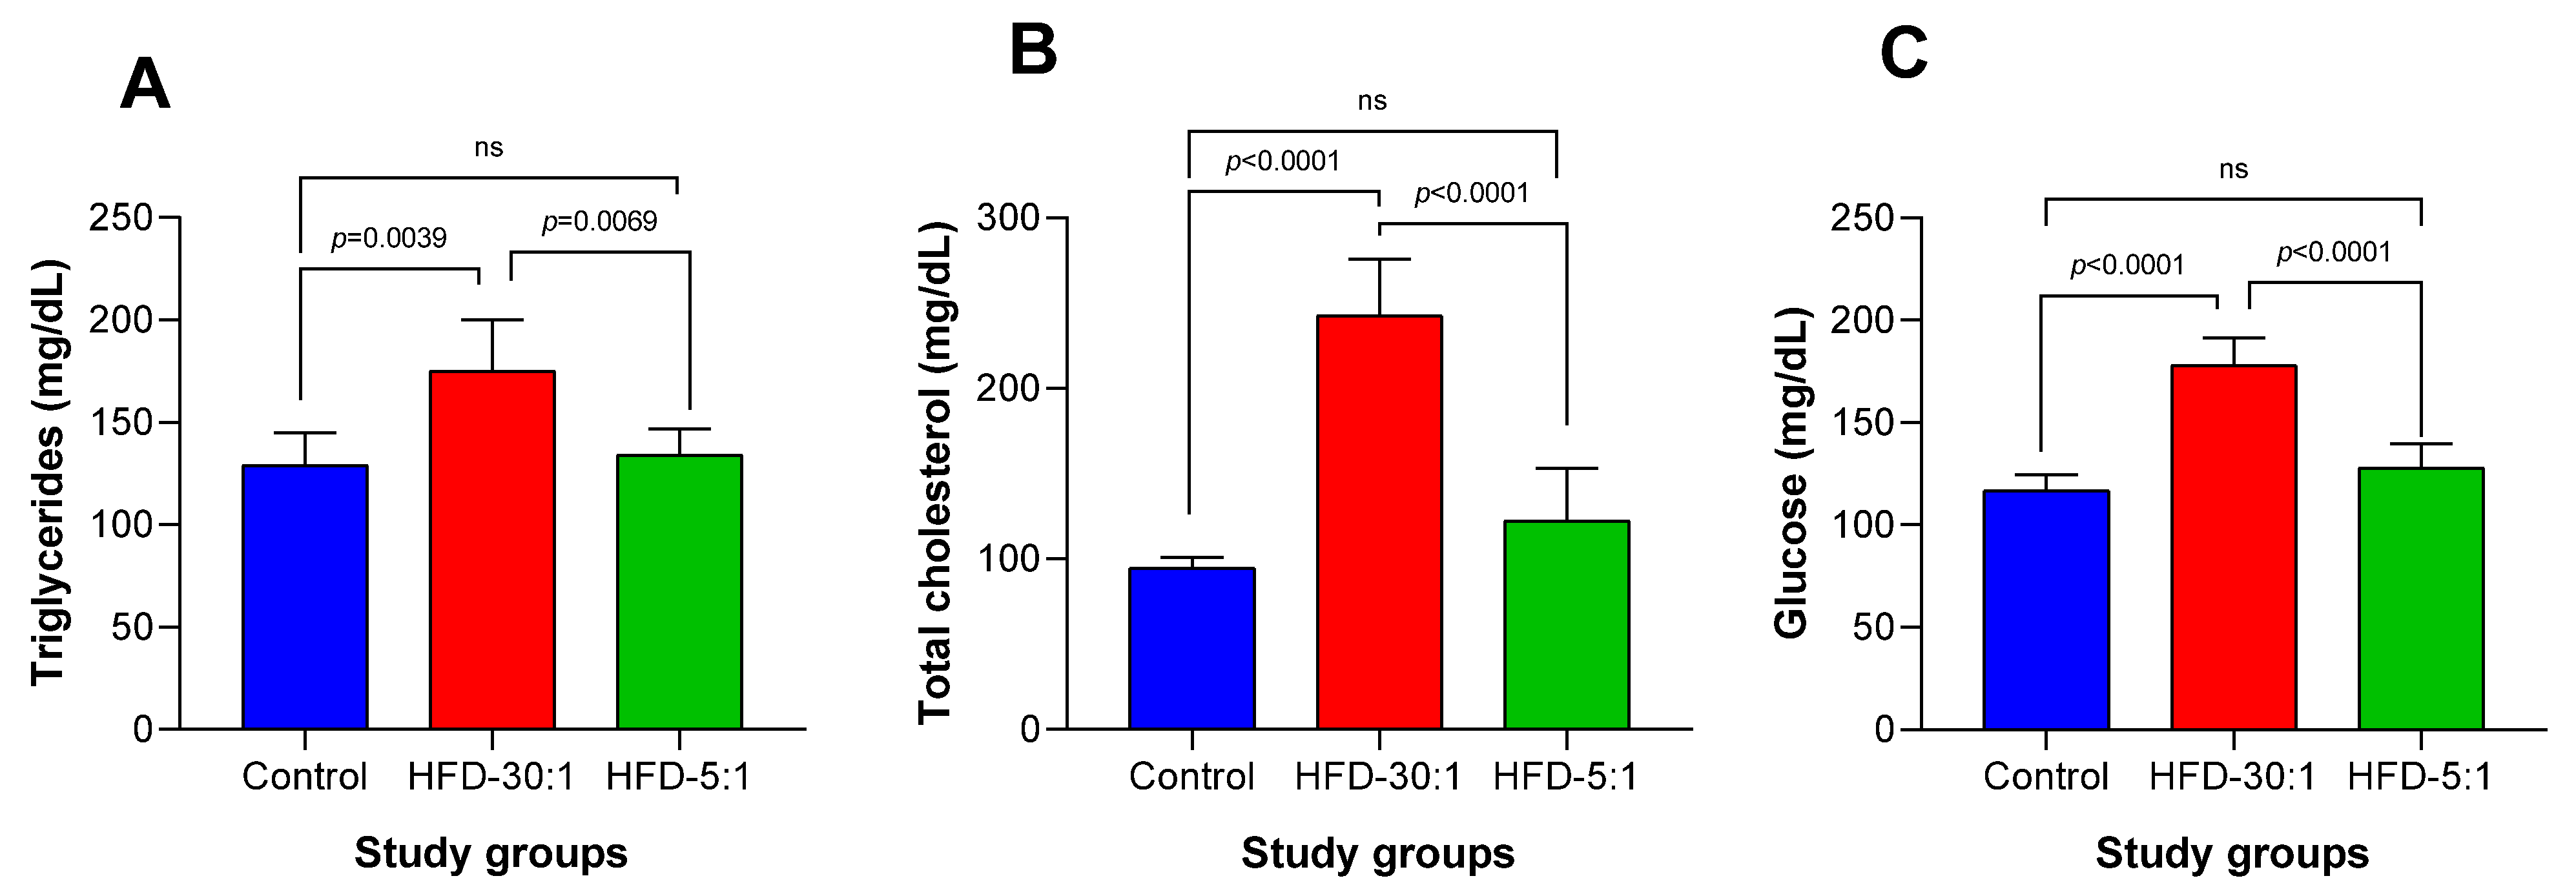
3.2.3. Biochemical Parameters

Biochemical parameters (glucose, triglycerides, and total cholesterol) were significantly reduced in the HDF-5:1 group compared to the HFD-30:1 group (Figure 3). No significant differences were observed between the HFD-5:1 and control groups.

3.2.4. Cytokine Expression Profile

The expression assays highlighted distinct gene expression patterns between the control and HFD groups. Markers showing significant differences between the control and HFD-30:1 groups included Il1a, Il6, Il10, Tnfa, Ccl2, and Tgfb1 (Figure 4A–F). In contrast, no significant differences were observed for Il13, Ifng, Il4, and Il1b between the control group and either of the obesity groups (HFD-30:1 or HFD-5:1) (Figure 4G–J).
Among the obesity groups, significant differences in Ccl2 and Tgfb1 expression were found between the HFD-30:1 and HFD-5:1 groups (Figure 4E,F). Additionally, Ccl2 and Tgfb1 expression levels in the HFD-5:1 group approached those observed in the control group, suggesting a modulation of these markers toward baseline levels under the modified dietary regimen (Figure 4E,F). Furthermore, Ifng expression was undetectable in the control group but was present in both HFD groups (HFD-30:1 and HFD-5:1), indicating a specific response to high-fat dietary conditions (Figure 4H).

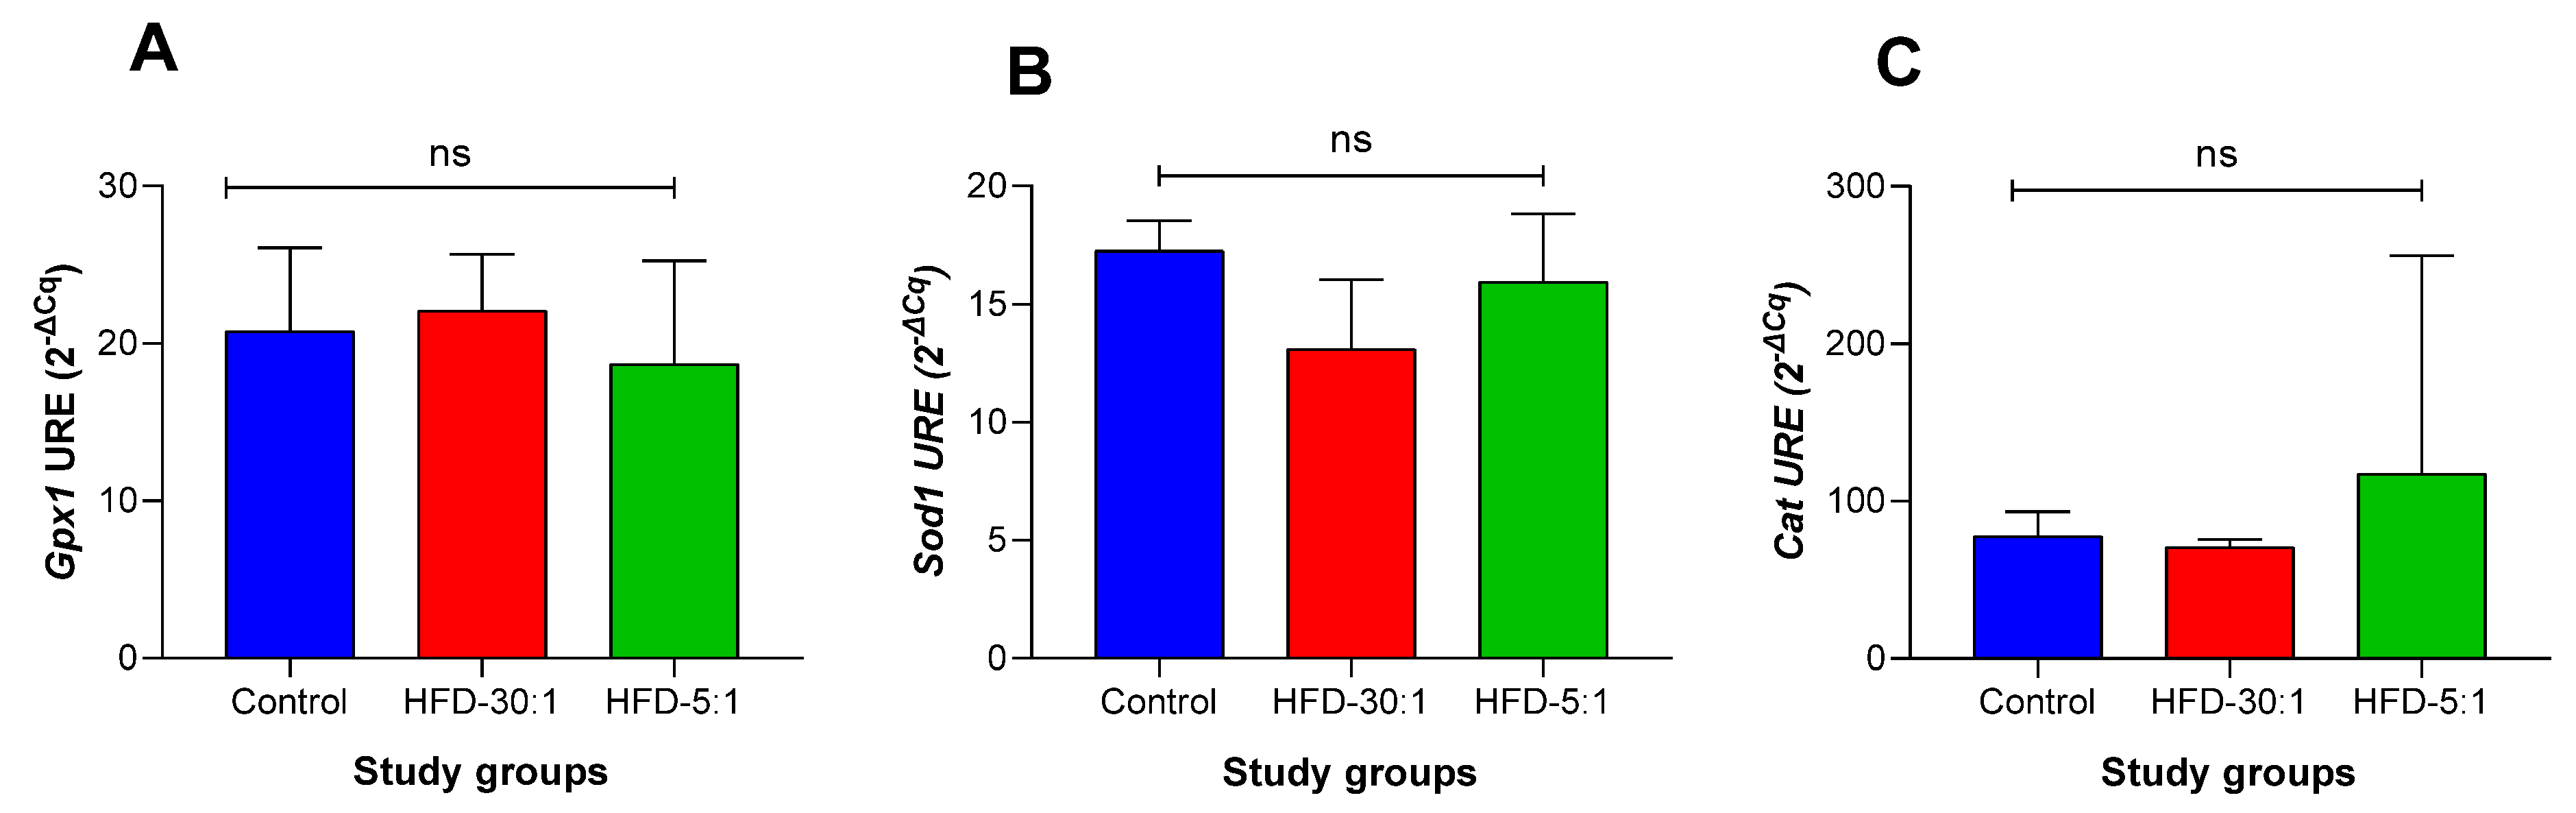
3.2.5. Antioxidant Gene Expression Profile

The expression analysis revealed no statistically significant differences in antioxidant gene expression (Gpx1, Sod1, and Cat) among the groups (Figure 5).

4. Discussion

Obesity is a major public health concern, affecting a significant proportion of the population and increasing the risk of type 2 diabetes mellitus, cardiovascular disease, and certain types of cancer [20]. In experimental research, diet-induced obesity models that simulate a Westernized dietary pattern in murine models are widely used to investigate mechanisms of weight gain and disruptions in insulin, lipid, and glucose metabolism [21,22]. In this study, a diet-induced obesity model was first established using two groups: a control and an HFD-30:1 group. After 17 weeks, the diet was modified to assess the effect of changing the polyunsaturated fatty acid (PUFA) ratio (n-6:n-3). This approach allowed us to directly evaluate the impact of reducing the dietary n-6:n-3 ratio on obesity-related metabolic and inflammatory outcomes.
The model successfully induced obesity, as evidenced by a 27% increase in body weight in the HFD-30:1 group compared to the control, along with a significantly higher epididymal adipose tissue mass, liver weight, and relative liver weight. These findings align with previous studies showing body and liver weight increases resulting from prolonged high-fat-diet consumption [23,24]. These anatomical changes emphasize not only the quantity but also the quality of dietary lipids, as an association was observed between lipid composition and tissue hypertrophy. This hypertrophy, in turn, contributes to disease development and multiple-organ dysfunction [25]. Importantly, the second phase of the experiment allowed us to explore the effects of changing the n-6:n-3 ratio from 30:1 to 5:1, isolating the role of lipid composition independent of caloric intake in modulating metabolic and inflammatory parameters.
In addition to the anatomical changes described above, significantly higher serum levels of triglycerides, cholesterol, and glucose were observed in the HFD-30:1 group compared to the control group at week 17. These metabolic alterations are typically associated with obesity and may be linked to adipose tissue expansion and dysfunction in response to the HFD-30:1. This dysfunction can promote the release of free fatty acids from adipocytes to the liver, leading to the formation of VLDL lipoproteins. In the murine model, this was reflected in elevated concentrations of cholesterol and triglycerides, as well as alterations in glucose homeostasis [21,26,27,28].
Moreover, this dietary pattern has been strongly associated with metabolic dysregulation through the promotion of an inflammatory environment related to insulin resistance. This occurs via interactions with the immune system, such as the release of chemokines and the recruitment of monocytes that polarize into classically activated M1 macrophages, along with the infiltration of granulocytes, lymphocytes, especially CD4+ Th1 cells and CD8+ T cells, and NK cells. All these events contribute to the establishment of low-grade inflammation [29,30,31].
In agreement, the first phase of this study highlighted changes in cytokine gene expression. In this sense, elevated expression levels of genes encoding both pro- and anti-inflammatory cytokines such as Il1a, Il6, Il10, Tgfb1, and Il13 in the HFD-30:1 group compared with the control group emphasize the inflammatory state induced by the high-fat diet. This chronic inflammation is a well-known contributor to the pathogenesis of obesity and its complications [32].
Notably, the Ifng gene, which encodes another pro-inflammatory cytokine, was not expressed in the control group, suggesting that its expression is specifically induced by high-fat dietary conditions, particularly those rich in saturated fatty acids like palmitic acid. It has been reported that high-fat diets upregulate the expression of Tlr2, Stat1, and Irf1, which are transcription factors that enhance the expression of genes such as Ifng. Therefore, the observed expression of Ifng could be explained through this mechanism [33,34].
IFN-γ is known for its critical role in mediating inflammation and the activation of immune cells, particularly in the context of autoimmune diseases and infections [35,36]. In obesity, IFN-γ may contribute to the chronic inflammation characteristic of this condition, promoting insulin resistance and the development of metabolic comorbidities. IFN-γ stimulates macrophage polarization toward the M1 phenotype, which is pro-inflammatory and produces TNF-α, IL-6, and other cytokines. IFN-γ-induced inflammation contributes to insulin resistance by interfering with insulin signaling in adipocytes, hepatocytes, and skeletal muscle [37]. The specificity of Ifng expression under high-fat dietary conditions highlights the importance of an adequate dietary lipid intake to reduce its overexpression and suggests that IFN-γ may serve as a sensitive marker for diet-induced inflammation and as a potential therapeutic target.
Conversely, weight gain and dyslipidemia have been associated with a reduction in antioxidant enzyme activity. Obesity induced by a high-fat diet is accompanied by elevated oxidative stress in hepatic, cardiac, and renal tissues, characterized by a marked decrease in antioxidant enzyme activity [38]. Some studies have reported downregulation of Sod1 and Cat genes in C57BL/6J male mice fed high-calorie diets, which increases oxidative stress in obesity [39]. In our study, no significant differences were observed in the expression of antioxidant enzymes (Gpx1, Sod1, Cat), consistent with findings reported by other authors [38]. However, other studies have reported such differences, possibly due to variations in the composition of the high-fat diet (HFD), particularly higher proportions of lard. This suggests that an increased intake of saturated fat sources may modulate hepatic antioxidant enzyme expression. These discrepancies may therefore be attributable to differences in dietary fat composition [40].
In the second phase of this study, HFD-fed mice were subdivided into two groups—HFD-30:1 and HFD-5:1—based on an 8-week dietary intervention aimed at modifying the n-6:n-3 PUFA ratio. A significant reduction in body weight was observed in the HFD-5:1 group compared to the HFD-30:1 group at the end of the 8-week period, which weights comparable to those of the control group. This underscores the importance of nutrient quality, as all groups had similar energy intakes, yet the HFD-5:1 group showed improved outcomes. Therefore, it is possible to achieve weight loss through a lipid-modified diet, supporting its potential relevance for translational research into dietary lipid modulation.
In addition to weight reduction, the HFD-5:1 group demonstrated improved biochemical parameters, including lower fasting glucose, triglyceride, and total cholesterol levels, which were comparable to those in the control group. These metabolic improvements were paralleled by enhanced insulin sensitivity, as evidenced by a reduced AUC in the ITT. This reflects better insulin sensitivity in the HFD-5:1 group compared to the HFD-30:1 group. Mechanistically, n-3 PUFA derivatives, particularly DHA, have been shown to activate GPR120, a G-protein-coupled receptor expressed in adipose tissue and macrophages. GPR120 activation enhances GLUT4 translocation and facilitates glucose uptake in adipocytes, contributing to improved insulin sensitivity [41].
Regarding triglyceride reduction, the proposed mechanisms include an inhibition of diacylglycerol acyltransferase (DGAT), the primary enzyme responsible for triglyceride synthesis in the liver. N-3 PUFAs also reduce de novo lipogenesis by inhibiting the transcription of the SREBP1c gene, which encodes a transcription factor that regulates genes involved in cholesterol, fatty acid, and triglyceride synthesis [42,43,44,45].
A previous study investigated the effects of n-6:n-3 ratios, such as 1:1 and 5:1 in T2DM models using plant-based n-3 sources (chia seed, palm, peanut, olive oil) over an 8-week period. The study found that a 5:1 ratio significantly reduced total cholesterol and fasting glucose by 23.84% and 20.6%, respectively (p < 0.05) [14].
In contrast, our study observed even greater reductions in total cholesterol (49.61%) and fasting glucose (28.20%) under the same 5:1 ratio. This may be due to the source of fatty acids: while the previous study used plant-based ALA-rich oils, our HFD-5:1 diet included menhaden oil, a marine-derived fat rich in eicosapentaenoic acid (EPA) and docosahexaenoic acid (DHA), unlike safflower oil, which primarily contains n-6 linoleic acid. EPA and DHA exhibit stronger lipid-lowering, anti-inflammatory, and insulin-sensitizing effects than ALA, due to their direct incorporation into membranes and modulation of genes involved in lipid metabolism [46].
In terms of cholesterol reduction, n-3 PUFA may decrease VLDL particle assembly in hepatocytes and reduce their secretion. This occurs via increased degradation of ApoB, the main protein necessary for VLDL assembly and secretion. Additionally, ALA promotes the conversion of cholesterol into bile acids through the action CYP7A1, enhancing cholesterol excretion [47,48].
Some human studies have shown that dietary cholesterol influences circulating LDL cholesterol levels. When relevant variables are controlled, modifying dietary cholesterol leads to significant increases in LDL. However, replacing saturated fats with unsaturated fats, especially polyunsaturated fats, consistently lowers total and LDL cholesterol and reduces cardiovascular risk [49]. In our study, the HFD-5:1 group consumed menhaden oil (rich in EPA/DHA), while the HFD-30:1 group received safflower oil (higher in saturated fat and n-6 PUFA). Interestingly, despite the HFD-5:1 group having a higher total dietary cholesterol content, their serum cholesterol was significantly lower. This underscores the importance of the fat source and type over the absolute cholesterol content in determining lipid metabolism and cardiovascular risk.
The greater metabolic benefits observed in the HFD-5:1 group likely reflect the higher EPA/DHA content of marine-derived n-3 sources. In contrast, plant-based n-3 (ALA) must be converted to EPA/DHA, and only 9% is converted in humans [50]. This highlights the differences in effectiveness between marine and seed oil-based PUFA sources.
Cytokines can be pro-inflammatory or anti-inflammatory. Pro-inflammatory cytokines (e.g., TNF-α, IL-1β, IL-6, MCP-1) contribute to metabolic disorders such as obesity and diabetes. Anti-inflammatory cytokines (e.g., TGF-β, IL-13) aim to counter this state, but may also play dual roles. Cytokines are secreted by a variety of immune cells, such as IL-1α from neutrophils and macrophages, and IL-10 from dendritic cells and NK cells. Immunomodulation of these molecules is a promising therapeutic strategy [51].
In this context, Van, R. et al. (2015) [32] reported higher expression of Il1b, Il6, and Il10 in mice fed an HFD vs. low-fat diet for 24 weeks. Ji, Y. et al. (2012) also found increased Il4 expression in adipose tissue from HFD-fed mice, possibly as a compensatory anti-inflammatory response [52].
In our study, significant differences in Ccl2 and Tgfb1 were observed between the HFD-30:1 and HFD-5:1 groups, with the HFD-5:1 group showing reduced levels, approaching those of the control group. This suggests a reduced pro-inflammatory state, highlighting the relevance of the PUFA composition in modulating immune responses in obesity. A favorable n-6:n-3 ratio (i.e., higher n-3 availability) may reduce the activation of inflammatory pathways and the release of pro-inflammatory metabolites [50]. It has also been reported that an HFD increases regulatory T cells to suppress adipose inflammation, potentially explaining the higher Tgfb1 levels in the HFD group [53].
Additionally, immune cell infiltration into adipose tissue promotes the upregulation of MCP-1 and other pro-inflammatory cytokines. However, n-3 PUFA metabolites may suppress cytokine expression by inhibiting PKCα and PKCε, disrupting NF-kB translocation and mitigating inflammation through interruption in this signaling pathway [54].
In this sense, anti-inflammatory mechanisms of EPA and DHA include alterations in cell membrane phospholipid composition, disruption of lipid rafts, inhibition of the activation of pro-inflammatory transcription factors such as NFκB—thereby reducing the expression of inflammatory genes—and activation of the anti-inflammatory transcription factor peroxisome proliferator-activated receptor γ (PPARγ). These fatty acids are capable of partially inhibiting many aspects of inflammation, including leukocyte chemotaxis, adhesion molecule expression, leukocyte–endothelial adhesive interactions, and production of eicosanoids such as prostaglandins and leukotrienes derived from n-6 fatty acids. Moreover, EPA and DHA give rise to resolvins, and DHA also generates protectins and maresins, which are lipid mediators involved in the resolution of inflammation. Thus, the quantity, composition, and type of polyunsaturated fatty acids present in inflammatory cells significantly influence the function of these cells [55,56,57].
Regarding the effects of the HFD-5:1 diet on the expression of antioxidant enzyme genes, no statistically significant differences were observed among the groups. Although direct changes in gene expression were not detected, previous studies have shown that n-3 PUFAs can modulate transcription factors such as Nrf2, which regulates the expression of antioxidant enzymes and exerts cytoprotective effects against oxidative stress induced by hydrogen peroxide H2O2 [12]. Another study has reported changes in the enzymatic activity of antioxidant defenses following treatment with EPA and DHA [58]. These findings suggest that the antioxidant effects of n-3 PUFAs may occur through activation of the Nrf2 pathway or via post-transcriptional mechanisms.
Given the central role of Nrf2 in regulating the antioxidant response, it would be relevant for future research to analyze its expression and activation, including nuclear localization and potential post-translational modifications. Additionally, epigenetic or post-transcriptional regulatory mechanisms, such as promoter methylation of antioxidant genes or modulation by microRNAs, could influence gene translation without altering mRNA expression levels.
Furthermore, assessing oxidative stress markers, such as levels of reactive oxygen species (ROS), lipid peroxidation, or DNA damage, in future projects would help determine whether a high-fat diet disrupts redox homeostasis. This would offer a more comprehensive view of the antioxidant response in this experimental context.
Nevertheless, future studies are necessary to explore the potential immunomodulatory effects of varying n-6:n-3 PUFA ratios on cytokine signaling pathways in adipose tissue. Incorporating pathway-specific analyses and advanced cellular approaches such as single-cell transcriptomics, immune cell phenotyping, or in vitro co-culture models could provide deeper insights into the molecular mechanisms underlying the observed anti-inflammatory effects. These investigations could offer a clearer understanding of the translational potential of dietary lipid modulation as a strategy for managing obesity-related inflammation.
One of the limitations of this study is the relatively small sample size, which was selected based on the precedent from established experimental models. While the observed trends are biologically plausible and consistent with the previous literature, we recognize that not all effects can be unequivocally attributed to the modified n-6:n-3 PUFA ratio alone. Confounding variables, including the overall composition of dietary fats, the specific sources of fatty acids, and inter-individual metabolic variability, may have influenced the outcomes.
Therefore, future research should aim to further elucidate the complex mechanisms by which PUFA ratios modulate metabolic and inflammatory pathways. This includes the implementation of more robust experimental designs and larger sample sizes and the integration of multi-omics approaches to assess systemic and tissue-specific responses. Gaining a deeper understanding of these mechanisms will be essential for translating preclinical findings into effective, evidence-based dietary strategies for the prevention and treatment of obesity.

5. Conclusions

This study demonstrates that dietary modulation of the n-6:n-3 polyunsaturated fatty acid ratio from 30:1 to 5:1 in a murine model of diet-induced obesity leads to significant metabolic and inflammatory improvements. These findings underscore the importance of dietary lipid quality—rather than quantity alone—in shaping metabolic health and immune responses. Importantly, they support the potential of adjusting the n-6:n-3 ratio as a non-pharmacological, nutrition-based strategy to mitigate obesity-related low-grade inflammation and metabolic dysfunction. Future translational studies are warranted to explore its clinical applicability and to further elucidate the underlying molecular mechanisms in humans.

Supplementary Materials

The following supporting information can be downloaded at https://www.mdpi.com/article/10.3390/nu17121996/s1, Table S1. TaqMan assay information for target genes; Figure S1: Body weight progression over the 17-week high-fat diet induction period; Table S2. Weights of epididymal adipose tissue and liver and relative liver weight at week 17; Figure S2. Serum levels of triglycerides, total cholesterol, and glucose at the end of the 17-week period; Figure S3. Expression profile of inflammatory cytokines in adipose tissue of control and HFD-30:1 groups at week 17; Figure S4. Expression profile of antioxidant enzymes in adipose tissue of control and HFD-30:1 groups at week 17.

Author Contributions

All authors made substantial contributions to this work. Sample and tissue processing, formal analysis, data curation, validation, and investigation: A.G.-G.; animal model development, validation, investigation, and methodology: D.C.-M.; methodology and original draft preparation: R.R.-E.; writing, data analysis, and supervision: J.H.-B.; methodology, laboratory experiments, and data analysis: W.C.-P.; writing, data analysis, and supervision: A.A.C.-A.; software, supervision, and validation: M.P.-R.; conceptualization, project administration, funding acquisition, and writing—review and editing: E.M.-L. All authors have read and agreed to the published version of the manuscript.

Funding

This research was funded by FODECIJAL (COECYTJAL), grant number 8146-2019, awarded to Erika Martinez-Lopez.

Institutional Review Board Statement

This study was conducted in accordance with institutional and national guidelines for the care and use of laboratory animals and was approved by the Research Ethics Committee of the Centro Universitario de Ciencias de la Salud, Universidad de Guadalajara (Registration Number: 021/2017, Approval Date: 28 September 2017). This study was also supported by FODECIJAL (COECYTJAL), grant number 8146-2019.

Informed Consent Statement

Not applicable.

Data Availability Statement

The data supporting the findings of this study are available from the corresponding author upon reasonable request.

Acknowledgments

The authors acknowledge the support provided by the Open Access Publication Fund through the Apoyo para Pago de Publicación de Artículos Científicos 2025 (APPAC-VII 2025) of the Centro Universitario de Ciencias de la Salud (CUCS), Universidad de Guadalajara.

Conflicts of Interest

The authors declare no conflicts of interest.

Abbreviations

ALAAlpha-linolenic acid
ANOVARepeated measures analysis of variance
ApoBApolipoprotein B
AUCArea under the curve
BMIBody mass index
CatCatalase gene
Ccl2Monocyte chemoattractant protein-1 gene
DHADocosahexaenoic acid
EPAEicosapentaenoic acid
GPR120G-protein-coupled receptor 120
Gpx 1Glutathione peroxidase 1 gene
HFDHigh-fat diet
HFD-5:1High-fat diet with n-6:n-3 ratio of 5:1
HFD-30:1High-fat diet with n-6:n-3 ratio of 30:1
IFN-γInterferon gamma
IfngInterferon gamma gene
IL-1αInterleukin-1 alpha
IL-1βInterleukin-1 beta
IL-4Interleukin-4
IL-6Interleukin-6
IL-10Interleukin-10
Il-13Interleukin-13
ITTInsulin tolerance test
MCP-1Monocyte chemoattractant protein-1
n-3 Omega-3 fatty acids
n-6 Omega-6 fatty acids
NF-κBNuclear factor κappa B
PUFAsPolyunsaturated fatty acids
ROSReactive oxygen species
SDStandard deviation
Sod 1Superoxide dismutase 1 gene
Tgfb1Transforming growth factor beta 1 gene
TGF-βTransforming growth factor beta
TnfaTumor necrosis factor alpha gene
TNF-αTumor necrosis factor alpha
VLDL-cVery-low-density lipoprotein cholesterol
WHOWorld Health Organization

References

  1. Sikaris, K.A. The clinical biochemistry of obesity. Clin. Biochem. Rev. 2004, 25, 165–181. [Google Scholar] [PubMed]
  2. World Health Organization. Obesity. Available online: https://www.who.int/health-topics/obesity#tab=tab_1 (accessed on 25 March 2025).
  3. Lobstein, T.; Brinsden, H.; Neveux, M.; Cavalcanti, O.B.; Barquera, S.; Baur, L.; Busch, V.; Buse, K.; Dietz, B.; French, A.; et al. World Obesity Atlas 2022; World Obesity Federation: London, UK, 2022. [Google Scholar]
  4. Jiang, S.-Z.; Lu, W.; Zong, X.-F.; Ruan, H.-Y.; Liu, Y. Obesity and hypertension. Exp. Ther. Med. 2016, 12, 2395–2399. [Google Scholar] [CrossRef] [PubMed]
  5. De Heredia, F.P.; Gómez-Martínez, S.; Marcos, A. Chronic and Degenerative Diseases: Obesity, Inflammation and the Immune System. Proc. Nutr. Soc. 2012, 71, 332–338. [Google Scholar] [CrossRef]
  6. Sies, H. Oxidative stress: Concept and some practical aspects. Antioxidants 2020, 9, 701. [Google Scholar] [CrossRef]
  7. Malenica, M.; Meseldžić, N. Oxidative stress and obesity. Arh. Farm. 2022, 72, 166–183. [Google Scholar] [CrossRef]
  8. Chao, A.M.; Quigley, K.M.; Wadden, T.A. Dietary interventions for obesity: Clinical and mechanistic findings. Curr. Diab. Rep. 2020, 20, 1–10. [Google Scholar] [CrossRef]
  9. Iwabuchi, K.; Nakayama, H.; Iwahara, C.; Takamori, K. Significance of glycosphingolipid fatty acid chain length on membrane microdomain-mediated signal transduction. FEBS Lett. 2010, 584, 1642–1652. [Google Scholar] [CrossRef]
  10. Russo, G.L. Dietary n-6 and n-3 polyunsaturated fatty acids: From biochemistry to clinical implications in cardiovascular prevention. Biochem. Pharmacol. 2009, 77, 937–946. [Google Scholar] [CrossRef] [PubMed]
  11. Simopoulos, A.P. The importance of the ratio of omega-6/omega-3 essential fatty acids. Biomed. Pharmacother. 2002, 56, 365–379. [Google Scholar] [CrossRef]
  12. Kusunoki, C.; Yang, L.; Yoshizaki, T.; Nakagawa, F.; Ishikado, A.; Kondo, M.; Morino, K.; Sekine, O.; Ugi, S.; Nishio, Y.; et al. Omega-3 polyunsaturated fatty acid has an anti-oxidant effect via the Nrf-2/HO-1 pathway in 3T3-L1 adipocytes. Biochem. Biophys. Res. Commun. 2013, 430, 225–230. [Google Scholar] [CrossRef]
  13. Van Name, M.A.; Savoye, M.; Chick, J.M.; Galuppo, B.T.; Feldstein, A.E.; Pierpont, B.; Johnson, C.; Shabanova, V.; Ekong, U.; Valentinp, P.L.; et al. A low n-6 to n-3 PUFA ratio diet to treat fatty liver disease in obese youth. J. Clin. Endocrinol. Metab. 2020, 105, 2314–2321. [Google Scholar] [CrossRef]
  14. Yue, H.; Liu, W.; Zhang, W.; Jia, M.; Huang, F.; Du, F.; Xu, T. Dietary low ratio of n-6/n-3 polyunsaturated fatty acids improve type 2 diabetes mellitus via activating brown adipose tissue in male mice. J. Food Sci. 2021, 86, 1058–1065. [Google Scholar] [CrossRef] [PubMed]
  15. Ma, C.; Xu, Z.; Lv, H. Low n-6/n-3 PUFA ratio improves inflammation and myocardial ischemic reperfusion injury. Biochem. Cell Biol. 2019, 97, 621–629. [Google Scholar] [CrossRef] [PubMed]
  16. Blasbalg, T.L.; Hibbeln, J.R.; Ramsden, C.E.; Majchrzak, S.F.; Rawlings, R.R. Changes in consumption of omega-3 and omega-6 fatty acids in the United States during the 20th century. Am. J. Clin. Nutr. 2011, 93, 950–962. [Google Scholar] [CrossRef]
  17. Cordain, L.; Eaton, S.B.; Sebastian, A.; Mann, N.; Lindeberg, S.; Watkins, B.A.; O’Keefe, J.H.; Brand-Miller, J. Origins and evolution of the Western diet: Health implications for the 21st century. Am. J. Clin. Nutr. 2005, 81, 341–354. [Google Scholar] [CrossRef]
  18. Campos-Pérez, W.; González-Becerra, K.; Ramos-López, O.; Silva-Gómez, J.A.; Barrón-Cabrera, E.; Roman, S.; Panduro, A.; Martínez-López, E. Same Dietary but Different Physical Activity Pattern in Normal-weight and Overweight Mexican Subjects. J. Food Nutr. Res. 2016, 4, 729–735. [Google Scholar] [CrossRef]
  19. Livak, K.J.; Schmittgen, T.D. Analysis of relative gene expression data using real-time quantitative PCR and the 2−ΔΔCT method. Methods 2001, 25, 402–408. [Google Scholar] [CrossRef] [PubMed]
  20. World Health Organization. Obesity and Overweight; WHO: Geneva, Switzerland, 2025. Available online: https://www.who.int/news-room/fact-sheets/detail/obesity-and-overweight (accessed on 25 March 2025).
  21. Kennedy, A.J.; Ellacott, K.L.J.; King, V.L.; Hasty, A.H. Mouse models of the metabolic syndrome. DMM Dis. Model. Mech. 2010, 3, 156–166. [Google Scholar] [CrossRef]
  22. Farooqi, I.S.; Xu, Y. Translational potential of mouse models of human metabolic disease. Cell 2024, 187, 4129–4143. [Google Scholar] [CrossRef]
  23. de Moura e Dias, M.; dos Reis, S.A.; da Conceição, L.L.; Sediyama, C.M.N.D.O.; Pereira, S.S.; de Oliveira, L.L.; Peluzio, M.D.C.G.; Martinez, J.A.; Milagro, F.I. Diet-induced obesity in animal models: Points to consider and influence on metabolic markers. Diabetol. Metab. Syndr. 2021, 13, 56. [Google Scholar] [CrossRef]
  24. Cottam, M.A.; Caslin, H.L.; Winn, N.C.; Hasty, A.H. Multiomics reveals the persistence of obesity-associated immune cell phenotypes in adipose tissue during weight loss and weight regain in mice. Nat. Commun. 2022, 13, 2950. [Google Scholar] [CrossRef] [PubMed]
  25. An, J.; Wang, Q.; Yi, S.; Liu, X.; Jin, H.; Xu, J.; Wen, G.; Zhu, J.; Tuo, B. The source of the fat significantly affects the results of high-fat diet intervention. Sci. Rep. 2022, 12, 4315. [Google Scholar] [CrossRef] [PubMed]
  26. He, M.Q.; Wang, J.Y.; Wang, Y.; Sui, J.; Zhang, M.; Ding, X.; Zhao, Y.; Chen, Z.; Ren, X.; Shi, B. High-fat diet-induced adipose tissue expansion occurs prior to insulin resistance in C57BL/6J mice. Chronic Dis. Transl. Med. 2020, 6, 198–207. [Google Scholar] [CrossRef] [PubMed]
  27. Li, J.; Wu, H.; Liu, Y.; Yang, L. High fat diet induced obesity model using four strains of mice: Kunming, c57bl/6, balb/c and icr. Exp. Anim. 2020, 69, 326–335. [Google Scholar] [CrossRef]
  28. Fuster, J.J.; Ouchi, N.; Gokce, N.; Walsh, K. Obesity-Induced Changes in Adipose Tissue Microenvironment and Their Impact on Cardiovascular Disease. Circ. Res. 2016, 118, 1786–1807. [Google Scholar] [CrossRef]
  29. Varani, J. Healthful Eating, the Western Style Diet and Chronic Disease. Approaches Poult. Dairy Vet. Sci. 2017, 1, 44–46. [Google Scholar] [CrossRef]
  30. Clemente-Suárez, V.J.; Beltrán-Velasco, A.I.; Redondo-Flórez, L.; Martín-Rodríguez, A.; Tornero-Aguilera, J.F. Global Impacts of Western Diet and Its Effects on Metabolism and Health: A Narrative Review. Nutrients 2023, 15, 2749. [Google Scholar] [CrossRef] [PubMed]
  31. Johnson, A.R.; Milner, J.J.; Makowski, L. The inflammation highway: Metabolism accelerates inflammatory traffic in obesity. Immunol. Rev. 2012, 249, 218–238. [Google Scholar] [CrossRef]
  32. van der Heijden, R.A.; Sheedfar, F.; Morrison, M.C.; Hommelberg, P.P.H.; Kor, D.; Kloosterhuis, N.J.; Gruben, N.; Youssef, S.A.; de Bruin, A.; Hofker, M.H.; et al. High-fat diet induced obesity primes inflammation in adipose tissue prior to liver in C57BL/6j mice. Aging 2015, 7, 256–268. [Google Scholar] [CrossRef]
  33. Rojas-Cruz, A.F.; Martín-Jiménez, C.A.; González, J.; González-Giraldo, Y.; Pinzón, A.M.; Barreto, G.E.; Aristizábal-Pachón, A.F. Palmitic Acid Upregulates Type I Interferon–Mediated Antiviral Response and Cholesterol Biosynthesis in Human Astrocytes. Mol. Neurobiol. 2023, 60, 4842–4854. [Google Scholar] [CrossRef]
  34. Li, J.; Chen, Q.; Yi, J.; Lan, X.; Lu, K.; Du, X.; Guo, Z.; Guo, Y.; Geng, M.; Li, D.; et al. IFN-γ contributes to the hepatic inflammation in HFD-induced nonalcoholic steatohepatitis by STAT1β/TLR2 signaling pathway. Mol. Immunol. 2021, 134, 118–128. [Google Scholar] [CrossRef] [PubMed]
  35. Hooks, J.J.; Moutsopoulos, H.M.; Geis, S.A.; Stahl, N.I.; Decker, J.L.; Notkins, A.L. Immune Interferon in the Circulation of Patients with Autoimmune Disease. N. Engl. J. Med. 1979, 301, 5–8. [Google Scholar] [CrossRef]
  36. Casanova, J.L.; MacMicking, J.D.; Nathan, C.F. Interferon-γ and infectious diseases: Lessons and prospects. Science 2024, 384, eadl2016. [Google Scholar] [CrossRef] [PubMed]
  37. O’ROurke, R.W.; White, A.E.; Metcalf, M.D.; Winters, B.R.; Diggs, B.S.; Zhu, X.; Marks, D.L. Systemic inflammation and insulin sensitivity in obese IFN-γ knockout mice. Metabolism 2012, 61, 1152–1161. [Google Scholar] [CrossRef]
  38. Noeman, S.A.; Hamooda, H.E.; Baalash, A.A. Biochemical study of oxidative stress markers in the liver, kidney and heart of high fat diet induced obesity in rats. Diabetol. Metab. Syndr. 2011, 3, 17. [Google Scholar] [CrossRef] [PubMed]
  39. Shabani, M.; Hosseini, H.; Tajik, M.H.; Meshkani, R.; Sadeghi, A. Resveratrol relieves HFD-induced insulin resistance in skeletal muscle tissue through antioxidant capacity enhancement and the Nrf2-Keap1 signaling pathway. Mol. Biol. Rep. 2024, 51, 516. [Google Scholar] [CrossRef]
  40. Mendes, I.K.S.; Matsuura, C.; Aguila, M.B.; Daleprane, J.B.; Martins, M.A.; Mury, W.V.; Brunini, T.M.C. Weight loss enhances hepatic antioxidant status in a NAFLD model induced by high-fat diet. Appl. Physiol. Nutr. Metab. 2018, 43, 23–29. [Google Scholar] [CrossRef]
  41. Oh, D.Y.; Talukdar, S.; Bae, E.J.; Imamura, T.; Morinaga, H.; Fan, W.Q.; Li, P.; Lu, W.J.; Watkins, S.M.; Olefsky, J.M. GPR120 Is an Omega-3 Fatty Acid Receptor Mediating Potent Anti-inflammatory and Insulin-Sensitizing Effects. Cell 2010, 142, 687–698. [Google Scholar] [CrossRef]
  42. Harris, W.S.; Bulchandani, D. Why do omega-3 fatty acids lower serum triglycerides? Curr. Opin. Lipidol. 2006, 17, 387–393. [Google Scholar] [CrossRef]
  43. Kim, C.W.; Addy, C.; Kusunoki, J.; Anderson, N.N.; Deja, S.; Fu, X.; Burgess, S.C.; Li, C.; Ruddy, M.; Chakravarthy, M.; et al. Acetyl CoA carboxylase inhibition reduces hepatic steatosis but elevates plasma triglycerides in mice and humans: A bedside to bench investigation. Cell Metab. 2017, 26, 394–406.e6. [Google Scholar] [CrossRef]
  44. Shearer, G.C.; Savinova, O.V.; Harris, W.S. Fish oil and plasma triglycerides. Biochim. Biophys. Acta (BBA) Mol. Cell Biol. Lipids 2012, 1821, 843–851. [Google Scholar] [CrossRef]
  45. Tanaka, N.; Zhang, X.; Sugiyama, E.; Kono, H.; Horiuchi, A.; Nakajima, T.; Kanbe, H.; Tanaka, E.; Gonzalez, F.J.; Aoyama, T. Eicosapentaenoic acid improves hepatic steatosis independent of PPARα activation through inhibition of SREBP-1 maturation in mice. Biochem. Pharmacol. 2010, 80, 1601–1612. [Google Scholar] [CrossRef] [PubMed]
  46. Anderson, B.M.; Ma, D.W. Are all n-3 polyunsaturated fatty acids created equal? Lipids Health Dis. 2009, 8, 33. [Google Scholar] [CrossRef]
  47. Maitin, V.; Andreo, U.; Guo, L.; Fisher, E.A. Docosahexaenoic acid impairs the maturation of very low density lipoproteins in rat hepatic cells. J. Lipid Res. 2014, 55, 75–84. [Google Scholar] [CrossRef]
  48. Wang, H.; Chen, X.; Fisher, E.A. N-3 fatty acids stimulate intracellular degradation of apoprotein B in rat hepatocytes. J. Clin. Investig. 1993, 91, 1380–1389. [Google Scholar] [CrossRef]
  49. Schade, D.S.; Shey, L.; Eaton, R.P. Cholesterol review: A metabolically important molecule. Endocr. Pract. 2020, 26, 1514–1523. [Google Scholar] [CrossRef] [PubMed]
  50. Simopoulos, A.P. Omega-3 fatty acids in wild plants, nuts and seeds. Asia Pac. J. Clin. Nutr. 2002, 11, S163–S173. [Google Scholar] [CrossRef]
  51. Ullah, A.; Singla, R.K.; Batool, Z.; Cao, D.; Shen, B. Pro- and anti-inflammatory cytokines are the game-changers in childhood obesity-associated metabolic disorders (diabetes and non-alcoholic fatty liver diseases). Rev. Endocr. Metab. Disord. 2024, 25, 783–803. [Google Scholar] [CrossRef]
  52. Ji, Y.; Sun, S.; Xia, S.; Yang, L.; Li, X.; Qi, L. Short term high fat diet challenge promotes alternative macrophage polarization in adipose tissue via natural killer T cells and interleukin-4. J. Biol. Chem. 2012, 287, 24378–24386. [Google Scholar] [CrossRef]
  53. Oliveira, M.C.; Menezes-Garcia, Z.; Henriques, M.C.C.; Soriani, F.M.; Pinho, V.; Faria, A.M.C.; Santiago, A.F.; Cara, D.C.; Souza, D.G.; Teixeira, M.M.; et al. Acute and sustained inflammation and metabolic dysfunction induced by high refined carbohydrate-containing diet in mice. Obesity 2013, 21, e396–e406. [Google Scholar] [CrossRef]
  54. Denys, A.; Hichami, A.; Khan, N.A. n-3 PUFAs modulate T-cell activation via protein kinase C-alpha and -epsilon and the NF-kappaB signaling pathway. J. Lipid Res. 2005, 46, 752–758. [Google Scholar] [CrossRef] [PubMed]
  55. Djuricic, I.; Calder, P.C. Beneficial Outcomes of Omega-6 and Omega-3 Polyunsaturated Fatty Acids on Human Health: An Update for 2021. Nutrients 2021, 13, 2421. [Google Scholar] [CrossRef] [PubMed]
  56. Kliewer, S.A.; Sundseth, S.S.; Jones, S.A.; Brown, P.J.; Wisely, G.B.; Koble, C.S.; Devchand, P.; Wahli, W.; Willson, T.M.; Lenhard, J.M.; et al. Fatty acids and eicosanoids regulate gene expression through direct interactions with peroxisome proliferator-activated receptors alpha and gamma. Proc. Natl. Acad. Sci. USA 1997, 94, 4318–4323. [Google Scholar] [CrossRef] [PubMed]
  57. Lefils-Lacourtablaise, J.; Socorro, M.; Géloën, A.; Daira, P.; Debard, C.; Loizon, E.; Guichardant, M.; Dominguez, Z.; Vidal, H.; Lagarde, M.; et al. The eicosapentaenoic acid metabolite 15-deoxy-δ(12,14)-prostaglandin J3 increases adiponectin secretion by adipocytes partly via a PPARγ-dependent mechanism. PLoS ONE 2013, 8, e63997. [Google Scholar] [CrossRef]
  58. da Silva, E.P., Jr.; Nachbar, R.T.; Levada-Pires, A.C.; Hirabara, S.M.; Lambertucci, R.H. Omega-3 fatty acids differentially modulate enzymatic anti-oxidant systems in skeletal muscle cells. Cell Stress Chaperones 2016, 21, 87–95. [Google Scholar] [CrossRef]
Figure 1. Body weight and energy intake during and after the 8-week dietary intervention. (A) Body weight progression over time, where week 0 represents baseline values; (B) final body weight at the end of the intervention; (C) weekly food intake per mouse; (D) total caloric intake per mouse over the 8-week period. Data are presented as mean ± SD. Statistical differences were assessed using one-way ANOVA followed by post hoc comparisons. ns: non-significant.
Nutrients 17 01996 g001
Figure 2. Insulin tolerance test (ITT) and glucose area under the curve (AUC) following the 8-week dietary intervention. (A) Glucose levels over time during the ITT (0–90 min); (B) glucose AUC calculated from ITT measurements. Data are presented as mean ± SD. Statistical comparisons were performed using one-way ANOVA followed by post hoc analysis. ns: non-significant.
Nutrients 17 01996 g002
Figure 3. Levels of triglycerides, total cholesterol, and glucose at the end of the 8-week dietary intervention. (A) Triglyceride levels; (B) total cholesterol levels; (C) glucose levels. Values are presented as mean ± SD. ns: non-significant.
Nutrients 17 01996 g003
Figure 4. Expression levels of inflammation-related genes in adipose tissue following the 8-week dietary intervention. (A) Il1a expression; (B) Il6 expression; (C) Il10 expression; (D) Tnfa expression; (E) Ccl2 expression; (F) Tgfb1 expression; (G) Il13 expression; (H) Ifng expression; (I) Il4 expression; (J) Il1b expression. Values are presented as mean ± SD. ns: non-significant.
Nutrients 17 01996 g004
Figure 5. Effect of HFD-5:1 on antioxidant gene expression following the 8-week intervention. (A) Gpx1 expression; (B) Sod1 expression; (C) Cat expression. Values are presented as mean ± SD. ns: non-significant.
Nutrients 17 01996 g005
Table 1. Composition of the control, HFD-30:1, and HFD-5:1 diets.
ComponentsControlHFD-30:1HFD-5:1
D12450HD21022504D21022505
g% kcalg% kcalg% kcal
Proteins192024202420
Carbohydrates677041354135
Fat41024452445
Total 100 100 100
Kcal/g3.8 4.7 4.7
Ingredientsgkcalgkcalgkcal
Casein200800200800200800
L-Cysteine312312312
Cornstarch452.2180972.829172.8291
Maltodextrin 1075300100400100400
Sucrose172.8691172.8691172.8691
Cellulose500500500
Lard2018015714131571413
Menhaden oil000020.5185
Safflower oil0045.541000
Soy oil252250025225
Mineral mix S10026 100100100
Dicalcium phosphate130130130
Calcium carbonate5.505.505.50
Potassium citrate monohydrate16.5016.5016.50
Vitamin mix100100100
Choline bitartrate202020
Total1055.054057858.154057858.154057
PUFA and cholesterol content
n-6 (g/4057 kcal)17.974.652.8
n-3 (g/4057 kcal)2.12.310.6
EPA0.00.02.9
DHA0.00.02.1
n-6:n-38.430.25.0
Linoleic acid (g/kg)16.982.160.2
Fat cholesterol (mg/4057 kcal)14.4117.4233.3
Total cholesterol (mg/4057 kcal)14.4233.4233.3
HFD: high-fat diet; kcal/g: kilocalories per gram; EPA: eicosapentaenoic acid; DHA: docosahexaenoic acid; n-6: omega-6; n-3: omega-3.
Table 2. Effect of the 8-week dietary intervention with HFD-5:1 on tissue weight.
Tissue ControlHFD-30:1HFD-5:1p-Value
Epididymal adipose (g)1.1 ± 0.41.3 ± 0.51.0 ± 0.40.4
Liver (g)1.4 ± 0.1 a2.1 ± 0.4 b1.6 ± 0.4 a0.01
Relative liver weight4.2 ± 0.6 a5.5 ± 1.4 b4.0 ± 0.2 a0.04
Values are presented as mean ± SD. Different superscript letters (a, b) indicate statistically significant differences among groups (p < 0.05). Relative liver weight to the ratio of liver weight to total body weight.
Disclaimer/Publisher’s Note: The statements, opinions and data contained in all publications are solely those of the individual author(s) and contributor(s) and not of MDPI and/or the editor(s). MDPI and/or the editor(s) disclaim responsibility for any injury to people or property resulting from any ideas, methods, instructions or products referred to in the content.

