1. Introduction
The Polish population has undergone significant shifts in dietary habits in recent years, marked by an increased consumption of ultra-processed foods (UPFs) and added sugars. This study aims to evaluate the prevalence and impact of sweets addiction within this population to inform public health interventions and clinical practice.
Food addiction, particularly to sweets, has garnered substantial research attention due to its strong association with metabolic diseases. The rising global prevalence of conditions such as obesity and type 2 diabetes mellitus (T2DM) represents a major public health challenge, contributing to increased mortality and disability-adjusted life years across all socioeconomic groups [
1]. Among key modifiable risk factors, dietary behavior, such as the habitual consumption of UPFs, has been identified as a primary driver of these conditions [
2,
3]. UPFs, characterized by high levels of added sugars, refined carbohydrates, and saturated fats and low levels of fiber and micronutrients, are strongly linked to weight gain, systemic inflammation, insulin resistance, and impaired satiety signaling [
4,
5,
6].
While traditional dietary patterns such as the Mediterranean diet are linked to improved metabolic outcomes and reduced chronic disease risk [
7,
8], the Western-style diet high in UPFs has been implicated in the development of metabolic disorders, including metabolic dysfunction-associated steatotic liver disease (MASLD), T2DM, cardiovascular complications [
9,
10], and dementia and Alzheimer’s disease [
9,
10,
11]. In particular, excessive intake of sugar-sweetened foods and beverages, such as those high in fructose, can promote hepatic fat accumulation, mitochondrial dysfunction, and fibrosis [
12,
13].
Beyond metabolic outcomes, growing evidence suggests that UPFs, particularly those rich in added sugars, may exert addictive-like effects by stimulating reward pathways in the brain, leading to compulsive eating behaviors that mirror substance use disorders [
14,
15,
16]. High consumption of sweet UPFs has also been linked to impaired cognitive function, mood instability, and increased risk of depression and anxiety, which may be mediated by blood glucose fluctuations, gut microbiota dysbiosis, and neuroinflammation [
16,
17,
18,
19]. Moreover, habitual intake of these foods can disrupt sleep quality and circadian rhythms, further aggravating metabolic and mental health issues [
20]. In particular, in children and adolescents, excessive sugar intake has been associated with reduced academic performance, attention deficits, and increased hyperactivity [
21]. These neurobiological and behavioral effects carry serious public health implications, especially in countries like Poland, where average sugar consumption far exceeds recommended levels, contributing to the burden of both physical and mental health conditions [
22].
The FitMIND Foundation, established in 2022, is an organization, in which a group of experts in dietetics and psychology work in order to support patients struggling with a broad spectrum of eating disorders and related unhealthy behaviors. Despite its short history, the foundation has provided help and professional support to hundreds of patients from all over Poland. Practical observations from this experiences support the conclusion that there is a need for a tool to quantitatively assess the severity of sweets addiction, which is often a significant component of eating disorders.
In sum, we believe that there is a need for a validated, culturally adapted tool for evaluating problematic habits associated with sugary food consumption, which may be used for early detection of addictive-like behaviors towards sweet foods and inform public health strategies aimed at mitigating the metabolic and neuropsychological risks associated with excessive UPF intake.
Given the limitations of available tools to assess sweet food addiction, this pilot study aims to demonstrate the psychometric properties of the scale developed by the experts from the FitMIND Foundation (named the FitMIND Foundation Sweets Addiction Scale (FFSAS)), referring to the structure of the Yale Food Addiction Scale 2.0 (YFAS 2.0) based on external expert validation as well as extensive psychometric analysis.
2. Materials and Methods
2.1. Study Design
The validation of the FFSAS followed a two-phase design that combined expert judgement with psychometric testing.
2.1.1. Phase I: Validation of External Experts
A panel of 11 expert judges was recruited to evaluate all 35 items of the FFSAS. The experts (mean experience = 16.5 years; range = 12–24) represented medicine (psychiatry), psychology, and health sciences. Each item was rated on a five-point Likert scale (1 = “strongly disagree”, 5 = “strongly agree”) across four dimensions: (i) clarity, (ii) content validity, (iii) linguistic appropriateness, and (iv) construct representativeness. For every item, the highest and lowest scores were discarded, and a mean of the remaining nine ratings was calculated and ranked; ties were resolved automatically by averaging the ranks and rounding to one decimal place. Items scoring < 3.5 were flagged for future revision (e.g., FFSAS9, 15, 30) [
23].
Table 1 presents an overview of the recruited expert panel with details on field of expertise and specialization.
2.1.2. Phase II: Psychometric Analysis
Psychometric analysis was based on data collected from participants and included the following: (a) internal consistency via Cronbach’s α; (b) construct validity via Spearman correlations between FFSAS scores and sweets-related variables; and (c) factorial validity via exploratory and confirmatory factor analyses (EFA, CFA).
2.2. Study Population
The study population involved in Phase II consisted of adult volunteers (aged ≥ 18 years), in accordance with Polish legal standards. The online questionnaire was distributed through the FitMIND Foundation’s network. The online survey was conducted from 13 January 2022 to 10 February 2025. No minimum sample size was predetermined; the aim was to collect data from as many participants as possible. The questionnaire included the FFSAS scale items, along with additional questions on demographics and eating behaviors, particularly related to sweets consumption. These questions are provided in the
Supplementary Material (Table S1).
This study was approved by the Ethics Committee of Silesia Medical University (protocol code PCN/CBN/0022/KB/291/21, approved 1 January 2022) and conducted in accordance with the Declaration of Helsinki. All participants provided written informed consent, collected electronically via an online Google Forms questionnaire prior to participation.
2.3. Questionnaire Development
The FFSAS was developed by adapting the YFAS 2.0, a validated tool designed to assess food addiction based on the Diagnostic and Statistical Manual of Mental Disorders (DSM-5) criteria for substance use disorders [
24]. The YFAS 2.0 comprises 35 items scored on an 8-point Likert scale (0 = “never”, 7 = “daily”), grouped into 11 addiction symptoms plus a 12th criterion assessing clinical distress or functional impairment. These criteria include the following: (1) consuming larger amounts of food or for longer than intended, (2) persistent desire or unsuccessful attempts to reduce consumption, (3) excessive time spent obtaining, using, or recovering from food, (4) neglect of important social, occupational, or recreational activities, (5) continued use despite knowledge of adverse consequences, (6) tolerance (increased amounts needed or reduced effect), (7) withdrawal symptoms or use to relieve them, (8) continued use despite social or interpersonal problems, (9) failure to fulfill major role obligations, (10) use in physically hazardous situations, (11) craving or strong urge to consume, and (12) distress or functional impairment caused by eating behavior. Each item has a predefined threshold (e.g., “once a month” to “4–6 times a week”) yielding a binary score (0 = not met, 1 = met). The total score, ranging from 0 to 11 (excluding the distress criterion for symptom count), determines food addiction severity: mild (2–3 symptoms), moderate (4–5 symptoms), or severe (≥6 symptoms), with diagnosis requiring the presence of distress [
24].
For the FFSAS, the Polish version of YFAS 2.0, validated by Poprawa et al. (2020) [
25] was used as the template, ensuring adequate translation. This adaptation retained the 35-item structure and 8-point Likert scale but replaced all references to “food” with “sweets” to focus exclusively on sweets-specific addiction-like behaviors.
The FFSAS assesses 12 criteria tailored to sweets consumption, including the following:
Loss of control e.g., “When I started eating sweets, I consumed much more than I planned” (FFSAS1).
Persistent desire or unsuccessful efforts to cut down e.g., “I really wanted to cut down or stop eating sweets but couldn’t” (FFSAS5).
Excessive time spent e.g., “When sweets were unavailable, I went out of my way to get them” (FFSAS10).
Neglect of activities e.g., “I ate sweets so often or in such quantities that I ate instead of working or spending time with family or friends” (FFSAS11).
Continued use despite negative consequences e.g., “I kept eating sweets despite knowing it harmed my health” (FFSAS29).
Tolerance e.g., “Over time, I had to eat more and more sweets to achieve satisfaction” (FFSAS18).
Withdrawal symptoms e.g., “When I cut down or stopped eating sweets, I felt irritable, nervous, or sad” (FFSAS19).
Overeating despite social problems e.g., “I had problems with family or friends due to overeating” (FFSAS24).
Failure to fulfill roles e.g., “My overeating interfered with caring for my family or doing household duties” (FFSAS27).
Use in hazardous situations e.g., “I was so distracted by eating sweets that I could have had an accident” (FFSAS30).
Craving e.g., “I had such an intense craving for sweets that I had to eat them immediately” (FFSAS33).
Distress and functional impairment e.g., “I had serious life problems due to eating, affecting daily organization, work, school, friends, family, or health” (FFSAS35).
Each criterion is measured by 1–4 items (see Annex for full list), with scoring thresholds adapted from YFAS 2.0. A sweets addiction diagnosis requires meeting at least two of the 11 symptom criteria, plus the 12th criterion (distress/impairment), within the past 12 months. The total symptom count (0–11) classifies severity as follows: no sweets addiction (No SA, 0–1 symptom without distress), mild (2–3 symptoms), moderate (4–5 symptoms), or severe (≥6 symptoms), with distress required for all diagnoses. Participants’ responses classify them into four groups: No SA, Mild SA, Moderate SA, or Severe SA. Additionally, the questionnaire includes items assessing the frequency of emotional responses related to sweets consumption (e.g., remorse, guilt, shame, anger) rated on the same 8-point scale (0 = “never”, 7 = “several times a day”), providing supplementary data on psychological correlates of sweets addiction. After data collection, the modified items were externally reviewed by an expert panel of 11 specialists (see
Section 2.4.2. to ensure cultural relevance, linguistic clarity, and alignment with the Polish population’s context.
2.4. Statistical Analysis
2.4.1. Descriptive Statistics
All statistical procedures were performed in IBM SPSS Statistics v26 and STATISTICA v13. Two-tailed p < 0.05 indicated significance; where several pairwise tests were run, the Bonferroni correction adjusted α.
Continuous variables (age, BMI, FFSAS scores) are presented as mean ± SD for data that met the Shapiro–Wilk normality criterion (p > 0.05) or as median [IQR] otherwise. Categorical variables (sex, education, place of residence) are shown as counts and percentages.
2.4.2. Phase I—Expert-Rating Statistics
Eleven experts (mean experience = 16.5 years) rated each of the 35 FFSAS items on a 5-point Likert scale across four dimensions (clarity, content validity, linguistic appropriateness, construct representativeness) [
23]. The highest and lowest score per item were discarded; trimmed means, SD and ranks were calculated in Excel. Items with a trimmed mean < 3.5 were flagged for revision; ties were resolved arithmetically by averaging consecutive ranks (no manual intervention).
2.4.3. Reliability
Internal consistency was assessed with Cronbach’s α for each of the 12 DSM-5 criteria and for the total FFSAS score (35 items, 8-point scale).
2.4.4. Construct Validity
Spearman’s rank-order correlations examined relationships between FFSAS scores (total and criteria) and sweets-related variables: frequency of sweets intake, negative emotions (remorse, guilt, shame, anger), and BMI.
2.4.5. Group Comparisons
Independent t-tests compared total FFSAS scores across four BMI categories—underweight (<18.5 kg m−2), normal (18.5–24.9), overweight (25–29.9), and obese (≥30). Bonferroni-adjusted p values are reported.
2.4.6. Factorial Validity
Exploratory factor analysis (EFA) used principal axis factoring with promax rotation; the number of factors was guided by eigenvalues > 1 and the scree-plot elbow. Sampling adequacy was confirmed with the Kaiser–Meyer–Olkin statistic (>0.80) and Bartlett’s test of sphericity (p < 0.001). The confirmatory factor analysis (CFA) evaluated the hypothesized three-factor model. Model fit was judged acceptable when CFI and TLI > 0.90, RMSEA < 0.08, and χ2/df < 3.0. The missing data were handled by pairwise deletion for descriptive analyses and listwise deletion for multivariate tests.
3. Results
The results are presented in the sections below, which were divided into two phases, Phase 1, presenting the outcomes from the FFSAS validation by the panel of expert judges, followed by Phase 2, showing the workflow of the study along with responses provided on the FFSAS questionnaire in the pilot with volunteering participants. The presented sample sizes in these samples may differ, which is the result of applying a pair-wise deletion to missing data. Consequently, the effective N differs across analyses and has been detailed in each table and figure.
3.1. Phase I: The FFSAS Validation Results by Panel of Expert Judges
The first phase of the presented study analysis was focused on the expert validation collected through the FFSAS data on behaviors related to food consumption, along with their perception of feelings associated with sugary foods intakes. The evaluation investigated these information by applying the assessment of different criteria.
For clarity, item scores ranged from 3.33 (FFSAS15, SD = 1.12) to 4.78 (FFSAS4, FFSAS32, SD < 0.47), with FFSAS4 and FFSAS19 scoring particularly high (>4.67) and exhibiting low variability. However, FFSAS15 and FFSAS30 scored below 3.5, indicating potential comprehension issues. In terms of content validity, scores ranged from 3.33 (FFSAS28, SD = 1.03) to 4.56 (FFSAS4, FFSAS19, SD < 0.69), with FFSAS9 and FFSAS30 being the lowest-scoring items. Regarding other parameters, linguistic appropriateness scores varied from 3.22 (FFSAS21, SD = 1.47) to 4.78 (FFSAS32, SD = 0.47) and construct representativeness ranged from 3.22 (FFSAS30, SD = 1.10) to 4.67 (FFSAS19, SD = 0.50). Items consistently scoring below 3.5, such as FFSAS9, FFSAS15, and FFSAS30, were flagged for revision in future iterations of the scale. All items from the FFSAS questionnaire can be found in the
Supplementary Material (Table S1).
3.2. Phase II: Workflow and Characteristics of Study Participants
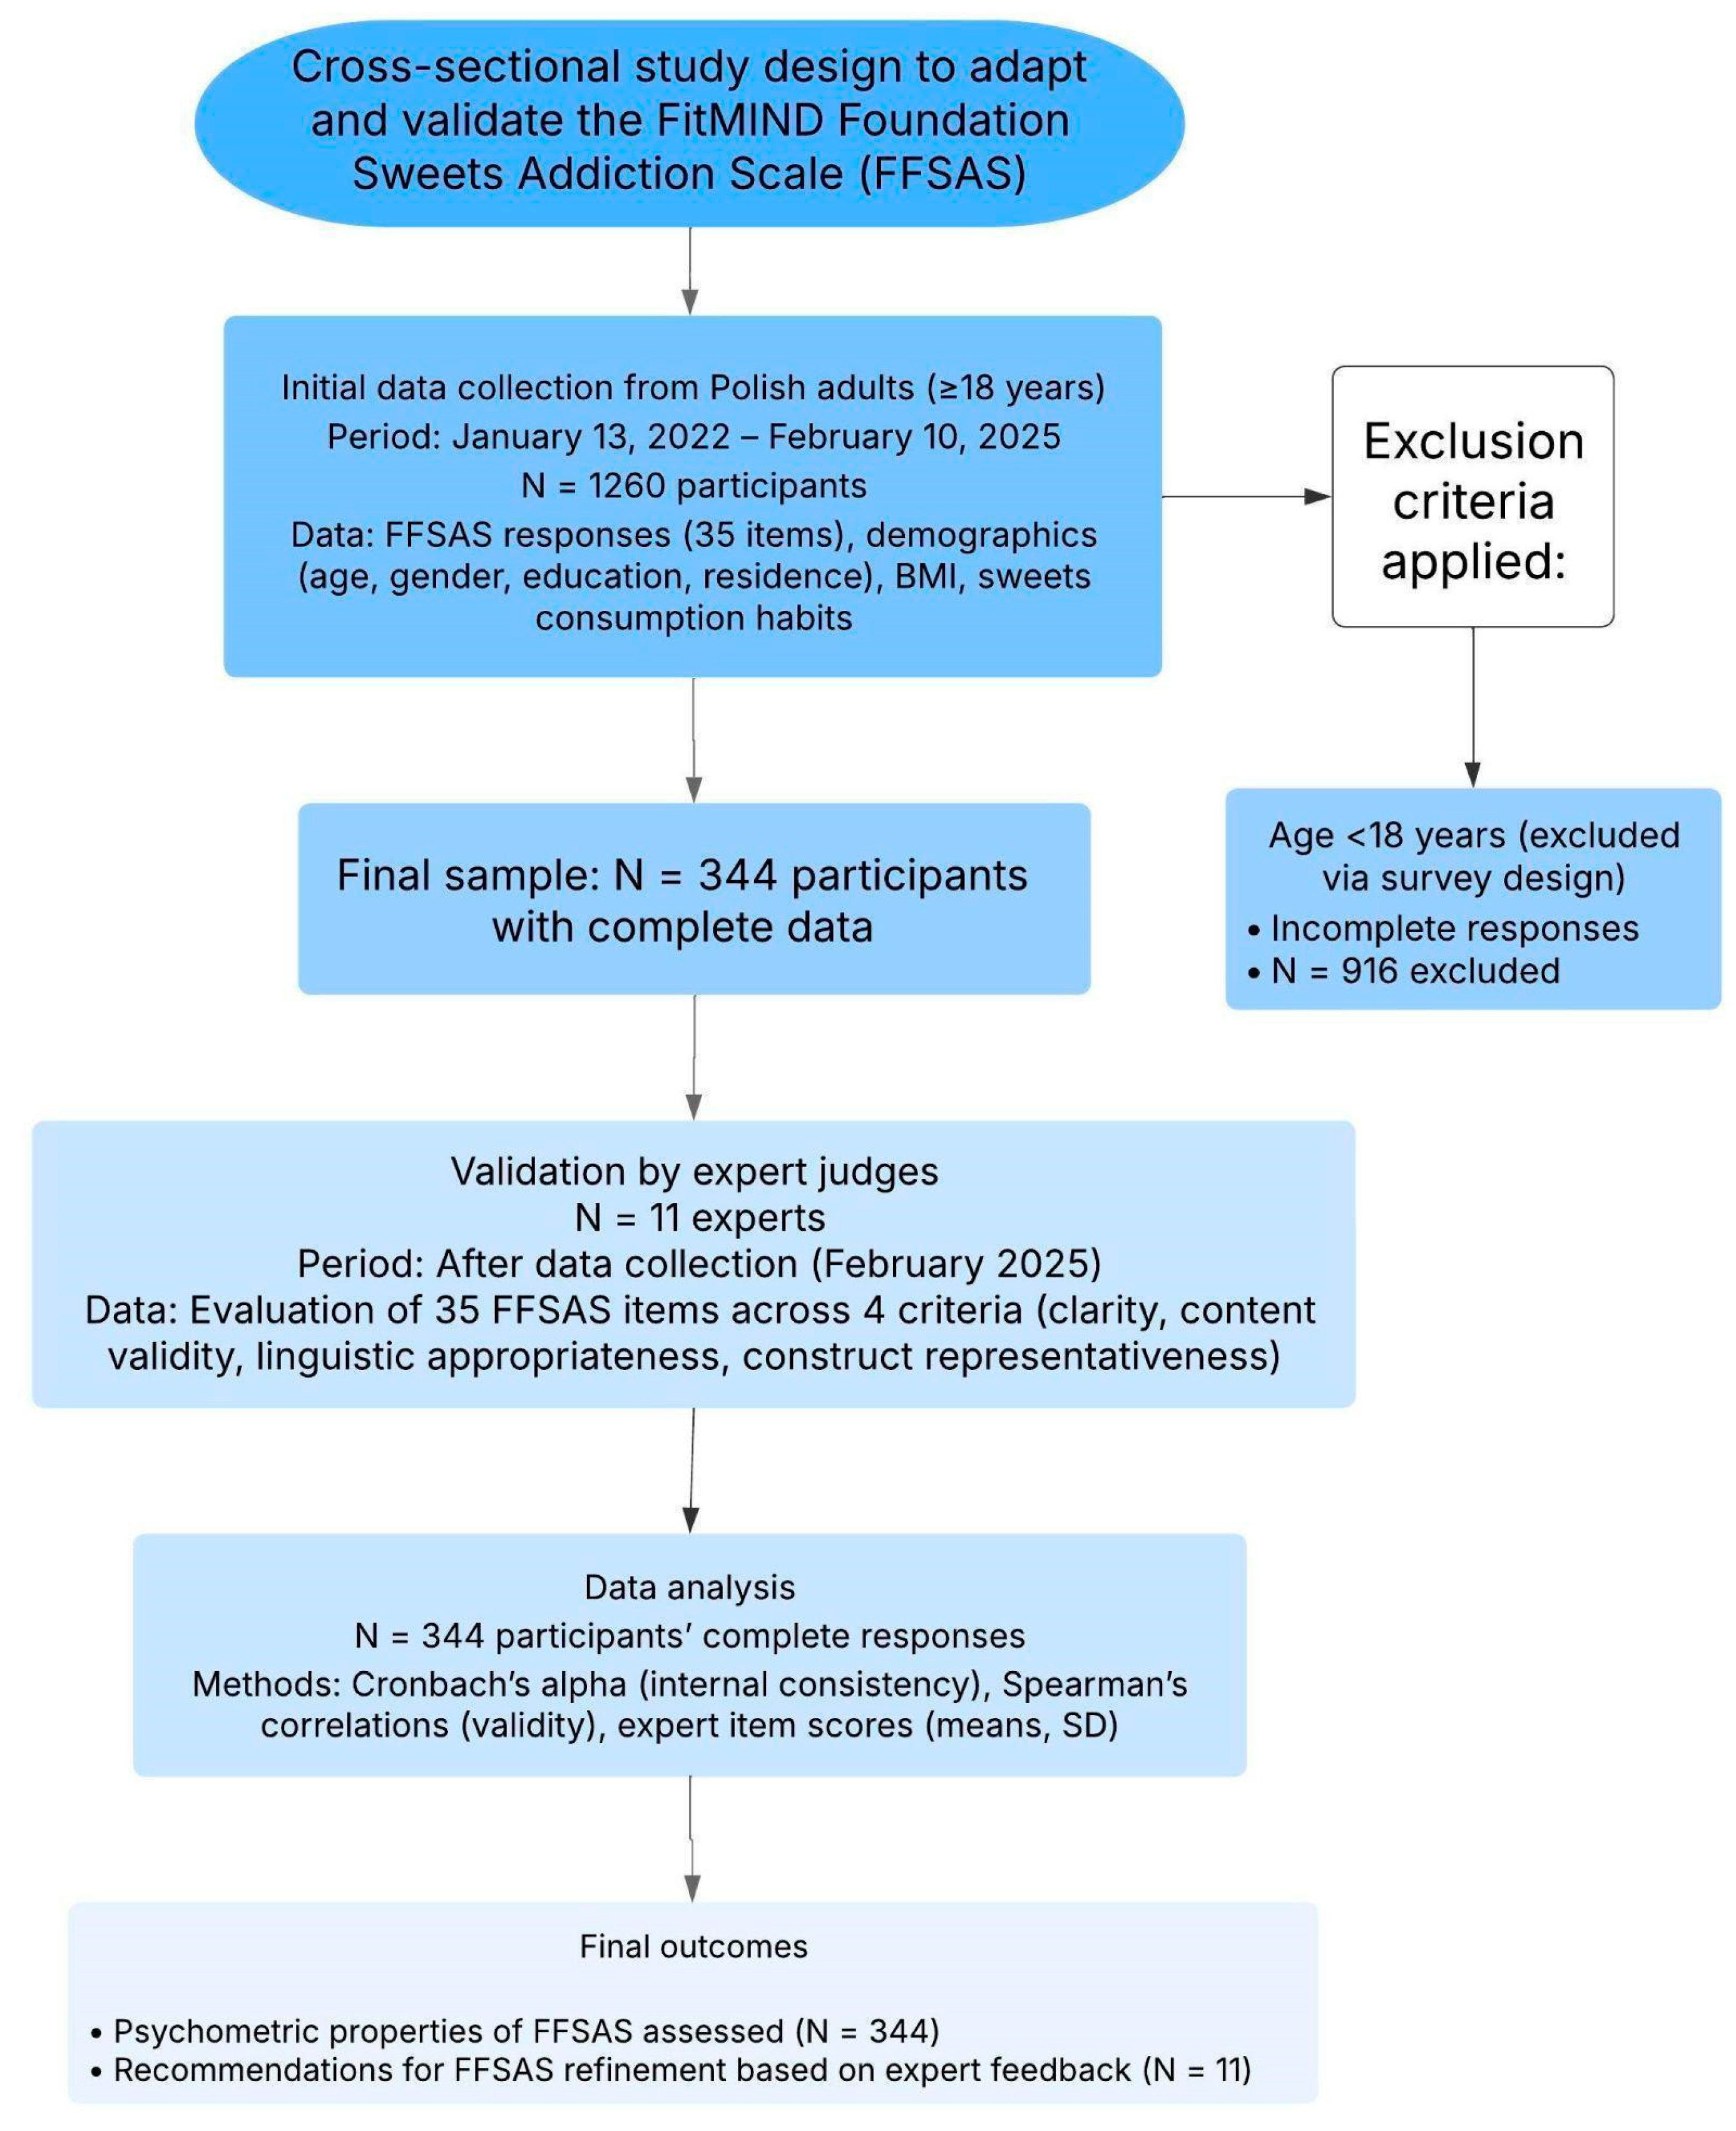
Between 13 January 2022, and 10 February 2025, a total of 1260 Polish adults (aged ≥ 18 years) volunteered to participate in the study by completing the online FFSAS questionnaire via Google Forms. Of these, 916 participants were excluded due to incomplete responses (e.g., missing FFSAS items or demographic data). The study workflow along with the process of participant recruitment is demonstrated in
Figure 1.
The final sample consisted of 344 participants with complete data on demographics, BMI, and sweets consumption habits, which was used for further analysis. This sample size met the requirements for factor analysis, as power calculations estimated a minimum sample size of 100–250 participants [
26].
In this study, a total group of 344 Polish adults, including 270 (78%) women, and a mean age of 40.6 years (range 18–76) voluntarily responded online to the items of the developed FFSAS questionnaire. The demographic and anthropometric characteristics along with sub-group classification of participants are presented in
Table 2.
Briefly, most of the participants in this study had higher education (72%) and resided in large cities with more than 500,000 inhabitants (34%). In this cohort, the mean BMI was 27.86 kg/m2, and 97 people (31%) of responders were classified as obese (BMI ≥ 30 kg/m2).
3.2.1. Self-Reported Responses on Sweets Consumption and Addiction-like Behaviors
To assess the self-reported behaviors and emotional responses related to sweets consumption, participants responded to items in the FFSAS questionnaire concerning their identification as sweets addicts, admission of addiction, frequency and quantity of sweets intake, cravings or unsuccessful attempts to reduce consumption, and associated feelings of guilt or remorse. These data provide insight into the prevalence and patterns of addiction-like behaviors toward sweets in the total sample (
N = 344). Results are summarized in
Table 3.
In this study, most participants perceived their sweets consumption as problematic, with frequent intake and large quantities commonly reported, in contrast to self-reported addiction-like symptoms (e.g., cravings) and emotional distress (e.g., guilt). More than half of responders (62%) identified themselves as addicted to sweets when asked, “Do you identify as addicted to sweets?” while 82 (24%) did not, and 50 (15%) were uncertain (“Don’t know”). When asked directly about admitting addiction (e.g., to themselves or others), 183 (53%) confirmed it, 96 (28%) denied it, 29 (8%) were unsure, and 36 (10%) deemed the question not applicable. In this study, the frequency of sweets consumption was displayed as follows: 107 (31%) reported eating sweets several times a day, 64 (19%) once a day, 65 (19%) 3–4 times a week, 37 (11%) 5–6 times a week, 42 (12%) 1–2 times a week, and 29 (8%) less than once a week. In terms of quantity of consumed sweets, 173 participants (50.3%) reported consuming large amounts, and 170 participants (49.4%) reported small amounts.
In contrast, the self-reported behavioral indicators of addiction, such as cravings or unsuccessful attempts to quit, were less frequent in the study, with 29 (8%) affirming such experiences and 42 (12%) denying them. The frequency of experiencing emotional states associated with sweets consumption, in particular feelings of guilt or remorse were varied between participants, as 38 (11%) experienced these feelings several times a day, 19 (6%) once a day, 7 (2%) 5–6 times a week, 17 (5%) 3–4 times a week, 21 (6%) 1–2 times a week, 17 (5%) less than once a week, and 7 (2%) never, with 218 (63%) responses missing.
3.2.2. Association Between Sweets Consumption, Sweets Addiction Severity, and Negative Emotions
To further examine whether individuals with high sweets addiction (SA) severity experience greater emotional distress associated with sweet food intake, the relationship between sweets consumption frequency, SA severity, and negative emotions (e.g., guilt, remorse, shame, or anger) was assessed and results are presented in
Table 2 (sub-sample,
N = 126) and
Table 3 (total sample,
N = 344). For this analysis, the participants in the total sample were classified into four groups based on the overall FFSAS score: No SA (0–1 symptoms without distress), Mild SA (2–3 symptoms), Moderate SA (4–5 symptoms), and Severe SA (≥6 symptoms, with distress required for SA diagnosis, see
Section 2.1.1). In this analysis, two key measures included sweets consumption frequency (
Table 3, total sample,
N = 344) and the frequency of negative emotions (
Table 2, sub-sample
N = 126), with results displayed in
Figure 2.
3.2.3. Sweets Consumption Frequency and SA Severity
Sweets consumption frequency was assessed in the total sample of 344 participants (
Table 3), in which 62% (
n = 213) were classified as No SA, 1% (
n = 4) as Mild SA, 1% (
n = 4) as Moderate SA, and 36% (
n = 123) as Severe SA. Participants with Severe SA had significantly higher consumption rates of sweet foods, with 19% (
n = 66) reporting eating sweets ‘several times a day’ compared to 12% (
n = 40) in the No SA group. In this group, there was a strong association between sweet food consumption frequency and SA severity (χ
2 = 85.23,
df = 15,
p < 0.00001).
3.2.4. Negative Emotions and SA Severity
The frequency of negative emotions was evaluated in a subgroup of 126 participants (
Table 2), in which 60% (
n = 75) were No SA, 1% (
n = 1) Mild SA, 1% (
n = 1) Moderate SA, and 39% (
n = 49) Severe SA. Overall, 30% (
n = 38) of participants in this group experienced negative emotions towards sweets consumption ‘several times a day,’ including 21% (
n = 27) participants with the Severe SA group and 8% (
n = 10) in the No SA group. Emotional distress was significantly associated with SA severity (χ
2,
p = 0.00001), particularly among those with Severe SA, as evidenced by a moderate-to-strong positive correlation (γ = 0.629,
p < 0.001).
3.3. Association Between Sweets Consumption and Negative Emotions
Participants without SA (No SA) exhibited relatively stable levels of negative emotions across all consumption frequencies, with only 8% (n = 10 out of 75 in the N = 126 subgroup) reporting frequent emotional distress (‘several times a day’), even among those consuming sweets daily (10%, n = 36 out of 213 in the N = 344 sample). In contrast, individuals with SA, especially Severe SA, reported a significantly higher prevalence of negative emotions, with the strongest concentration observed among those consuming sweets ‘several times a day’. A strong association between frequent sweets intake and emotional distress was observed in this group (χ2, p < 0.00001), with 55% (n = 27 out of 49) experiencing negative emotions at the highest frequency.
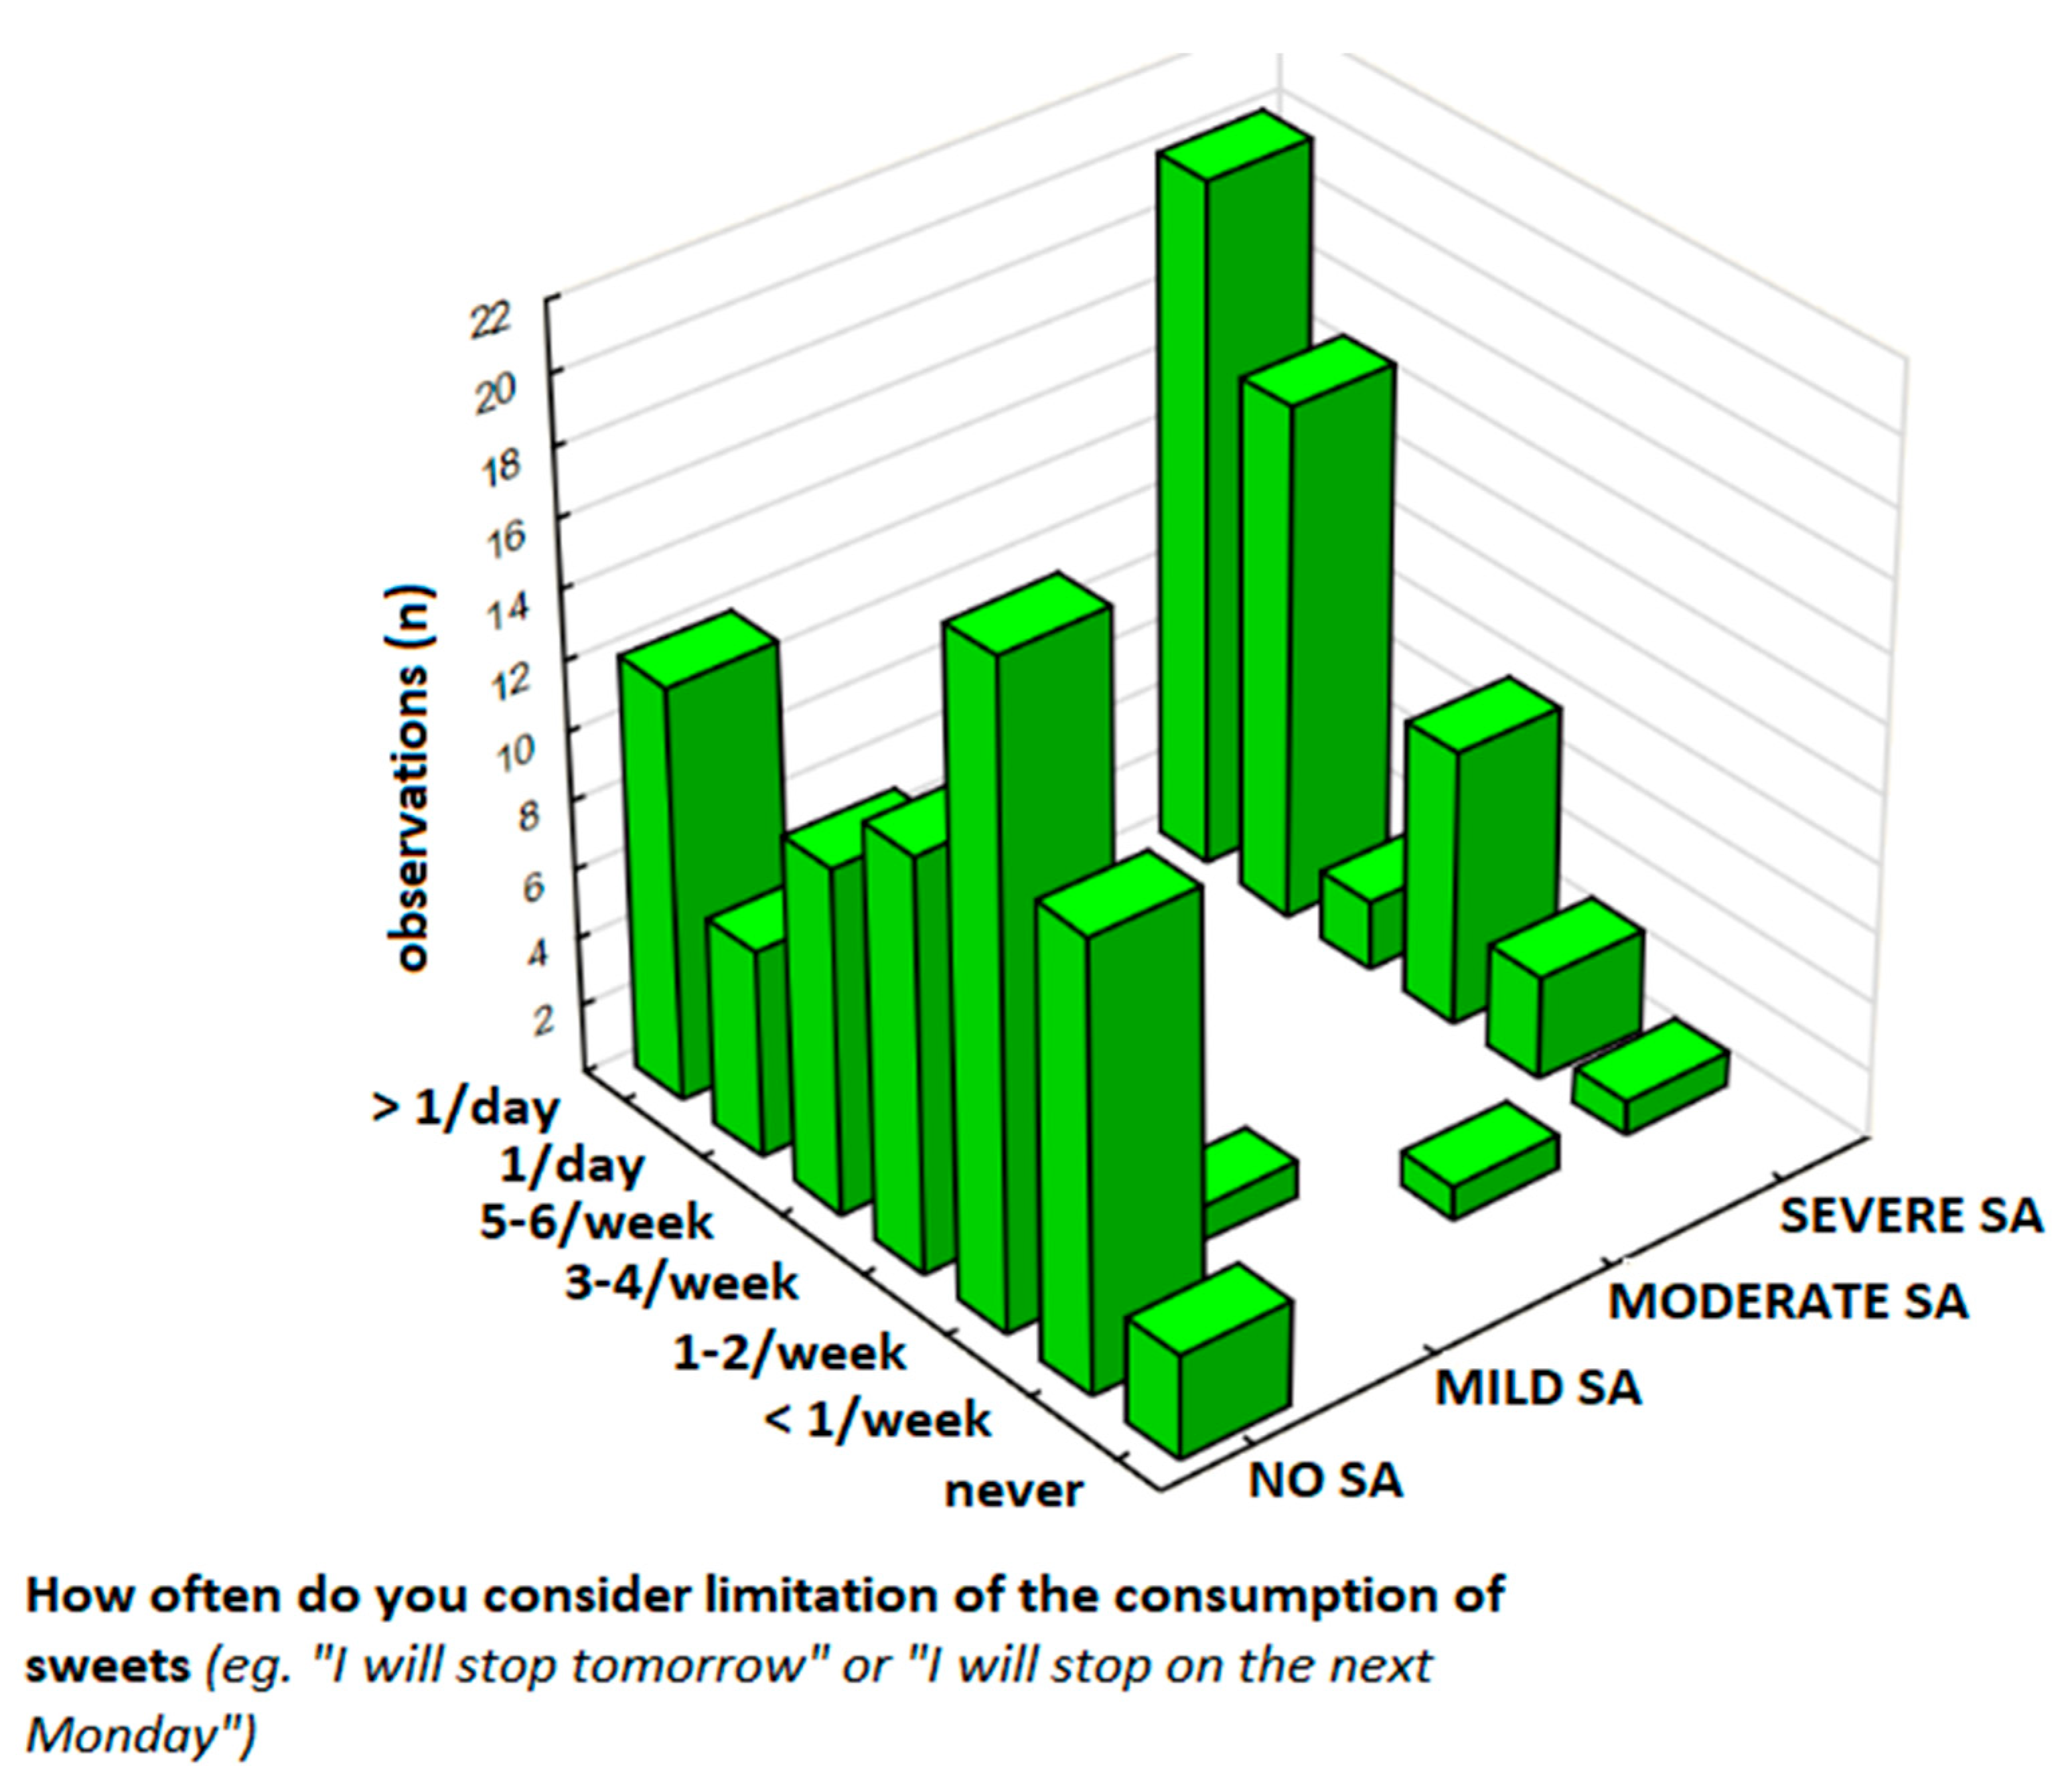
3.4. Patterns of Sweets Restriction Contemplation and Resolution Among Individuals with Sweets Addiction
To assess the individual differences in responses to sweets restriction, frequency of contemplating sweets restriction, experiencing negative emotions, consumption patterns, and persistent desires or unsuccessful attempts to limit sweets consumption were compared between the SA and No SA groups based on the scores reported values on a 7-point scale (for frequencies of contemplation, negative emotions, and sweets consumption, 1 = never, 7 = several times a day:
Table 4,
Table 5 and
Table 6) and binary response (for persistent desire or control attempts, Yes/No:
Table 7) in respect to the following questions on the FFSAS questionnaire: (1) “How often do you experience periods of contemplating restricting sweets? Promise of improvement or resolution ‘from tomorrow,’ ‘from Monday’?” (contemplation and resolutions) (
Table 4), (2) “How often do you experience remorse, guilt, shame, or anger at yourself related to this?” (negative emotions) (
Table 5), (3) “How often do you eat sweets?” (consumption frequency) (
Table 6), and (4) “Is there a persistent desire or unsuccessful attempts to stop or control eating sweets?” (persistent desire/control attempts) (
Table 7).
The differences in sample sizes across
Table 4,
Table 5,
Table 6 and
Table 7 reflect varying levels of response completeness for specific questionnaire items.
Table 4 and
Table 5 were analyzed in a subgroup of 126 participants who provided full responses to the variables included in these analyses.
Table 6, however, was assessed using the total sample of 344 participants, as all participants responded to the relevant items.
Table 7 was evaluated in a different subgroup of 166 participants who completed all items required for that specific analysis. These variations are due to partial missing data and were handled by conducting each analysis only on participants with complete data for the relevant variables. We recognize that these differences in sample size may be confusing and have now clarified them in the manuscript to ensure transparency and reproducibility.
3.4.1. Contemplation, Resolutions, and Negative Emotions
The frequency of contemplating sweets restriction and making resolutions was analyzed in the subgroup of the sample (
N = 126), and the results are presented in
Table 4. The results show that 60% (
n = 75) participants had No SA, 1% (
n = 1) had Mild SA, 1% (
n = 1) had Moderate SA, and 39% (
n = 49) had Severe SA. Notably, 30% of respondents experienced negative emotions ‘several times a day,’ predominantly among those with Severe SA (21%,
n = 27). The Severe SA group reported the highest frequency of contemplating sweet restriction, with 16% (
n = 20) doing this ‘several times a day,’ compared to 10% (
n = 12) in the No SA group. In this group, the contemplation frequency was positively correlated with SA severity (
p < 0.001).
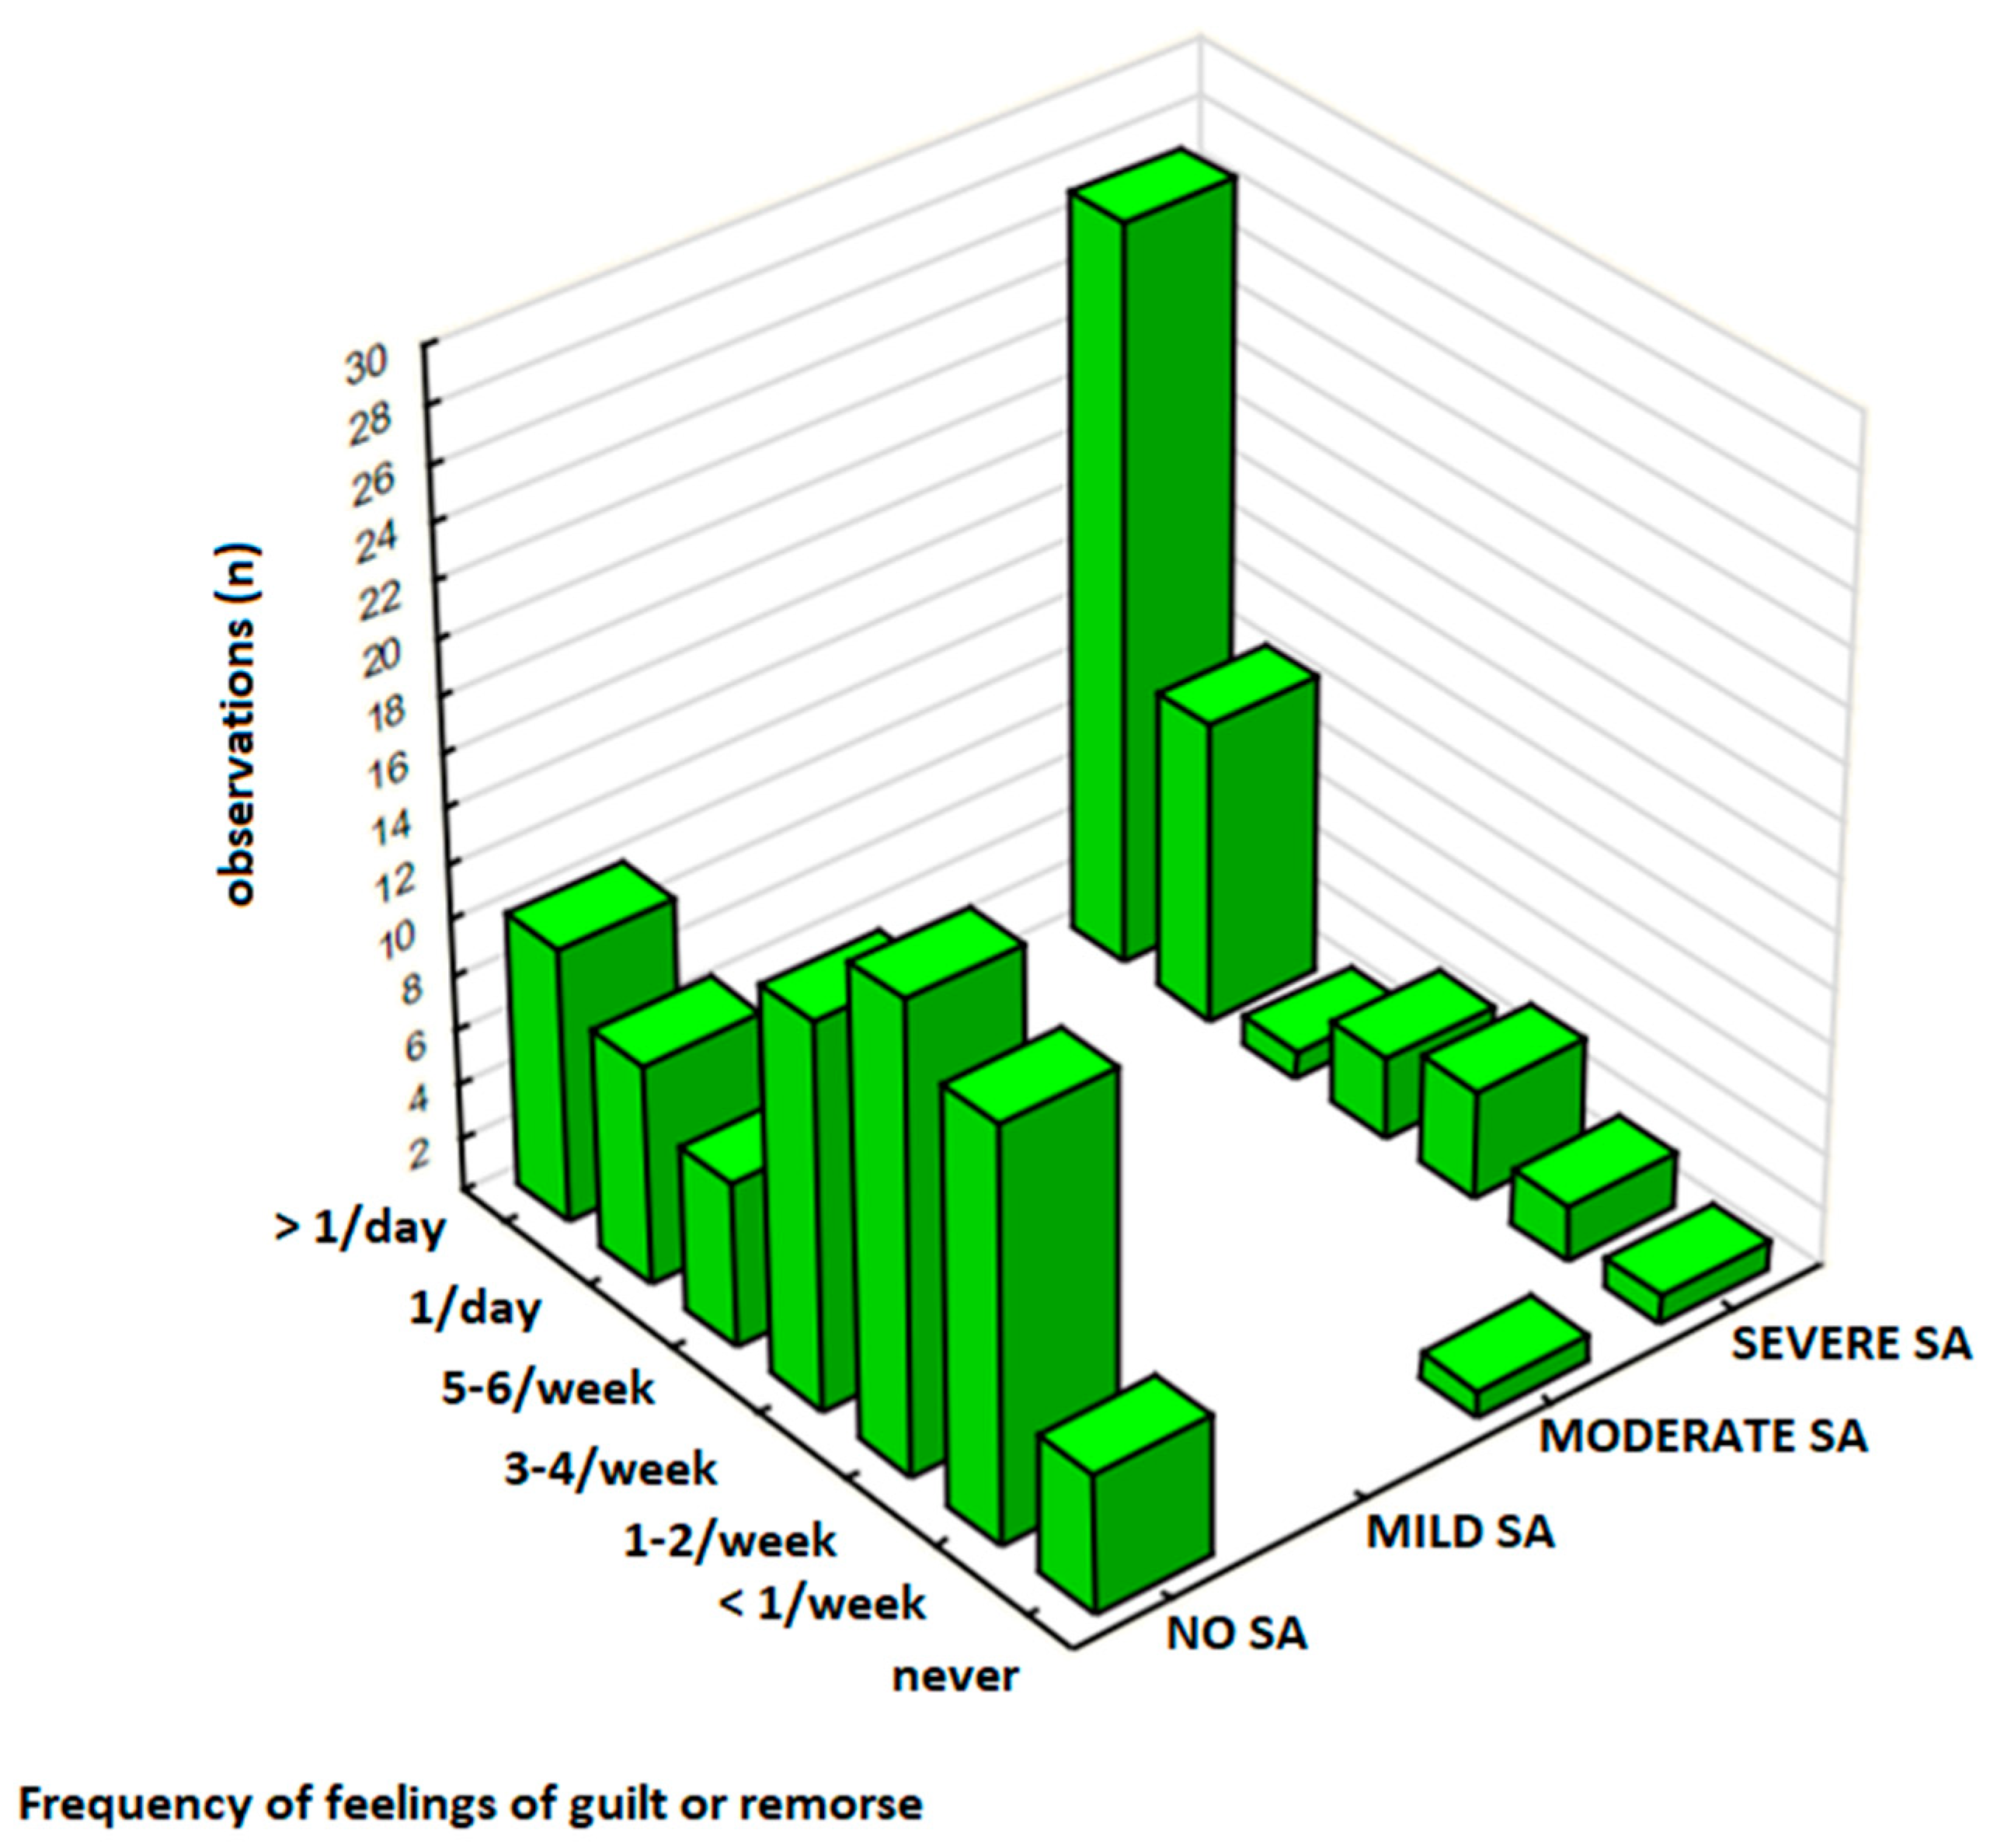
Similarly, the frequency of negative emotions was significantly higher in participants with SA compared to those with No SA (
Table 5). In this subgroup (
N = 126), 30% (
n = 38) responders experienced feelings of remorse, guilt, shame, or anger ‘several times a day,’ including 21% (
n = 27) in the Severe SA group and 8% (
n = 10) in the No SA group (
Figure 3). Statistical analysis revealed a strong association between SA severity and the frequency of experiencing negative emotions (
p = 0.00001) and a moderate-to-strong correlation between these variables (
p < 0.001).
3.4.2. The Frequency of Sweet Food Consumption
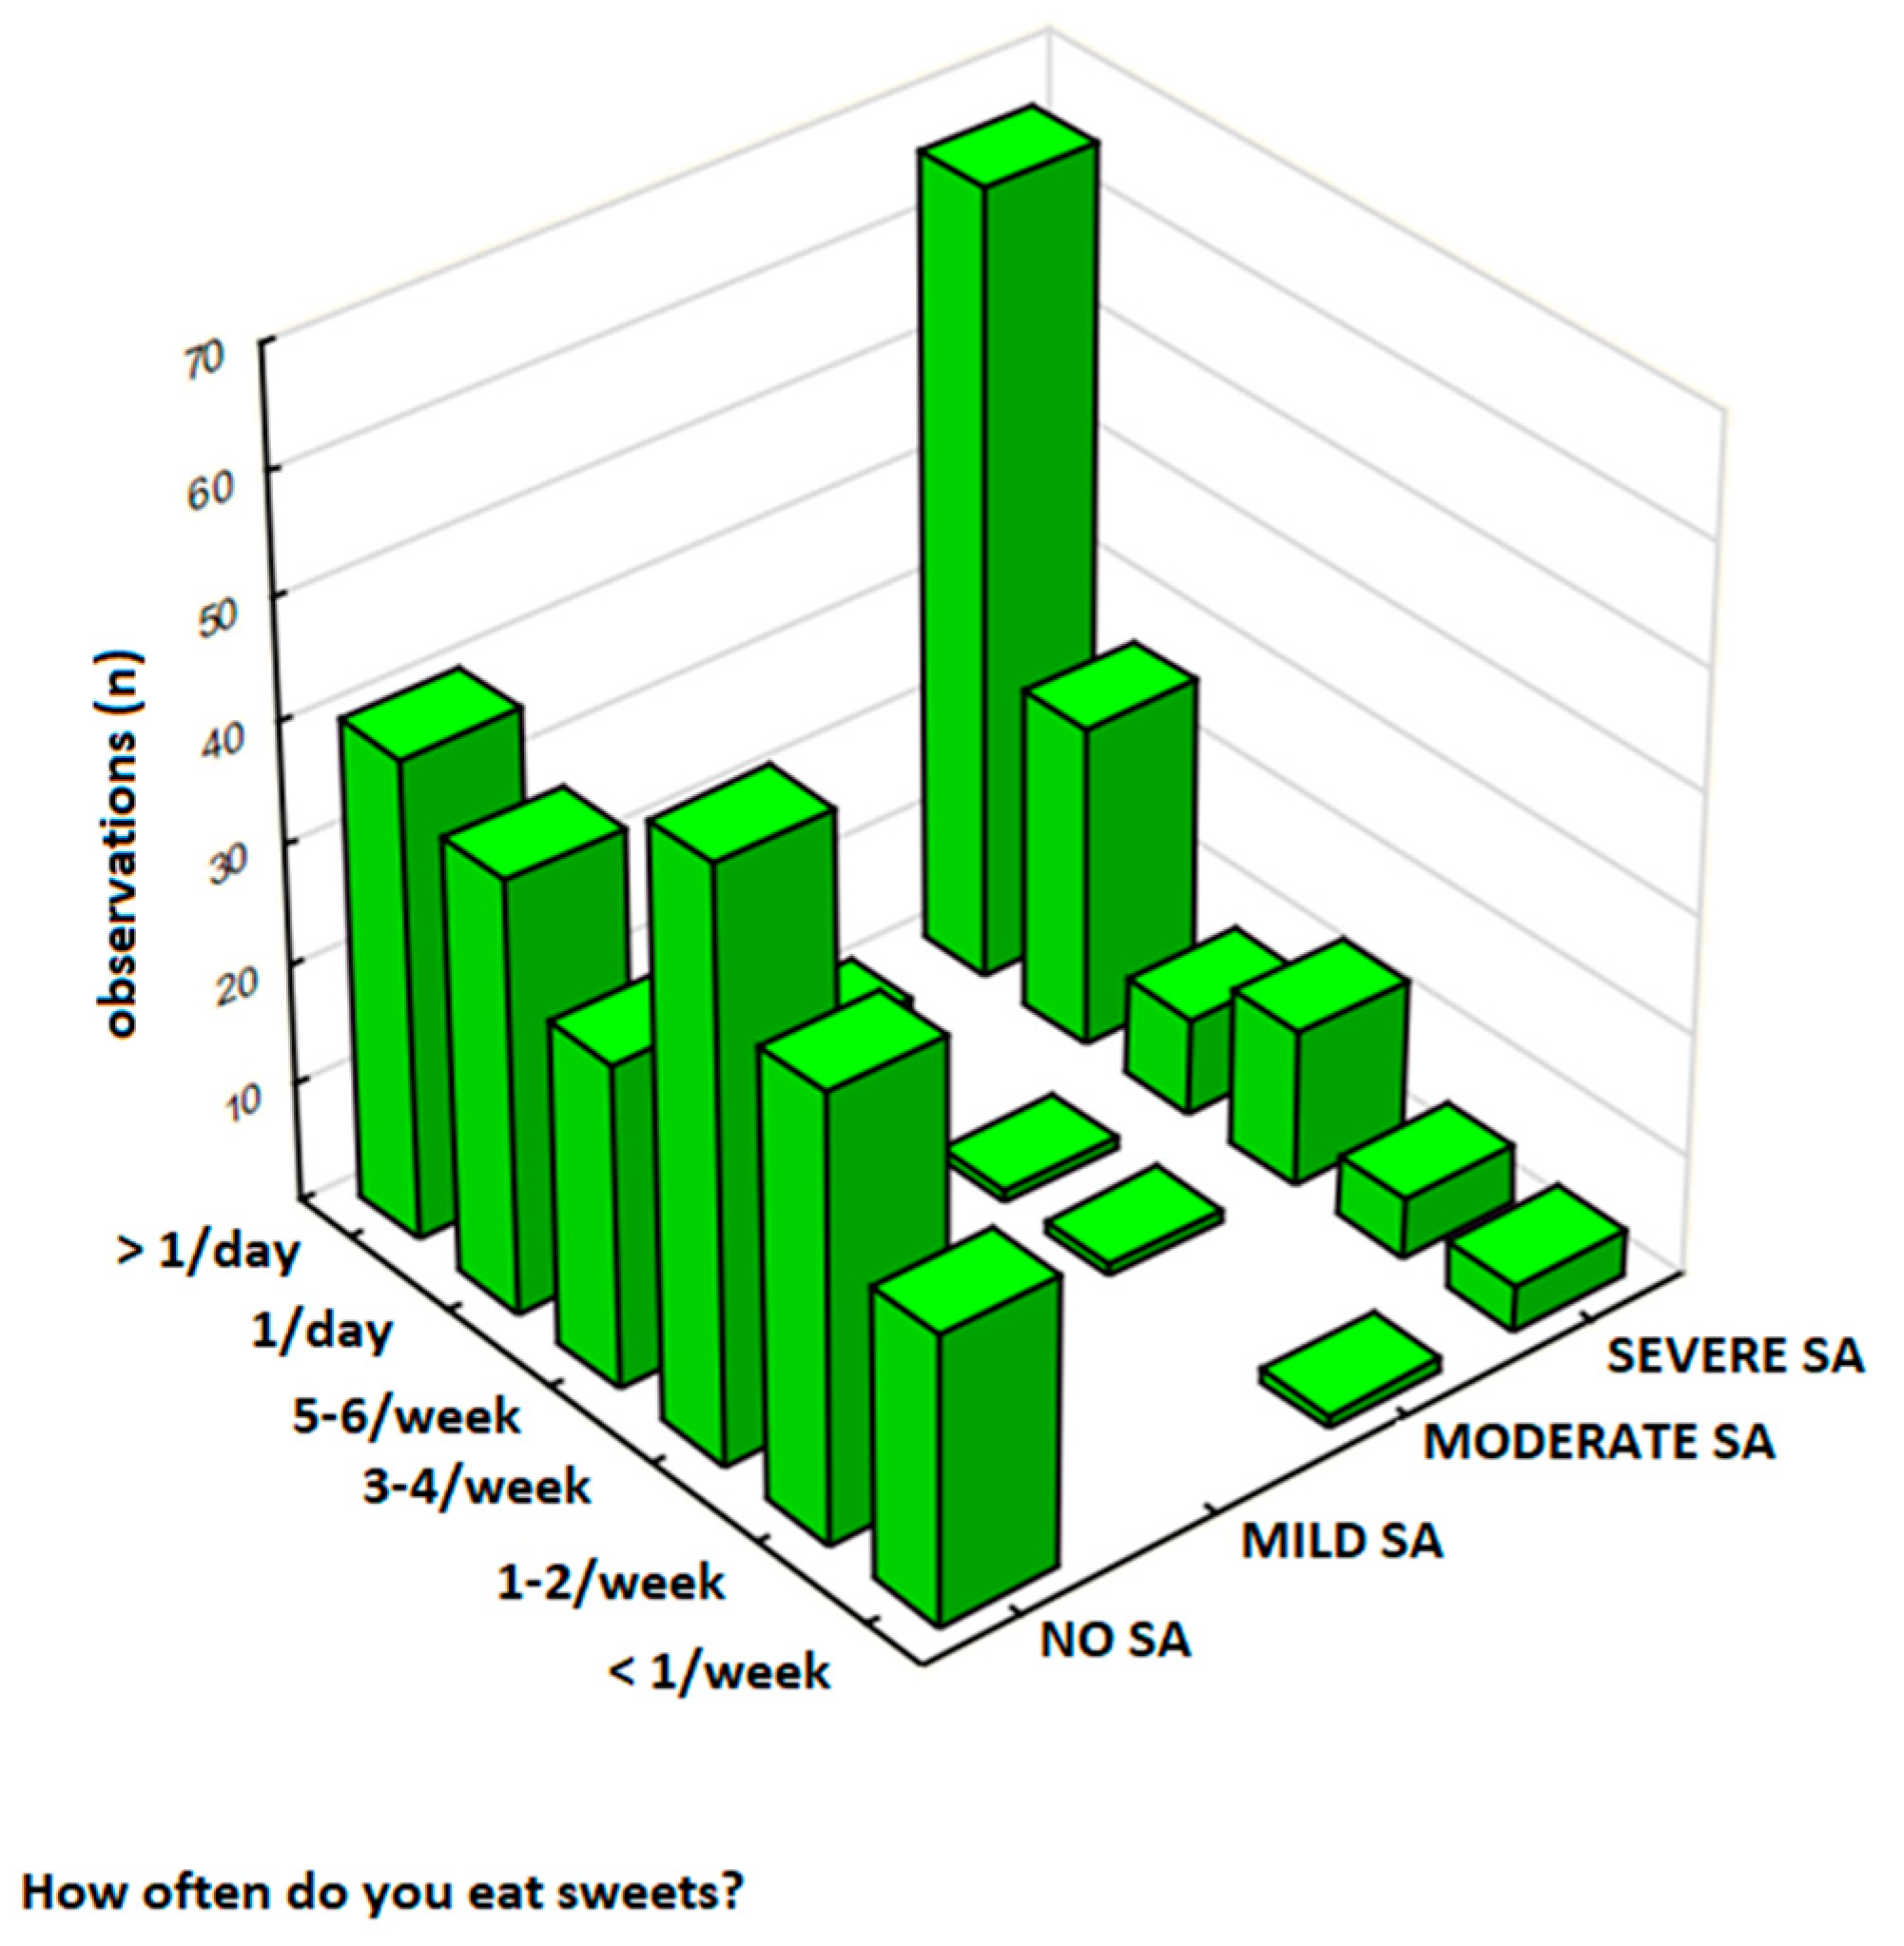
The frequency of sweet food consumption was analyzed in a total sample of 344 participants, and results are presented in
Table 6. In this group, 62% (
n = 213) of respondents were classified as No SA, 1% (
n = 4) as Mild SA, 1% (
n = 4) as Moderate SA, and 36% (
n = 123) as Severe SA. Participants with Severe SA had significantly higher consumption rates, with 19% (
n = 66) eating sweets ‘several times a day’ compared to 12% (
n = 40) in the No SA group. Notably, 31% of respondents reported sweet food intake ‘several times a day,’ with this behavior most frequent among those with Severe SA (19%,
n = 66) compared to No SA (12%,
n = 40) (
Figure 4). In this analysis, there was a strong relationship between SA severity and the frequency of sweets consumption (
p < 0.00001) and a moderate positive correlation between these variables (γ = 0.544,
p < 0.001).
3.4.3. The Persistent Desire and Control Attempts
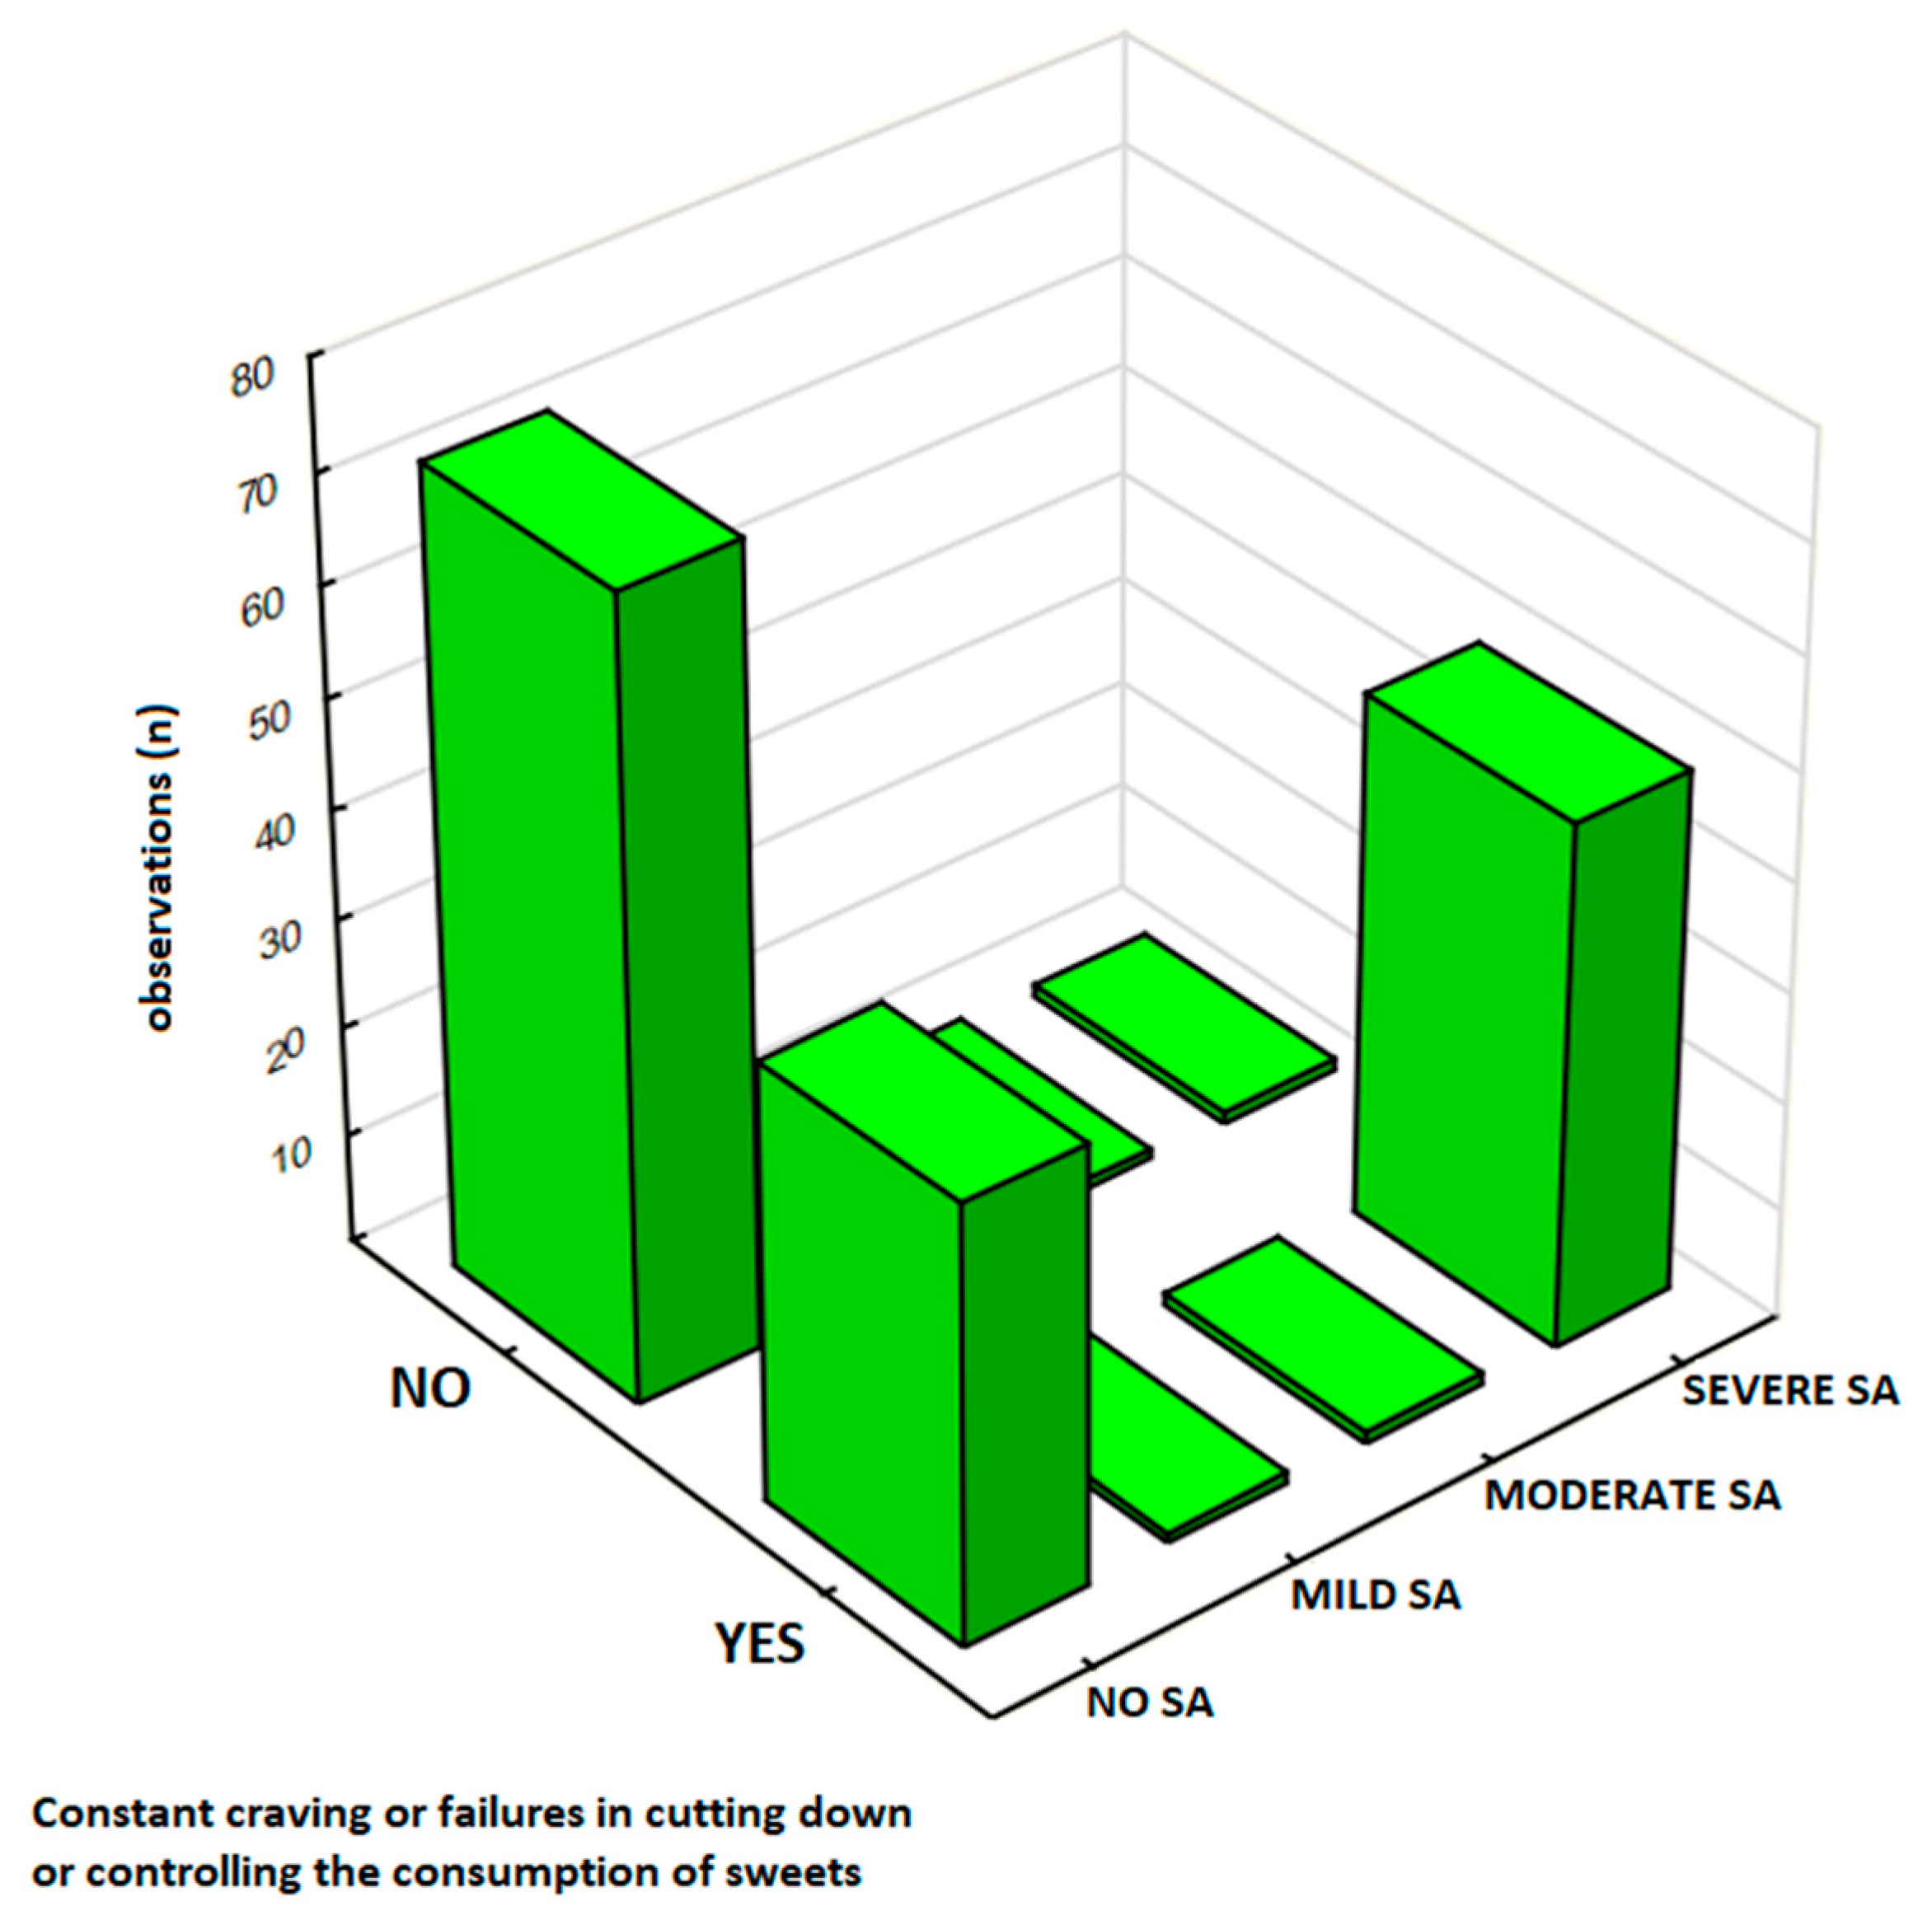
The persistent desire and unsuccessful attempts to control sweet food consumption was analyzed in a sub-sample of 166 respondents, and results are presented in
Table 7. Participants were classified by SA severity: 68% (
n = 113) as No SA, 1% (
n = 2) as Mild SA, 1% (
n = 2) as Moderate SA, and 30% (
n = 49) as Severe SA. The results show that 54% (
n = 90) reported ‘Yes,’ including 29% (
n = 48) in the Severe SA group compared to 24% (
n = 40) in the No SA group. Notably, 54% (
n = 90) of respondents in this study reported experiencing a persistent desire or unsuccessful attempts to control sweets intake, with this response markedly higher among those with Severe SA (29%,
n = 48) compared to No SA (24%,
n = 40) (
Figure 5). In this analysis, there was a significant association between SA severity and the presence of persistent desire or unsuccessful attempts to control eating sweets (
p < 0.00001).
3.5. Assessment of the FFSAS Reliability and Internal Consistency
To assess the internal consistency of the FFSAS based on the preliminary data collected from the Polish population, Cronbach’s alpha (α) was computed for each of the 12 criteria evaluated by the questionnaire (
Table 8). Overall, the FFSAS demonstrated strong internal consistency and reliability, with the overall α = 0.85; nevertheless, these values varied across different subscales, from 0.43 to 0.92. The high internal consistency was reported for Criterion 3, ‘Excessive Time Spent’, which assess the amount of time dedicated to obtaining, consuming, or thinking about sweets, demonstrating particularly high reliability (α = 0.916). This criterion was assessed through items such as “Spędziłem/am dużo czasu na jedzeniu przez cały dzień” (FFSAS9) and “Kiedy słodycze były niedostępne, byłem/am w stanie zrobić wiele, aby je zdobyć” (FFSAS10). Similarly, Criterion 7, ‘Withdrawal Symptoms’, evaluating the physical and emotional symptoms experienced after reducing sweets intake, showed strong internal consistency (α = 0.914). This subscale included five items such as “Kiedy ograniczałem/am lub zaprzestałem/am jedzenia słodyczy, czułem/am się poirytowany/a, nerwowy/a lub smutny/a” (FFSAS19) and “Kiedy ograniczałem/am lub zaprzestałem/am jedzenia słodyczy, miałem/am dolegliwości fizyczne” (FFSAS22).
In contrast, Criterion 10, ‘Use in Hazardous Situations’, determining whether participants consume or think about sweets in contexts that could lead to physical harm, showed lower internal consistency (α = 0.430). Items like “Byłem/am tak rozkojarzony/a przez spożywanie jedzenia, że mógłbym/mogłabym ulec wypadkowi” (FFSAS30) and “Byłem/am tak rozkojarzony/a przez myślenie o jedzeniu, że mógłbym/mogłabym ulec wypadkowi” (FFSAS31) yielded a weak alpha value, suggesting that these items may not consistently reflect hazardous behavior in this population. Also, Criterion 11, ‘Craving’, measuring the intensity and frequency of overwhelming urges to consume sweets, demonstrated weak internal consistency (α = 0.520).
Correlation Between the FFSAS Scores and Behavioral and Emotional Indicators of Sweets Addiction
To further explore the associations between the obtained FFSAS scores and self-reported behavioral and emotional measures, a series of correlations were executed, and results are presented in
Table 9. In this study, significant positive associations were reported between FFSAS scores and several self-reported behaviors and emotional responses related to sweets consumption. Specifically, FFSAS scores were moderately correlated with self-identified sweets addiction (ρ = 0.38,
p < 0.05) and frequency of sweets consumption (ρ = 0.3919,
p < 0.05). A similar pattern was observed with feelings of guilt or remorse (ρ = 0.3497,
p < 0.05), as higher the FFSAS scores were associated with stronger emotional distress regarding sweets consumption. Furthermore, the number of days per week with sweets consumption was strongly correlated with FFSAS scores (
p < 0.05).
3.6. Preliminary Validation and Factor Extraction of the FFSAS Questionnaire
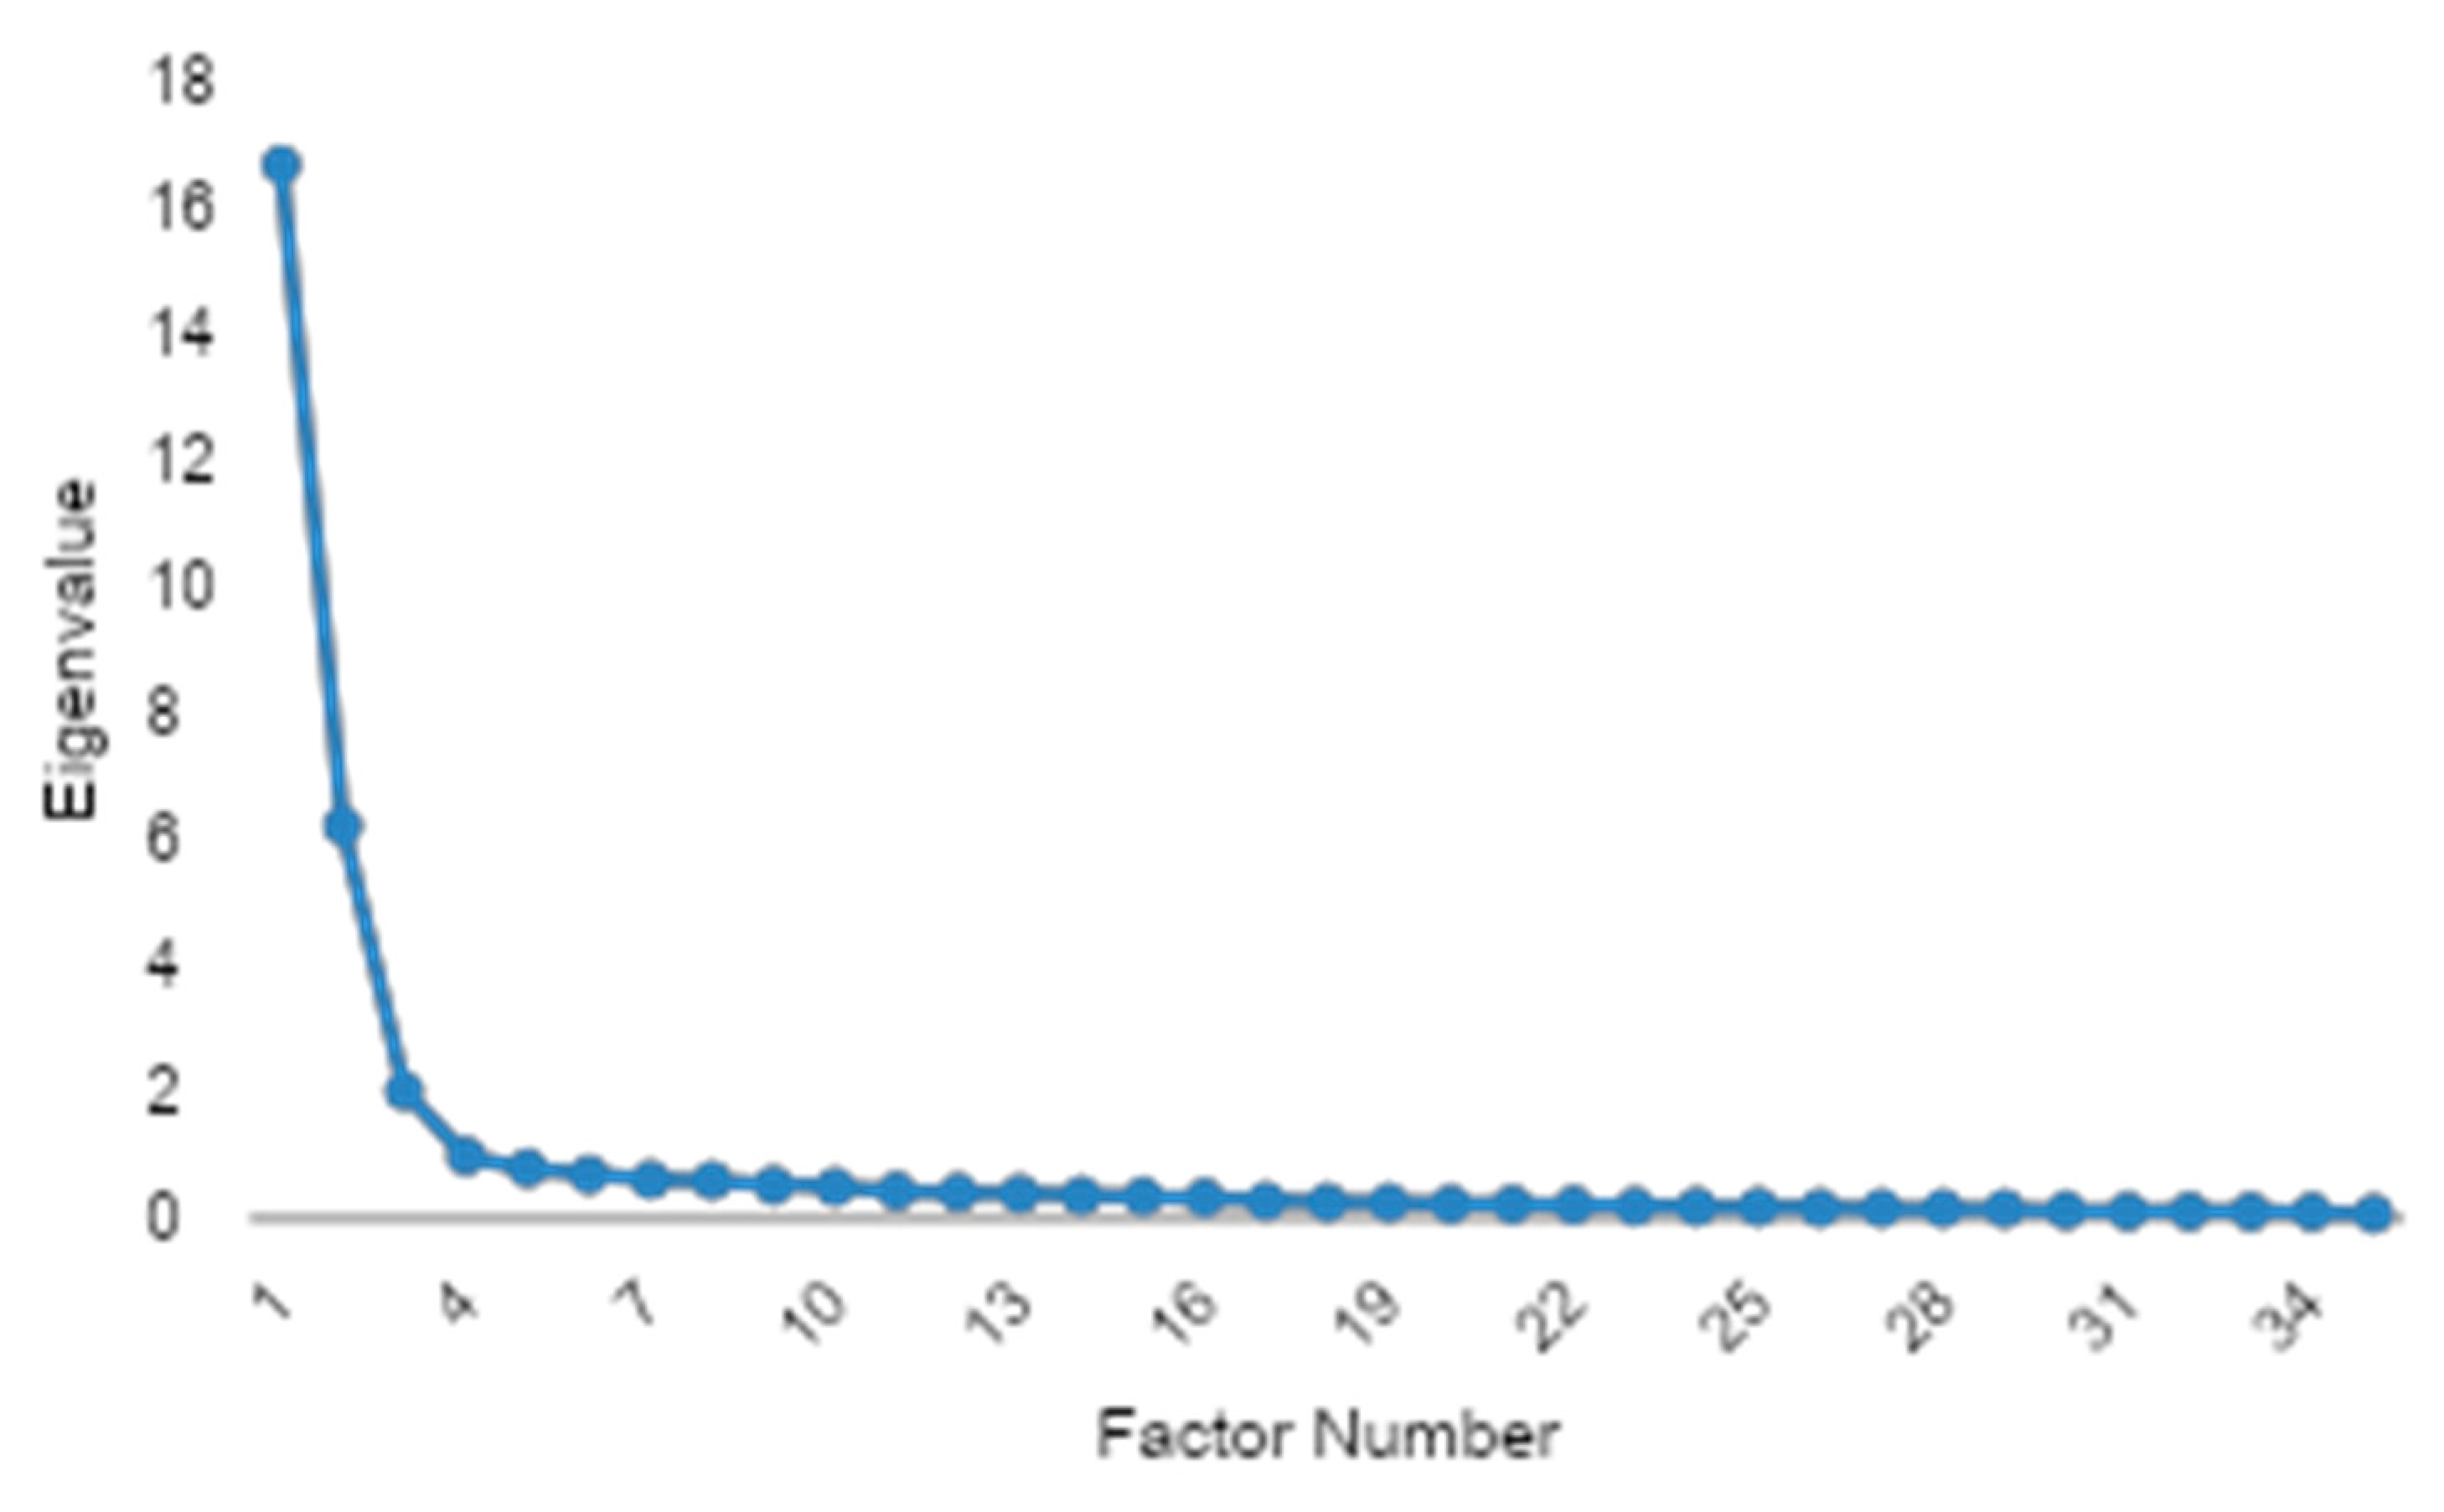
To evaluate the structure of the FFSAS and ensure its psychometric properties, an EFA was conducted. Briefly, the applied Kaiser–Meyer–Olkin measure (KMO = 0.956) demonstrated excellent sampling adequacy, and Bartlett’s test of sphericity was highly significant (
p < 0.001), confirming robust inter-item correlations and validating the dataset’s suitability for factor analysis. The number of factors was determined via the scree plot elbow criterion, which indicated a three-factor solution as the optimal point where eigenvalues began to level off sharply after the third component (
Figure 6). The communality analysis revealed a high average communality of 0.686, with no variables below the 0.4 threshold and only one variable falling below 0.5, indicating that nearly all items were well-represented by the extracted factors.
The EFA indicated a robust three-factor structure, explaining 68.6% of the total variance. Thirty-seven percent of items exhibited cross-loadings, primarily between craving and loss-of-control constructs, suggesting nuanced interrelationships in sugar addiction phenotypes (
Table 10). Each of the three extracted factors (subscales) demonstrated exceptional internal consistency (Cronbach’s α ranging from 0.951 to 0.962), though the high reliability coefficients and factor loadings above 0.90 for 18-item scales suggest potential item redundancy, necessitating future scale refinement to eliminate overlapping constructs while retaining psychometric robustness.
A CFA was subsequently conducted to validate the hypothesized factor structure, with the model explicitly defined according to the theoretical framework of the FFSAS, which operationalizes 12 diagnostic criteria. The CFA results demonstrated suboptimal fit (CFI = 0.74, TLI = 0.69, RMSEA = 0.14), prompting a potential reassessment of the FFSAS’s theoretical structure and necessitating item-level revisions to address cross-loadings and improve factorial validity. The statistically significant chi-square (χ
2 = 3761.76,
p < 0.001) confirmed model-data misfit, consistent with imperfect fit indices, necessitating post hoc model modifications to better align with the empirical covariance structure (
Table 11). CFA revealed that, while several items loaded strongly onto their intended factors (e.g., FFSAS1 on CR01 and FFSAS5 on CR03 both with loadings of 1.0), some parameters exhibited atypically high values, such as FFSAS12 (loading = 63.44 on CR07) and FFSAS35 (loading = 21.46 on CR08), which may indicate estimation or model specification issues. A few items, including FFSAS9, demonstrated substantial cross-loadings, suggesting some overlap between latent constructs. Additionally, certain items, such as FFSAS33 (loading = 0.39 on CR10) and FFSAS34 (loading = 0.25 on CR10), showed relatively low factor loadings, which could reflect weaker associations with their respective factors. Despite these observations, the overall pattern of loadings provides valuable insights into the factorial structure of the scale and highlights areas for potential refinement. These results suggest that further review of specific items and possible model adjustments may enhance the psychometric properties and theoretical alignment of the instrument [
27].
4. Discussion
The primary objective of this study was to evaluate the factor structure, psychometric properties, and external validation of the newly developed FFSAS, aimed at assessing sweets addiction. This scale, as an adaptation of the YFAS 2.0 dedicated to identifying addictive-like behaviors related to sweet food consumption in the general adult Polish population, demonstrated good overall reliability (α = 0.85). While the FFSAS showed moderate correlations with self-reported frequency of sweets intake (ρ = 0.39) and feeling of guilt upon their consumption (ρ = 0.35), indicating its ability to identify alerted eating habits specifically linked to UPFs rich in added sugar, future studies should aim to establish stronger associations with more objective behavioral or clinical outcomes to further solidify its criterion validity. Results of this pilot study using FFSAS indicated that a higher frequency of contemplating restriction and making resolutions among participants with SA was associated with the cycle of addiction, supporting the validity of FFSAS. Furthermore, the validation identified items of the FFSAS (e.g., FFSAS9, FFSAS15, FFSAS30) for refinement due to weaker subscales (α < 0.60), suggesting that future iterations could enhance psychometric properties.
Exploratory factor analysis (EFA) revealed a robust three-factor structure, explaining 68.6% of the variance. The individual subscales derived from this EFA demonstrated excellent internal consistency, with Cronbach’s α values ranging from 0.951 to 0.962. However, 37% of items showed cross-loadings, particularly between craving and loss-of-control constructs, and some items (e.g., FFSAS35, communality = 0.43) exhibited low communality, indicating potential redundancy or weak factor representation. Subsequently, Confirmatory Factor Analysis (CFA) showed suboptimal model fit (CFI = 0.74, TLI = 0.69, RMSEA = 0.14, χ2 = 3761.76, p < 0.001). Some items displayed atypically high loadings (e.g., FFSAS12 = 63.44, FFSAS35 = 21.46) or low loadings (e.g., FFSAS33 = 0.39, FFSAS34 = 0.25), suggesting potential estimation issues or construct overlap. These findings highlight the need for item-level revisions to improve factorial validity and reduce redundancy, providing a foundation for refining the FFSAS in future studies.
Compared to prior studies, FFSAS aligns with YFAS 2.0 findings, where approximately 15–20% of community samples meet food addiction criteria, with higher rates in females and overweight individuals [
24,
28]. This study, comprising 78% females with a mean BMI of 27.86 kg/m
2, reflects these demographics, and the 62% self-identification as sweets-addicted (
Table 2) underscores the scale’s relevance for sugar-focused compulsive eating. While the FFSAS shows promise in capturing sweets-specific addiction behaviors, the variability in item clarity and construct representativeness aligns with challenges seen in validating other food addiction scales, resultant from the complexity of defining food addiction and the inconsistencies in scale performance across different populations [
29]. A series of correlation analyses between FFSAS items unraveling moderate associations with self-reported sweet food consumption frequency is consistent with other studies which suggest that food addiction constructs may not directly translate to simple consumption measures [
30]. In addition, significant associations between feeling of guilt and emotional distress related to sweet food intake reported in this study provide early evidence supporting the notion that psychological factors play a crucial role in addictive-like eating behaviors, linking emotional dysregulation to excessive food intake [
31]. Unlike general food addiction tools, FFSAS’s specificity to UPFs rich in added sugar may detect problematic alerted eating behaviors missed by broader measures, consistent with research highlighting sugar-rich foods as key triggers of addictive-like eating and contributors to metabolic disturbances [
32].
Although the exact mechanisms through which addictive-like behaviors arise from regular consumption of sweet food in large amounts under psychological triggers like negative emotional states and stress remain unclear, experimental evidence suggests that excessive sweet intake activates dopamine reward pathways, paralleling drug addiction [
21]. Animal studies have shown that sugar bingeing leads to tolerance and withdrawal, with dopamine receptor downregulation resembling substance dependence [
33]. Neuroimaging studies with human participants have supported this, indicating a possible role of reward responses to sweet cues in food-addicted individuals [
24,
34,
35]. These findings collectively support the involvement of neurobiological pathways in certain types of dependence on sugary foods, including urgency of cravings and loss of control [
34,
35,
36].
The FFSAS scale was created based on a combination of psychological theories and eating behavior research, making it essential to evaluate its validity and reliability in non-clinical settings to ensure suitability for general populations [
29]. Given that sweets addiction is associated with various psychological and behavioral factors, including emotional eating, impulsivity, and compulsive consumption [
30,
31,
37,
38], it is crucial to examine how effectively the FFSAS reflects these constructs. Consequently, the second part of this study focused on validation, which confirmed the clarity, content validity, linguistic appropriateness, and construct representativeness of the FFSAS questionnaire. Items FFSAS4 and FFSAS19 received the highest clarity scores, indicating strong conceptual representation, while FFSAS15 and FFSAS30 were rated lower, suggesting a need for revision. Similar trends were observed in content validity and construct representativeness, with items such as FFSAS28 and FFSAS30 scoring lower, highlighting areas for improvement. These findings are consistent with previous food addiction research on tools like the mYFAS 2.0, which also showed variability in factor structures depending on the population and cultural context [
39,
40,
41].
Furthermore, our results indicate that higher FFSAS scores were associated with emotional distress and impulsive eating behaviors, aligning with existing literature linking sweet food addiction to emotional dysregulation and stress [
31,
37,
42]. This supports the scale’s utility in identifying individuals at risk for maladaptive eating patterns, such as compulsive consumption and loss of control over sweets intake [
24]. Notably, items related to behavioral patterns received higher expert ratings than those addressing emotional implications, suggesting that the scale currently places greater emphasis on observable behaviors. This distinction mirrors findings in other research on behavioral versus emotional components of addiction [
42,
43]. Future development of the FFSAS should consider enhancing its capacity to capture both dimensions, thereby improving its diagnostic depth and applicability in diverse psychological contexts.
In summary, while the FFSAS shows promise as a tool for assessing sweets-specific addiction, particularly in overweight women, its structure and usability require further refinement. Future research should focus on validating the scale in larger, more diverse populations, including clinical groups (e.g., individuals with obesity or eating disorders), and employing longitudinal designs to assess its predictive validity. Clinically, the FFSAS could aid in identifying at-risk individuals, enabling tailored interventions such as psychodietetic counseling and behavioral therapy for sweets cravings, and ultimately contributing to improved patient outcomes and public health strategies.
5. Limitations
This study has several limitations that should be considered when interpreting the findings. Firstly, the sample was predominantly female (78%) and relatively limited in size, which may affect the generalizability of the findings to broader populations, including men. Secondly, participants were recruited online through the FitMIND Foundation, an organization focused on eating behaviors. This recruitment method likely attracted individuals already interested in their eating habits, potentially introducing selection bias and possibly inflating the observed correlations between FFSAS scores and self-reported behaviors like sweets consumption and guilt.
Furthermore, the reliance on self-reported data for sweets consumption, emotional responses, and anthropometric measures (BMI) might be subject to recall bias or social desirability bias. The expert panel validation, while valuable for assessing content validity, revealed variability in ratings for several items (e.g., FFSAS15 and FFSAS30), indicating that these may require revision to improve clarity and relevance. The suboptimal model fit observed in the confirmatory factor analysis (CFA) (CFI = 0.74, TLI = 0.69, RMSEA = 0.14) underscores the need for further item refinement and additional CFA in larger, more diverse samples to confirm the scale’s factorial structure and improve its construct validity. Future iterations should also include test–retest reliability testing.
The cross-sectional design of the study limits our ability to draw causal inferences. The focus solely on sweets excludes other food categories that might contribute to addiction-like eating behaviors. Lastly, while the FFSAS scale was externally validated by an expert panel, the sampling method for expert evaluations might also introduce a degree of selection bias, reflecting specific theoretical viewpoints. Future research should prioritize larger, more diverse samples, employ longitudinal designs to assess predictive validity, validate the FFSAS in clinical populations, and explore measurement invariance across different demographic groups.


 ,
, 
