Article

How Did the Dietary Behavior of Older Korean Adults Change During the COVID-19 Pandemic?

1
Department of Food Sciences, National Institute of Crop and Food Science, Rural Development Administration, Wanju 55365, Republic of Korea
2
Department of Gerontology, AgeTech-Service Convergence Major, Graduate School of East-West Medical Science, Kyung Hee University, Yongin 17104, Republic of Korea
*
Author to whom correspondence should be addressed.
Nutrients 2025, 17(12), 1973; https://doi.org/10.3390/nu17121973
Submission received: 1 February 2025 / Revised: 8 February 2025 / Accepted: 9 February 2025 / Published: 11 June 2025
(This article belongs to the Section Geriatric Nutrition)

Abstract

Objectives: This study comparatively evaluated changes in the food habits and dietary patterns of adults aged ≥65 years before and during the coronavirus disease 2019 (COVID-19) pandemic using a retrospective study. Methods: Data covering the 2018–2021 period were derived from the Korea National Health and Nutrition Examination Survey. Results: Comparing the 2943 individuals in the “Before-COVID-19” individuals with the 2916 people in the “During COVID-19” group, the frequency of drinking four or more times a week decreased among the older adults during the pan-demic, as did the frequency of eating three meals a day and eating-out at least once a week. On the other hand, food security improved during the pandemic compared with before the pandemic. During the pandemic, the intake of cereals and grains decreased, while that of potatoes and starches, legumes, vegetables, eggs, milk and dairy products, and oils and fats increased. Although energy and carbohydrate intake decreased, protein, fiber, calcium, phosphorus, magnesium, potassium, zinc, riboflavin, vitamin E, vitamin C, folic acid, and fat intake increased. However, the intake of vitamin A, vitamin C, and calcium remained lower than the estimated adequate requirement of the Dietary Reference Intakes for Koreans. Additionally, the rate of nutritional insufficiency “During COVID-19” (20.76%) was 1.31–1.42 times higher than that “Before COVID-19” (16.45%). Even in models that adjusted for other factors, the rate of nutritional insufficiency was higher during the pandemic than before. Conclusions: Based on these findings, measures such as dietary education programs and guidelines for proper nutrient intake should be formulated to prevent imbalances in nutrient intake among older Koreans.

1. Introduction

Coronavirus disease 2019 (COVID-19), an infectious disease caused by severe acute respiratory syndrome coronavirus 2, was first identified in December 2019 in Wuhan, China, and has since spread worldwide [1]. In January 2020, the World Health Organization (WHO) declared it an international public health emergency. Subsequently, on 11 March 2020, COVID-19 was elevated to pandemic status [1,2,3]. To contain the spread of this contagious respiratory disease, numerous countries implemented diverse measures, including social distancing, movement restrictions, diagnostic testing, quarantine, and vaccination [2,4,5,6].
According to several studies, the level of physical activity decreased owing to the COVID-19 pandemic, mainly because of lockdown measures and social distancing [7,8,9,10]. In Poland, lockdown measures implemented to restrict movement owing to the COVID-19 pandemic resulted in significant increases in weight gain, meal frequency, and snack consumption [11]. Another study conducted abroad revealed that during the COVID-19 pandemic, restrictions on daily activities led to people spending more time at home instead of participating in their usual activities. Changes in lifestyle habits, including weight gain, reduced physical activity, and an increase in home-cooked and delivered meals, were also reported [12]. Meanwhile, the COVID-19 pandemic also affected food security globally. Household food insecurity reportedly increased in 2020, a period when the pandemic persisted in certain countries, including the United Kingdom and United States [13,14,15]. Such economic vulnerability and the collapse of food distribution networks owing to pandemic conditions, such as movement restrictions and lockdowns, are presumably related to various dietary problems, as reported by several previous studies [15,16,17].
On the other hand, South Korea’s COVID-19 prevention efforts received considerable international attention in the early days of the pandemic (February and March 2020) owing to South Korea’s geographical proximity to China and the frequent person-to-person exchanges, including travel and trade [18,19]. In the second half of 2020, South Korea reported fewer COVID-19 cases and deaths than other industrialized countries. Although social gatherings were restricted owing to social distancing measures, South Korea did not impose a strict national lockdown at that time. However, as in other countries, COVID-19 affected South Koreans’ daily lives, including their diets [2,20,21]. Studies comparing changes in health behaviors and dietary habits among Koreans before and during the COVID-19 pandemic have been reported. In a previous study using data from the Korea Youth Health Behavior Online Survey (2019–2020), adolescents aged 12–18 years increased the frequency of breakfast consumption and strength training during the COVID-19 pandemic while decreasing the frequency of aerobic exercise and consumption of fruits, fast food, and carbonated and sweet beverages [22]. In adults, weight and waist circumference increased during the COVID-19 pandemic, while physical activity, the frequency of breakfast consumption, the frequency of eating out, and total energy intake decreased [3,23,24]. In the case of the older adults, it has been reported that the frequency of going out decreased during the COVID-19 pandemic due to social distancing, self-quarantine, and the closure of welfare facilities for the elderly and that psychological depression increased as a result of living at home [25]. Other previous studies found that average sleep duration increased and the frequency of eating out decreased, but dietary habits were little affected [26,27].
In this study, we hypothesized that social distancing, reduced outdoor activities, and the fear of disease owing to the COVID-19 pandemic might have affected the dietary habits of older Koreans, a vulnerable group. Previous studies on COVID-19 and the dietary habits of older Koreans have primarily focused on nutrient intake during the pre-pandemic (2019) and pandemic (2020) periods [26,28]. Therefore, previous studies are considered to have limitations in inferring the pandemic’s impact on the dietary habits of older Koreans. This is because these studies all compared data from 2019 and 2020 and are, therefore, limited in identifying the long-term impact of the COVID-19 pandemic [26,28]. For this reason, this study compared the dietary habits, energy and macronutrient intakes, and food group intakes of older Koreans between two time periods: “Before the COVID-19 pandemic (2018–2019)” and “During the COVID-19 pandemic (2020–2021)” using data from the Korea National Health and Nutrition Examination Survey (KNHANES). Ultimately, we endeavored to provide baseline data for establishing effective diet and nutrition policies to prepare for similar health crises in the future.

2. Materials and Methods

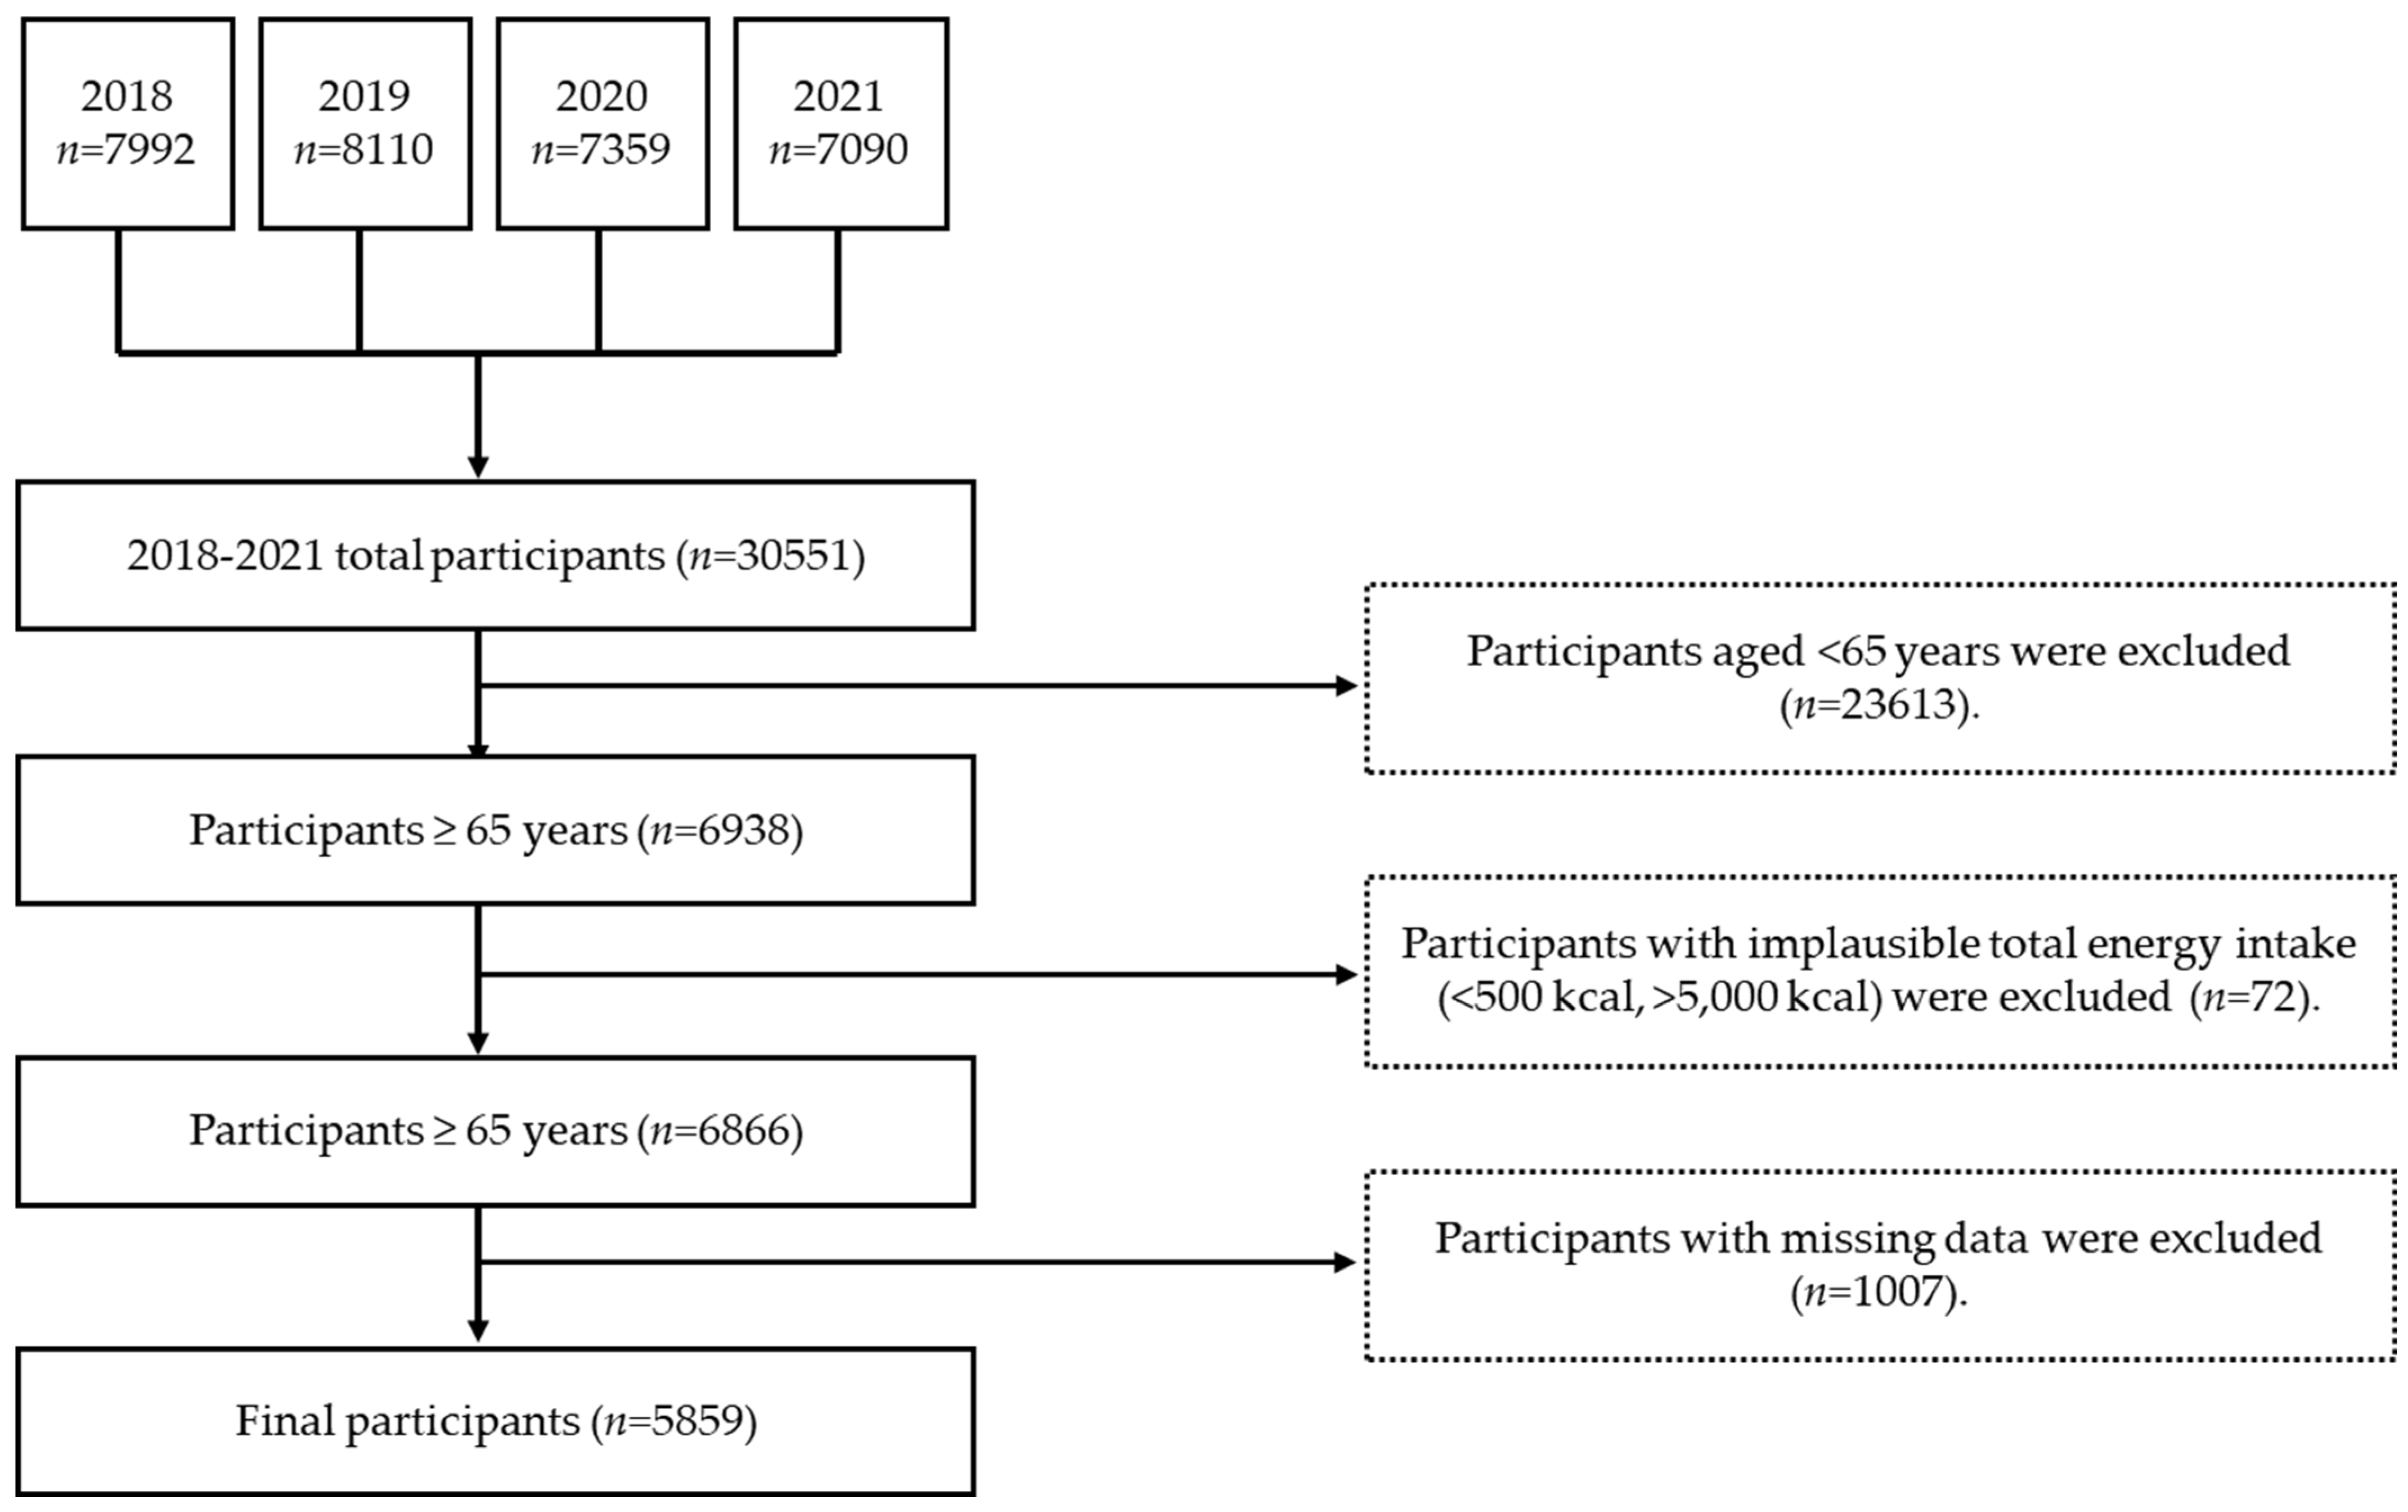
2.1. Study Population and Design

This cross-sectional study used 2018–2021 KNHANES data. The KNHANES is a continuous surveillance system that assesses the nutritional health status of and prevalence of chronic diseases in a vast, representative sample of the Korean population. The KNHANES, conducted annually by the Korea Disease Control and Prevention Agency, comprises a health interview, health examination, and nutrition survey [29,30].
Research participants were selected based on previous studies [30,31,32], and the process was as follows: The study used raw data (n = 30,551) from the 2018–2021 KNHANES. The main study population comprised older adults (age: ≥65 years) who had participated in the health and dietary surveys (24 h recall survey; n = 6938). Based on methods used in previous studies [31,32], participants with a total daily calorie intake <500 or >5000 Kcal (n = 72; i.e., participants with an insufficient or unusually high dietary intake) were excluded from this study. In addition, dietary survey participants with missing data (n = 1007) were also excluded from the analysis. Ultimately, 5859 participants were selected (Figure 1). This study was approved by the Institutional Review Board (IRB) of the Korea Disease Control and Prevention Agency <IRB approval numbers: 2018 KNHANES, 2018-01-03-P-A (approval date: 12 January 2018.); 2019 KNHANES, 2018-01-03-C-A (approval date: 19 December 2018.); 2020 KNHANES, 2018-01-03-2C-A (approval date: 26 June 2020.); 2021 KNHANES, 2018-01-03-5C-A (Approval date: 23 April 2021.)>.
This study’s independent variable (i.e., the pre-pandemic-pandemic period) was classified as follows: “Before COVID-19” (2018–2019) and “During COVID-19” (2020–2021) approval date: 3 January 2018.
Figure 1. Participant selection flowchart.
Nutrients 17 01973 g001

2.2. General Characteristics

This analysis was conducted based on the respondents’ gender, age, marital status, education level, region, employment status, and household income. Age categorization was based on the following research. Research on food security and related characteristics reveals that South Korea’s rapidly aging population has led to an expansion of the older population’s age range. The accelerated growth of the over-65 population, especially those aged ≥75 years, has rendered it difficult to consider those aged ≥75 years part of a homogeneous group encompassing those aged 65–74 years [33]. In addition, according to the report of 2017 Investigation of the Older Adults Condition, the proportion of the over-65 population aged 65–74 years is approximately 57%, while that of the over-65 population aged >75 years approximates 43% [33,34]. Therefore, this study categorized the participants into 65–74 and >75-year age groups. Marital status was classified as single or married; education level as high school graduate or lower, community college graduate, or four-year college graduate or higher; and occupational status as employed or unemployed. Region was categorized into urban and rural (based on town, city, or country) and household income level into upper, upper-middle, middle-lower, and lower.

2.3. Health Behavior

Health behavior data were collected on five key indicators: smoking status, alcohol consumption, stress level, exercise frequency, and weight status. Smoking status was classified as “never smoker”, “former smoker”, or “current smoker”. Drinking frequency was classified into the following four categories based on the 1-year drinking frequency questionnaire included in the KNHANES: “four or more times per week”, “2–3 times per week”, “1–4 times per month”, and “less than once per month”. Based on the “Usually Perceived Stress Level” questionnaire included in the KNHANES, stress level was also classified into four categories: “severe stress”, “moderate stress”, “mild stress”, and “no stress”. Exercise frequency was classified into four categories: “less than 1 day per week”, “1–2 days per week”, “3–4 days per week”, and “more than 5 days per week”. Weight status was classified according to the standards of the WHO’s Asia–Pacific Region and Korean Society for the Study of Obesity [35,36]. Body mass index (BMI) values of <18.5, 18.5–23.0, 23.0–25.0, and >25.0 kg/m2 were classified as underweight, normal, overweight, and obese, respectively.

2.4. Dietary Habits

Dietary habits were surveyed using five questions, covering breakfast frequency, snack consumption, cooking location, frequency of eating out, and food security. Food preparation location was classified using the “n_mtype” variable, which considered whether or not the food was eaten, aligning with previous studies’ categorizations [32]. “Home meals” refer to food and packed lunches prepared at home, whereas “Commercial location” refers to meals prepared at restaurants, general purchased foods, and convenience foods. Meals and free meals prepared by schools, industries, and senior centers, among others, were classified as “Institution”. Breakfast frequency was categorized into “5–7 times per week”, “3–4 times per week”, “1–2 times per week”, and “rarely”. The response options for snack consumption were “yes” and “no”. Meal provision locations were classified into home, commercial, and institutional locations. The frequency of eating out was divided into six categories: “more than once a day”, “5–6 times a week”, “3–4 times a week”, “1–2 times a week”, “1–3 times a month”, and “rarely”. Food insecurity has been included in the dietary questionnaire since the 2005 KNHANES. Responses to the question “Which of the following best describes your family’s diet in the past year?” were classified into the “Sufficiently food secure” category (based on the description, “everyone in our family could eat enough of a variety of foods—as much as they wanted”) and “Mildly food insecure” category (based on the description “everyone in our family could eat enough food but of limited variety”), according to previous studies [37,38]. The “Moderately/severely insecure” category was based on the description “food was sometimes or often insufficient because of economic challenges”.

2.5. Food and Nutrient Intake

In this study, 24 h dietary recall data were collected by trained dietitians in the participants’ homes as part of the KNHANES dietary survey. Participants were asked to provide detailed information on all foods and beverages consumed during the previous 24 h via a standardized and structured interview. During the interview, trained dietitians used food models, photographs, and other visual aids to help participants recall the types and amounts of foods and beverages they had consumed [31].
Food intake was categorized into 17 food groups: cereals and grain products, potatoes and starch, sugar and confectionery, legumes and legume products, seeds and nuts, vegetables, mushroom, fruits, meat, poultry and poultry products, eggs, fish and shellfish, seaweed, milk and dairy products, fats and oils, beverages, seasonings, and other foods. The intake of each food group and each participant’s total food intake were calculated. Additionally, the total intake of fresh fruit (excluding jams, compotes, and fruit juices) and that of non-starchy vegetables (excluding salted vegetables and vegetable juices) were calculated [39]. The intake of fresh fruits and non-starchy vegetables was calculated in comparison with the intake standards recommended by the WHO and World Cancer Research Fund (WCRF) [40,41].
The dietary data were linked to the Food Composition Table (9.1 revised edition) established by the National Institute of Agricultural Sciences, Rural Development Administration in Korea [42], to calculate the energy and nutrient intakes (carbohydrate, protein, fat, fiber, calcium, phosphorus, sodium, potassium, zinc, magnesium, iron, vitamin A, carotene, retinol, thiamine, riboflavin, niacin, folic acid, vitamin D, vitamin E, and vitamin C) of each participant.
Nutritional insufficiency criteria followed the Korea Disease Control and Prevention Agency’s definition, as published in the National Health Statistics [43,44]. Participants whose energy intake was <75% of the estimated energy requirement (EER) and those whose intake of iron, calcium, vitamin A, and vitamin B2 was less than the estimated average requirement (EAR) were classified as nutritionally insufficient.

2.6. Statistical Analysis

KNHANES data were collected using stratified multistage sampling rather than simple random sampling. Briefly, to ensure accurate statistical analysis, the collected data were weighted and adjusted for stratification (using KSTRATA) and clustering (using primary sampling units), according to the statistical analysis procedure outlined in the KNHANES guidelines [45]. All analyses were performed using the Statistical Analysis System survey procedure (SAS, ver. 9.4; SAS Institute, Cary, NC, USA). The participants’ general characteristics, health-related behaviors, and dietary behaviors were subjected to frequency analysis (using the SURVEYFREQ procedure). The results are expressed as frequencies and percentages (weighted percentages). The food and nutrient intake analysis results are presented as the mean ± standard error (SE) via descriptive analysis (using the SURVEYMEANS procedure). Sex, age, and energy intake were used as adjustment variables. The relationship between pre-pandemic and during-pandemic nutritional insufficiency was assessed using logistic regression analysis (via the SURVEYLOGISTIC procedure), with results presented as odds ratios (ORs) and 95% confidence intervals (CIs). Additionally, the influences of sex, age, drinking status, stress level, weight status, smoking status, food security, snack consumption, eating-out frequency, breakfast frequency, education level, household income, and marital status were adjusted in stages prior to multiple logistic regression analysis.

3. Results

3.1. General Characteristics

Table 1 shows the general characteristics of the survey participants. No significant difference in sex, age, marital status, education level, region, or household income was noted between the “Before COVID-19” and “During COVID-19” groups. However, employment status significantly differed between the two groups (p = 0.003), demonstrating a 5.66% increase from “Before COVID-19” to “During COVID-19”.

3.2. Health-Related Behaviors Before vs. During COVID-19

Pre- and during-pandemic health-related behaviors are shown in Table 2. Smoking status, stress level, exercise, obesity, or chewing ability did not significantly differ between the “Before COVID-19” and “During COVID-19” groups. However, there was a significant difference in the frequency of drinking between the two periods (p = 0.006). The proportion of participants who were drinking four or more times a week decreased by 1.92%, while the proportion of participants who were not drinking even once a month increased by 4.78%.

3.3. Dietary Behaviors Before vs. During COVID-19

Pre- and during-pandemic dietary behaviors are shown in Table 3. No statistically significant difference in snack or home-meal consumption occurred. Breakfast consumption frequency significantly decreased from “Before COVID-19” to “During COVID-19” among those consuming breakfast more than three times a week (p < 0.001); conversely, the frequency of eating breakfast less than two times a week increased. Regarding daily meal patterns, no significant differences were observed; however, the rate of the three-meal-a-day pattern (“B + L + D”) decreased by approximately 2.49% from “Before COVID-19” to “During COVID-19”, whereas that of two-meal-a-day patterns (“B + L”, “B + D”, and “L + D”) increased. In addition, the percentage of older adults using food service locations (where meals are prepared) is as follows. The frequency of eating food served in institutional (p < 0.001) and commercial (p = 0.0715) locations decreased by 3.26%p and 3.73%p, respectively, when comparing the “Before COVID-19” period to the “During COVID-19” period. The frequency of eating food provided at home (p = 0.6488) slightly increased by about 0.28 percentage points when comparing “Before COVID-19 (95.82%)” and “During COVID-19 (96.10%)”. In terms of the frequency of eating out, a significant difference was noted between the “Before COVID-19” and “During COVID-19” groups (p < 0.001). Specifically, “Once a day”, “5–6 times a week”, “3–4 times a week”, and “1–2 times a week” all exhibited a decrease “During COVID-19” compared with that “Before COVID-19”, whereas “1–3 times a month” and “Rarely” displayed an increase. Finally, food security increased between the pre- and during-pandemic periods; in contrast, the number of participants reporting food insecurity decreased (p = 0.006).

3.4. Food Group Intake Before vs. During COVID-19

Table 4 presents the pre- and during-pandemic daily food group intakes. The following food groups “Total Food”, “Potatoes and starches”, “Legumes”, “Vegetables”, “Eggs”, “Milks and dairy products”, and “Oils and fats” were more common “During COVID-19” than “Before COVID-19”. Generally, food group intake significantly increased (unadjusted p-value < 0.05 and adjusted p-value < 0.05; however, only the adjusted p-value for “Total Food” intake was significant). Conversely, “Cereals and grains” intake significantly decreased by approximately 18.87 g “During COVID-19” compared with that “Before COVID-19” (adjusted p-value < 0.01).

3.5. Plant Food Intake Before vs. During COVID-19

Table 5 presents the analysis of plant food intake (i.e., fresh fruits and non-starchy vegetables). The KNHANES’ fruit category includes candied fruits and fruit juice, while its vegetable category comprises kimchi, salted vegetables, and vegetable juice. In this study, data excluding candied fruits, fruit juice, and salted vegetables were subjected to analysis. Although fresh fruit intake was not significantly different between the two time periods, it was 8.13 g lower “During COVID-19” (157.33 g) than that “Before COVID-19” (165.46 g). Moreover, non-starchy vegetable intake was lower than that “Before COVID-19” (184.91 g). On analyzing the period “During COVID-19” (199.37 g), intake significantly increased by approximately 14.48 g (unadjusted p-value = 0.0233 and adjusted p-value = 0.004). No significant difference in the combined intake of fresh fruit and non-starchy vegetables was noted; nonetheless, it increased by approximately 6.33 g “During COVID-19” (356.70 g) compared with that “Before COVID-19” (350.37 g).

3.6. Nutrient Intake Before vs. During COVID-19

Pre- and during-pandemic nutrient intake results are shown in Table 6. Compared with that “Before COVID-19”, the intake of energy, carbohydrates, iron, and thiamine significantly decreased “During COVID-19” (unadjusted p-value < 0.001 and adjusted p-value < 0.001). In contrast, the energy contribution of protein, fat, fiber, calcium, phosphorus, magnesium, potassium, zinc, riboflavin, vitamin E, vitamin C, and folic acid exhibited a significantly increasing trend (unadjusted p-value < 0.05 and adjusted p-value < 0.05).

3.7. Effects of the Pre- and During-COVID-19 Pandemic Periods on Nutritional Insufficiency

Table 7 shows the associations of the pre- and during-pandemic periods with nutritional insufficiency. Models 1–4 revealed relationships between the pre- and during-pandemic periods and undernutrition. The nutritional insufficiency rate “During COVID-19” (20.76%) was 1.31–1.42 times higher than that “Before COVID-19” (16.45%). In particular, an independent and significant relationship existed between the pre- and during-pandemic periods and nutritional insufficiency after adjusting for sex, age, smoking, drinking status, stress, weight status, food security, snack consumption, eating-out frequency, breakfast frequency, household income, education level, and marital status.

4. Discussion

This study retrospectively compared changes in the food habits and dietary patterns of adults aged ≥65 years between the pre– and during–COVID-19 pandemic periods us-ing 2018–2021 KNHANES data.
The dietary behavior and dietary pattern results demonstrated that the frequency of eating breakfast decreased during COVID-19 among participants who consumed break-fast three or more times a week. While no significant differences in daily meal patterns occurred, the rate of the three–meal–a–day pattern (i.e., “B + L + D”) decreased by approximately 2.49% from “Before COVID-19” (81.92%) to “During COVID-19” (84.41%). In contrast, the frequency of the two–meal–a–day patterns (e.g., “B + L,” “B + D,” and “L + D”) in-creased, indicating a transition toward skipping one meal per day. The decrease in the proportion of people eating three meals a day and concurrent increase in that of people eating two meals a day suggests a rise in the proportion of people skipping meals “During COVID-19” compared with that “Before COVID-19.” This finding is consistent with that of previous studies that reported an increase in the proportion of South Koreans skipping breakfast and lunch during the COVID-19 pandemic [46]. The proportion of meals pre-pared at “home only” and “H+C” increased “During COVID-19” compared with that “Before COVID-19,” reflecting an increase in home–cooked and commercial meals (including delivery meals) and a decrease in institutional meals. In other words, all dietary patterns, including those involving non–commercial food services, decreased during the COVID-19 period.
Overseas studies have reported that the COVID-19 pandemic restricted daily activities, culminating in lifestyle changes, such as weight gain, decreased physical activity, and increased home and delivered meals owing to more time spent at home rather than in active places [12]. Another study analyzed the decline in institutional foodservice for older adults after the COVID-19 outbreak, attributing it to factors such as bans on social gatherings, the suspension of institutional foodservice owing to teleworking, restrictions on outside activities, and the suspension of senior and social–welfare centers, and reported reciprocal effects [26]. The ban on social gatherings, working from home, and restrictions on daily outdoor activities might have elicited an increase in commercial and home meals, excluding institutional foodservices, during the COVID-19 pandemic.
In terms of food insecurity, the number of respondents reporting that they had enough to eat increased between the “Before COVID-19” and “During COVID-19” periods, whereas that of those reporting that they were food insecure decreased. Previous studies on food security have revealed a positive improvement in food insecurity “During COVID-19” compared with that “Before COVID-19,” exhibiting consistency with the results of this study. Food insecurity was reportedly influenced by increased public health awareness of food security and its importance [47]. Another study found that financial and food assistance programs during the pandemic improved access to food and contributed to healthier food intake, depending on the timing and availability of the assistance programs [48]. Considering these findings, nutrition interventions, such as food vouchers and nutrition education, likely contribute to food security.
The intake of fresh fruit and non–starchy vegetables was found to be approximately 50 g lower than the WHO– and WCRF–recommended 400 g both “Before COVID-19” (350.37 g/day) and “During COVID-19” (356.70 g/day) [40,41]. Previous studies have demonstrated that fruit and vegetable consumption in older adults is an indispensable component of a healthy diet and is associated with a range of positive health outcomes and reduced risk of chronic diseases, such as cardiovascular disease, stroke, and cancer [49,50,51]. High fruit and vegetable consumption has also been reported to be beneficial for the immune system [52]. To improve dietary habits, dietary guidelines and nutrition education programs aimed at increasing fruit and vegetable consumption should be developed.
Research on dietary changes has generated inconsistent results, with some studies reporting no significant changes between the pre– and during–pandemic periods [53] and others indicating increased Mediterranean diet intake [53] and elevated fruit and vegetable consumption [54] during COVID-19. These factors are strongly influenced by socio demographic factors, with low–income groups being particularly negatively affected [54,55].
The decrease in energy, carbohydrate, iron, and thiamine intake along with the reduced energy contribution of carbohydrates “During COVID-19” compared with that “Before COVID-19” is potentially related to the decreased intake of cereals and grains between the two periods. However, in this study, the energy contribution of carbohydrates was found to exceed the adequate percentage by 3.79–6.02% in both the “Before COVID-19” (71.02%) and “During COVID-19” (68.79%) groups. Several studies have also reported the energy contribution of carbohydrates in Korean older adults to approximate 70% [32,43]. According to the Korean Dietary Reference Intakes (KDRIs), the Acceptable Macronutrient Distribution Range (AMDR) for carbohydrates is 55–65% (based on the 2020 KDRIs). Previous studies have reported an increased risk of health problems when the energy intake ratio of macronutrients, such as carbohydrates, falls outside the recommended range [56].
No statistically significant difference in sodium intake was noted. However, its intake increased “During COVID-19” (2885.60 mg) compared with that “Before COVID-19” (2816.22 mg) and exceeded the level that mitigates the risk of chronic disease (based on the 2020 KDRIs, 65–74 years: 2100 mg; 75+ years: 1700 mg) by approximately 700–1100 mg [56]. Excessive sodium intake is associated with an increased risk of hypertension and chronic disease; therefore, caution is advised [57,58,59].
Finally, another study found the intake of calcium, vitamin A, and vitamin C to be lower than that recommended by the KDRIs both before and during COVID-19 [56]. A study on calcium intake trends over 20 years among adults aged ≥20 years in South Korea reported that South Koreans generally have a low calcium intake, highlighting the urgent need to increase the availability of calcium–rich foods and implement targeted interventions to increase calcium intake among those most affected by calcium insufficiency, specifically older Koreans [60]. This is because in people aged ≥65 years, these nutrients are important for health, including bone health, connective tissue formation, and antioxidant activity [43]. Therefore, a deficiency of these nutrients potentially leads to health deterioration in older adults; hence, policies that increase the intake of these nutrients are urgently required. In addition, the development of a dietary education program that ensures proper nutrient intake in older Koreans is also necessary.
This study has certain limitations. First, it was a KNHANES–based, cross–sectional study, and like previous studies, it did not allow for the investigation of changes in individual energy, nutrient, and food group intakes, an initiative that would have been possible in a long–term cohort study [30,61]. Second, the KNHANES dietary survey was conducted based on the recall of meals eaten the day before the survey, carrying potential ac-curacy limitations in participants’ recollection of their daily intake [61]. Despite these limitations, this study presents potentially meaningful findings because the KNHANES yields representative dietary data for South Korea and utilizes a representative sample.

5. Conclusions

This study analyzed the effects of the COVID-19 pandemic on the dietary habits and nutritional status of people aged ≥65 years in South Korea. According to its findings, the dietary habits and nutritional status of the study group evolved during the pandemic. In particular, the frequency of drinking four or more times a week decreased, and the intakes of certain food groups and nutrients altered.
These changes are presumably related to social distancing and pandemic-induced modifications of daily lifestyles. In addition, certain nutrients, especially vitamin A, vitamin C, and calcium, were found to be below recommended values, and improvements are warranted. Based on these research findings, a systematic approach to improving the nutritional status of older people is imperative. In particular, developing dietary and nutrition education programs that enhance immunity and prevent chronic disease and osteoporosis as well as practical dietary guidelines that increase the intake of deficient nutrients is mandatory.
In addition, this study’s findings provide an important basis for the formulation of nutrition management strategies for older adults in the event of a similar public health crisis in the future. For example, these analyses support programs such as the mobilization of agricultural product bundles for nutritionally vulnerable older adults, the distribution of nutrition kits, and the provision of remote nutrition-counseling services. The continuous monitoring and analysis of changes in the dietary habits of older adults remains necessary post-pandemic.

Author Contributions

Y.-S.K. and H.-S.L.: conceptualization; Y.-S.K. and D.K.: methodology; Y.-S.K. and H.-S.L.: software; Y.-S.K. and D.K.: validation; Y.-S.K. and H.-S.L.: formal analysis; Y.-S.K. and H.-S.L.: investigation; Y.-S.K. and D.K.: writing—General Characteristicsoriginal draft preparation; Y.-S.K. and H.-S.L.: writing—review and editing; Y.-S.K. and H.-S.L.: visualization; H.-S.L.: supervision; Y.-S.K.: project administration. All authors have read and agreed to the published version of the manuscript.

Funding

This research was funded by the agro-food based basic research of the Korea Rural Development Administration grant (Project No. PJ017251).

Institutional Review Board Statement

This study was conducted with the approval of the Institutional Review Board (IRB) of the Korea Disease Control and Prevention Agency (IRB approval number: 2018-01-03-P-A, 2018-01-03-C-A, 2018-01-03-2C-A, and 2018-01-03-5C-A) approval date: 3 January 2018.

Informed Consent Statement

Not applicable.

Data Availability Statement

All data were obtained from the Korea Disease Control and Prevention Agency and are available with the permission of the Korea Disease Control and Prevention Agency. The data in this study were from the Korea National Health and Nutrition Examination Survey.

Conflicts of Interest

The authors declare that the research was conducted in the absence of any commercial or financial relationships that could be construed as potential conflicts of interest.

References

  1. Coronavirus Disease (COVID-19) Pandemic. Available online: https://www.who.int/emergencies/diseases/novel-coronavirus-2019 (accessed on 25 November 2023).
  2. Choi, J.H. Food Insecurity Is Associated with Dietary Consumption during the COVID-19 Pandemic: Data from the Korea National Health and Nutrition Examination Survey 2019–2020. Nutrients 2023, 15, 772. [Google Scholar] [CrossRef] [PubMed]
  3. Yang, H.J.; Park, S.; Yoon, T.Y.; Ryoo, J.H.; Park, S.K.; Jung, J.Y.; Lee, J.H.; Oh, C.M. Nationwide changes in physical activity, nutrient intake, and obesity in South Korea during the COVID-19 pandemic era. Front. Endocrinol. 2022, 13, 965842. [Google Scholar] [CrossRef]
  4. Kwon, S.L.; Oh, J. COVID-19 vaccination program in South Korea: A long journey toward a new normal. Health Policy Technol. 2022, 11, 100601. [Google Scholar] [CrossRef] [PubMed]
  5. Onyeaka, H.; Anumudu, C.K.; Al-Sharify, Z.T.; Egele-Godswill, E.; Mbaegbu, P. COVID-19 pandemic: A review of the global lockdown and its far-reaching effects. Sci. Prog. 2021, 104, 00368504211019854. [Google Scholar] [CrossRef]
  6. Dighe, A.; Cattarino, L.; Cuomo-Dannenburg, G.; Skarp, J.; Imai, N.; Bhatia, S.; Gaythorpe, K.A.M.; Ainslie, K.E.C.; Baguelin, M.; Bhatt, S.; et al. Response to COVID-19 in South Korea and implications for lifting stringent interventions. BMC Med. 2020, 18, 321. [Google Scholar] [CrossRef] [PubMed]
  7. Stockwell, S.; Trott, M.; Tully, M.; Shin, J.; Barnett, Y.; Butler, L.; McDermott, D.; Schuch, F.; Lee, S. Changes in physical activity and sedentary behaviours from before to during the COVID-19 pandemic lockdown: A systematic review. BMJ Open Sport Exerc. Med. 2021, 7, e000960. [Google Scholar] [CrossRef]
  8. Tison, G.H.; Avram, R.; Kuhar, P.; Abreau, S.; Marcus, G.M.; Pletcher, M.J.; Olgin, J.E. Worldwide effect of COVID-19 on physical activity: A descriptive study. Ann. Intern. Med. 2020, 173, 767–770. [Google Scholar] [CrossRef]
  9. Wang, Y.; Zhang, Y.; Bennell, K.; White, D.K.; Wei, J.; Wu, Z.; He, H.; Liu, S.; Luo, X.; Hu, S.; et al. Physical distancing measures and walking activity in middle-aged and older residents in changsha, China, during the COVID-19 epidemic period: Longitudinal observational study. J. Med. Internet Res. 2020, 22, e21632. [Google Scholar] [CrossRef]
  10. Pryor, S.; Dietz, W. The COVID-19, obesity, and food insecurity syndemic. Curr. Obes. Rep. 2022, 11, 70–79. [Google Scholar] [CrossRef]
  11. Błaszczyk-Bebenek, E.; Jagielski, P.; Bolesławska, I.; Jagielska, A.; Nitsch-Osuch, A.; Kawalec, P. Nutrition behaviors in polish adults before and during COVID-19 lockdown. Nutrients 2020, 12, 3084. [Google Scholar] [CrossRef]
  12. Chew, H.S.J.; Lopez, V. Global impact of COVID-19 on weight and weight-related behaviors in the adult population: A scoping review. Int. J. Environ. Res. Public Health 2021, 18, 1876. [Google Scholar] [CrossRef] [PubMed]
  13. Fitzpatrick, K.M.; Harris, C.; Drawve, G.; Willis, D.E. Assessing food insecurity among US adults during the COVID-19 pandemic. J. Hunger Environ. Nutr. 2021, 16, 1–18. [Google Scholar] [CrossRef]
  14. Koltai, J.; Toffolutti, V.; McKee, M.; Stuckler, D. Prevalence and changes in food-related hardships by socioeconomic and demographic groups during the COVID-19 pandemic in the UK: A longitudinal panel study. Lancet Reg. Health Eur. 2021, 6, 100125. [Google Scholar] [CrossRef] [PubMed]
  15. Litton, M.M.; Beavers, A.W. The relationship between food security status and fruit and vegetable intake during the COVID-19 pandemic. Nutrients 2021, 13, 712. [Google Scholar] [CrossRef]
  16. Picchioni, F.; Goulao, L.F.; Roberfroid, D. The impact of COVID-19 on diet quality, food security and nutrition in low and middle income countries: A systematic review of the evidence. Clin. Nutr. 2021, 41, 2955–2964. [Google Scholar] [CrossRef] [PubMed]
  17. Brown, H.; Mills, S.; Albani, V. Socioeconomic risks of food insecurity during the COVID-19 pandemic in the UK: Findings from the Understanding Society Covid Survey. BMC Public Health 2022, 22, 590. [Google Scholar] [CrossRef]
  18. Choi, S.; Ki, M. Estimating the reproductive number and the outbreak size of COVID-19 in Korea. Epidemiol. Health 2020, 42, e2020011. [Google Scholar] [CrossRef]
  19. Kim, S.W.; Lee, K.S.; Kim, K.; Lee, J.J.; Kim, J.Y. A brief telephone severity scoring system and therapeutic living centers solved acute hospital-bed shortage during the COVID-19 outbreak in daegu, Korea. J. Korean Med. Sci. 2020, 35, e152. [Google Scholar] [CrossRef]
  20. Ryu, S.K.; Chung, S.G. Korea’s early COVID-19 response: Findings and implications. Int. J. Environ. Res. Public Health 2021, 18, 8316. [Google Scholar] [CrossRef]
  21. Task Force for Tackling COVID-19. All About Korea’s Response to COVID-19. South Korea. Available online: http://www.kdca.go.kr/upload_comm/syview/doc.html?fn=160276224199800.pdf&rs=/upload_comm/docu/0030/ (accessed on 25 November 2023).
  22. Kim, S.Y.; Yoo, D.M.; Min, C.; Choi, H.G. Changes in Dietary Habits and Exercise Pattern of Korean Adolescents from Prior to during the COVID-19 Pandemic. Nutrients 2021, 13, 3314. [Google Scholar] [CrossRef]
  23. Kim, C.; Kim, E. Comparative study on the health and dietary habits of Korean male and female adults before and after the coronavirus disease 2019 pandemic: Utilizing data from the 8th Korea National Health and Nutrition Examination Survey (2019–2021). Korean J. Community Nutr. 2024, 29, 65–80. [Google Scholar] [CrossRef]
  24. Na, H.M.; Jung, B.M. Dietary behavior and diet quality in the Korean adult population by income level before and after the COVID-19 pandemic: Using the Korean National Health and Nutrition Examination Survey (2019–2020). Korean J. Community Living Sci. 2022, 33, 397–413. [Google Scholar] [CrossRef]
  25. Suh, B.D.; Kwon, K.H. Impacts of the depression among the elderly in the South Korea community in COVID-19 pandemic. J. Health Inform. Stat. 2021, 46, 54–63. [Google Scholar] [CrossRef]
  26. Kim, J.Y.; Jung, B.M. Comparison of the Health Behavior and Nutrient Intake of the Korean Elderly Before and After the Start of the COVID-19 Pandemic: Data from the 8th Korea National Health and Nutrition Examination Survey. Korean J. Community Living Sci. 2023, 34, 353–364. [Google Scholar] [CrossRef]
  27. Hur, Y.I.; Huh, Y.; Lee, J.H.; Lee, C.B.; Kim, B.; Yu, S.H.; Kim, J.H.; Kim, J.; Kim, H.M.; Lee, M.; et al. Factors Associated with Body Weight Gain among Korean Adults during the COVID-19 Pandemic. J. Obes. Metab. Syndr. 2022, 31, 51–60. [Google Scholar] [CrossRef]
  28. Lee, Y.S.; Lee, Y. Changes in nutritional status of Korean older adults during COVID-19 Pandemic by household income and demographic factors-using the Korea National Health and Nutrition Examination Survey (2019–2020): A cross-sectional study. Korean J. Community Nutr. 2023, 28, 302–316. [Google Scholar] [CrossRef]
  29. Kweon, S.; Kim, Y.; Jang, M.J.; Kim, Y.; Kim, K.; Choi, S.; Chun, C.; Khang, Y.H.; Oh, K. Data resource profile: The Korea National Health and Nutrition Examination Survey (KNHANES). Int. J. Epidemiol. 2014, 43, 69–77. [Google Scholar] [CrossRef]
  30. Kang, M.S.; Jang, K.-A.; Kim, H.R.; Song, S. Association of Dietary Resistant Starch Intake with Obesity and Metabolic Syndrome in Korean Adults. Nutrients 2024, 16, 158. [Google Scholar] [CrossRef]
  31. Sung, H.; Park, J.M.; Oh, S.U.; Ha, K.; Joung, H. Consumption of ultra-processed foods increases the likelihood of having obesity in Korean women. Nutrients 2021, 13, 698. [Google Scholar] [CrossRef]
  32. Kwon, Y.S.; Ryu, J.H.; Yang, Y.; Park, Y.K.; Kim, S.H. Trends and Dietary Assessment According to Fruit and Vegetable Intake in Korean Elderly People: Analysis Based on the Korea National Health and Nutrition Examination Survey 1998, 2008, and 2018. Foods 2020, 9, 1712. [Google Scholar] [CrossRef]
  33. Bae, A.; Yoon, J.; Yun, S.-Y.; Asano, K. Dietary and health characteristics of the young-old and the old-old by food security status: Analysis of data from the 6th (2013~2015) Korea National Health and Nutrition Examination Survey. J. Nutr. Health 2019, 52, 104–117. [Google Scholar] [CrossRef]
  34. Jung, K.H.; Oh, Y.H.; Kang, E.N.; Kim, K.R.; Lee, Y.K.; Oh, M.A.; Hwang, N.H.; Kim, S.J.; Lee, S.H.; Lee, S.G.; et al. 2017 Investigation of Elderly Conditions; Korea Institute for Health and Social Affairs: Sejong, Republic of Korea, 2017.
  35. Korean Society for the Study of Obesity. Available online: https://general.kosso.or.kr/html/?pmode=obesityDiagnosis (accessed on 21 November 2024).
  36. World Health Organization, Regional Office for the Western Pacific. The Asia-Pacific Perspective: Redefining Obesity and Its Treatment; World Health Organization: Geneva, Switzerland, 2000.
  37. Shim, J.S.; Oh, K.W.; Nam, C.M. Association of Household Food Security with Dietary Intake; Based on the Third (2005) Korea National Health and Nutrition Examination Survey (KNHANES III). J. Nutr. Health 2008, 41, 174–183. [Google Scholar]
  38. Lee, S.J.; Lee, K.W.; Oh, J.E.; Cho, M.S. Nutritional and health consequences are associated with food insecurity among Korean elderly: Based on the fifth (2010) Korea National Health and Nutrition Examination Survey (KNHANES V-1). J. Nutr. Health 2015, 48, 519–529. [Google Scholar] [CrossRef]
  39. Kwon, J.; Shim, J.; Park, M.; Paik, H. Evaluation of fruits and vegetables intake for prevention of chronic disease in Korean adults aged 30 years and over: Using the Third Korea National Health and Nutrition Examination Survey (KNHANES III), 2005. J. Nutr. Health 2009, 42, 146–157. [Google Scholar] [CrossRef]
  40. World Health Organization. Diet, Nutrition, and the Prevention of Chronic Diseases: Report of a Joint WHO/FAO Expert Consultation; World Health Organization: Geneva, Switzerland, 2003.
  41. World Cancer Research Fund. Diet, Nutrition, Physical Activity and Cancer: A Global Perspective. A Summary of the Third Expert Report; World Cancer Research Fund: London, UK, 2018. [Google Scholar]
  42. National Institute of Agricultural Sciences of Korea. Food Composition Table, 9.1 Revision; Rural Development Administration: Wanju, Republic of Korea, 2016.
  43. Kim, S.; Kwon, Y.S.; Hong, K.H. What Is the Relationship between the Chewing Ability and Nutritional Status of the Elderly in Korea? Nutrients 2023, 15, 2042. [Google Scholar] [CrossRef]
  44. Korea Disease Control and Prevention Agency. Korea Health Statistics 2022; Korea Disease Control and Prevention Agency: Cheongju, Republic of Korea, 2022.
  45. Korea Disease Control and Prevention Agency. Guideline for 8th Korea National Health and Nutrition Examination Survey (KNHANES VIII); Korea Disease Control and Prevention Agency: Cheongju, Republic of Korea, 2018.
  46. Yun, S.H.; Oh, K.W. Dietary habits among Korean population. Public Health Wkly. Rep. 2022, 15, 1623–1632. [Google Scholar]
  47. Chung, S.R. Changes in food security before and after the COVID-19 pandemic: Comparing rural and urban areas. In Proceedings of the Korean Society of Community Nutrition Fall Conference, Seoul, Republic of Korea, 27 October 2023. [Google Scholar]
  48. Acton, R.B.; Vanderlee, L.; Cameron, A.J.; Goodman, S.; Jáuregui, A.; Sacks, G.; White, C.M.; White, M.; Hammond, D. Selfreported impacts of the COVID-19 pandemic on diet-related behaviors and food security in 5 countries: Results from the International Food Policy Study 2020. J. Nutr. 2022, 152, 35s–46s. [Google Scholar] [CrossRef] [PubMed]
  49. World Health Organization. Available online: https://www.who.int/news-room/fact-sheets/detail/healthy-diet (accessed on 14 November 2023).
  50. Dietz, W.H.; Douglas, C.; Brownson, R.C. Chronic Disease Prevention: Tobacco Avoidance, Physical Activity, and Nutrition for a Healthy Start. JAMA 2016, 316, 1645–1646. [Google Scholar] [CrossRef] [PubMed]
  51. Kimokoti, R.W.; Millen, B.E. Nutrition for the Prevention of Chronic Diseases. Med. Clin. 2016, 100, 1185–1198. [Google Scholar] [CrossRef]
  52. Sachdeva, S.; Sachdev, T.R.; Sachdeva, R. Increasing fruit and vegetable consumption: Challenges and opportunities. Indian J. Community Med. 2013, 38, 192–197. [Google Scholar] [CrossRef]
  53. Larson, E.A.; Bader-Larsen, K.S.; Magkos, F. The Effect of COVID-19-related Lockdowns on Diet and Physical Activity in Older Adults: A Systematic Review. Aging and Dis. 2021, 12, 1935–1947. [Google Scholar]
  54. Wang, J.; Yeoh, E.K.; Yung, T.K.C.; Wong, M.C.S.; Dong, D.; Chen, X.; Chan, M.K.Y.; Wong, E.L.Y.; Wu, Y.; Guo, Z.; et al. Change in eating habits and physical activities before and during the COVID-19 pandemic in Hong Kong: A cross-sectional study via random telephone survey. J. Int. Soc. Sports Nutr. 2021, 18, 33. [Google Scholar] [CrossRef] [PubMed]
  55. Liday, D.M. Eating behavior and physical activity of senior citizens during the COVID-19 lockdown. Int. J. Public Health Sci. 2021, 10, 493–499. [Google Scholar] [CrossRef]
  56. Ministry of Health and Welfare; The Korean Nutrition Society. Dietary Reference Intakes for Koreans 2020; Ministry of Health and Welfare: Sejong, Republic of Korea, 2021.
  57. Cutler, J.A.; Follmann, D.; Allender, P.S. Randomized trials of sodium reduction: An overview. Am. J. Clin. Nutr. 1997, 65, 643S–651S. [Google Scholar] [CrossRef]
  58. Karppanen, H.; Mervaala, E. Sodium intake and hypertension. Prog. Cardiovasc. Dis. 2006, 49, 59–75. [Google Scholar] [CrossRef]
  59. Hoffmann, I.S.; Cubeddu, L.X. Salt and the metabolic syndrome. Nutr. Metab. Cardiovasc. Dis. 2009, 19, 123–128. [Google Scholar] [CrossRef]
  60. Ju, S.; Kwon, Y.; Yeum, K.J. Persistent Calcium Inadequacy in Korean Adults over 20 Years: Analysis of the 1998–2018 Korea National Health and Nutrition Examination Survey. Foods 2024, 13, 3568. [Google Scholar] [CrossRef]
  61. Jeong, C.E.; Lee, H.; Lee, J.E. Intake of energy and macronutrients according to household income among elementary, middle, and high school students before and during the COVID-19 pandemic: A cross-sectional study. Korean J. Community Nutr. 2024, 29, 234–252. [Google Scholar] [CrossRef]
Table 1. Comparison of participants’ general characteristics before and during COVID-19.
VariablesBefore COVID-19
(n = 2943)
During COVID-19
(n = 2916)
Total
(n = 5859)
p-Value (1)
n%n%n%
Total294347.07291652.935859100.00-
Sex 0.331
Male123444.76125246.01248645.43
Female170955.24166453.99337354.57
Age (years) 0.919
65–74168858.98167259.16336059.07
≥75125541.02124440.84249940.93
Marital status 0.878
Married291999.17289099.21580999.19
Single240.83260.79500.81
Education level 0.605
High school graduate or lower191966.12168564.16360465.12
High school diploma 51320.9552422.45103721.72
College degree or higher30912.9331513.3962413.17
Region 0.317
City213278.57199574.19412776.26
Rural area81121.4392125.81173223.74
Employment status 0.003
Employed93433.20100238.86193636.09
Unemployed181066.80152561.14333563.91
Household income 0.557
Low141144.87132342.23273443.48
Middle-low81228.1583729.62164928.93
Middle-high44516.8645016.8789516.87
High26610.1228011.2754610.73
(1) p-value according to the chi-square test.
Table 2. Comparison of health-related behaviors before and during COVID-19.
VariablesBefore COVID-19
(n = 2943)
During COVID-19
(n = 2916)
Total
(n = 5859)
p-Value (1)
n%n%n%
Smoking status
Current smoker2499.222679.735169.490.675
Past smoker82529.6579630.47162130.08
Non-smoker183061.13179559.80362560.43
Drinking frequency
<1 time/month191063.91200068.69391066.430.006
1–4 times/month52719.1946516.4899217.76
2–3 times/week2529.032338.894858.96
≥4 times/week2197.861635.943826.85
Stress level
Severe stress1063.21963.172023.190.287
Moderate stress40713.9238813.1879513.53
Mild stress147852.35153855.37301653.94
No stress91330.5283028.29174329.34
Exercise
<1 day/week224480.18197776.91422178.510.057
1–2 days/week883.581003.991883.79
3–4 days/week1345.341365.412705.37
≥5 days/week28210.9031513.6959712.33
Obesity status
Underweight (BMI < 18.5)772.46913.151682.820.164
Normal (18.5 ≤ BMI < 23)100035.2094033.83194034.49
Overweight (23 ≤ BMI < 25)76526.7871225.09147725.90
Obesity (BMI ≥ 25)105535.56105437.93210936.80
Chewing ability
Very inconvenient2888.412769.395648.920.063
Inconvenient82727.9269824.20152525.96
Normal53318.1951018.69104318.45
Not inconvenient52918.9860321.22113220.16
Not inconvenient at all72526.5077026.51149526.51
(1) p-value according to the chi-square test.
Table 3. Comparison of dietary behaviors before and during COVID-19.
VariablesBefore COVID-19
(n = 2943)
During COVID-19
(n = 2916)
Total
(n = 5859)
p–Value (1)
n%n%n%
Breakfast <0.001
5–7 times/week274193.00269391.56543492.24
3–4 times/week853.21612.181462.66
1–2 times/week401.27662.551061.95
Rarely (<1 time/week)772.52963.721733.15
Snack 0.6492
Yes267291.27264190.87531391.06
No2718.732759.135468.94
Daily meal pattern (2) 0.2935
B + L1083.531073.812153.68
B + D2016.992288.244297.65
L + D1204.211445.282644.78
B + L + D248584.41241281.92489783.09
Others260.86230.74490.80
Home 0.6488
Eating282395.82281596.10563895.97
Not eating1204.181013.902214.03
Commercial location 0.0715
Eating127645.60119242.34246843.88
Not eating166754.40172457.66339156.12
Institutional location <0.001
Eating2097.01943.283035.04
Not eating273492.99282296.72585994.96
Frequency of eating–out <0.001
≥1 time/day1305.13973.912274.49
5–6 times/week2037.131555.493586.26
3–4 times/week2498.971806.214297.51
1–2 times/week81928.3351518.91133423.34
1–3 times/month93831.54102734.46196533.08
Rarely60418.9094231.03154625.32
Food security 0.0056
Sufficiently food secure139548.57158554.88298051.91
Mildly food insecure137746.29118040.18255743.06
Moderately/Severe food insecure1685.141504.943185.03
(1) p-value according to the chi-square test; (2) B: breakfast, L: lunch, D: dinner, other: ≤1 meal.
Table 4. Daily food group intake before vs. during COVID-19.
Food GroupBefore COVID-19
(n = 2943)
During COVID-19
(n = 2916)
Total
(n = 5859)
Unadjusted p-Value (1)Adjusted p-Value (2)
Total food (g)1243.00 ± 16.14 (3)1255.33 ± 19.241249.53 ± 12.470.28050.0065
Cereals and grains (g)260.13 ± 2.74241.30 ± 2.77250.16 ± 1.91<0.00010.0002
Potatoes and starches (g)33.62 ± 2.2541.24 ± 2.3337.65 ± 1.620.05390.0137
Sugars and sweets (g)5.85 ± 0.305.52 ± 0.265.68 ± 0.200.60310.7364
Legumes (g)43.90 ± 1.9951.31 ± 2.0847.82 ± 1.440.0070 0.0023
Seeds and nuts (g)7.96 ± 0.708.04 ± 0.708.00 ± 0.490.98010.8785
Vegetables (4) (g)304.28 ± 5.08327.82 ± 5.67316.74 ± 3.850.0005<0.0001
Mushrooms (g)4.64 ± 0.564.45 ± 0.484.54 ± 0.370.9127 0.8652
Fruits (5) (g)166.20 ± 5.99160.91 ± 6.15163.40 ± 4.280.91000.7176
Seaweed (g)29.63 ± 2.3332.36 ± 2.6031.08 ± 1.740.23240.2009
Meat and poultry (g)60.64 ± 2.7261.60 ± 2.5761.15 ± 1.860.98370.7465
Eggs (g)22.18 ± 0.9425.42 ± 0.9923.90 ± 0.670.01490.0091
Fishes and shell fishes (g)100.62 ± 4.0790.60 ± 3.8695.32 ± 2.750.14330.1565
Milks and dairy products (g)63.72 ± 3.0373.11 ± 3.4068.69 ± 2.290.02060.0060
Oils and fats (g)3.82 ± 0.144.15 ± 0.174.00 ± 0.110.0267 0.0043
Beverages (g)59.48 ± 3.6059.92 ± 3.7659.71 ± 2.590.95690.9265
Seasonings (g)26.60 ± 0.6126.73 ± 0.7726.67 ± 0.500.95010.6483
Other food (g)0.91 ± 0.430.74 ± 0.150.82 ± 0.220.6863 0.6749
(1) p-value according to the t-test; (2) adjusted for sex, age, and energy intake; (3) mean ± standard error; (4) including salted vegetables, kimchi, and vegetable juice; (5) including fruits preserved in sugar, jam, and fruit juice.
Table 5. Plant food intake before vs. during COVID-19.
Plant Food (g/day)Before COVID-19
(n = 2943)
During COVID-19
(n = 2916)
Total
(n = 5859)
Unadjusted p-Value (1)Adjusted
p-Value (2),(3)
Fresh fruits (5)165.46 ± 5.95 (4)157.33 ± 6.10161.16 ± 4.250.40410.6372
Non-starchy vegetables (6)184.91 ± 4.43199.37 ± 4.81192.56 ± 3.260.02330.0040
Fresh fruits and non-starchy vegetables350.37 ± 8.42356.70 ± 8.64353.72 ± 5.950.52790.2004
(1) p-value according to the t-test; (2) p-value according to the generalized linear model (GLM); (3) adjusted for sex, age, and energy intake; (4) mean ± standard error; (5) excluding fruits preserved in sugar, jam, and fruit juice; (6) including salted vegetables, kimchi, and vegetable juice.
Table 6. Nutrient intake before vs. during COVID-19.
NutrientsBefore COVID-19
(n = 2943)
During COVID-19
(n = 2916)
Total
(n = 5859)
Unadjusted p-Value (1)Adjusted
p-Value (2),(3)
Energy (kcal)1617.70 ± 14.24 (4)1579.98 ± 16.771597.73 ± 11.08<0.00010.0497
Carbohydrate (g)272.43 ± 2.34258.98 ± 2.44265.31 ± 1.670.00150.0003
Protein (g)55.51 ± 0.6756.58 ± 0.8256.08 ± 0.530.13320.0001
Fat (g)28.60 ± 0.5231.54 ± 0.6830.15 ± 0.430.0003<0.0001
Fiber (g)25.77 ± 0.3727.27 ± 0.3926.56 ± 0.270.0009<0.0001
Calcium (mg)457.98 ± 8.13471.91 ± 7.93465.35 ± 5.660.09060.0067
Phosphorus (mg)911.70 ± 10.61938.87 ± 12.39926.08 ± 8.160.0192<0.0001
Iron (mg)9.79 ± 0.168.54 ± 0.169.13 ± 0.11<0.0001<0.0001
Sodium (mg)2816.22 ± 38.772885.60 ± 45.642852.95 ± 30.480.12470.6253
Magnesium (mg)300.07 ± 3.52301.57 ± 3.96300.87 ± 2.660.37850.0117
Potassium (mg)2524.38 ± 34.252599.63 ± 36.182564.22 ± 24.850.0457<0.0001
Zinc (mg)9.19 ± 0.109.25 ± 0.129.22 ± 0.080.37710.0059
Vitamin A (μg RAE)323.49 ± 12.08342.88 ± 10.00333.75 ± 7.680.26920.1063
Carotene (μg)2725.37 ± 82.732874.32 ± 86.642804.22 ± 59.590.22050.0967
Retinol (μg)96.40 ± 9.27103.34 ± 5.61100.08 ± 5.220.65830.4892
Thiamine (mg)1.06 ± 0.010.95 ± 0.011.00 ± 0.01<0.0001<0.0001
Riboflavin (mg)1.18 ± 0.021.22 ± 0.021.20 ± 0.010.04080.0004
Niacin (mg)9.99 ± 0.149.72 ± 0.169.85 ± 0.100.66090.8147
Vitamin D (μg)2.72 ± 0.172.58 ± 0.112.65 ± 0.100.70350.8619
Vitamin E (mg α-TE)5.33 ± 0.095.78 ± 0.095.57 ± 0.070.0001<0.0001
Vitamin C (mg)55.76 ± 1.7362.71 ± 1.8359.44 ± 1.250.00830.0010
Folic acid (μg DFE)309.50 ± 4.21320.65 ± 4.71315.41 ± 3.170.03150.0002
Energy distribution (%)
Carbohydrate71.02 ± 0.2668.79 ± 0.3069.84 ± 0.19<0.0001<0.0001
Protein13.62 ± 0.0914.10 ± 0.1013.87 ± 0.07<0.00010.0003
Fat15.36 ± 0.2017.11 ± 0.2316.29 ± 0.15<0.0001<0.0001
(1) p-value according to t-test; (2) p-value according to the generalized linear model (GLM); (3) adjusted for sex, age, and energy intake; (4) mean ± standard error.
Table 7. Associations of the pre- and during-COVID-19 pandemic periods with nutritional insufficiency.
Total (1)EnergyCalciumIronVitamin ARiboflavin
n%n%n%n%n%n%
Before COVID-1950316.4594731.57231277.7285928.10238381.00139346.67
During COVID-19 61920.76103735.59219573.82116439.34226377.12129943.24
p-value (2)0.00120.0140.0184<0.00010.01030.0822
Model 11.350 (1.121–1.626) ** (3)1.198 (1.026–1.399) *0.781 (0.652–0.936) **1.652 (1.398–1.952) ***0.809 (0.675–0.970) **0.859 (0.727–1.014)
Model 21.375 (1.142–1.655) ***1.221 (1.046–1.426) *0.796 (0.663–0.956) *1.676 (1.420–1.978) ***0.821 (0.686–0.984) *0.875 (0.742–1.031)
Model 31.314 (1.092–1.580) **1.171 (1.003–1.360) *0.797 (0.663–0.959) *1.632 (1.384–1.926) ***0.818 (0.683–0.978) *0.851 (0.721–1.003)
Model 41.419 (1.170–1.721) ***1.172 (0.998–1.376) 0.783 (0.647–0.947) *1.697 (1.429–2.016) ***0.834 (0.692–1.005) 0.841 (0.712–0.995) *
(1) Dependent variables were calculated based on the percentage of participants who consumed less than 75% of the estimated energy requirement (EER) for energy and less than the estimated adequate requirement (EAR) for vitamin A, riboflavin, calcium, and iron (0: nutritional sufficiency, and 1: nutritional insufficiency); (2) p-value according to the chi-square test; (3) odds ratio (95% confidence interval); independent variable: before/during COVID-19 (0: before COVID-19, 1: during COVID-19); Model 1: unadjusted; Model 2: adjusted for sex and age; Model 3: adjusted for sex, age, smoking status, drinking status, and stress and weight status; Model 4: adjusted for sex, age, smoking status, drinking status, stress and weight status, food security, snack consumption, eating-out frequency, breakfast frequency, education level, household income, and marital status; * p < 0.05, ** p < 0.01, and *** p < 0.001.
Disclaimer/Publisher’s Note: The statements, opinions and data contained in all publications are solely those of the individual author(s) and contributor(s) and not of MDPI and/or the editor(s). MDPI and/or the editor(s) disclaim responsibility for any injury to people or property resulting from any ideas, methods, instructions or products referred to in the content.

