
Individualized Target Fortification of Breast Milk with Protein, Carbohydrates, and Fat for Preterm Infants: Effect on Neurodevelopment

 , , , , and
Abstract

1. Introduction
2. Materials and Methods
2.1. Study Design
2.2. Inclusion and Exclusion Criteria
2.3. Randomization and Blinding
2.4. Measurement of Nutrient Concentration in Native Human Milk
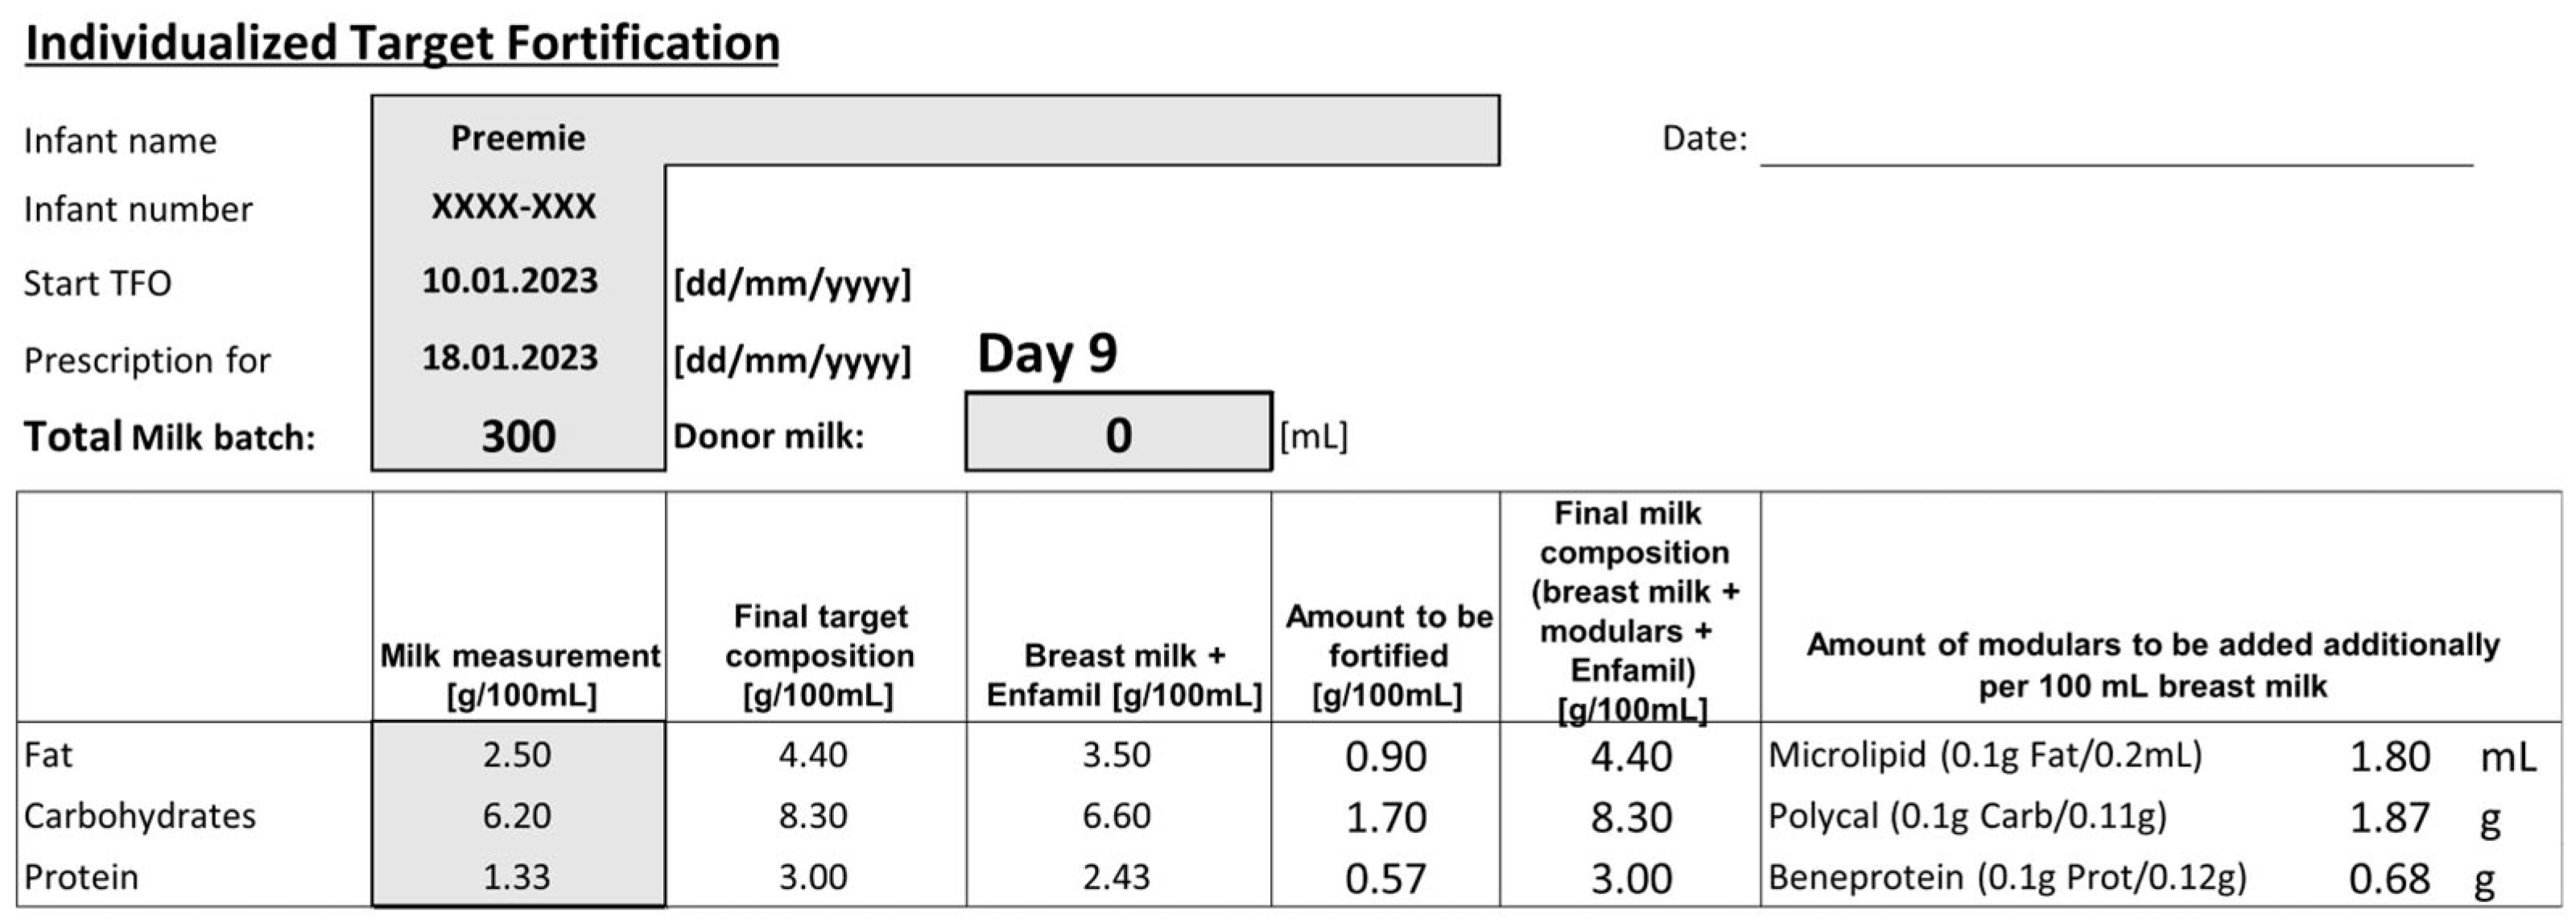
2.5. Nutritional Standards of Study Groups
2.6. Assessment of Neurological Development
2.7. Evaluation of Outcome Parameters
2.8. Quality Control
2.9. Statistical Analysis
3. Results
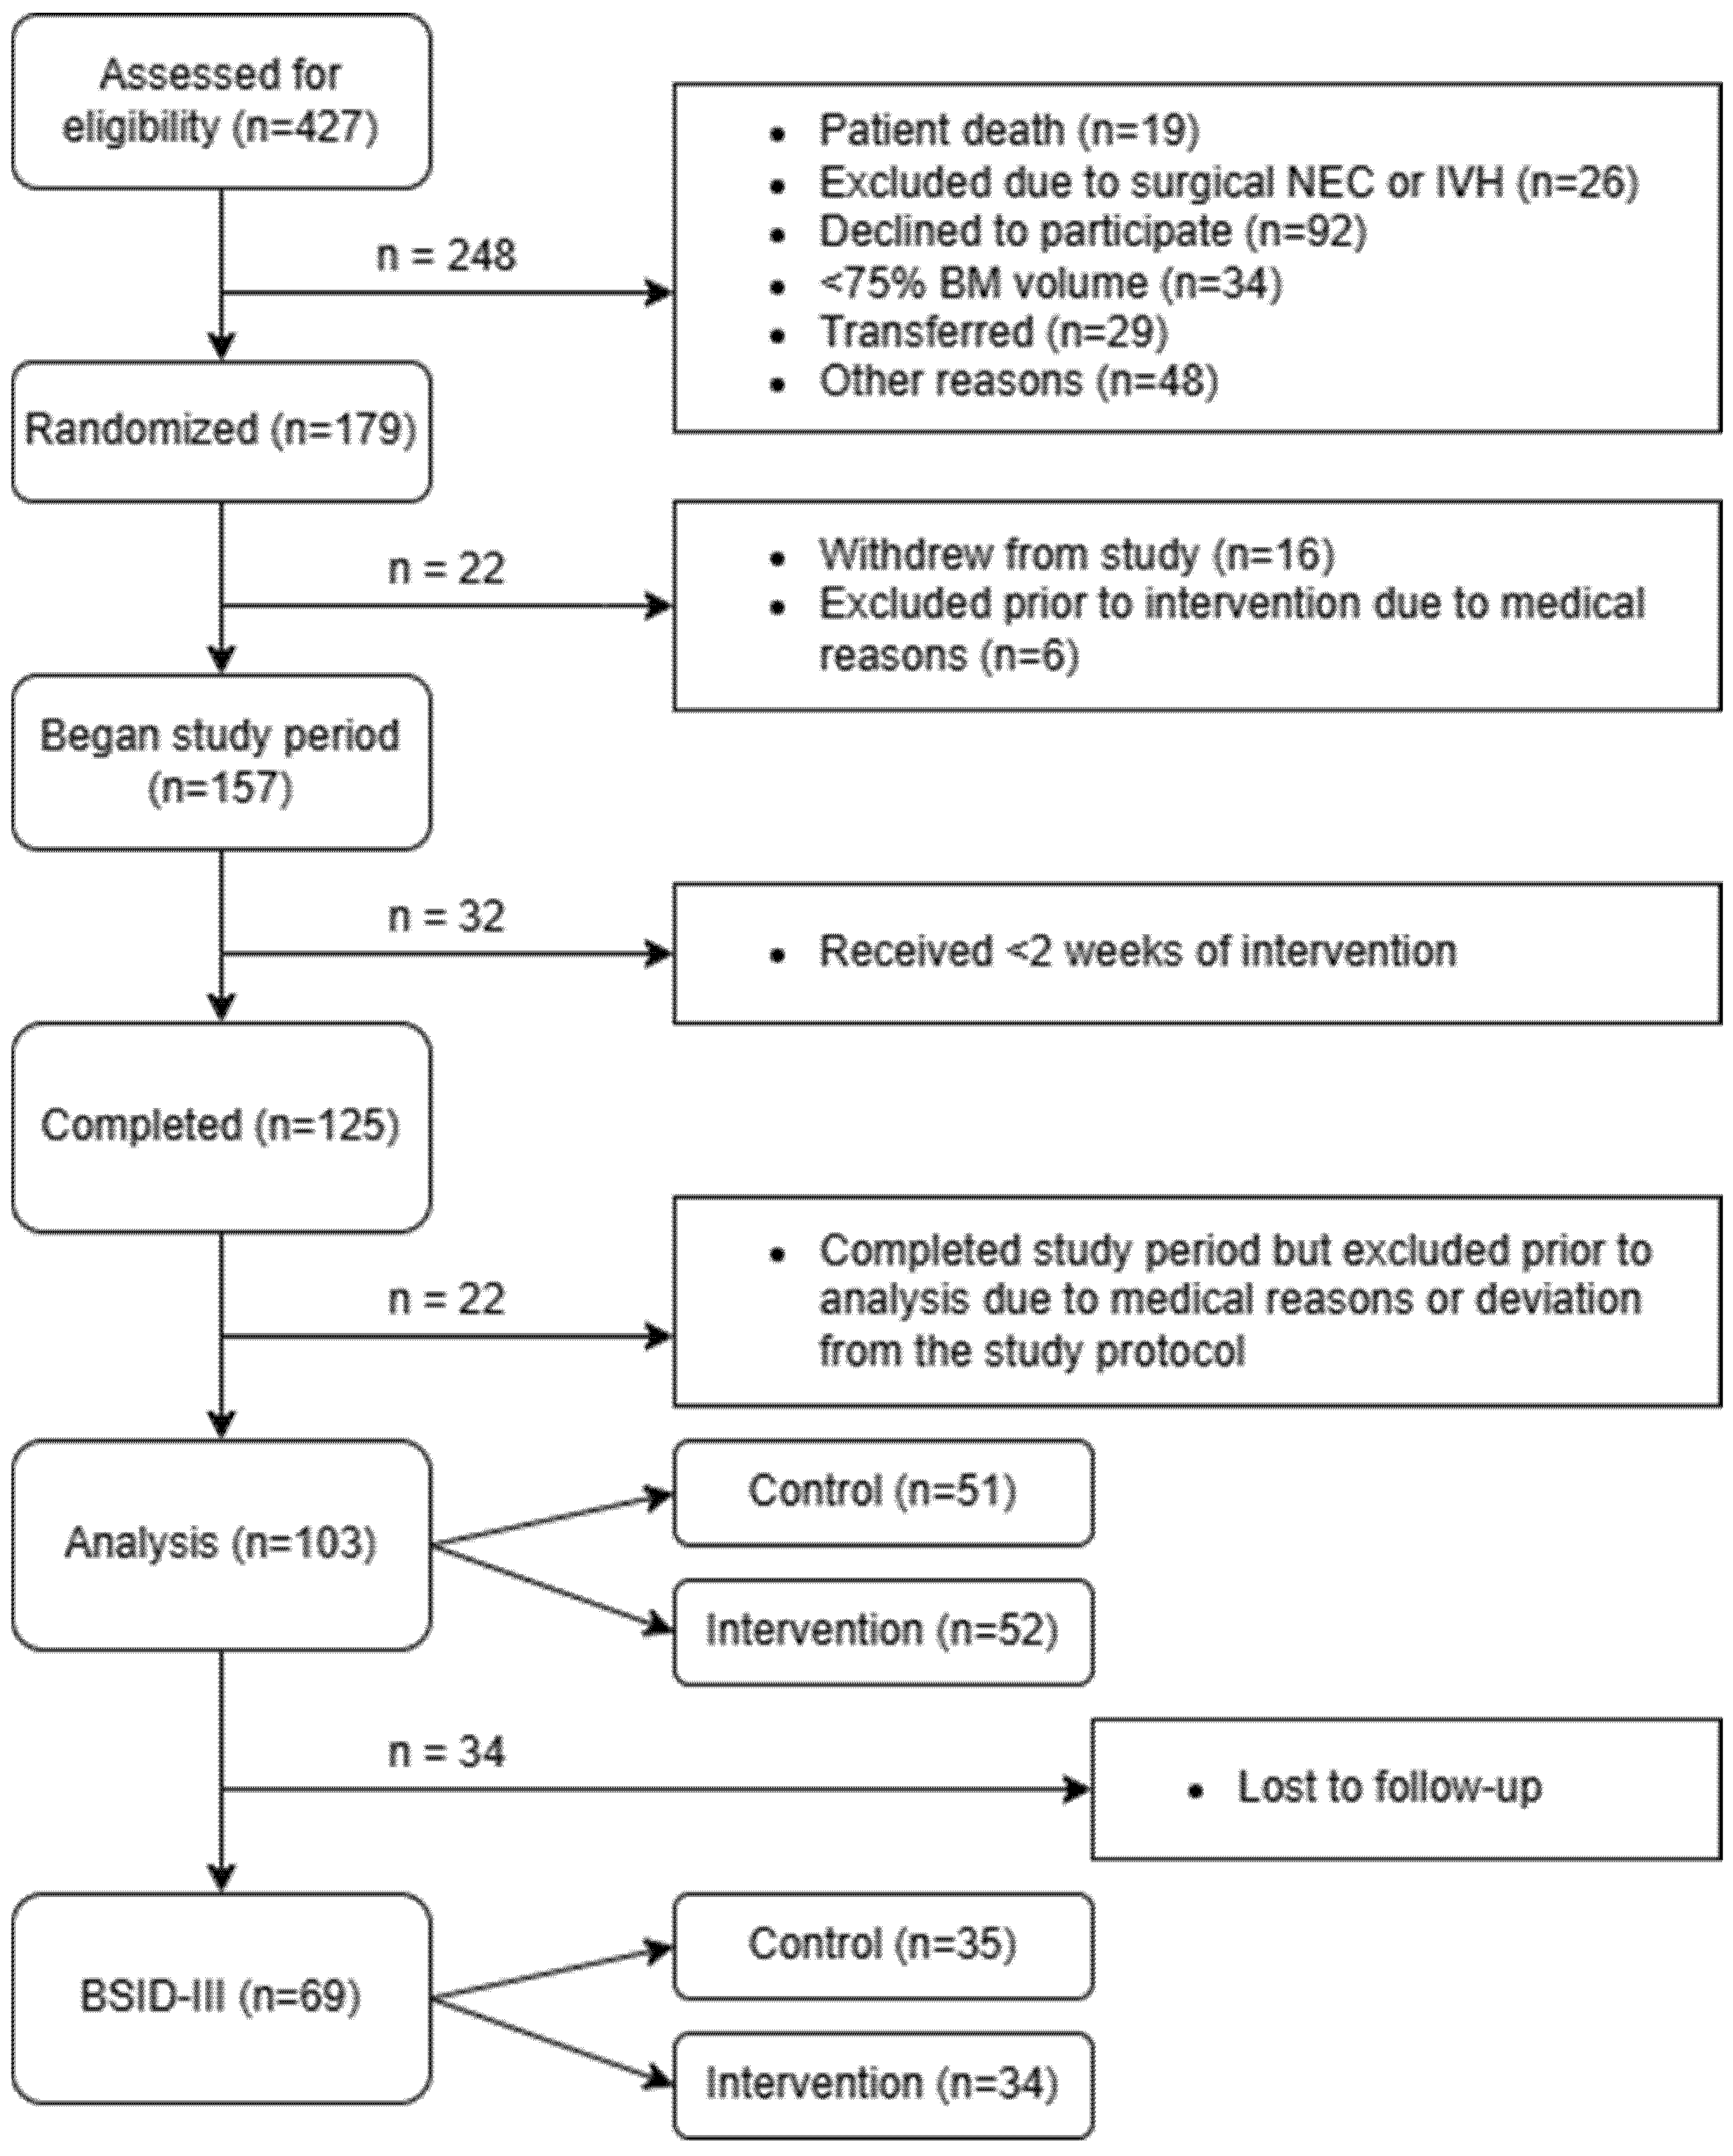
3.1. Recruitment Process of Participants
3.2. Patient Characteristics
3.3. Nutritional Characteristics
3.4. Short-Term Effects of the Intervention
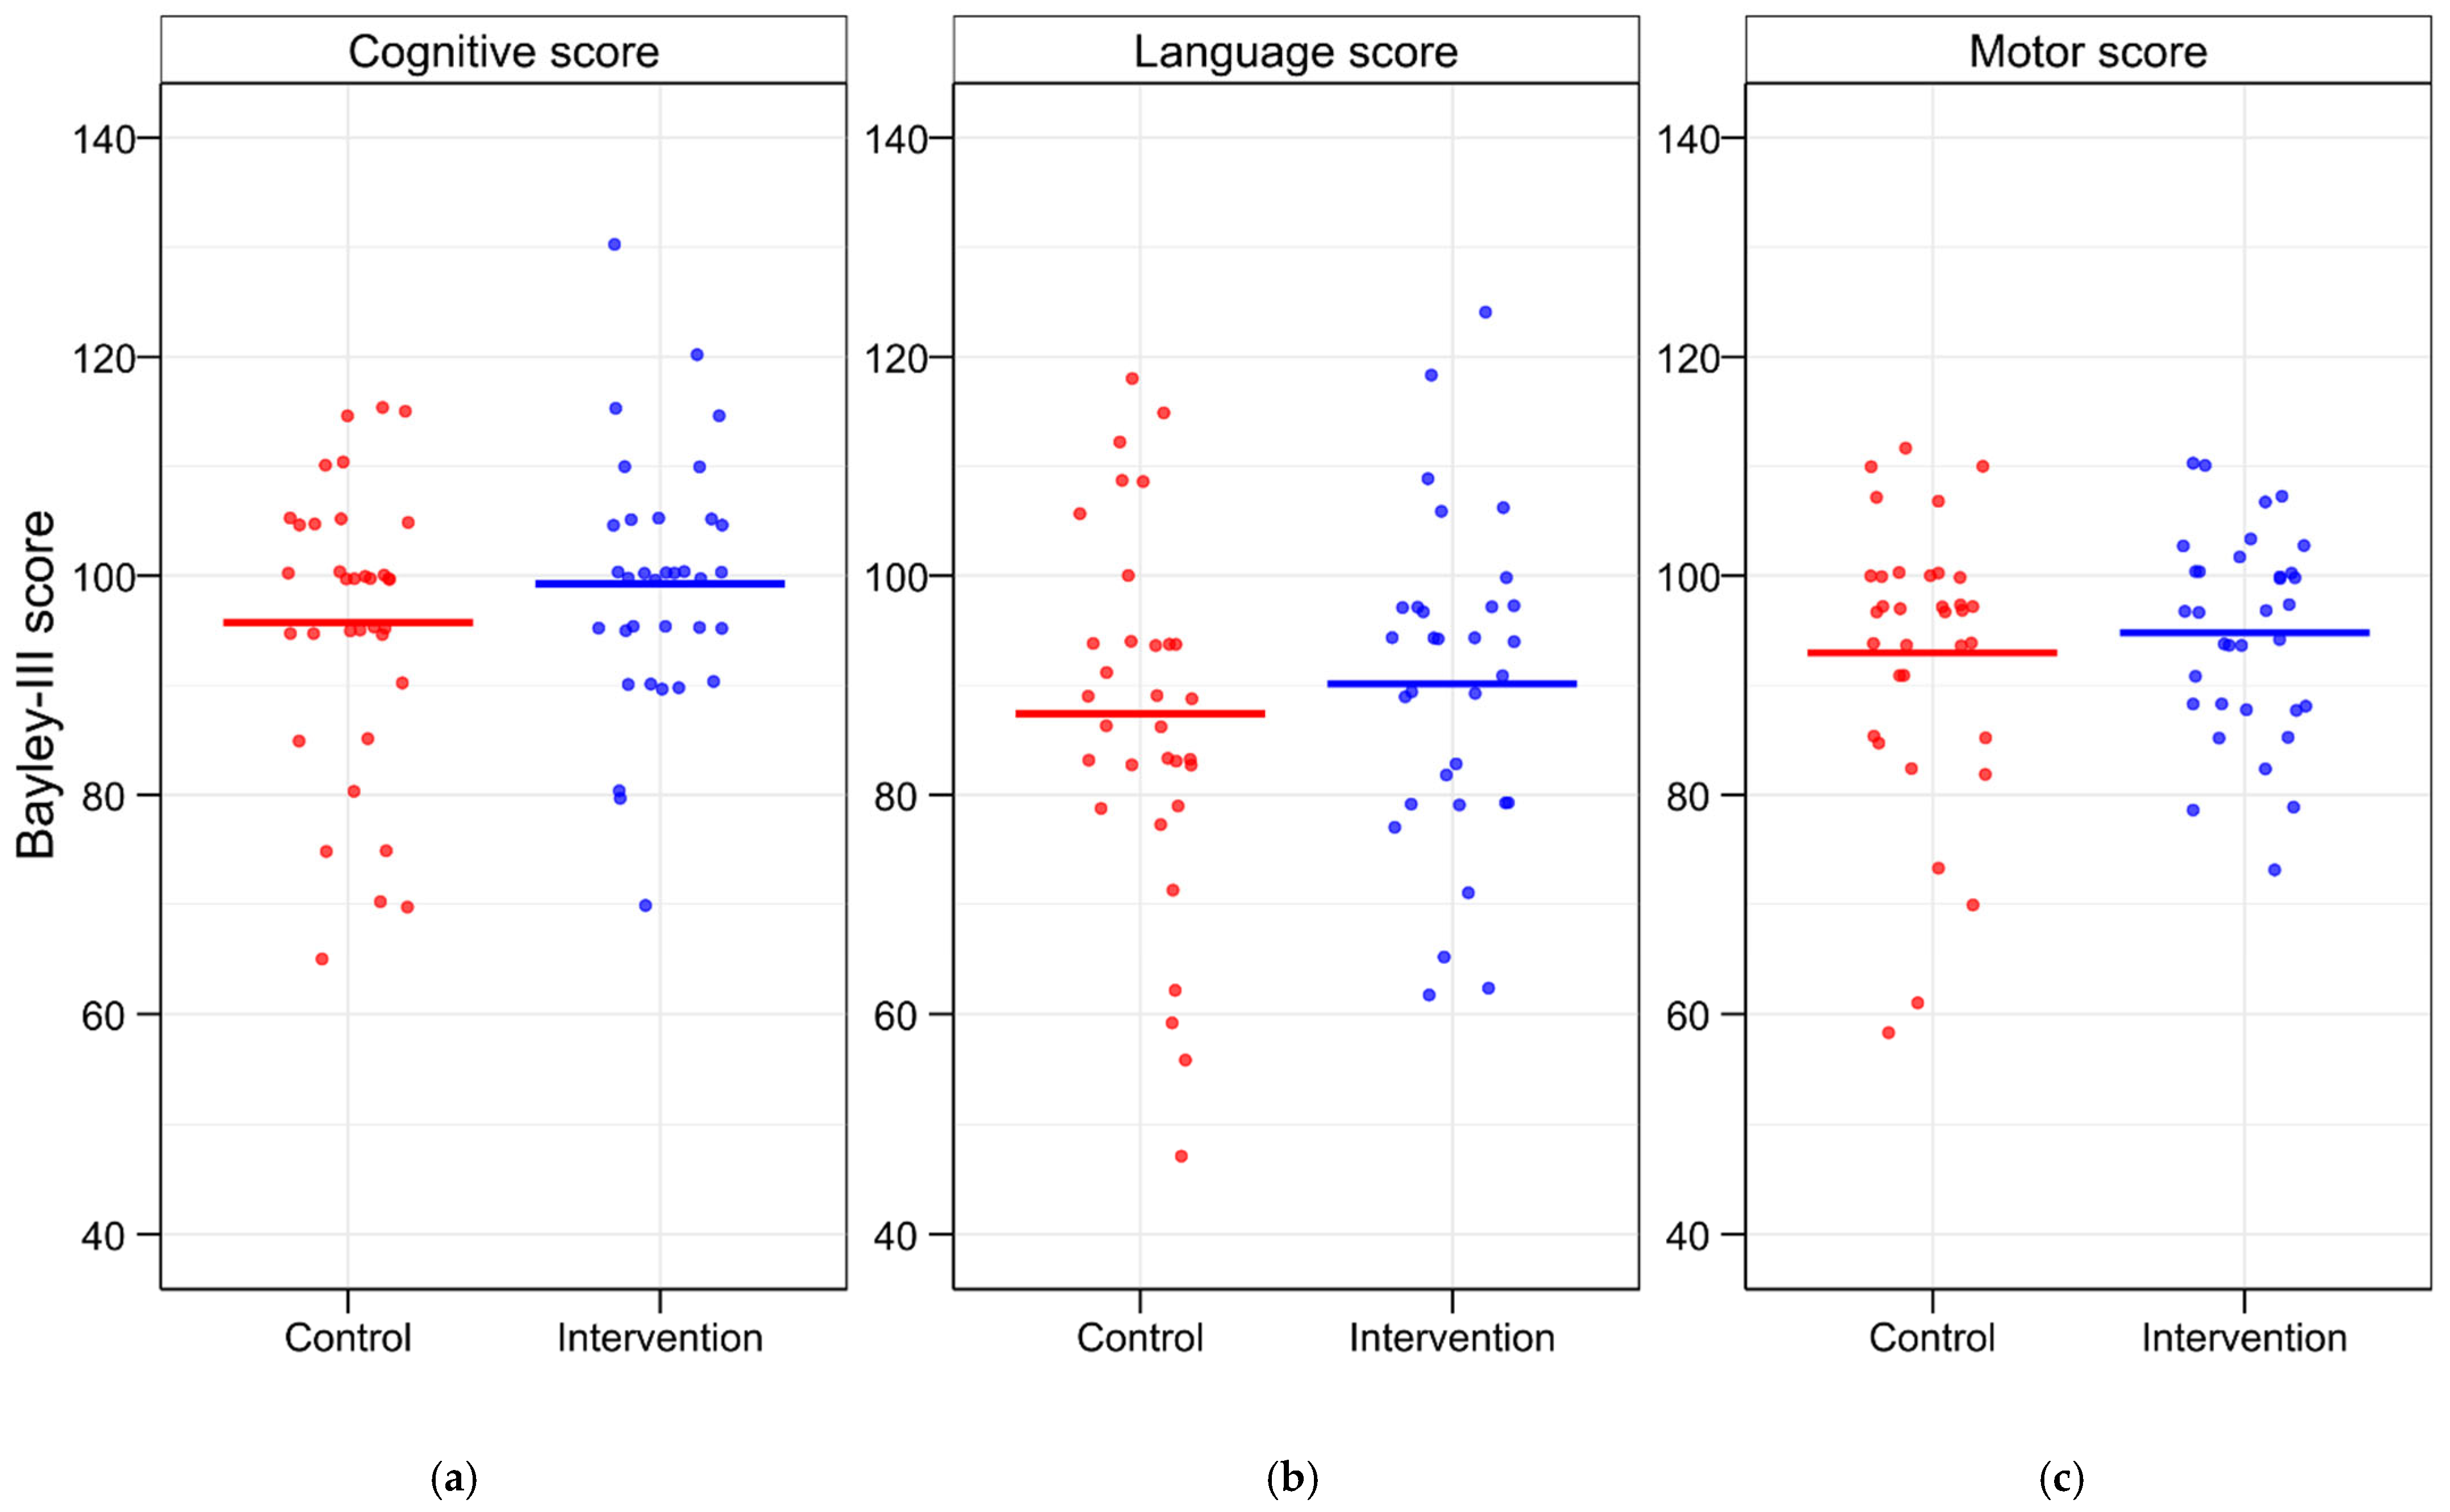
3.5. Evaluation of BSID-III Scores
3.6. Correlation Analyses of Growth and Neurological Development
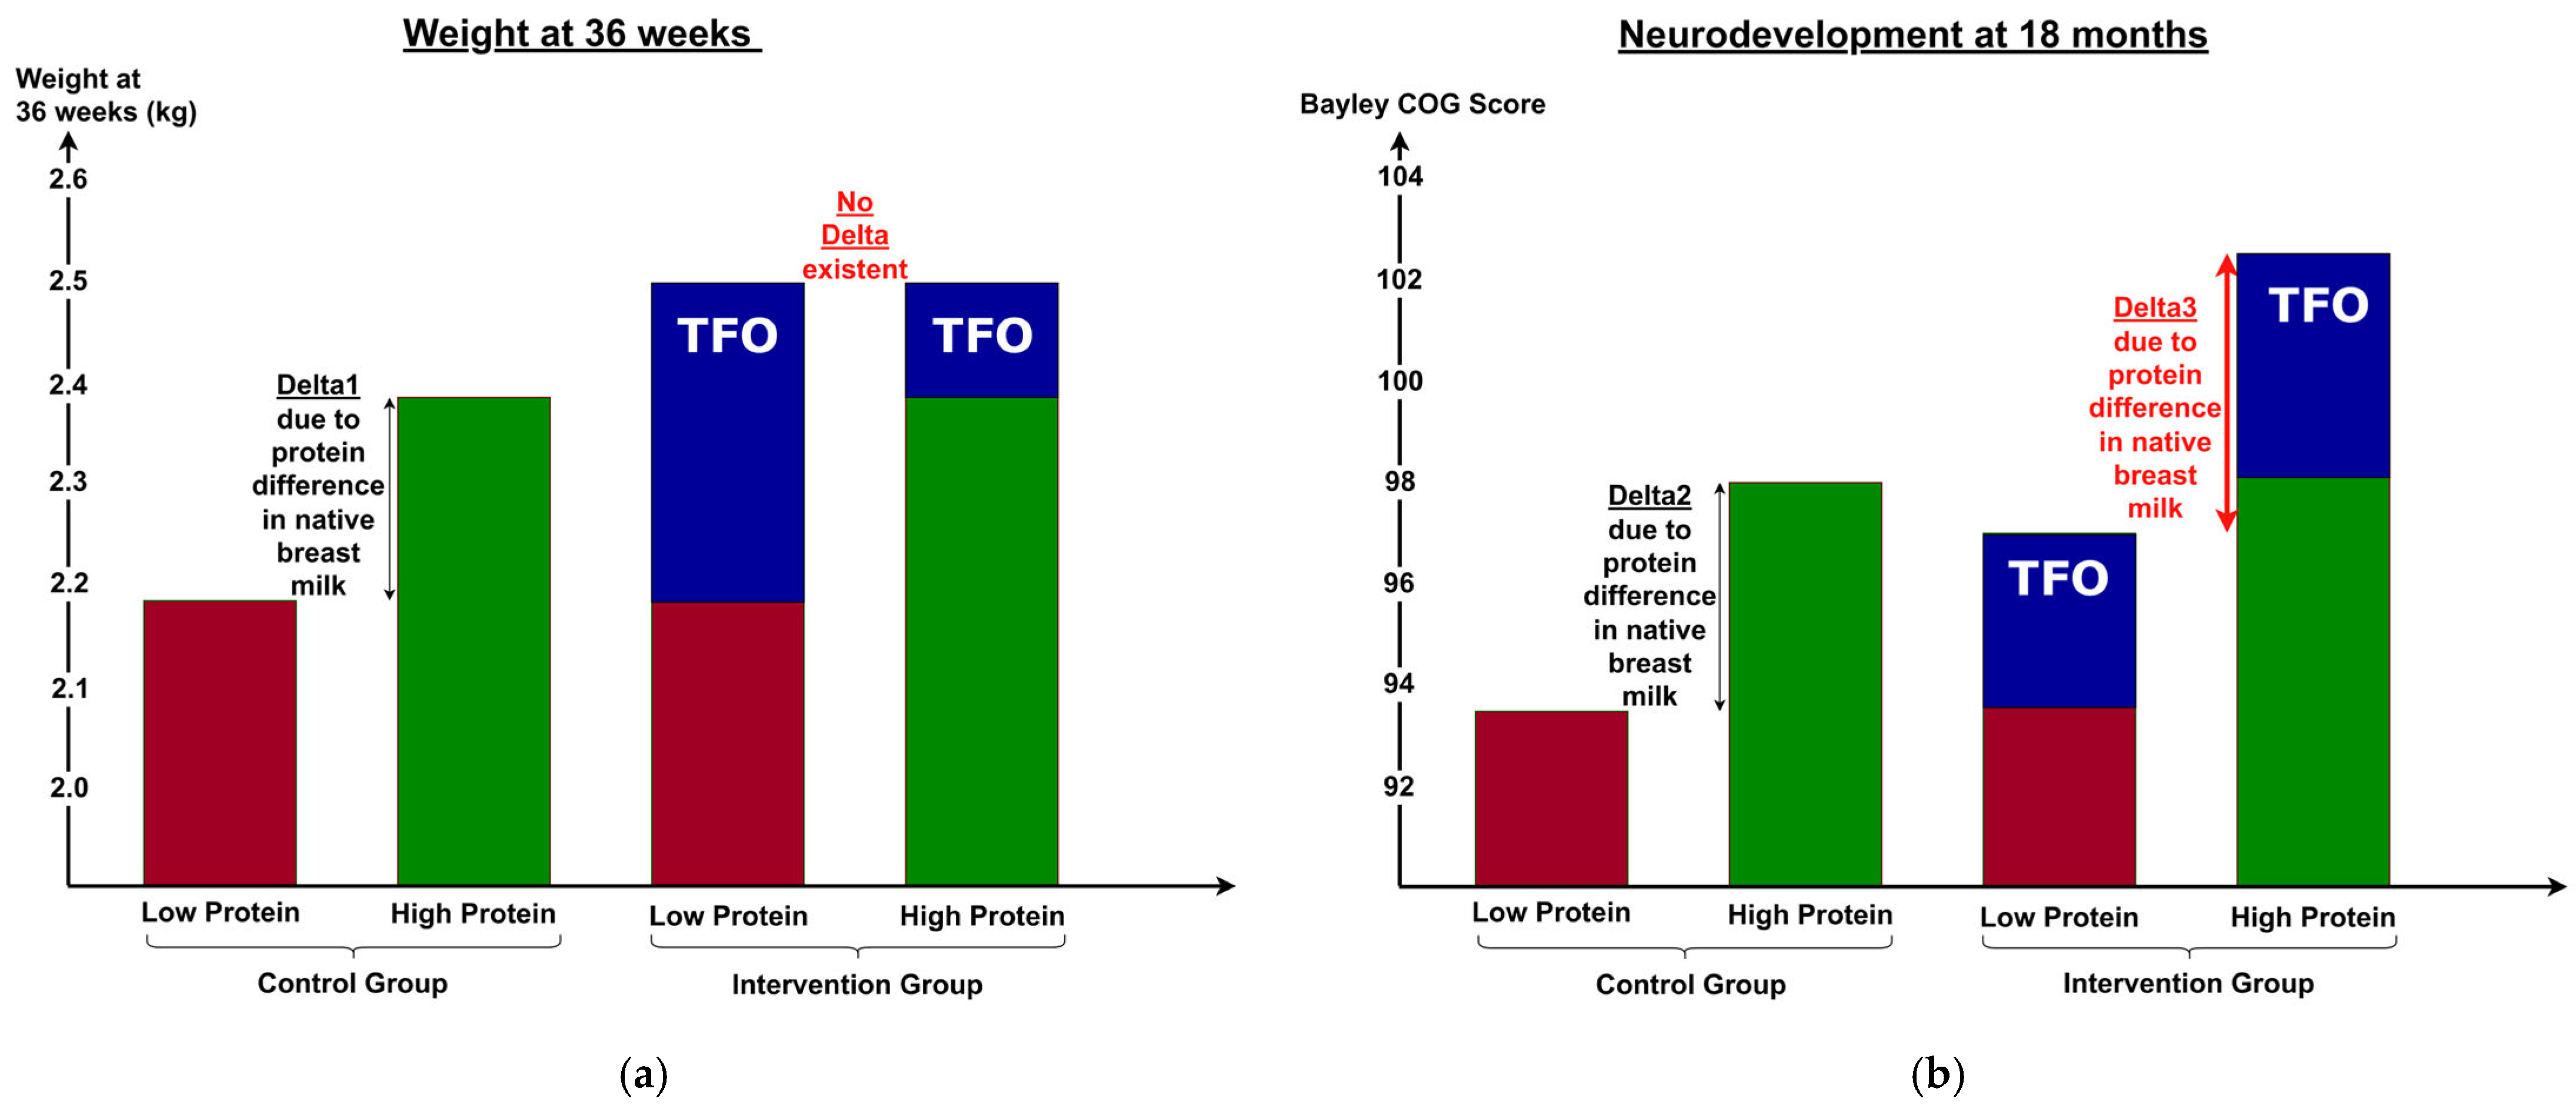
3.7. Differences Between Short- and Long-Term Outcomes
4. Discussion
4.1. Comparison with Previously Published TFO Studies
4.2. Interpretation of Results in the Scientific Context
4.3. Differences Between Short- and Long-Term Outcomes
4.4. Strengths and Limitations of the Study
4.5. Implications for Clinical Practice and Future Research
5. Conclusions
Author Contributions
Funding
Institutional Review Board Statement
Informed Consent Statement
Data Availability Statement
Conflicts of Interest
Abbreviations
| BM | Breast milk |
| BPD | Bronchopulmonary dysplasia |
| BSID-III | Bayley Scales of Infant and Toddler Development III |
| CI | Confidence interval |
| ESPGHAN | European Society for Paediatric Gastroenterology, Hepatology and Nutrition |
| GCLP | Good Clinical and Laboratory Practice |
| IVH | Intraventricular hemorrhage |
| NEC | Necrotizing enterocolitis |
| NICU | Neonatal intensive care unit |
| PDA | Patent ductus arteriosus |
| PMA | Postmenstrual age |
| RCT | Randomized controlled trial |
| SF | Standard fortification |
| TFO | Target fortification |
References
- Ehrenkranz, R.A.; Dusick, A.M.; Vohr, B.R.; Wright, L.L.; Wrage, L.A.; Poole, W.K.; for the National Institutes of Child Health and Human Development Neonatal Research Network. Growth in the Neonatal Intensive Care Unit Influences Neurodevelopmental and Growth Outcomes of Extremely Low Birth Weight Infants. Pediatrics 2006, 117, 1253–1261. [Google Scholar] [CrossRef]
- Barker, D.; Eriksson, J.; Forsén, T.; Osmond, C. Fetal Origins of Adult Disease: Strength of Effects and Biological Basis. Int. J. Epidemiol. 2002, 31, 1235–1239. [Google Scholar] [CrossRef] [PubMed]
- Embleton, N.E.; Pang, N.; Cooke, R.J. Postnatal Malnutrition and Growth Retardation: An Inevitable Consequence of Current Recommendations in Preterm Infants? Pediatrics 2001, 107, 270–273. [Google Scholar] [CrossRef] [PubMed]
- Ortinau, C.; Neil, J. The Neuroanatomy of Prematurity: Normal Brain Development and the Impact of Preterm Birth. Clin. Anat. 2015, 28, 168–183. [Google Scholar] [CrossRef] [PubMed]
- Belfort, M.B.; Rifas-Shiman, S.L.; Sullivan, T.; Collins, C.T.; McPhee, A.J.; Ryan, P.; Kleinman, K.P.; Gillman, M.W.; Gibson, R.A.; Makrides, M. Infant Growth Before and After Term: Effects on Neurodevelopment in Preterm Infants. Pediatrics 2011, 128, e899–e906. [Google Scholar] [CrossRef] [PubMed]
- Ramel, S.E.; Gray, H.L.; Christiansen, E.; Boys, C.; Georgieff, M.K.; Demerath, E.W. Greater Early Gains in Fat-Free Mass, but Not Fat Mass, Are Associated with Improved Neurodevelopment at 1 Year Corrected Age for Prematurity in Very Low Birth Weight Preterm Infants. J. Pediatr. 2016, 173, 108–115. [Google Scholar] [CrossRef]
- Horta, B.L.; Loret De Mola, C.; Victora, C.G. Long-term Consequences of Breastfeeding on Cholesterol, Obesity, Systolic Blood Pressure and Type 2 Diabetes: A Systematic Review and Meta-analysis. Acta Paediatr. 2015, 104, 30–37. [Google Scholar] [CrossRef]
- Underwood, M.A. Human Milk for the Premature Infant. Pediatr. Clin. N. Am. 2013, 60, 189–207. [Google Scholar] [CrossRef]
- Gidrewicz, D.A.; Fenton, T.R. A Systematic Review and Meta-Analysis of the Nutrient Content of Preterm and Term Breast Milk. BMC Pediatr. 2014, 14, 216. [Google Scholar] [CrossRef]
- Henriksen, C.; Westerberg, A.C.; Rønnestad, A.; Nakstad, B.; Veierød, M.B.; Drevon, C.A.; Iversen, P.O. Growth and Nutrient Intake among Very-Low-Birth-Weight Infants Fed Fortified Human Milk during Hospitalisation. Br. J. Nutr. 2009, 102, 1179–1186. [Google Scholar] [CrossRef]
- Arslanoglu, S.; Moro, G.E.; Ziegler, E.E. Adjustable Fortification of Human Milk Fed to Preterm Infants: Does It Make a Difference? J. Perinatol. 2006, 26, 614–621. [Google Scholar] [CrossRef] [PubMed]
- Agostoni, C.; Buonocore, G.; Carnielli, V.; De Curtis, M.; Darmaun, D.; Decsi, T.; Domellöf, M.; Embleton, N.; Fusch, C.; Genzel-Boroviczeny, O.; et al. Enteral Nutrient Supply for Preterm Infants: Commentary From the European Society of Paediatric Gastroenterology, Hepatology and Nutrition Committee on Nutrition. J. Pediatr. Gastroenterol. Nutr. 2010, 50, 85–91. [Google Scholar] [CrossRef] [PubMed]
- Rochow, N.; Fusch, G.; Ali, A.; Bhatia, A.; So, H.Y.; Iskander, R.; Chessell, L.; El Helou, S.; Fusch, C. Individualized Target Fortification of Breast Milk with Protein, Carbohydrates, and Fat for Preterm Infants: A Double-Blind Randomized Controlled Trial. Clin. Nutr. 2021, 40, 54–63. [Google Scholar] [CrossRef]
- Gunnerud, U.; Holst, J.J.; Östman, E.; Björck, I. The Glycemic, Insulinemic and Plasma Amino Acid Responses to Equi-Carbohydrate Milk Meals, a Pilot- Study of Bovine and Human Milk. Nutr. J. 2012, 11, 83. [Google Scholar] [CrossRef] [PubMed]
- Kashyap, S.; Towers, H.M.; Sahni, R.; Ohira-Kist, K.; Abildskov, K.; Schulze, K.F. Effects of Quality of Energy on Substrate Oxidation in Enterally Fed, Low-Birth-Weight Infants. Am. J. Clin. Nutr. 2001, 74, 374–380. [Google Scholar] [CrossRef]
- Fenton, T.R.; Kim, J.H. A Systematic Review and Meta-Analysis to Revise the Fenton Growth Chart for Preterm Infants. BMC Pediatr. 2013, 13, 59. [Google Scholar] [CrossRef]
- Finney, H. Reference Ranges for Plasma Cystatin C and Creatinine Measurements in Premature Infants, Neonates, and Older Children. Arch. Dis. Child. 2000, 82, 71–75. [Google Scholar] [CrossRef]
- Ridout, E.; Melara, D.; Rottinghaus, S.; Thureen, P.J. Blood Urea Nitrogen Concentration as a Marker of Amino-Acid Intolerance in Neonates with Birthweight Less than 1250 g. J. Perinatol. 2005, 25, 130–133. [Google Scholar] [CrossRef]
- Fusch, G.; Rochow, N.; Choi, A.; Fusch, S.; Poeschl, S.; Ubah, A.O.; Lee, S.-Y.; Raja, P.; Fusch, C. Rapid Measurement of Macronutrients in Breast Milk: How Reliable Are Infrared Milk Analyzers? Clin. Nutr. 2015, 34, 465–476. [Google Scholar] [CrossRef]
- Rochow, N.; Fusch, G.; Zapanta, B.; Ali, A.; Barui, S.; Fusch, C. Target Fortification of Breast Milk: How Often Should Milk Analysis Be Done? Nutrients 2015, 7, 2297–2310. [Google Scholar] [CrossRef]
- Spencer-Smith, M.M.; Spittle, A.J.; Lee, K.J.; Doyle, L.W.; Anderson, P.J. Bayley-III Cognitive and Language Scales in Preterm Children. Pediatrics 2015, 135, e1258–e1265. [Google Scholar] [CrossRef] [PubMed]
- UNICEF/UNDP/World Bank/WHO Special Programme for Research and Training in Tropical Diseases. Good Clinical Laboratory Practice (GCLP); World Health Organization: Geneva, Switzerland, 2009; 22p. [Google Scholar]
- Schulz, K.F.; Altman, D.G.; Moher, D.; CONSORT Group. CONSORT 2010 Statement: Updated Guidelines for Reporting Parallel Group Randomised Trials. BMJ 2010, 340, c332. [Google Scholar] [CrossRef] [PubMed]
- Apgar, V. A Proposal for a New Method of Evaluation of the Newborn Infant. Anesth. Analg. 2015, 120, 1056–1059. [Google Scholar] [CrossRef]
- Rochow, N.; Fusch, G.; Choi, A.; Chessell, L.; Elliott, L.; McDonald, K.; Kuiper, E.; Purcha, M.; Turner, S.; Chan, E.; et al. Target Fortification of Breast Milk with Fat, Protein, and Carbohydrates for Preterm Infants. J. Pediatr. 2013, 163, 1001–1007. [Google Scholar] [CrossRef]
- Brion, L.P.; Rosenfeld, C.R.; Heyne, R.; Brown, L.S.; Lair, C.S.; Petrosyan, E.; Jacob, T.; Caraig, M.; Burchfield, P.J. Optimizing Individual Nutrition in Preterm Very Low Birth Weight Infants: Double-Blinded Randomized Controlled Trial. J. Perinatol. 2020, 40, 655–665. [Google Scholar] [CrossRef]
- Bulut, O.; Coban, A.; Uzunhan, O.; Ince, Z. Effects of Targeted Versus Adjustable Protein Fortification of Breast Milk on Early Growth in Very Low-Birth-Weight Preterm Infants: A Randomized Clinical Trial. Nutr. Clin. Prac. 2020, 35, 335–343. [Google Scholar] [CrossRef] [PubMed]
- Cardoso, M.; Virella, D.; Papoila, A.L.; Alves, M.; Macedo, I.; Silva, E.D.; Pereira-da-Silva, L. Individualized Fortification Based on Measured Macronutrient Content of Human Milk Improves Growth and Body Composition in Infants Born Less than 33 Weeks: A Mixed-Cohort Study. Nutrients 2023, 15, 1533. [Google Scholar] [CrossRef]
- De Halleux, V.; Rigo, J. Variability in Human Milk Composition: Benefit of Individualized Fortification in Very-Low-Birth-Weight Infants. Am. J. Clin. Nutr. 2013, 98, 529S–535S. [Google Scholar] [CrossRef]
- Şimşek, G.K.; Alyamaç Dizdar, E.; Arayıcı, S.; Canpolat, F.E.; Sarı, F.N.; Uraş, N.; Oguz, S.S. Comparison of the Effect of Three Different Fortification Methods on Growth of Very Low Birth Weight Infants. Breastfeed. Med. 2019, 14, 63–68. [Google Scholar] [CrossRef]
- Khaira, S.; Pert, A.; Farrell, E.; Sibley, C.; Harvey-Wilkes, K.; Nielsen, H.C.; Volpe, M.V. Expressed Breast Milk Analysis: Role of Individualized Protein Fortification to Avoid Protein Deficit After Preterm Birth and Improve Infant Outcomes. Front. Pediatr. 2022, 9, 652038. [Google Scholar] [CrossRef]
- Maas, C.; Mathes, M.; Bleeker, C.; Vek, J.; Bernhard, W.; Wiechers, C.; Peter, A.; Poets, C.F.; Franz, A.R. Effect of Increased Enteral Protein Intake on Growth in Human Milk–Fed Preterm Infants: A Randomized Clinical Trial. JAMA Pediatr. 2017, 171, 16. [Google Scholar] [CrossRef] [PubMed]
- McLeod, G.; Sherriff, J.; Hartmann, P.E.; Nathan, E.; Geddes, D.; Simmer, K. Comparing Different Methods of Human Breast Milk Fortification Using Measured v. Assumed Macronutrient Composition to Target Reference Growth: A Randomised Controlled Trial. Br. J. Nutr. 2016, 115, 431–439. [Google Scholar] [CrossRef] [PubMed]
- Morlacchi, L.; Mallardi, D.; Giannì, M.L.; Roggero, P.; Amato, O.; Piemontese, P.; Consonni, D.; Mosca, F. Is Targeted Fortification of Human Breast Milk an Optimal Nutrition Strategy for Preterm Infants? An Interventional Study. J. Transl. Med. 2016, 14, 195. [Google Scholar] [CrossRef]
- Olhager, E.; Danielsson, I.; Sauklyte, U.; Törnqvist, C. Different Feeding Regimens Were Not Associated with Variation in Body Composition in Preterm Infants. J. Matern. Fetal Neonatal Med. 2022, 35, 6403–6410. [Google Scholar] [CrossRef]
- Parat, S.; Raza, P.; Kamleh, M.; Super, D.; Groh-Wargo, S. Targeted Breast Milk Fortification for Very Low Birth Weight (VLBW) Infants: Nutritional Intake, Growth Outcome and Body Composition. Nutrients 2020, 12, 1156. [Google Scholar] [CrossRef]
- Polberger, S.; Räihä, N.C.R.; Juvonen, P.; Moro, G.E.; Minoli, I.; Warm, A. Individualized Protein Fortification of Human Milk for Preterm Infants: Comparison of Ultrafiltrated Human Milk Protein and a Bovine Whey Fortifier. J. Pediatr. Gastroenterol. Nutr. 1999, 29, 332–338. [Google Scholar] [CrossRef]
- Quan, M.; Wang, D.; Gou, L.; Sun, Z.; Ma, J.; Zhang, L.; Wang, C.; Schibler, K.; Li, Z. Individualized Human Milk Fortification to Improve the Growth of Hospitalized Preterm Infants. Nutr. Clin. Pract. 2020, 35, 680–688. [Google Scholar] [CrossRef]
- Reali, A.; Greco, F.; Marongiu, G.; Deidda, F.; Atzeni, S.; Campus, R.; Dessì, A.; Fanos, V. Individualized Fortification of Breast Milk in 41 Extremely Low Birth Weight (ELBW) Preterm Infants. Clin. Chim. Acta 2015, 451, 107–110. [Google Scholar] [CrossRef] [PubMed]
- Seliga-Siwecka, J.; Fiałkowska, J.; Chmielewska, A. Effect of Targeted vs. Standard Fortification of Breast Milk on Growth and Development of Preterm Infants (≤32 Weeks): Results from an Interrupted Randomized Controlled Trial. Nutrients 2023, 15, 619. [Google Scholar] [CrossRef]
- Kashyap, S.; Ohira-Kist, K.; Abildskov, K.; Towers, H.M.; Sahni, R.; Ramakrishnan, R.; Schulze, K. Effects of Quality of Energy Intake on Growth and Metabolic Response of Enterally Fed Low-Birth-Weight Infants. Pediatr. Res. 2001, 50, 390–397. [Google Scholar] [CrossRef]
- Embleton, N.D.; Cooke, R.J. Protein Requirements in Preterm Infants: Effect of Different Levels of Protein Intake on Growth and Body Composition. Pediatr. Res. 2005, 58, 855–860. [Google Scholar] [CrossRef] [PubMed]
- Cormack, B.E.; Bloomfield, F.H. Increased Protein Intake Decreases Postnatal Growth Faltering in ELBW Babies. Arch. Dis. Child. Fetal Neonatal Ed. 2013, 98, F399–F404. [Google Scholar] [CrossRef]
- Dinerstein, A.; Nieto, R.M.; Solana, C.L.; Perez, G.P.; Otheguy, L.E.; Larguia, A.M. Early and Aggressive Nutritional Strategy (Parenteral and Enteral) Decreases Postnatal Growth Failure in Very Low Birth Weight Infants. J. Perinatol. 2006, 26, 436–442. [Google Scholar] [CrossRef] [PubMed]
- Maggio, L.; Cota, F.; Gallini, F.; Lauriola, V.; Zecca, C.; Romagnoli, C. Effects of High versus Standard Early Protein Intake on Growth of Extremely Low Birth Weight Infants. J. Pediatr. Gastroenterol. Nutr. 2007, 44, 124–129. [Google Scholar] [CrossRef]
- Pauls, J.; Bauer, K.; Versmold, H. Postnatal Body Weight Curves for Infants below 1000 g Birth Weight Receiving Early Enteral and Parenteral Nutrition. Eur. J. Pediatr. 1998, 157, 416–421. [Google Scholar] [CrossRef]
- Shan, H.M.; Cai, W.; Cao, Y.; Fang, B.H.; Feng, Y. Extrauterine Growth Retardation in Premature Infants in Shanghai: A Multicenter Retrospective Review. Eur. J. Pediatr. 2009, 168, 1055–1059. [Google Scholar] [CrossRef] [PubMed]
- Wilson, D.C.; Cairns, P.; Halliday, H.L.; Reid, M.; McClure, G.; Dodge, J.A. Randomised Controlled Trial of an Aggressive Nutritional Regimen in Sick Very Low Birthweight Infants. Arch. Dis. Child. Fetal Neonatal Ed. 1997, 77, F4–F11. [Google Scholar] [CrossRef]
- Stephens, B.E.; Walden, R.V.; Gargus, R.A.; Tucker, R.; McKinley, L.; Mance, M.; Nye, J.; Vohr, B.R. First-Week Protein and Energy Intakes Are Associated With 18-Month Developmental Outcomes in Extremely Low Birth Weight Infants. Pediatrics 2009, 123, 1337–1343. [Google Scholar] [CrossRef]
- Van Beek, P.E.; Claessens, N.H.P.; Makropoulos, A.; Groenendaal, F.; De Vries, L.S.; Counsell, S.J.; Benders, M.J.N.L. Increase in Brain Volumes after Implementation of a Nutrition Regimen in Infants Born Extremely Preterm. J. Pediatr. 2020, 223, 57–63.E5. [Google Scholar] [CrossRef]
- Eleni Dit Trolli, S.; Kermorvant-Duchemin, E.; Huon, C.; Bremond-Gignac, D.; Lapillonne, A. Early Lipid Supply and Neurological Development at One Year in Very Low Birth Weight (VLBW) Preterm Infants. Early Hum. Dev. 2012, 88, S25–S29. [Google Scholar] [CrossRef]
- Ehrenkranz, R.A. Nutrition, Growth and Clinical Outcomes. In World Review of Nutrition and Dietetics; Koletzko, B., Poindexter, B., Uauy, R., Eds.; S. Karger AG: Basel, Switzerland, 2014; Volume 110, pp. 11–26. ISBN 978-3-318-02640-5. [Google Scholar]
- Pfister, K.M.; Zhang, L.; Miller, N.C.; Ingolfsland, E.C.; Demerath, E.W.; Ramel, S.E. Early Body Composition Changes Are Associated with Neurodevelopmental and Metabolic Outcomes at 4 Years of Age in Very Preterm Infants. Pediatr. Res. 2018, 84, 713–718. [Google Scholar] [CrossRef] [PubMed]
- Ramel, S.E.; Haapala, J.; Super, J.; Boys, C.; Demerath, E.W. Nutrition, Illness and Body Composition in Very Low Birth Weight Preterm Infants: Implications for Nutritional Management and Neurocognitive Outcomes. Nutrients 2020, 12, 145. [Google Scholar] [CrossRef]
- Cheong, J.L.Y.; Hunt, R.W.; Anderson, P.J.; Howard, K.; Thompson, D.K.; Wang, H.X.; Bear, M.J.; Inder, T.E.; Doyle, L.W. Head Growth in Preterm Infants: Correlation With Magnetic Resonance Imaging and Neurodevelopmental Outcome. Pediatrics 2008, 121, e1534–e1540. [Google Scholar] [CrossRef]
- Neubauer, V.; Griesmaier, E.; Pehböck-Walser, N.; Pupp-Peglow, U.; Kiechl-Kohlendorfer, U. Poor Postnatal Head Growth in Very Preterm Infants Is Associated with Impaired Neurodevelopment Outcome. Acta Paediatr. 2013, 102, 883–888. [Google Scholar] [CrossRef]
- Amrhein, V.; Greenland, S.; McShane, B. Scientists Rise up against Statistical Significance. Nature 2019, 567, 305–307. [Google Scholar] [CrossRef] [PubMed]
- UNICEF; WHO. Global Strategy for Infant and Young Child Feeding; World Health Organization: Geneva, Switzerland, 2003; ISBN 978-92-4-156221-8. [Google Scholar]
- Lapillonne, A. Feeding the Preterm Infant after Discharge. In World Review of Nutrition and Dietetics; Koletzko, B., Poindexter, B., Uauy, R., Eds.; S. Karger AG: Basel, Switzerland, 2014; Volume 110, pp. 264–277. ISBN 978-3-318-02640-5. [Google Scholar]
- Kwan, C.; Fusch, G.; Rochow, N.; Fusch, C.; Kwan, C.; Fusch, G.; Rochow, N.; el-Helou, S.; Belfort, M.; Festival, J.; et al. Milk Analysis Using Milk Analyzers in a Standardized Setting (MAMAS) Study: A Multicentre Quality Initiative. Clin. Nutr. 2020, 39, 2121–2128. [Google Scholar] [CrossRef] [PubMed]
- Hack, M.; Taylor, H.G.; Drotar, D.; Schluchter, M.; Cartar, L.; Wilson-Costello, D.; Klein, N.; Friedman, H.; Mercuri-Minich, N.; Morrow, M. Poor Predictive Validity of the Bayley Scales of Infant Development for Cognitive Function of Extremely Low Birth Weight Children at School Age. Pediatrics 2005, 116, 333–341. [Google Scholar] [CrossRef]
- Noble, K.G.; Houston, S.M.; Brito, N.H.; Bartsch, H.; Kan, E.; Kuperman, J.M.; Akshoomoff, N.; Amaral, D.G.; Bloss, C.S.; Libiger, O.; et al. Family Income, Parental Education and Brain Structure in Children and Adolescents. Nat. Neurosci. 2015, 18, 773–778. [Google Scholar] [CrossRef]
- Patra, K.; Greene, M.; Patel, A.; Meier, P. Maternal Education Level Predicts Cognitive, Language, and Motor Outcome in Preterm Infants in the Second Year of Life. Am. J. Perinatol. 2016, 33, 738–744. [Google Scholar] [CrossRef]
- Ong, K.K.; Kennedy, K.; Castañeda-Gutiérrez, E.; Forsyth, S.; Godfrey, K.M.; Koletzko, B.; Latulippe, M.E.; Ozanne, S.E.; Rueda, R.; Schoemaker, M.H.; et al. Postnatal Growth in Preterm Infants and Later Health Outcomes: A Systematic Review. Acta Paediatr. 2015, 104, 974–986. [Google Scholar] [CrossRef]
- Haiden, N.; Luque, V.; Domellöf, M.; Hill, S.; Kivelä, L.; De Koning, B.; Köglmeier, J.; Moltu, S.J.; Norsa, L.; De Pipaon, M.S.; et al. Assessment of Growth Status and Nutritional Management of Prematurely Born Infants after Hospital Discharge: A Position Paper of the ESPGHAN Nutrition Committee. J. Pediatr. Gastroenterol. Nutr. 2025, jpn3.70054. [Google Scholar] [CrossRef] [PubMed]


| Control Group | Intervention Group | |||||
|---|---|---|---|---|---|---|
| All (n = 51) | BSID-III (n = 35) | No BSID-III (n = 16) | All (n = 52) | BSID-III (n = 34) | No BSID-III (n = 18) | |
| Gestational age at birth (weeks) | 27.3 ± 1.7 | 27.1 ± 1.8 | 27.7 ± 1.6 | 27.2 ± 1.2 | 27.2 ± 1.3 | 27.2 ± 1.0 |
| Birth weight (g) | 980 ± 270 | 970 ± 260 | 1010 ± 290 | 980 ± 210 | 950 ± 200 | 1030 ± 230 |
| Length at birth (cm) | 34.7 ± 3.7 | 34.9 ± 3.8 | 34.3 ± 3.8 | 35.2 ± 2.4 | 34.8 ± 2.5 | 36.1 ± 1.8 |
| Head circumference at birth (cm) | 24.6 ± 1.9 | 24.7 ± 2.2 | 24.5 ± 1.7 | 24.8 ± 1.7 | 24.6 ± 1.4 | 25.2 ± 2.2 |
| Sex, number of males (percentage) | 27 (53%) | 19 (54%) | 8 (50%) | 28 (54%) | 22 (65%) | 6 (33%) |
| Apgar < 7 at 1 min | 36 (71%) | 24 (69%) | 12 (75%) | 35 (67%) | 23 (68%) | 12 (67%) |
| Apgar < 7 at 5 min | 17 (33%) | 10 (29%) | 7 (44%) | 14 (27%) | 9 (26%) | 5 (28%) |
| Maternal age (years) | 29.7 ± 5.8 | 30.6 ± 5.2 | 27.8 ± 6.6 | 30.6 ± 6.3 | 29.8 ± 6.2 | 32.2 ± 6.3 |
| PMA at start of study (weeks) | 30.8 ± 1.4 | 30.6 ± 1.4 | 31.1 ± 1.5 | 30.5 ± 1.0 | 30.6 ± 1.1 | 30.3 ± 0.9 |
| Day of life at start of study (days) | 25 ± 7 | 25 ± 8 | 24 ± 7 | 23 ± 6 | 24 ± 7 | 22 ± 4 |
| Duration of intervention (days) | 28 ± 10 | 29 ± 11 | 26 ± 9 | 27 ± 9 | 29 ± 10 | 22 ± 5 |
| Corrected age at BSID-III (months) | 18.9 ± 1.9 | 18.5 ± 1.3 | ||||
| Weight at BSID-III (kg) | 11.1 ± 1.5 | 11.0 ± 1.3 | ||||
| Length at BSID-III (cm) | 80.8 ± 5.1 | 80.0 ± 3.2 | ||||
| Head circumference at BSID-III (cm) | 47.9 ± 1.8 | 47.6 ± 1.6 | ||||
| Control Group | Intervention Group | |||
|---|---|---|---|---|
| All (n = 51) | BSID-III (n = 35) | All (n = 52) | BSID-III (n = 34) | |
| Maternal diabetes | 3 (6%) | 2 (6%) | 6 (12%) | 6 (18%) |
| Hypertension/preeclampsia | 12 (24%) | 7 (20%) | 17 (33%) | 15 (44%) * |
| Suspected chorioamnionitis | 15 (29%) | 10 (29%) | 13 (25%) | 9 (26%) |
| Antenatal corticosteroids | 49 (96%) | 34 (97%) | 47 (90%) | 29 (85%) |
| Deceased before discharge | 2 (4%) | 0 (0%) | 0 (0%) | 0 (0%) |
| NEC all cases | 2 (4%) | 0 (0%) | 0 (0%) | 0 (0%) |
| NEC Bell stage 3 | 1 (2%) | 0 (0%) | 0 (0%) | 0 (0%) |
| Sepsis clinical | 19 (37%) | 15 (43%) | 14 (27%) | 14 (41%) |
| Sepsis culture positive | 7 (14%) | 6 (17%) | 10 (19%) | 7 (21%) |
| PDA | 30 (59%) | 22 (63%) | 29 (56%) | 21 (62%) |
| PDA treated | 21 (41%) | 14 (40%) | 14 (27%) | 9 (26%) |
| BPD mild | 17 (33%) | 10 (29%) | 15 (29%) | 10 (29%) |
| BPD moderate/severe | 18 (35%) | 15 (43%) | 16 (31%) | 14 (41%) |
| Feeding intolerance | 14 (27%) | 11 (31%) | 8 (15%) ** | 5 (15%) |
| All | Low-Protein Group | High-Protein Group | |||||||
|---|---|---|---|---|---|---|---|---|---|
| Control Group (n = 35) | Intervention Group (n = 34) | Mean Difference [95% CI] | Control Group (n = 17) | Intervention Group (n = 20) | Mean Difference [95% CI] | Control Group (n = 18) | Intervention Group (n = 14) | Mean Difference [95% CI] | |
| Native human milk | |||||||||
| Fat (g/dL) | 3.6 ± 0.5 | 3.6 ± 0.6 | 0.0 [−0.3; 0.2] | 3.4 ± 0.5 | 3.4 ± 0.6 | 0.1 [−0.4; 0.3] | 3.8 ± 0.4 | 3.9 ± 0.6 | 0.1 [−0.4; 0.3] |
| Lactose (g/dL) | 6.5 ± 0.4 | 6.7 ± 0.4 | 0.2 [−0.4; 0.0] | 6.4 ± 0.4 | 6.7 ± 0.4 * | 0.3 [−0.6; −0.1] | 6.7 ± 0.5 | 6.7 ± 0.4 | 0.0 [−0.4; 0.3] |
| Protein (g/dL) | 1.2 ± 0.2 | 1.1 ± 0.2 | 0.0 [−0.1; 0.1] | 1.0 ± 0.1 | 1.0 ± 0.1 | 0.1 [−0.1; 0.0] | 1.3 ± 0.2 | 1.3 ± 0.1 | 0.0 [0.0; 0.1] |
| Intervention parameters—Nutritional intake | |||||||||
| Duration of intervention (days) | 29 ± 11 | 29 ± 10 | 0.3 [−5.3; 4.7] | 27 ± 10 | 28 ± 10 | 0.9 [−7.7; 5.9] | 31 ± 12 | 31 ± 9 | 0.4 [−8.1; 7.3] |
| Total fluid intake (mL/kg/d) | 155 ± 5 | 152 ± 5 ** | 3.2 [0.9; 5.6] | 155 ± 5 | 151 ± 6 * | 4.3 [0.7; 7.9] | 155 ± 4 | 153 ± 4 | 1.8 [−1.2; 4.8] |
| Fat (g/kg/d) | 7.1 ± 0.7 | 7.6 ± 0.7 * | 0.5 [−0.8; −0.1] | 6.8 ± 0.8 | 7.3 ± 0.7 * | 0.5 [−1.0; −0.0] | 7.4 ± 0.5 | 8.0 ± 0.6 * | 0.5 [−1.0; −0.1] |
| Carbohydrates (g/kg/d) | 10.8 ± 0.8 | 13.6 ± 0.6 *** | 2.8 [−3.1; −2.5] | 10.6 ± 0.4 | 13.5 ± 0.6 *** | 2.9 [−3.3; −2.6] | 11.0 ± 1.0 | 13.7 ± 0.6 *** | 2.7 [−3.3; −2.2] |
| Protein (g/kg/d) | 3.6 ± 0.3 | 4.5 ± 0.2 *** | 0.9 [−1.1; −0.8] | 3.3 ± 0.2 | 4.5 ± 0.1 *** | 1.2 [−1.3; −1.1] | 3.9 ± 0.2 | 4.6 ± 0.2 *** | 0.7 [−0.9; −0.6] |
| Energy (kcal/kg/d) | 122 ± 8 | 141 ± 8 *** | 19 [−23; −15] | 117 ± 8 | 138 ± 7 *** | 21 [−26; −16] | 126 ± 6 | 145 ± 7 *** | 19 [−23; −14] |
| Protein-to-energy ratio (g/100 kcal) | 3.0 ± 0.2 | 3.2 ± 0.2 *** | 0.3 [−0.4; −0.2] | 2.8 ± 0.2 | 3.3 ± 0.2 *** | 0.4 [−0.6; −0.3] | 3.1 ± 0.2 | 3.2 ± 0.2 | 0.1 [−0.3; 0.1] |
| Intervention parameters—Growth outcomes | |||||||||
| Weight at 36 weeks PMA (g) | 2283 ± 332 | 2514 ± 289 ** | 231 [−381; −81] | 2134 ± 277 | 2525 ± 283 *** | 391 [−578; −203] | 2423 ± 324 | 2498 ± 308 | 75 [−306; 156] |
| Average 21-day growth velocity (g/kg/d) | 19.2 ± 2.2 | 21.7 ± 2.3 *** | 2.5 [−3.6; −1.4] | 18.7 ± 2.3 | 21.4 ± 2.3 ** | 2.6 [−4.2; −1.1] | 19.7 ± 2.2 | 22.2 ± 2.2 ** | 2.5 [−4.1; −0.9] |
| Nutritional efficiency (g/dL) | 12.4 ± 1.6 | 14.3 ± 1.7 *** | 1.9 [−2.7; −1.1] | 12.1 ± 1.5 | 14.2 ± 1.9 *** | 2.1 [−3.3; −1.0] | 12.7 ± 1.6 | 14.5 ± 1.6 ** | 1.8 [−3.0; −0.6] |
| All | Low-Protein Group | High-Protein Group | |||||||
|---|---|---|---|---|---|---|---|---|---|
| Control Group (n = 29) | Intervention Group (n = 22) | Mean Difference [95% CI] | Control Group (n = 14) | Intervention Group (n = 12) | Mean Difference [95% CI] | Control Group (n = 15) | Intervention Group (n = 10) | Mean Difference [95% CI] | |
| Total body mass (g) | 2318 ± 356 | 2506 ± 273 * | 187 [−371; −4] | 2142 ± 292 | 2529 ± 273 ** | 388 [−618, −158] | 2482 ± 338 | 2477 ± 285 | 5 [−264, 274] |
| Length (cm) | 43.1 ± 2.2 | 44.1 ± 1.7 | 1.0 [−2.2; 0.2] | 42.3 ± 2.0 | 44.8 ± 1.9 ** | 2.5 [−4.1, −0.9] | 43.9 ± 2.2 | 43.3 ± 1.3 | 0.5 [−1.0, 2.1] |
| Head circumference (cm) | 31.4 ± 1.5 | 31.5 ± 1.4 | 0.0 [−0.8; 0.8] | 30.6 ± 1.3 | 31.4 ± 1.4 | 0.9 [−2.0, 0.3] | 32.3 ± 1.1 | 31.5 ± 1.5 | 0.8 [−0.3, 1.8] |
| Fat mass (%) | 21 ± 6 | 23 ± 6 | 2.6 [−6.1; 0.9] | 21 ± 6 | 24 ± 6 | 2.9 [−7.5, 1.7] | 20 ± 7 | 22 ± 7 | 2.0 [−7.8, 3.7] |
| Fat mass (g) | 483 ± 186 | 583 ± 181 | 101 [−205; 4] | 451 ± 144 | 610 ± 191 * | 159 [−295, −23] | 512 ± 219 | 551 ± 173 | 39 [−210, 132] |
| Fat mass index (kg/m2) | 2.6 ± 0.9 | 3.0 ± 1.0 | 0.4 [−1.0; 0.1] | 2.5 ± 0.8 | 3.1 ± 1.1 | 0.6 [−1.4, 0.1] | 2.6 ± 1.1 | 2.9 ± 0.9 | 0.2 [−1.1, 0.6] |
| Fat-free mass (%) | 79 ± 6 | 77 ± 6 | 2.6 [−0.9; 6.1] | 79 ± 6 | 76 ± 6 | 2.9 [−1.7, 7.5] | 80 ± 7 | 78 ± 7 | 2.0 [−3.7, 7.8] |
| Fat-free mass (g) | 1835 ± 274 | 1922 ± 217 | 87 [−230; 55] | 1691 ± 240 | 1920 ± 183 * | 229 [−404, −54] | 1970 ± 238 | 1925 ± 263 | 44 [−165, 254] |
| Fat-free mass index (kg/m2) | 9.7 ± 0.9 | 9.9 ± 1.0 | 0.1 [−0.7; 0.4] | 9.3 ± 0.8 | 9.7 ± 0.9 | 0.5 [−1.1, 0.2] | 10.2 ± 0.8 | 10.0 ± 1.2 | 0.2 [−0.6, 1.0] |
| Body mass index (kg/m2) | 12.3 ± 1.2 | 12.9 ± 1.4 | 0.6 [−1.3; 0.2] | 11.7 ± 1.2 | 12.8 ± 1.7 | 1.1 [−2.3, 0.1] | 12.8 ± 1.1 | 12.9 ± 1.2 | 0.1 [−1.0, 0.9] |
| All | Low-Protein Group | High-Protein Group | Low-Protein Control vs. High-Protein Intervention | |||||||||||
|---|---|---|---|---|---|---|---|---|---|---|---|---|---|---|
| Bayley Score | Control Group (n = 29) | Inter-vention Group (n = 22) | Mean Difference [95% CI] | p | Control Group (n = 14) | Inter- vention Group (n = 12) | Mean Difference [95% CI] | p | Control Group (n = 15) | Inter-vention Group (n = 10) | Mean Difference [95% CI] | p | Mean Difference [95% CI] | p |
| Cognitive | 95.7 ± 13.0 | 99.3 ± 11.6 | 3.6 [−9.5, 2.4] | 0.235 | 93.5 ± 15.9 | 97.0 ± 12.3 | 3.5 [−12.9, 5.9] | 0.459 | 97.8 ± 9.6 | 102.5 ± 10.0 | 4.7 [−11.8, 2.4] | 0.184 | 9.0 [−19.0, 0.6] | 0.066 |
| Language | 87.4 ± 16.7 | 90.1 ± 14.8 | 2.7 [−10.7, 5.2] | 0.497 | 89.1 ± 20.9 | 87.4 ± 17.5 | 1.7 [−11.5, 14.9] | 0.796 | 85.8 ± 11.6 * | 94.5 ± 7.9 * | 8.8 [−16.8, −0.7] | 0.034 | 5.4 [−17.4, 6.5] | 0.353 |
| —receptive | 92.3 ± 15.3 | 93.9 ± 16.3 | 1.6 [−9.5, 6.3] | 0.694 | 92.3 ± 19.1 | 91.1 ± 18.8 | 1.3 [−12.0, 14.6] | 0.846 | 92.4 ± 11.7 | 98.1 ± 11.1 | 5.7 [−14.4, 2.9] | 0.186 | 5.7 [−18.1, 6.6] | 0.349 |
| —expressive | 84.8 ± 14.6 | 88.3 ± 10.7 | 3.4 [−9.9, 3.0] | 0.289 | 86.3 ± 18.4 | 87.0 ± 12.7 | 0.7 [−11.3, 10.0] | 0.900 | 83.4 ± 10.3 * | 90.4 ± 6.2 * | 7.0 [−13.9, −0.1] | 0.048 | 4.1 [−14.7, 6.6] | 0.431 |
| Motor | 93.0 ± 12.8 | 94.8 ± 9.2 | 1.8 [−7.2, 3.6] | 0.501 | 91.5 ± 16.5 | 92.0 ± 8.9 | 0.5 [−10.0, 9.0] | 0.914 | 94.3 ± 8.5 | 98.8 ± 8.2 | 4.5 [−10.6, 1.6] | 0.142 | 7.3 [−17.0, 2.4] | 0.133 |
| —fine | 97.3 ± 11.0 | 98.4 ± 10.6 | 1.1 [−6.4, 4.2] | 0.676 | 96.3 ± 11.7 | 95.8 ± 11.2 | 0.6 [−7.3, 8.5] | 0.882 | 98.1 ± 10.7 | 102.1 ± 8.7 | 4.1 [−11.3, 3.1] | 0.256 | 5.8 [−13.7, 2.1] | 0.144 |
| —gross | 89.2 ± 12.9 | 92.2 ± 9.4 | 3.0 [−8.5, 2.5] | 0.286 | 87.3 ± 16.2 | 90.0 ± 10.3 | 2.7 [−11.8, 6.5] | 0.556 | 90.8 ± 9.6 | 95.4 ± 7.2 | 4.5 [10.8, 1.8] | 0.152 | 8.0 [−17.7, 1.6] | 0.098 |
| BSID-III | Control Group (n = 35) | Intervention Group (n = 34) | p |
|---|---|---|---|
| Cognitive scale ≤ 85 | 8 | 3 | 0.052 |
| Cognitive scale ≤ 70 | 3 | 1 | 0.155 |
| Language scale ≤ 85 | 14 | 11 | 0.250 |
| Language scale ≤ 70 | 4 | 3 | 0.360 |
| Motor scale ≤ 85 | 9 | 6 | 0.189 |
| Motor scale ≤ 70 | 3 | 0 * | 0.035 |
Disclaimer/Publisher’s Note: The statements, opinions and data contained in all publications are solely those of the individual author(s) and contributor(s) and not of MDPI and/or the editor(s). MDPI and/or the editor(s) disclaim responsibility for any injury to people or property resulting from any ideas, methods, instructions or products referred to in the content. |
© 2025 by the authors. Licensee MDPI, Basel, Switzerland. This article is an open access article distributed under the terms and conditions of the Creative Commons Attribution (CC BY) license (https://creativecommons.org/licenses/by/4.0/).
Share and Cite
Rochow, N.; Leier, N.G.; Weiss, G.A.; Fusch, G.; Ali, A.; Bhatia, A.; el Helou, S.; Däbritz, J.; Fusch, C. Individualized Target Fortification of Breast Milk with Protein, Carbohydrates, and Fat for Preterm Infants: Effect on Neurodevelopment. Nutrients 2025, 17, 1764. https://doi.org/10.3390/nu17111764
Rochow N, Leier NG, Weiss GA, Fusch G, Ali A, Bhatia A, el Helou S, Däbritz J, Fusch C. Individualized Target Fortification of Breast Milk with Protein, Carbohydrates, and Fat for Preterm Infants: Effect on Neurodevelopment. Nutrients. 2025; 17(11):1764. https://doi.org/10.3390/nu17111764
Chicago/Turabian StyleRochow, Niels, Nicolas Gabriel Leier, Gisela Adrienne Weiss, Gerhard Fusch, Anaam Ali, Akshdeep Bhatia, Salhab el Helou, Jan Däbritz, and Christoph Fusch. 2025. "Individualized Target Fortification of Breast Milk with Protein, Carbohydrates, and Fat for Preterm Infants: Effect on Neurodevelopment" Nutrients 17, no. 11: 1764. https://doi.org/10.3390/nu17111764
APA StyleRochow, N., Leier, N. G., Weiss, G. A., Fusch, G., Ali, A., Bhatia, A., el Helou, S., Däbritz, J., & Fusch, C. (2025). Individualized Target Fortification of Breast Milk with Protein, Carbohydrates, and Fat for Preterm Infants: Effect on Neurodevelopment. Nutrients, 17(11), 1764. https://doi.org/10.3390/nu17111764