Abstract
Background: Obesity, mainly visceral obesity, causes a low-grade of chronic inflammation (meta-inflammation), associated with comorbidities such as type 2 diabetes, cardiovascular diseases, and certain cancers. Precision Nutrition aims to understand the bidirectional crosstalk between the genome and diet to improve human health. Additionally, by leveraging individual data, Precision Nutrition seeks to predict how people will respond to specific foods or dietary patterns, with the ultimate goal of providing personalized nutritional recommendations tailored to their unique needs and lifestyle factors, including poor dietary habits (e.g., high intake of sugar or saturated fatty acids, alcohol consumption, etc.) and sedentary habits, exacerbate obesity in genetically predisposed individuals. Genetic, metabolic, and environmental factors can play a crucial role during obesity. Objective: To investigate the effects of genetic variability in sweet taste receptors and their downstream signaling pathways in the gut–brain axis on anthropometry, biochemistry, and lifestyle variables. Methods: A sample of 676 volunteers (mean age of 42.22 ± 12 years, ranging from 18 to 73 years) from the database of the GENYAL platform for nutritional trials at the IMDEA Food Institute were included in this study. We present a first-in-class genetic chip, Glucosensing, designed to interrogate 25 single-nucleotide polymorphisms (SNPs) located in genes encoding sweet taste receptors and components of downstream signaling pathways. These include elements of the gut–brain axis and its associated metabolic networks, enabling a comprehensive analysis of individual variability in sweet taste perception and metabolic responses. Results: Several significant associations were found after correction for multiple comparisons, representing potential targets for personalized interventions.
1. Introduction
Obesity is a global epidemic affecting over 2.5 billion adults which significantly increases the risk of comorbidities such as type 2 diabetes, cardiovascular diseases, and certain types of cancers. Precision Nutrition aims to understand the bidirectional crosstalk between the genome and diet to improve human health. Additionally, by leveraging individual data, Precision Nutrition seeks to predict how people will respond to specific foods or dietary patterns, with the ultimate goal of providing personalized nutritional recommendations tailored to their unique needs [1,2,3]. Additional factors associated with the lifestyle characteristics and nutritional and metabolic status of individuals (e.g., obesity, metabolic syndrome, dyslipidemia, etc.) are key factors to be considered in the development of personalized interventions in chronic diseases [4]. The genetic contribution to obesity has been extensively investigated in genome-wide association studies (GWAS) which have successfully identified susceptibility loci linked to obesity [5,6,7]. Furthermore, other habits, such as fried food consumption [8], high intake of saturated fatty acids [9], sleep disturbances [10], and sedentary lifestyles [11,12,13], also interact with genetic variants in obesity association studies [14,15,16]. A recent study described a positive association between sugar-sweetened beverages consumption and body mass index (BMI) in individuals genetically predisposed to obesity [17].
While the primary factor in the development of obesity is the energy balance—specifically, a chronic energy surplus where energy intake consistently exceeds energy expenditure—it also should consider the role of genetic variations in this context. A systematic review of observational studies has highlighted genetic determinants that influence food preferences, which are closely associated with obesity. This genetic predisposition may pose additional challenges for certain individuals in maintaining a balanced energy intake [18].
When we consider sweet taste receptors, we typically focus on the oral cavity; however, it is worth noting that sweet taste receptors have been identified in other organs, including the gastrointestinal (GI) tract, pancreas, adipose tissue, skeletal muscle, bladder, and brain [19]. Several studies have explored the role of sweet taste receptors (TASR) in the regulation of physiological functions at the GI tract, including the regulation of GI motility and the secretion of enterohormones (such as leptin, ghrelin, insulin, GLP-1, and endocannabinoids) closely involved in energy balance, glucose levels, and food intake [20,21].
Sweet taste sensitivity is influenced by genetic variations in taste receptors, particularly in the TAS1R2 and TAS1R3 genes. The gut–brain axis is a bidirectional communication system between the GI tract and the central nervous system (CNS). It involves various signaling molecules, including hormones, neurotransmitters, and microbial metabolites. It is not well known to what extend genetic variations in sweet taste receptors may affect sweet taste sensitivity and the release of incretins and enterohormones involved in appetite regulation and glucose homeostasis. Nevertheless, recent studies have shown that individuals with heightened sweet taste sensitivity exhibit altered GLP-1 secretion, which, in turn, affects insulin sensitivity and glucose metabolism [22,23,24].
Variations in genes encoding sweet taste receptors, such as TAS1R2 and TAS1R3, influence individuals’ perceptions of sweetness and fat, potentially affecting dietary choices and contributing to increased fat storage and obesity. One study investigated single-nucleotide polymorphisms (SNPs) in TAS1R2 and TAS1R3, revealing associations between specific variants and body mass index (BMI) [25]. The study concluded that individuals carrying certain genetic variants exhibited reduced sensitivity to sweet and fatty tastes, which may lead to increased consumption of sugary and high-fat foods, thereby promoting the development of obesity. In a separate study, individuals with specific polymorphisms in these genes demonstrated varying levels of sweet taste sensitivity and carbohydrate intake, further supporting a genetic predisposition to obesity [26].
Furthermore, the metabolic pathways influenced by sweet taste sensitivity are closely linked to the regulation of fat storage. Activation of sweet taste receptors in the gut modulates the expression of genes involved in lipogenesis and adipogenesis. For example, the sterol regulatory element-binding protein 1c (SREBP-1c) pathway is regulated by dietary sugars through sweet taste receptor signaling. Genetic variations that enhance sweet taste sensitivity have been associated with increased fat storage, thereby contributing to the development of obesity [27,28]. There is considerable interindividual variation in sweet taste perception and dietary preferences. Recent studies have demonstrated that variations in T1R genes not only influence food choices and intake, but are also associated with other behavioral traits, such as the proclivity for alcohol consumption [29]. All of these data illustrate the complex genetics of sweet taste preferences and its impact on human nutrition and health.
The objective of this study is to investigate how genetic variants in sweet taste receptors and downstream signaling pathways are associated with various phenotypic outcomes, including anthropometry, biochemical markers, dietary patterns, and lifestyle choices. Understanding these associations is crucial for elucidating the complex interplay between genetics and metabolic health. A glucosensing genetic chip was designed with 25 SNPs along the genes of sweet taste receptors and related pathways, such as glucose uptake and gut–brain axis signaling (e.g., incretin secretion and enterohormone signaling). A total of 676 volunteers (mean age of 42.22 ± 12 years, ranging from 18 to 73 years) from the database of the GENYAL platform for nutritional trials at IMDEA Food Institute were included in the study. Several significant associations were found after correction for multiple comparisons, representing potential targets for personalized interventions.
2. Materials and Methods
2.1. Study Design
A sample of 676 volunteers was selected from the database of the GENYAL Platform for Clinical Trials in Nutrition and Health at the IMDEA Food Institute (Madrid, Spain). This study is part of a series of investigations conducted within the GENYAL Platform. Ethics committee approval numbers are provided in the Appendix A. All procedures were conducted in accordance with the principles outlined in the Declaration of Helsinki (1964) and Good Clinical Practice (GCP) guidelines.
Inclusion criteria included an adequate understanding of the research protocol and prior provision of informed consent for the use of biological samples in future studies.
The main objective of this study was to investigate the associations between genetic variants in sweet taste receptors and downstream signaling pathways at the gastrointestinal level and anthropometric measurements, biochemical parameters, dietary patterns, and lifestyle factors.
Anthropometric measurements were obtained using standardized and validated techniques. Body weight was measured using the BF511 body composition monitor (Omron Healthcare UK Ltd., Kyoto, Japan). Height was assessed using a stadiometer (Leicester–Biological Medical Technology SL, Barcelona, Spain), and waist circumference was measured using a non-elastic Seca 201 tape (Quirumed, Valencia, Spain).
Dietary patterns were assessed using a validated 72 h dietary food record and a food frequency questionnaire (FFQ). Energy intake, Healthy Eating Index (HEI), and macro- and micronutrient intake were calculated using DIAL software (version 2.16, Alce Ingeniería, Madrid, Spain) [30].
Lifestyle data were collected, including physical activity (categorized as inactive: 0 sessions/week; active: ≥1 session/week), smoking habits (cigarettes/day), and alcohol consumption.
Biochemical analyses included the quantification of glucose (mg/dL), total cholesterol (mg/dL), HDL (mg/dL), LDL (mg/dL), triglycerides (mg/dL), insulin (ng/dL), leptin (ng/dL), GOT (U/L), GPT (U/L), IL-6 (ng/L), IL-8 (ng/L), IL-1β (ng/L), TNF-α (ng/L), and APOA1 (mg/dL).
Quality of life was assessed using the validated SF-36 questionnaire, which evaluates multiple health-related domains.
To minimize potential bias in self-reported dietary and lifestyle data, participants received detailed instructions on how to accurately record their intake and behaviors. These instructions included guidance on portion sizes, food preparation methods, and the importance of accurate and honest reporting. Participants were encouraged to use standardized measuring tools (e.g., measuring cups, food scales) to improve precision. All questionnaires and anthropometric measurements were administered by the same trained personnel to ensure consistency in data collection.
Figure 1 illustrates the study design, including the main variables assessed: anthropometric measurements, dietary intake (macro- and micronutrients), lifestyle factors (alcohol consumption, smoking, physical activity), and biochemical biomarkers.
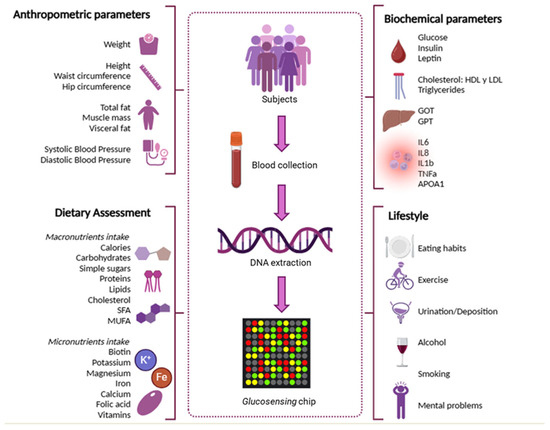
Figure 1.
Study design indicating the main variables considered -anthropometric measurements, dietary intake (macro- and micronutrients), lifestyle factors (alcohol consumption, smoking, physical activity), and biochemical biomarkers.
2.2. Descriptive Data of the Sample
A total of 676 volunteers from the GENYAL Platform for Clinical Trials in Nutrition and Health were included in the study. The participants had a mean age of 42.22 years (SD ± 12), with an age range of 18–73 years.
Anthropometric data were collected by trained nutritionists at the IMDEA Food Institute, while dietary and lifestyle data were obtained using validated questionnaires, including the SF-36, MEDAS, and a 72 h dietary intake record. Biochemical data were derived from analyses conducted as part of each participant’s respective study within the platform.
2.2.1. Anthropometric Measurements and Vital Constants
Anthropometric characteristics and vital signs of the sample, stratified into three groups based on body mass index (BMI: <25, 25–30, and >30), are summarized in Table 1A. The minimum BMI recorded was 18.2, corresponding to the lower limit of the normal weight range, while the maximum was 43.4, classified as grade III obesity. The mean BMI of the total sample was above 25, placing the population in the overweight category.

Table 1.
Descriptive data of the sample in the study. Variables are shown in stratified subgroups based on BMI values (<25, 25–30 and >30).
Visceral fat, assessed via bioelectrical impedance analysis (BIA), had a mean value of 8.57, which is below the threshold considered detrimental to health. Body circumferences, which vary according to sex and body morphology, were generally within normal limits. Regarding vital signs, mean blood pressure values were within the normal physiological range.
2.2.2. Dietary Assessment
The dietary assessment included the evaluation of total macronutrient intake, as presented in Table 1B, which reflects the daily nutrient consumption reported by participants in their dietary records, alongside the corresponding recommended daily intakes. Macronutrients are expressed as a percentage of total energy intake (expressed in calories). The mean intake of carbohydrates and sugars in the total sample was significantly higher than the recommended values, as was the intake of other macronutrients. These findings suggest that the general dietary pattern of the study population was unbalanced, with an excessive intake of certain components.
Micronutrient intake, also shown in Table 1B, was compared with the recommended dietary allowances (RDA). In general, the population met the RDA for most micronutrients evaluated, except for biotin, vitamin B3, and vitamin D, for which intake levels were below the recommended thresholds.
2.2.3. Biochemical Parameters
Biochemical parameters are summarized in Table 1C, including both the mean values obtained from laboratory analyses and the corresponding reference ranges.
Overall, the study population exhibited biochemical health markers within normal limits, with a few parameters approaching the upper threshold of the healthy range. However, these deviations were not clinically significant.
2.2.4. Lifestyle
Most participants reported consuming home-prepared meals during the week, with an average of 1–2 meals eaten outside the home on weekends. Water intake was significantly below recommended levels, with participants consuming less than 2 L per day on average. The mean glycemic index (GI), calculated based on carbohydrate and sugar intake, was above 70 for the total sample, indicating a high-GI dietary pattern.
Regarding physical activity, 36.92% of participants reported moderate activity, 29.46% reported low activity, and 33.62% reported high activity levels. Table 1D summarizes the frequency of physical activity, along with data on alcohol consumption, bowel habits, and urinary frequency.
Overall, most participants engaged in physical activity two or more times per week and reported adequate gastrointestinal function. Alcohol consumption was reported daily by 67% of participants, while the majority were non-smokers, as shown in Table 1E.
In terms of mental health, 25% of participants reported experiencing stress, 15% reported anxiety, and less than 1% reported symptoms of depression.
2.3. Systematic Search for Gene Selection of the Glucosensing Chip
To select the SNPs to be included in the glucosensing genetic chip, a systematic search was conducted, including the open-access PubMed database (www.ncbi.nlm.nih.gov/PubMed, accessed on October–December 2021), the GeneCards database (www.genecards.org, accessed on October–December 2021), and the single-nucleotide polymorphism (SNP) database (dbSNP-Short Genetic Variation) from the National Center for Biotechnology Information: NCBI (www.ncbi.nlm.nih.gov/snp, accessed on October–December). The latter database was used to confirm the location in the sequence and the influence of each polymorphism on amino acid changes.
A total of 25 SNPs were selected based on their involvement in metabolic pathways related to sweet taste receptors and downstream signaling pathways at the gut–brain axis. For refining the search for SNPs involved in the pathways of interest, the following criteria were considered, with the last two being exclusionary: (1) SNP location—priority was given to intragenic SNPs, specifically those located in coding regions. SNPs in the gene-promoter region (up to 10 kb before the transcription initiation site) and the final region (up to 2 kb after the transcription termination site) were also included, as well as some exonic SNPs of interest. (2) Not being in Linkage Disequilibrium (LD): The HapMap Project (http://hapmap.ncbi.nlm.nih.gov/, accessed on October–December 2021) was used to address the linkage disequilibrium (LD) maps, with the objective of identifying regions inherited together due to the low recombination frequency. The HapMap data for the Caucasian population were used, selecting only SNPs which were not in LD. The Haploview software (http://www.broad.mit.edu/mpg/haploview, accessed on October–December 2021) was used to analyze HapMap data. (3) Allelic frequency: The allele frequency in the Caucasian European population had to be greater than 0.1, meaning at least 10 out of 100 individuals would have the SNP.
2.4. Genotyping of the Sample
For genotyping, DNA samples were loaded onto TaqMan OpenArray real-time PCR plates (Life Technologies Inc., Carlsbad, CA, USA), pre-configured with specific probes for each SNP allele labeled with different fluorophores to determine the genotype. This process was conducted using the OpenArray AccuFill system (Life Technologies Inc., Carlsbad, CA, USA). Once loaded, PCR was performed, and the chips were read on the QuantStudio 12K Flex real-time PCR instrument (Life Technologies Inc., Carlsbad, CA, USA). Results were analyzed using TaqMan Genotyper software v.1.0.1 (Life Technologies Inc., Carlsbad, CA, USA), which automatically assigned genotypes to each sample based on the fluorophore signal detected.
2.5. Statistical Analysis
Statistical analysis was performed using R 4.1.2. Descriptive analyses of numerical variables included means and standard deviations, while medians and interquartile ranges were used for non-normally distributed variables. Categorical variables were analyzed using absolute and relative frequencies of their respective categories, and the number of available data points was determined for each variable.
For SNP analysis, Hardy–Weinberg equilibrium was tested, and LD between all SNPs was calculated. None of the SNPs significantly deviated from equilibrium, as expected from a genetically well-mixed sample. The association of each of these SNPs with different anthropometric, biochemical, and lifestyle variables was modeled using linear models adjusted by age and sex; this was required since the sample was not balanced with respect to these variables. Three different models were derived for each SNP: additive, dominant, and codominant. The p-value for the SNP variable was derived in each case, and multiple-test corrected by applying Bonferroni method. In all the statistical tests, a two-tailed significance level of 0.05 was used for inference, and confidence intervals were derived for 95% confidence.
Since this was an exploratory analysis, we did not attempt to make power and sample size calculations and instead tried to collect the largest sample possible.
3. Results
Single-nucleotide polymorphisms in genes encoding sweet taste receptors and associated downstream signaling may also be candidates of low-penetrance variants with a role in susceptibility to obesity development, which is also linked to lifestyle characteristics.
3.1. Design of the Glucosensing Chip
First, an exhaustive bibliographic search was conducted to select genes of the sweet taste signaling at the gastrointestinal tract. A total of twenty genes were selected, including six genes from the taste receptors family (TAS1R1, TAS1R2, GNAT3, SLC2A2, SLC2A4, and SLC5A1); four genes linked to the gut–brain axis and the endocannabinoid system (PCSK1, DPP4, CNR1, and FAAH); six genes associated with hormones regulating energy homeostasis (GHRL, GR INSL5, GIP, and GIPR); three genes acting as metabolic regulators (FGF21, FTO, and MC4R); SREBF1, associated with lipid metabolism; and FUT1, whose mutations have been directly related to the consumption of sweet foods (Figure 2).
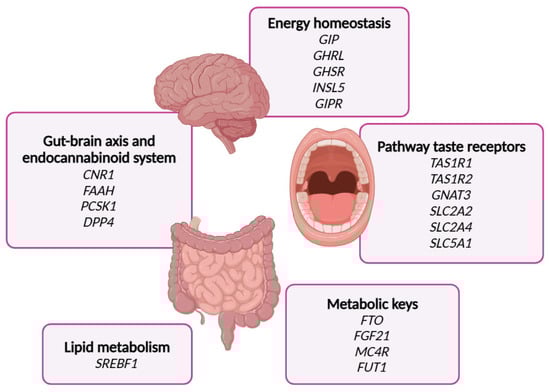
Figure 2.
This Figure indicates the genes selected in the glucosensing chip including the metabolic processes where they are implicated.
Based on the criteria described in the Materials and Methods section, a total of 25 single-nucleotide polymorphisms (SNPs) were selected for genotyping. To the best of our knowledge, this is the first study to design a custom genetic chip specifically aimed at exploring sweet taste perception and its associated downstream signaling pathways within the gut–brain axis.
Table 2 lists the selected SNPs, while Table 3 provides detailed information on their chromosomal allocation, genotype frequencies (%), minor allele frequencies (MAF), and Hardy–Weinberg equilibrium (HWE) status within the study population.
Table 2.
Genes and single-nucleotide polymorphisms (SNPs) included in the glucosensing chip.
Table 3.
Genetic distribution and Hardy–Weinberg equilibrium test in the sample. p values are shown.
3.2. Genetic and Phenotypic Associations in the Sample
As indicated in the Study Design subsection, a total of 676 volunteers from the GENYAL Platform for Clinical Trials in Nutrition and Health were included in this study. The participants had a mean age of 42.22 years (SD ± 12), with an age range of 18–73 years.
Anthropometry: The anthropometric characteristics and vital signs included in the analysis were weight (kg), height (cm), BMI, total fat percentage, muscle mass percentage, visceral fat (measured by BIA), waist and hip circumferences (cm), systolic blood pressure (SBP, mmHg), and diastolic blood pressure (DBP, mmHg).
Diet: Dietary assessment involved estimating macronutrient and micronutrient intake based on the daily food records provided by participants. Although sugar consumption was a primary focus, additional parameters such as appetite sensations and eating habits were also considered to estimate the glycemic index (GI), which reflects the rise in blood glucose levels following the intake of specific carbohydrates.
Lifestyle: Lifestyle variables included the frequency of home-prepared meals, water intake, physical activity levels (low, moderate, and high), alcohol consumption, bowel and urinary habits, and mental health indicators such as anxiety, stress, and depression.
The analysis of the 25 SNPs included in the glucosensing chip, in relation to anthropometric, biochemical, and lifestyle parameters, revealed several statistically significant associations, which are summarized in Table 4.
Table 4.
Association between the SNPs in the glucosensing chip and anthropometry, biochemistry and lifestyle characteristics.
A detailed description of the main association found is shown below.
The SNP rs1049353 in the CNR1 gene was significantly associated with the glycemic index (GI). Thus, the minor allele (A) was associated with a lower GI under the additive model (Beta = −4.23, 95% CI: −6.8 to −1.67, padj = 0.033).
The SNP rs12617656 in DPP4 showed several associations with total food intake and specific micronutrients obtained from the diet. Thus, the minor allele C was associated with a significant reduction in total food consumption, using the additive model (Beta = −132, 95% CI: −205 to −60, padj = 0.009); lower intake of several micronutrients -pantothenic acid (Beta = −0.388, 95% CI: −0.581 to −0.194, padj = 0.002); magnesium (Beta = −19.9, 95% CI: −30.7 to −9.04, padj = 0.009); potassium (Beta = −183, 95% CI: −283 to −83.6, padj = 0.009); and folic acid (Beta = −21.8, 95% CI: −34 to −9.72, padj = 0.011); reduced carbohydrate intake (Beta = −12.3, 95% CI: −19.1 to −5.42, padj = 0.012); and simple sugar intake (Beta = −6.76, 95% CI: −10.6 to −2.96, padj = 0.013).
The SNP rs2297508 in SREBF1 positively associated with higher dietary intake of riboflavin (Beta = 0.129, 95% CI: 0.0597 to 0.198, padj = 0.007) and iron (Beta = 0.79, 95% CI: 0.313 to 1.27, padj = 0.031) under the additive model.
The SNP rs1800437 in GIPR showed an association with legume intake under the codominant model. The homozygous genotype (AA) was associated with an increase in legumes intake (Beta = 60.4, 95% CI: 29.3 to 91.5, padj = 0.012). Interestingly, allele A was positively associated with physical exercise (Beta = 0.383, 95% CI: 0.144 to 0.622, padj = 0.044).
The SNP rs324420 in FAAH was associated with TNFα levels, being the homozygous genotype (AA) for the minor allele associated with increased levels (Beta = 3.47, 95% CI: 1.59 to 5.35, padj = 0.039).
The SNP rs34160967 in TAS1R1 was associated with an increased risk of being overweight and with the use of antidepressants. Individuals with at least one copy of the minor allele (A) showed a positive association with a higher risk of being overweight compared to the homozygous genotype for the reference allele (Beta = 0.522, 95% CI: 0.345 to 0.79, padj = 0.055). In addition, each minor allele was associated with higher use of antidepressants (Beta = 0.102, 95% CI: 0.00569 to 0.478, padj = 0.027).
The SNP rs3809770 in GIP was positively associated with increased alcohol consumption (Beta = 2, 95% CI: 0.763 to 3.24, padj = 0.041).
The SNP rs838133 in FGF21 showed an association with hip circumference under the codominant model, where the heterozygous genotype was associated with decreased hip circumference (Beta = −2.48, 95% CI: −4.62 to −0.344).
Finally, the SNP rs9609429 in SLC5A1 was associated with increased bowel motility under the additive model (Beta = 0.121, 95% CI: 0.0459 to 0.196, padj = 0.042).
4. Discussion
Herein, we present a first-in-class genetic chip specifically designed to explore the associations between single-nucleotide polymorphisms (SNPs) in sweet taste receptors and their downstream signaling pathways, including components of the gut–brain axis, in relation to anthropometric and lifestyle variables.
Sweet taste receptors are expressed not only in the oral cavity, but also in several extraoral tissues, including the gastrointestinal (GI) tract, pancreas, adipose tissue, skeletal muscle, urinary bladder, and brain, where they play important roles in nutrient sensing, metabolic regulation, and energy homeostasis [19]. These receptors regulate physiological functions at the GI level, including GI motility and the secretion of enterohormones (leptin, ghrelin, insulin, GLP-1, and endocannabinoids), being involved in energy balance, systemic glucose levels, and food intake [20,21,59]. One study compared insulin levels after oral vs. intravenous glucose administration, observing that insulin levels were higher when glucose was administered orally compared to intravenously, revealing an effect of the glucose sensing at the GI level on systemic insulin secretion. Conversely, the inhibition of TAS1R2-TAS1R3 with lactisole reduced the secretion levels of GLP-1 and GIP incretins [60]. Obese individuals have been shown to present reduced expression levels of the sweet taste receptor TAS1R3 [61], suggesting a decreased glucose sensing in these individuals. Similarly, individuals with T2DM experience reduced expression levels of the sweet taste receptors TAS1R2 and TAS1R3, as well as their regulator, α-gustducin [62]. Overall, the manipulation of sweet taste receptor responses at the GI tract is a promising field for developing therapeutic approaches against obesity and T2DM.
The sweet taste signaling pathway in the gastrointestinal (GI) tract exerts not only local effects, but also systemic effects through the gut–brain axis, playing a key role in the regulation of satiety and dietary preferences [63]. The endocannabinoid system, which includes the CNR1 and CNR2 receptors, is involved in the regulation of energy homeostasis, appetite, and body weight [64,65].
The SNP rs1049353 in the CNR1 gene has been associated with obesity [32], type 2 diabetes mellitus (T2DM) [66], and metabolic syndrome [67]. Meta-analyses have shown that individuals with GA/AA genotypes tend to have a lower BMI compared to those with the GG genotype [68]. This polymorphism is relatively common, with a 48.1% frequency of the minor allele (A) in the Spanish population [69]. Our findings regarding glycemic index (GI) values are consistent with the previous literature [70,71,72], reinforcing the association between the rs1049353 SNP and improvements in glucose metabolism, as well as reductions in fat mass, body weight, and BMI [73].
Dipeptidyl peptidase-4 (DPP4) is a multifunctional protein with peptidase activity on substrates like GLP-1 and GIP, being involved in hyperglycemia, insulin resistance, dyslipidemia, oxidative stress, and inflammation [74,75,76,77,78]. Polymorphisms in the DPP4 gene have been linked to T2DM and myocardial infarction [33,79]. Minor alleles of SNPs rs12617336 and rs17574 are protective against hypoalphalipoproteinemia, insulin resistance, and hyperinsulinemia [80]. In our results, we observed associations with reduced total food intake, as well as lower consumption of simple sugars, carbohydrates, and several micronutrients obtained from the diet, including folic acid, potassium, magnesium, and pantothenic acid. While the reduction in total food intake, particularly of carbohydrates and simple sugars, may be beneficial in the context of obesity prevention, it is important to monitor and address potential micronutrient deficiencies. In particular, chronic potassium deficiency may lead to muscle weakness, cardiac arrhythmias, and, if left untreated, gastrointestinal dysfunction. Therefore, dietary interventions aimed at reducing energy intake should be carefully balanced to ensure adequate micronutrient intake [81]. Magnesium, a cofactor in over 300 enzymatic systems, is critical for energy production by oxidative phosphorylation, glycolysis, and active ion transport [82,83]. Low magnesium levels are associated with chronic conditions such as Alzheimer’s disease, asthma, ADHD, IR, hypertension, migraines, and osteoporosis [84]. Additionally, vitamin B5, or pantothenic acid, is essential for the synthesis of coenzyme A (CoA), which plays a vital role in many catabolic and anabolic reactions [85]. Lower levels of pantothenic acid were detected in some brain regions affected by Alzheimer’s disease compared to controls [86,87]. Thus, personalized nutritional recommendations for carriers of this SNP could include specific foods to ensure adequate micronutrient intake, without raising the glycemic index.
The glucose-dependent insulinotropic polypeptide (GIP) is a gut–brain peptide released from intestinal K cells in response to food intake [88,89]. It stimulates insulin secretion meanwhile inhibits glucagon secretion [89,90,91]. Meanwhile, GWAS showed rs3809770 of GIP positively associated with waist circumference, our results link GIP rs3809770 to alcohol consumption, as also described by Tsermpini et al. [92], who associated the SNP rs1800437 of this receptor with alcohol consumption, suggesting that the ligand could also play a role in this variable.
The sterol regulatory element-binding protein 1 (SREBP1) is a key nuclear transcription factor involved in lipid synthesis. SREBF1 SNPs rs2236513/rs2297508/rs4925119 strongly modulated the relationship between cholesterol intake and serum ratio LDL–cholesterol/total cholesterol (p < 0.001) [93]. A few years ago, Felder et al. [36] discovered an association between the SREBF1 SNP rs2297508 and the prevalence of T2DM and adiponectin levels. In our results, the presence of this SNP is associated with a higher dietary intake of iron and riboflavin, which have been shown to protect against diabetic complications by lowering systemic inflammation [94]. It has to be taken into consideration that, in our sample, mainly consisting of obese and overweight individuals, the presence of this SNP may contribute to reduce inflammation in an obesogenic context.
Fatty acid amide hydrolase (FAAH) is one of the most studied enzymes in the metabolism of the endocannabinoid system. It also metabolizes substrates with a role in metabolism and satiety, such as oleoylethanolamide (OEA) and palmitoylethanolamide (PEA). OEA has been shown to reduce food intake and suppression of appetite, effects opposite to those of endocannabinoids. Interestingly, carriers of the FAAH rs324420 A allele have been significantly associated with a higher risk of alcohol use disorder (AUD) [95] and substance use disorders, including cannabis dependence. In our results, the FAAH rs324420 SNP was positively associated with TNFα levels (p = 0.039), in line with other studies where this SNP has been associated with increased BMI and obesity [96,97], as well as markers of systemic inflammation, such as TNFα levels.
Shigemura et al. [98] showed that rs34160967 SNP in TAS1R1 and rs307377 in TAS1R3 affected the umami taste sensitivity. Carriers of the TAS1R1 GG genotype at rs34160967 consumed more fat and total energy compared to the A allele carriers, which has been linked to reduced food palatability [99]. Thus, the rs34160967 polymorphism may have a direct impact on the perception of dietary fats related to the TAS1R1 umami taste receptor subunit [39]. Our data may confirm this trend toward increased total dietary energy, as the presence of this SNP showed an association with the risk of overweight. In addition, in our sample, this SNP was associated with antidepressant consumption, which may be indirectly associated with the tendency of increased risk of overweight.
Fibroblast growth factor 21 (FGF21) is a peptide hormone primarily synthesized and released from the liver. Two genetic studies showed that the common allele in rs838133 SNP was associated with higher intake of carbohydrates and lower intake of proteins and fats, with no effects on total calorie intake [100]; meanwhile, Søberg et al. [43] showed that the preference for carbohydrates intake was specific to sugary products and increase alcohol consumption. Our results could align with this finding, being that rs838133 was associated with an increase in hip circumference, which may be related to sugar-rich diets and fat accumulation in the hip.
A summary of the main results of the study are shown in Figure 3.
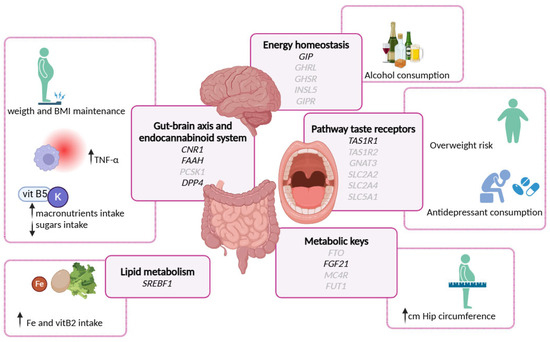
Figure 3.
Graphical summary main results of the genotypic associations with various biochemical, anthropometrical, nutrient, and lifestyle variables of the study population.
5. Conclusions and Future Directions
Although this is an exploratory analysis, understanding the genetic context of SNPs related to sweet taste sensitivity and the subsequent signaling in the gut–brain axis is crucial for tailoring personalized nutrition to meet individual needs. Our findings underscore the importance of considering genetic variability in sweet taste perception and its related pathways, as these factors can significantly influence metabolic regulation, appetite control, and overall health outcomes. Personalized nutritional recommendations, informed by genetic insights, can help optimize dietary interventions, prevent nutrient deficiencies, and more effectively manage conditions such as obesity and type 2 diabetes. This approach highlights the broader significance of gene–diet–lifestyle interactions in developing targeted and effective health strategies.
The cross-sectional nature of this study limits our ability to establish causality between genetic variants and metabolic outcomes. While significant associations have been identified, they do not determine the direction or causality of these relationships. Therefore, future studies should incorporate longitudinal designs to observe changes over time and establish causal links, providing a more dynamic understanding of the factors influencing overweight and obesity.
This study focuses on individual SNPs; however, exploring gene–gene interactions and polygenic risk factors is essential for understanding complex traits such as obesity. These interactions will offer a more comprehensive view of the genetic architecture underlying these traits.
Additionally, although our sample size of 676 volunteers is substantial, it may still limit the generalizability of our findings to the broader population. The study sample, drawn from volunteers participating in the GENYAL platform at the IMDEA Food Institute, may lack diversity in terms of geographic, ethnic, and socioeconomic backgrounds. Furthermore, the mean BMI of participants exceeds 25, indicating a predominance of overweight and/or obesity. Future studies will incorporate more detailed stratification by BMI categories (e.g., normal weight, overweight, obese) and age groups (e.g., young adults, seniors) to enhance the precision of subgroup analyses and ensure a more representative sample.
By acknowledging these limitations and outlining them as objectives for future research, we aim to strengthen the validity of our findings and contribute valuable insights into the genetic and metabolic factors influencing overweight and obesity.
Author Contributions
Conceptualization, A.R.d.M. and M.G.d.C.; Methodology, S.W.-R., L.P.F., G.C., S.C.-G., S.M. and M.C.C.; Validation, M.G.d.C.; Formal analysis, M.G.d.C.; Investigation, S.W.-R., L.P.F., S.C.-G., M.L.-L. and M.G.d.C.; Resources, I.E., E.A.-A., H.M.-P., R.d.l.I., V.L.-K. and M.G.d.C.; Data curation, S.W.-R. and G.C.; Writing—original draft, S.W.-R. and M.G.d.C.; Writing—review and editing, M.G.d.C.; Supervision, M.G.d.C., R.R.R. and A.R.d.M.; Funding acquisition, M.G.d.C. and A.R.d.M. All authors have read and agreed to the published version of the manuscript.
Funding
Regional Government of Community of Madrid: (P2018/BAA-4343-ALIBIRD2020-CM and NutriSION-CM Y2020/BIO-6350); Ministerio de Ciencia e Innovacion, Spain: Grant PID2019-110183RB-C21 funded by MICIU/AEI/10.13039/501100011033 and grant PID2022-138295OB-I00 funded by MICIU/AEI/10.13039/501100011033, and by “ERDF/EU”, REACT EU Program FACINGLCOVID-CM: (PD2022-004-REACT-EU); Industrial predoctoral program of Community of Madrid: (IND2018/BIO-10097).
Institutional Review Board Statement
The study was conducted in accordance with the Declaration of Helsinki, and approved by the Institutional Review Board (or Ethics Committee) of IMDEA FOOD Institute GENYAL Database (protocol codes IMD PI-935; PI-009; PI-020-; PI-028; PI-031; PI-666; PI-014; PI-023; PI-029; PI-035; PI-006; PI-017; PI-026; PI-030; and PI-036).
Informed Consent Statement
Informed consent was obtained from all subjects involved in the study.
Data Availability Statement
The datasets presented in this article are not readily available because they are part of the GENYAL Platform database for clinical trials in nutrition and health (https://www.food.imdea.org/services/Platform-Clinical-Trials-Nutrition-and-Health, accessed on October–December 2021) database. This database is currently registered as a collection under Spanish rules, which, as a policy of the Centre, will be made public afterwards once the data of the entire expected population are gathered. Requests to access the datasets should be directed to marta.gomezdecedron@alimentacion.imdea.org.
Conflicts of Interest
The authors declare no conflicts of interest.
Appendix A
List of the studies from where volunteers were included, indicating the acronym of the study, CEI reference and number of individuals from each study: REDUCOL CEI: HULP-PI935 (n: 44); CAPSA CEI: IMD PI-009 (n: 61); AMC CEI: IMD PI-020 (n: 20); TUTIPASTA CEI: IMD PI-028 (n: 60); SPORT CEI: IMD PI-031 (n: 15); PLATAFORMA CEI: UAM 27-666 (n: 20); INSAOLI CEI: IMD PI:014 (n: 77); NATAC CEI: IMD PI-023 (n: 84): AMC-3 CEI: IMD PI-029 (n: 12); NUTRIPRECISION GULLON CEI: IMD PI-035 (n: 22); SARA CEI: IMD PI-006 (n: 44); FORCANCER CEI: IMD PI-017 (n: 32); GULLON CEI: IMD PI-026 (n: 25); PRIMICIA GENERAL CEI: IMD PI-030 (n: 140); NUTRIPRECISION AMC CEI: IMD PI-036 (n: 20).
References
- Ordovas, J.M.; Mooser, V. Nutrigenomics and nutrigenetics. Curr. Opin. Lipidol. 2004, 15, 101–108. [Google Scholar] [CrossRef] [PubMed]
- Fenech, M.; El-Sohemy, A.; Cahill, L.; Ferguson, L.R.; French, T.-A.C.; Tai, E.S.; Milner, J.; Koh, W.-P.; Xie, L.; Zucker, M.; et al. Nutrigenetics and Nutrigenomics: Viewpoints on the Current Status and Applications in Nutrition Research and Practice. J. Nutr. Nutr. 2011, 4, 69–89. [Google Scholar] [CrossRef] [PubMed]
- Ferguson, L.R.; De Caterina, R.; Görman, U.; Allayee, H.; Kohlmeier, M.; Prasad, C.; Choi, M.S.; Curi, R.; de Luis, D.A.; Gil, Á.; et al. Guide and Position of the International Society of Nutrigenetics/Nutrigenomics on Personalised Nutrition: Part 1—Fields of Precision Nutrition. Lifestyle Genom. 2016, 9, 12–27. [Google Scholar] [CrossRef]
- Simopoulos, A.P. Nutrigenetics/Nutrigenomics. Annu. Rev. Public Health 2010, 31, 53–68. [Google Scholar] [CrossRef]
- McCarthy, M.I. Genomics, Type 2 Diabetes, and Obesity. N. Engl. J. Med. 2010, 363, 2339–2350. [Google Scholar] [CrossRef]
- Fall, T.; Ingelsson, E. Genome-wide association studies of obesity and metabolic syndrome. Mol. Cell. Endocrinol. 2014, 382, 740–757. [Google Scholar] [CrossRef]
- The LifeLines Cohort Study; The ADIPOGen Consortium; The AGEN-BMI Working Group; The CARDIOGRAMplusC4D Consortium; The CKDGen Consortium; The GLGC; The ICBP; The MAGIC Investigators; The MuTHER Consortium; The MIGen Consortium; et al. Genetic studies of body mass index yield new insights for obesity biology. Nature 2015, 518, 197–206. [Google Scholar] [CrossRef] [PubMed]
- Qi, Q.; Chu, A.Y.; Kang, J.H.; Huang, J.; Rose, L.M.; Jensen, M.K.; Liang, L.; Curhan, G.C.; Pasquale, L.R.; Wiggs, J.L.; et al. Fried food consumption, genetic risk, and body mass index: Gene-diet interaction analysis in three US cohort studies. BMJ 2014, 348, g1610. [Google Scholar] [CrossRef]
- Casas-Agustench, P.; Arnett, D.K.; Smith, C.E.; Lai, C.-Q.; Parnell, L.D.; Borecki, I.B.; Frazier-Wood, A.C.; Allison, M.; Chen, Y.-D.I.; Taylor, K.D.; et al. Saturated Fat Intake Modulates the Association between an Obesity Genetic Risk Score and Body Mass Index in Two US Populations. J. Acad. Nutr. Diet. 2014, 114, 1954–1966. [Google Scholar] [CrossRef]
- Celis-Morales, C.; Lyall, D.M.; Guo, Y.; Steell, L.; Llanas, D.; Ward, J.; Mackay, D.F.; Biello, S.M.; Bailey, M.E.; Pell, J.P.; et al. Sleep characteristics modify the association of genetic predisposition with obesity and anthropometric measurements in 119,679 UK Biobank participants. Am. J. Clin. Nutr. 2017, 105, 980–990. [Google Scholar] [CrossRef]
- Tyrrell, J.; Wood, A.R.; Ames, R.M.; Yaghootkar, H.; Beaumont, R.N.; Jones, S.E.; Tuke, M.A.; Ruth, K.S.; Freathy, R.M.; Davey Smith, G.; et al. Gene–obesogenic environment interactions in the UK Biobank study. Int. J. Epidemiol. 2017, 46, 559–575. [Google Scholar] [CrossRef]
- Qi, Q.; Li, Y.; Chomistek, A.K.; Kang, J.H.; Curhan, G.C.; Pasquale, L.R.; Willett, W.C.; Rimm, E.B.; Hu, F.B.; Qi, L. Television Watching, Leisure Time Physical Activity, and the Genetic Predisposition in Relation to Body Mass Index in Women and Men. Circulation 2012, 126, 1821–1827. [Google Scholar] [CrossRef] [PubMed]
- Ahmad, S.; Rukh, G.; Varga, T.V.; Ali, A.; Kurbasic, A.; Shungin, D.; Ericson, U.; Koivula, R.W.; Chu, A.Y.; Rose, L.M.; et al. Gene × Physical Activity Interactions in Obesity: Combined Analysis of 111,421 Individuals of European Ancestry. PLoS Genet. 2013, 9, e1003607. [Google Scholar] [CrossRef]
- Malik, V.S.; Popkin, B.M.; Bray, G.A.; Després, J.-P.; Hu, F.B. Sugar-Sweetened Beverages, Obesity, Type 2 Diabetes Mellitus, and Cardiovascular Disease Risk. Circulation 2010, 121, 1356–1364. [Google Scholar] [CrossRef]
- Te Morenga, L.; Mallard, S.; Mann, J. Dietary sugars and body weight: Systematic review and meta-analyses of randomised controlled trials and cohort studies. BMJ 2012, 346, e7492. [Google Scholar] [CrossRef]
- Malik, V.S.; Pan, A.; Willett, W.C.; Hu, F.B. Sugar-sweetened beverages and weight gain in children and adults: A systematic review and meta-analysis. Am. J. Clin. Nutr. 2013, 98, 1084–1102. [Google Scholar] [CrossRef] [PubMed]
- Qi, Q.; Chu, A.Y.; Kang, J.H.; Jensen, M.K.; Curhan, G.C.; Pasquale, L.R.; Ridker, P.M.; Hunter, D.J.; Willett, W.C.; Rimm, E.B.; et al. Sugar-sweetened beverages and genetic risk of obesity. N. Engl. J. Med. 2012, 367, 1387–1396. [Google Scholar] [CrossRef] [PubMed]
- Brunkwall, L.; Chen, Y.; Hindy, G.; Rukh, G.; Ericson, U.; Barroso, I.; Johansson, I.; Franks, P.W.; Orho-Melander, M.; Renström, F. Sugar-sweetened beverage consumption and genetic predisposition to obesity in 2 Swedish cohorts. Am. J. Clin. Nutr. 2016, 104, 809–815. [Google Scholar] [CrossRef]
- Laffitte, A.; Neiers, F.; Briand, L. Functional roles of the sweet taste receptor in oral and extraoral tissues. Curr. Opin. Clin. Nutr. Metab. Care 2014, 17, 379–385. [Google Scholar] [CrossRef]
- Folgueira, C.; Seoane, L.M.; Casanueva, F.F. The Brain-Stomach Connection. In Frontiers of Hormone Research; Delhanty, P.J.D., van der Lely, A.J., Eds.; S. Karger AG: Basel, Switzerland, 2014; Volume 42, pp. 83–92. ISBN 978-3-318-02638-2. [Google Scholar]
- Štimac, D.; Klobučar Majanović, S.; Franjić, N. Stomach—Key Player in the Regulation of Metabolism. Dig. Dis. 2014, 32, 192–201. [Google Scholar] [CrossRef]
- Takai, S.; Yasumatsu, K.; Inoue, M.; Iwata, S.; Yoshida, R.; Shigemura, N.; Yanagawa, Y.; Drucker, D.J.; Margolskee, R.F.; Ninomiya, Y. Glucagon-like peptide-1 is specifically involved in sweet taste transmission. FASEB J. Off. Publ. Fed. Am. Soc. Exp. Biol. 2015, 29, 2268–2280. [Google Scholar] [CrossRef] [PubMed]
- Hira, T.; Pinyo, J.; Hara, H. What Is GLP-1 Really Doing in Obesity? Trends Endocrinol. Metab. TEM 2020, 31, 71–80. [Google Scholar] [CrossRef] [PubMed]
- Wang, L.; Su, Z.; Li, Y.-C.; Cao, B.-Y.; Su, C.; Gong, C.-X. Relationship of Glucagon-like Peptide 1 and Peptide YY with Catch-up Growth in Children Born Small for Gestational Age. J. Clin. Res. Pediatr. Endocrinol. 2024, 16, 69–75. [Google Scholar] [CrossRef]
- Ponnusamy, V.; Subramanian, G.; Vasanthakumar, K.; Muthuswamy, K.; Panneerselvan, P.; Krishnan, V.; Subramaniam, S. T1R2/T1R3 polymorphism affects sweet and fat perception: Correlation between SNP and BMI in the context of obesity development | Request PDF. Hum. Genet. 2025, 144, 15–30. [Google Scholar] [CrossRef] [PubMed]
- Han, P.; Keast, R.S.J.; Roura, E. Salivary leptin and TAS1R2/TAS1R3 polymorphisms are related to sweet taste sensitivity and carbohydrate intake from a buffet meal in healthy young adults. Br. J. Nutr. 2017, 118, 763–770. [Google Scholar] [CrossRef]
- Pang, M.D.; Goossens, G.H.; Blaak, E.E. The Impact of Artificial Sweeteners on Body Weight Control and Glucose Homeostasis. Front. Nutr. 2021, 7. [Google Scholar] [CrossRef]
- Toews, I.; Lohner, S.; Küllenberg de Gaudry, D.; Sommer, H.; Meerpohl, J.J. Association between intake of non-sugar sweeteners and health outcomes: Systematic review and meta-analyses of randomised and non-randomised controlled trials and observational studies. BMJ 2019, 364, k4718. [Google Scholar] [CrossRef]
- Kurshed, A.A.M.; Ádány, R.; Diószegi, J. The Impact of Taste Preference-Related Gene Polymorphisms on Alcohol Consumption Behavior: A Systematic Review. Int. J. Mol. Sci. 2022, 23, 15989. [Google Scholar] [CrossRef]
- Espinosa-Salinas, I.; de la Iglesia, R.; Colmenarejo, G.; Molina, S.; Reglero, G.; Martinez, J.A.; Loria-Kohen, V.; Ramirez de Molina, A. GCKR rs780094 Polymorphism as A Genetic Variant Involved in Physical Exercise. Genes 2019, 10, 570. [Google Scholar] [CrossRef]
- Peeters, A.; Beckers, S.; Mertens, I.; Van Hul, W.; Van Gaal, L. The G1422A variant of the cannabinoid receptor gene (CNR1) is associated with abdominal adiposity in obese men. Endocrine 2007, 31, 138–141. [Google Scholar] [CrossRef]
- Gazzerro, P.; Caruso, M.G.; Notarnicola, M.; Misciagna, G.; Guerra, V.; Laezza, C.; Bifulco, M. Association between cannabinoid type-1 receptor polymorphism and body mass index in a southern Italian population. Int. J. Obes. 2007, 31, 908–912. [Google Scholar] [CrossRef]
- Ahmed, R.H.; Huri, H.Z.; Al-Hamodi, Z.; Salem, S.D.; Al-absi, B.; Muniandy, S. Association of DPP4 Gene Polymorphisms with Type 2 Diabetes Mellitus in Malaysian Subjects. PLoS ONE 2016, 11, e0154369. [Google Scholar] [CrossRef] [PubMed]
- Sauber, J.; Grothe, J.; Behm, M.; Scherag, A.; Grallert, H.; Illig, T.; Hinney, A.; Hebebrand, J.; Wiegand, S.; Grüters, A.; et al. Association of variants in gastric inhibitory polypeptide receptor gene with impaired glucose homeostasis in obese children and adolescents from Berlin. Eur. J. Endocrinol. 2010, 163, 259–264. [Google Scholar] [CrossRef] [PubMed]
- Vogel, C.I.; Scherag, A.; Brönner, G.; Nguyen, T.T.; Wang, H.-J.; Grallert, H.; Bornhorst, A.; Rosskopf, D.; Völzke, H.; Reinehr, T.; et al. Gastric inhibitory polypeptide receptor: Association analyses for obesity of several polymorphisms in large study groups. BMC Med. Genet. 2009, 10, 19. [Google Scholar] [CrossRef] [PubMed]
- Felder, T.K.; Oberkofler, H.; Weitgasser, R.; Mackevics, V.; Krempler, F.; Paulweber, B.; Patsch, W. The SREBF-1 locus is associated with type 2 diabetes and plasma adiponectin levels in a middle-aged Austrian population. Int. J. Obes. 2007, 31, 1099–1103. [Google Scholar] [CrossRef]
- Durand, E.; Lecoeur, C.; Delplanque, J.; Benzinou, M.; Degraeve, F.; Boutin, P.; Marre, M.; Balkau, B.; Charpentier, G.; Froguel, P.; et al. Evaluating the Association of FAAH Common Gene Variation with Childhood, Adult Severe Obesity and Type 2 Diabetes in the French Population. Obes. Facts 2008, 1, 305–309. [Google Scholar] [CrossRef]
- Zhang, Y.; Sonnenberg, G.E.; Baye, T.M.; Littrell, J.; Gunnell, J.; DeLaForest, A.; MacKinney, E.; Hillard, C.J.; Kissebah, A.H.; Olivier, M.; et al. Obesity-related dyslipidemia associated with FAAH, independent of insulin response, in multigenerational families of Northern European descent. Pharmacogenomics 2009, 10, 1929–1939. [Google Scholar] [CrossRef]
- Han, P.; Keast, R.; Roura, E. TAS1R1 and TAS1R3 Polymorphisms Relate to Energy and Protein-Rich Food Choices from a Buffet Meal Respectively. Nutrients 2018, 10, 1906. [Google Scholar] [CrossRef]
- Esberg, A.; Haworth, S.; Hasslöf, P.; Lif Holgerson, P.; Johansson, I. Oral Microbiota Profile Associates with Sugar Intake and Taste Preference Genes. Nutrients 2020, 12, 681. [Google Scholar] [CrossRef]
- Segrè, A.V.; Wei, N.; DIAGRAM Consortium; MAGIC Investigators; Altshuler, D.; Florez, J.C. Pathways Targeted by Antidiabetes Drugs Are Enriched for Multiple Genes Associated With Type 2 Diabetes Risk. Diabetes 2015, 64, 1470–1483. [Google Scholar] [CrossRef]
- Frayling, T.M.; Beaumont, R.N.; Jones, S.E.; Yaghootkar, H.; Tuke, M.A.; Ruth, K.S.; Casanova, F.; West, B.; Locke, J.; Sharp, S.; et al. A Common Allele in FGF21 Associated with Sugar Intake Is Associated with Body Shape, Lower Total Body-Fat Percentage, and Higher Blood Pressure. Cell Rep. 2018, 23, 327–336. [Google Scholar] [CrossRef] [PubMed]
- Søberg, S.; Sandholt, C.H.; Jespersen, N.Z.; Toft, U.; Madsen, A.L.; Von Holstein-Rathlou, S.; Grevengoed, T.J.; Christensen, K.B.; Bredie, W.L.P.; Potthoff, M.J.; et al. FGF21 Is a Sugar-Induced Hormone Associated with Sweet Intake and Preference in Humans. Cell Metab. 2017, 25, 1045–1053.e6. [Google Scholar] [CrossRef] [PubMed]
- Chu, A.Y.; Workalemahu, T.; Paynter, N.P.; Rose, L.M.; Giulianini, F.; Tanaka, T.; Ngwa, J.S.; Qi, Q.; Curhan, G.C.; Rimm, E.B.; et al. Novel locus including FGF21 is associated with dietary macronutrient intake. Hum. Mol. Genet. 2013, 22, 1895–1902. [Google Scholar] [CrossRef]
- Kanai, M.; Akiyama, M.; Takahashi, A.; Matoba, N.; Momozawa, Y.; Ikeda, M.; Iwata, N.; Ikegawa, S.; Hirata, M.; Matsuda, K.; et al. Genetic analysis of quantitative traits in the Japanese population links cell types to complex human diseases. Nat. Genet. 2018, 50, 390–400. [Google Scholar] [CrossRef]
- Dias, A.G.; Eny, K.M.; Cockburn, M.; Chiu, W.; Nielsen, D.E.; Duizer, L.; El-Sohemy, A. Variation in the TAS1R2 Gene, Sweet Taste Perception and Intake of Sugars. J. Nutr. Nutr. 2015, 8, 81–90. [Google Scholar] [CrossRef]
- Robino, A.; Bevilacqua, L.; Pirastu, N.; Situlin, R.; Di Lenarda, R.; Gasparini, P.; Navarra, C.O. Polymorphisms in sweet taste genes (TAS1R2 and GLUT2), sweet liking, and dental caries prevalence in an adult Italian population. Genes Nutr. 2015, 10, 34. [Google Scholar] [CrossRef] [PubMed]
- Al-Daghri, N.M.; Alkharfy, K.M.; Al-Attas, O.S.; Krishnaswamy, S.; Mohammed, A.K.; Albagha, O.M.; Alenad, A.M.; Chrousos, G.P.; Alokail, M.S. Association between type 2 diabetes mellitus-related SNP variants and obesity traits in a Saudi population. Mol. Biol. Rep. 2014, 41, 1731–1740. [Google Scholar] [CrossRef]
- Emilsson, V.; Ilkov, M.; Lamb, J.R.; Finkel, N.; Gudmundsson, E.F.; Pitts, R.; Hoover, H.; Gudmundsdottir, V.; Horman, S.R.; Aspelund, T.; et al. Co-regulatory networks of human serum proteins link genetics to disease. Science 2018, 361, 769–773. [Google Scholar] [CrossRef]
- Zavarella, S.; Petrone, A.; Zampetti, S.; Gueorguiev, M.; Spoletini, M.; Mein, C.A.; Leto, G.; Korbonits, M.; Buzzetti, R. A new variation in the promoter region, the −604 C>T, and the Leu72Met polymorphism of the ghrelin gene are associated with protection to insulin resistance. Int. J. Obes. 2008, 32, 663–668. [Google Scholar] [CrossRef]
- May-Wilson, S.; Matoba, N.; Wade, K.H.; Hottenga, J.-J.; Concas, M.P.; Mangino, M.; Grzeszkowiak, E.J.; Menni, C.; Gasparini, P.; Timpson, N.J.; et al. Large-scale GWAS of food liking reveals genetic determinants and genetic correlations with distinct neurophysiological traits. Nat. Commun. 2022, 13, 2743. [Google Scholar] [CrossRef]
- Gaulton, K.J.; Willer, C.J.; Li, Y.; Scott, L.J.; Conneely, K.N.; Jackson, A.U.; Duren, W.L.; Chines, P.S.; Narisu, N.; Bonnycastle, L.L.; et al. Comprehensive Association Study of Type 2 Diabetes and Related Quantitative Traits With 222 Candidate Genes. Diabetes 2008, 57, 3136–3144. [Google Scholar] [CrossRef] [PubMed]
- for the GDS Group; Rathmann, W.; Strassburger, K.; Bongaerts, B.; Kuss, O.; Müssig, K.; Burkart, V.; Szendroedi, J.; Kotzka, J.; Knebel, B.; et al. A variant of the glucose transporter gene SLC2A2 modifies the glycaemic response to metformin therapy in recently diagnosed type 2 diabetes. Diabetologia 2019, 62, 286–291. [Google Scholar] [CrossRef]
- Xi, C.; Miyaki, K.; Ikeda, S.; Song, Y.; Sinbo, T.; Muramatsu, M. Association of GLUT4 gene variants with HbA1c level in Japanese men. Endocr. J. 2012, 59, 677–684. [Google Scholar] [CrossRef] [PubMed]
- Yu, F.; Liu, F.; Li, X.-M.; Zhao, Q.; Luo, J.-Y.; Zhang, J.-Y.; Yang, Y.-N. GLUT4 gene rs5418 polymorphism is associated with increased coronary heart disease risk in a Uygur Chinese population. BMC Cardiovasc. Disord. 2022, 22, 191. [Google Scholar] [CrossRef] [PubMed]
- Yilmaz, Z.; Davis, C.; Loxton, N.J.; Kaplan, A.S.; Levitan, R.D.; Carter, J.C.; Kennedy, J.L. Association between MC4R rs17782313 polymorphism and overeating behaviors. Int. J. Obes. 2015, 39, 114–120. [Google Scholar] [CrossRef]
- Gueorguiev, M.; Lecoeur, C.; Meyre, D.; Benzinou, M.; Mein, C.A.; Hinney, A.; Vatin, V.; Weill, J.; Heude, B.; Hebebrand, J.; et al. Association Studies on Ghrelin and Ghrelin Receptor Gene Polymorphisms with Obesity. Obesity 2009, 17, 745–754. [Google Scholar] [CrossRef]
- Abadi, A.; Alyass, A.; Robiou Du Pont, S.; Bolker, B.; Singh, P.; Mohan, V.; Diaz, R.; Engert, J.C.; Yusuf, S.; Gerstein, H.C.; et al. Penetrance of Polygenic Obesity Susceptibility Loci across the Body Mass Index Distribution. Am. J. Hum. Genet. 2017, 101, 925–938. [Google Scholar] [CrossRef]
- Depoortere, I. Taste receptors of the gut: Emerging roles in health and disease. Gut 2014, 63, 179–190. [Google Scholar] [CrossRef]
- Shirazi-Beechey, S.P.; Daly, K.; Al-Rammahi, M.; Moran, A.W.; Bravo, D. Role of nutrient-sensing taste 1 receptor (T1R) family members in gastrointestinal chemosensing. Br. J. Nutr. 2014, 111, S8–S15. [Google Scholar] [CrossRef]
- Widmayer, P.; Küper, M.; Kramer, M.; Königsrainer, A.; Breer, H. Altered expression of gustatory-signaling elements in gastric tissue of morbidly obese patients. Int. J. Obes. 2012, 36, 1353–1359. [Google Scholar] [CrossRef]
- Young, R.L.; Sutherland, K.; Pezos, N.; Brierley, S.M.; Horowitz, M.; Rayner, C.K.; Blackshaw, L.A. Expression of taste molecules in the upper gastrointestinal tract in humans with and without type 2 diabetes. Gut 2009, 58, 337–346. [Google Scholar] [CrossRef]
- Gómez De Cedrón, M.; Wagner, S.; Reguero, M.; Menéndez-Rey, A.; Ramírez De Molina, A. Miracle Berry as a Potential Supplement in the Control of Metabolic Risk Factors in Cancer. Antioxidants 2020, 9, 1282. [Google Scholar] [CrossRef] [PubMed]
- Miller, L.K.; Devi, L.A. The Highs and Lows of Cannabinoid Receptor Expression in Disease: Mechanisms and Their Therapeutic Implications. Pharmacol. Rev. 2011, 63, 461–470. [Google Scholar] [CrossRef]
- Viveros, M.; De Fonseca, F.; Bermudez-Silva, F.; McPartland, J. Critical Role of the Endocannabinoid System in the Regulation of Food Intake and Energy Metabolism, with Phylogenetic, Developmental, and Pathophysiological Implications. Endocrine‚ Metab. Immune Disord.-Drug Targets 2008, 8, 220–230. [Google Scholar] [CrossRef]
- Buraczynska, M.; Wacinski, P.; Zukowski, P.; Dragan, M.; Ksiazek, A. Common polymorphism in the cannabinoid type 1 receptor gene (CNR1) is associated with microvascular complications in type 2 diabetes. J. Diabetes Complicat. 2014, 28, 35–39. [Google Scholar] [CrossRef] [PubMed]
- Hu, W.-C.; Feng, P. G1359A Polymorphism in the Cannabinoid Receptor-1 Gene Is Associated with Metabolic Syndrome in the Chinese Han Population. Arch. Med. Res. 2010, 41, 378–382. [Google Scholar] [CrossRef] [PubMed]
- Sadeghian, M.; Rahmani, S.; Mansoori, A. G1359A Variant of the Cannabinoid Receptor Gene (rs1049353) and Obesity-Related Traits and Related Endophenotypes: A Meta-Analysis. Ann. Nutr. Metab. 2018, 73, 76–85. [Google Scholar] [CrossRef]
- De Luis, D.A.; Izaola, O.; Aller, R.; Lopez, J.J.; Torres, B.; Diaz, G.; Gomez, E.; Romero, E. Association of G1359A polymorphism of the cannabinoid receptor gene (CNR1) with macronutrient intakes in obese females. J. Hum. Nutr. Diet. 2016, 29, 118–123. [Google Scholar] [CrossRef]
- De Luis, D.A.; Sagrado, M.G.; Aller, R.; Izaola, O.; Conde, R. Relation of G1359A polymorphism of the cannabinoid receptor (CB1) gene with metabolic syndrome by ATP III classification. Diabetes Metab. Res. Rev. 2011, 27, 506–511. [Google Scholar] [CrossRef]
- De Luis, D.A.; González Sagrado, M.; Aller, R.; Izaola, O.; Conde, R. Influence of G1359A polymorphism of the cannabinoid receptor gene on anthropometric parameters and insulin resistance in women with obesity. Metabolism 2011, 60, 272–276. [Google Scholar] [CrossRef]
- Frost, M.; Nielsen, T.L.; Wraae, K.; Hagen, C.; Piters, E.; Beckers, S.; De Freitas, F.; Brixen, K.; Van Hul, W.; Andersen, M. Polymorphisms in the endocannabinoid receptor 1 in relation to fat mass distribution. Eur. J. Endocrinol. 2010, 163, 407–412. [Google Scholar] [CrossRef] [PubMed]
- Doris, J.M.; Millar, S.A.; Idris, I.; O’Sullivan, S.E. Genetic polymorphisms of the endocannabinoid system in obesity and diabetes. Diabetes Obes. Metab. 2019, 21, 382–387. [Google Scholar] [CrossRef] [PubMed]
- Lamers, D.; Famulla, S.; Wronkowitz, N.; Hartwig, S.; Lehr, S.; Ouwens, D.M.; Eckardt, K.; Kaufman, J.M.; Ryden, M.; Müller, S.; et al. Dipeptidyl Peptidase 4 Is a Novel Adipokine Potentially Linking Obesity to the Metabolic Syndrome. Diabetes 2011, 60, 1917–1925. [Google Scholar] [CrossRef] [PubMed]
- Sell, H.; Blüher, M.; Klöting, N.; Schlich, R.; Willems, M.; Ruppe, F.; Knoefel, W.T.; Dietrich, A.; Fielding, B.A.; Arner, P.; et al. Adipose Dipeptidyl Peptidase-4 and Obesity. Diabetes Care 2013, 36, 4083–4090. [Google Scholar] [CrossRef]
- Zhao, T.; Parikh, P.; Bhashyam, S.; Bolukoglu, H.; Poornima, I.; Shen, Y.-T.; Shannon, R.P. Direct Effects of Glucagon-Like Peptide-1 on Myocardial Contractility and Glucose Uptake in Normal and Postischemic Isolated Rat Hearts. J. Pharmacol. Exp. Ther. 2006, 317, 1106–1113. [Google Scholar] [CrossRef]
- Zheng, T.; Chen, T.; Liu, Y.; Gao, Y.; Tian, H. Increased plasma DPP4 activity predicts new-onset hypertension in Chinese over a 4-year period: Possible associations with inflammation and oxidative stress. J. Hum. Hypertens. 2015, 29, 424–429. [Google Scholar] [CrossRef]
- Mulvihill, E.E.; Drucker, D.J. Pharmacology, Physiology, and Mechanisms of Action of Dipeptidyl Peptidase-4 Inhibitors. Endocr. Rev. 2014, 35, 992–1019. [Google Scholar] [CrossRef]
- Aghili, N.; Devaney, J.M.; Alderman, L.O.; Zukowska, Z.; Epstein, S.E.; Burnett, M.S. Polymorphisms in dipeptidyl peptidase IV gene are associated with the risk of myocardial infarction in patients with atherosclerosis. Neuropeptides 2012, 46, 367–371. [Google Scholar] [CrossRef]
- Vargas-Alarcón, G.; González-Salazar, M.D.C.; Vázquez-Vázquez, C.; Hernández-Díaz Couder, A.; Sánchez-Muñoz, F.; Reyes-Barrera, J.; Criales-Vera, S.A.; Sánchez-Guerra, M.; Osorio-Yáñez, C.; Posadas-Sánchez, R. The rs12617336 and rs17574 Dipeptidyl Peptidase-4 Polymorphisms Are Associated With Hypoalphalipoproteinemia and Dipeptidyl Peptidase-4 Serum Levels: A Case-Control Study of the Genetics of Atherosclerotic Disease (GEA) Cohort. Front. Genet. 2021, 12, 592646. [Google Scholar] [CrossRef]
- Teymoori, F.; Mokhtari, E.; Salehi, P.; Hosseini-Esfahani, F.; Mirmiran, P.; Azizi, F. A nutrient pattern characterized by vitamin A, C, B6, potassium, and fructose is associated with reduced risk of insulin-related disorders: A prospective study among participants of Tehran lipid and glucose study. Diabetol. Metab. Syndr. 2021, 13, 12. [Google Scholar] [CrossRef]
- Gröber, U.; Schmidt, J.; Kisters, K. Magnesium in Prevention and Therapy. Nutrients 2015, 7, 8199–8226. [Google Scholar] [CrossRef]
- Firouzi, A.; Maadani, M.; Kiani, R.; Shakerian, F.; Sanati, H.R.; Zahedmehr, A.; Nabavi, S.; Heidarali, M. Intravenous magnesium sulfate: New method in prevention of contrast-induced nephropathy in primary percutaneous coronary intervention. Int. Urol. Nephrol. 2015, 47, 521–525. [Google Scholar] [CrossRef] [PubMed]
- Farag, M.A.; Abib, B.; Qin, Z.; Ze, X.; Ali, S.E. Dietary macrominerals: Updated review of their role and orchestration in human nutrition throughout the life cycle with sex differences. Curr. Res. Food Sci. 2023, 6, 100450. [Google Scholar] [CrossRef] [PubMed]
- Miller, J.W.; Rucker, R.B. Pantothenic Acid. In Present Knowledge in Nutrition; Erdman, J.W., Macdonald, I.A., Zeisel, S.H., Eds.; Wiley: Hoboken, NJ, USA, 2012; pp. 375–390. ISBN 978-0-470-95917-6. [Google Scholar]
- Hodges, R.E.; Ohlson, M.A.; Bean, W.B. Pantothenic Acid Deficiency in Man1. J. Clin. Investig. 1958, 37, 1642–1657. [Google Scholar] [CrossRef] [PubMed]
- Xu, J.; Patassini, S.; Begley, P.; Church, S.; Waldvogel, H.J.; Faull, R.L.M.; Unwin, R.D.; Cooper, G.J.S. Cerebral deficiency of vitamin B5 (d-pantothenic acid; pantothenate) as a potentially-reversible cause of neurodegeneration and dementia in sporadic Alzheimer’s disease. Biochem. Biophys. Res. Commun. 2020, 527, 676–681. [Google Scholar] [CrossRef]
- Marty, V.N.; Farokhnia, M.; Munier, J.J.; Mulpuri, Y.; Leggio, L.; Spigelman, I. Long-Acting Glucagon-Like Peptide-1 Receptor Agonists Suppress Voluntary Alcohol Intake in Male Wistar Rats. Front. Neurosci. 2020, 14, 599646. [Google Scholar] [CrossRef]
- Eren-Yazicioglu, C.Y.; Yigit, A.; Dogruoz, R.E.; Yapici-Eser, H. Can GLP-1 Be a Target for Reward System Related Disorders? A Qualitative Synthesis and Systematic Review Analysis of Studies on Palatable Food, Drugs of Abuse, and Alcohol. Front. Behav. Neurosci. 2021, 14, 614884. [Google Scholar] [CrossRef]
- Seino, Y.; Fukushima, M.; Yabe, D. GIP and GLP-1, the two incretin hormones: Similarities and differences: Similarities and differences of GIP and GLP-1. J. Diabetes Investig. 2010, 1, 8–23. [Google Scholar] [CrossRef]
- Klausen, M.K.; Thomsen, M.; Wortwein, G.; Fink-Jensen, A. The role of glucagon-like peptide 1 (GLP-1) in addictive disorders. Br. J. Pharmacol. 2022, 179, 625–641. [Google Scholar] [CrossRef]
- Tsermpini, E.E.; Goričar, K.; Kores Plesničar, B.; Plemenitaš Ilješ, A.; Dolžan, V. Genetic Variability of Incretin Receptors and Alcohol Dependence: A Pilot Study. Front. Mol. Neurosci. 2022, 15, 908948. [Google Scholar] [CrossRef]
- Liu, J.; Liu, J.; Li, P.; Xie, X.; Guo, Q.; Tian, L.; Ma, X.; Zhang, J.; Liu, J.; Gao, J. Association of sterol regulatory element-binding protein-1c gene polymorphism with type 2 diabetes mellitus, insulin resistance and blood lipid levels in Chinese population. Diabetes Res. Clin. Pract. 2008, 82, 42–47. [Google Scholar] [CrossRef] [PubMed]
- Alam, M.M.; Iqbal, S.; Naseem, I. Ameliorative effect of riboflavin on hyperglycemia, oxidative stress and DNA damage in type-2 diabetic mice: Mechanistic and therapeutic strategies. Arch. Biochem. Biophys. 2015, 584, 10–19. [Google Scholar] [CrossRef] [PubMed]
- Legaki, E.; Tsaklakidou, D.; Hatzimanolis, A.; Segredou, E.; Petalotis, M.; Moularogiorgou, G.; Mouchtouri, V.; Lykouras, L.; Stefanis, N.C.; Gazouli, M. Association of Alcohol Use Disorder Risk with ADH1B, DRD2, FAAH, SLC39A8, GCKR, and PDYN Genetic Polymorphisms. In Vivo 2022, 36, 2092–2104. [Google Scholar] [CrossRef] [PubMed]
- Müller, T.D.; Brönner, G.; Wandolski, M.; Carrie, J.; Nguyen, T.T.; Greene, B.H.; Scherag, A.; Grallert, H.; Vogel, C.I.; Scherag, S.; et al. Mutation screen and association studies for the fatty acid amide hydrolase (FAAH) gene and early onset and adult obesity. BMC Med. Genet. 2010, 11, 2. [Google Scholar] [CrossRef]
- Sipe, J.C.; Waalen, J.; Gerber, A.; Beutler, E. Overweight and obesity associated with a missense polymorphism in fatty acid amide hydrolase (FAAH). Int. J. Obes. 2005, 29, 755–759. [Google Scholar] [CrossRef]
- Shigemura, N.; Shirosaki, S.; Sanematsu, K.; Yoshida, R.; Ninomiya, Y. Genetic and Molecular Basis of Individual Differences in Human Umami Taste Perception. PLoS ONE 2009, 4, e6717. [Google Scholar] [CrossRef]
- Rawal, S.; Hayes, J.E.; Wallace, M.R.; Bartoshuk, L.M.; Duffy, V.B. Do Polymorphisms in the TAS1R1 Gene Contribute to Broader Differences in Human Taste Intensity? Chem. Senses 2013, 38, 719–728. [Google Scholar] [CrossRef]
- Tanaka, M. Molecular mechanism of obesity-induced adipose tissue inflammation; the role of Mincle in adipose tissue fibrosis and ectopic lipid accumulation. Endocr. J. 2020, 67, 107–111. [Google Scholar] [CrossRef]
Disclaimer/Publisher’s Note: The statements, opinions and data contained in all publications are solely those of the individual author(s) and contributor(s) and not of MDPI and/or the editor(s). MDPI and/or the editor(s) disclaim responsibility for any injury to people or property resulting from any ideas, methods, instructions or products referred to in the content. |
© 2025 by the authors. Licensee MDPI, Basel, Switzerland. This article is an open access article distributed under the terms and conditions of the Creative Commons Attribution (CC BY) license (https://creativecommons.org/licenses/by/4.0/).