
Impact of Combined Macronutrient Diet on Amino Acids and Amines Plasma Levels
 , ,
, ,  , and
, and Highlights
- A diet combining protein, fat, and fiber significantly reduced plasma amino acid levels compared to a diet containing protein and fat alone.
- Metabolic profiling revealed clear group differentiation at 55 and 98 days, with five key metabolites identified (leucine, asparagine, alanine, cysteine, and creatine).
- Specific amino acid changes may reflect different health statuses and responses to macronutrient combinations.
Abstract
1. Introduction
2. Materials and Methods
2.1. Subjects
2.2. Ethics
2.3. Dietary Intervention
2.4. Amino Acids and Amines Analyzed
2.5. Chemicals and Reagents
2.6. Sample Collection, Preparation, and LC/MSMS Analysis
2.7. Statistical Analysis
3. Results
3.1. Plasma Concentrations of Amino Acids and Amines
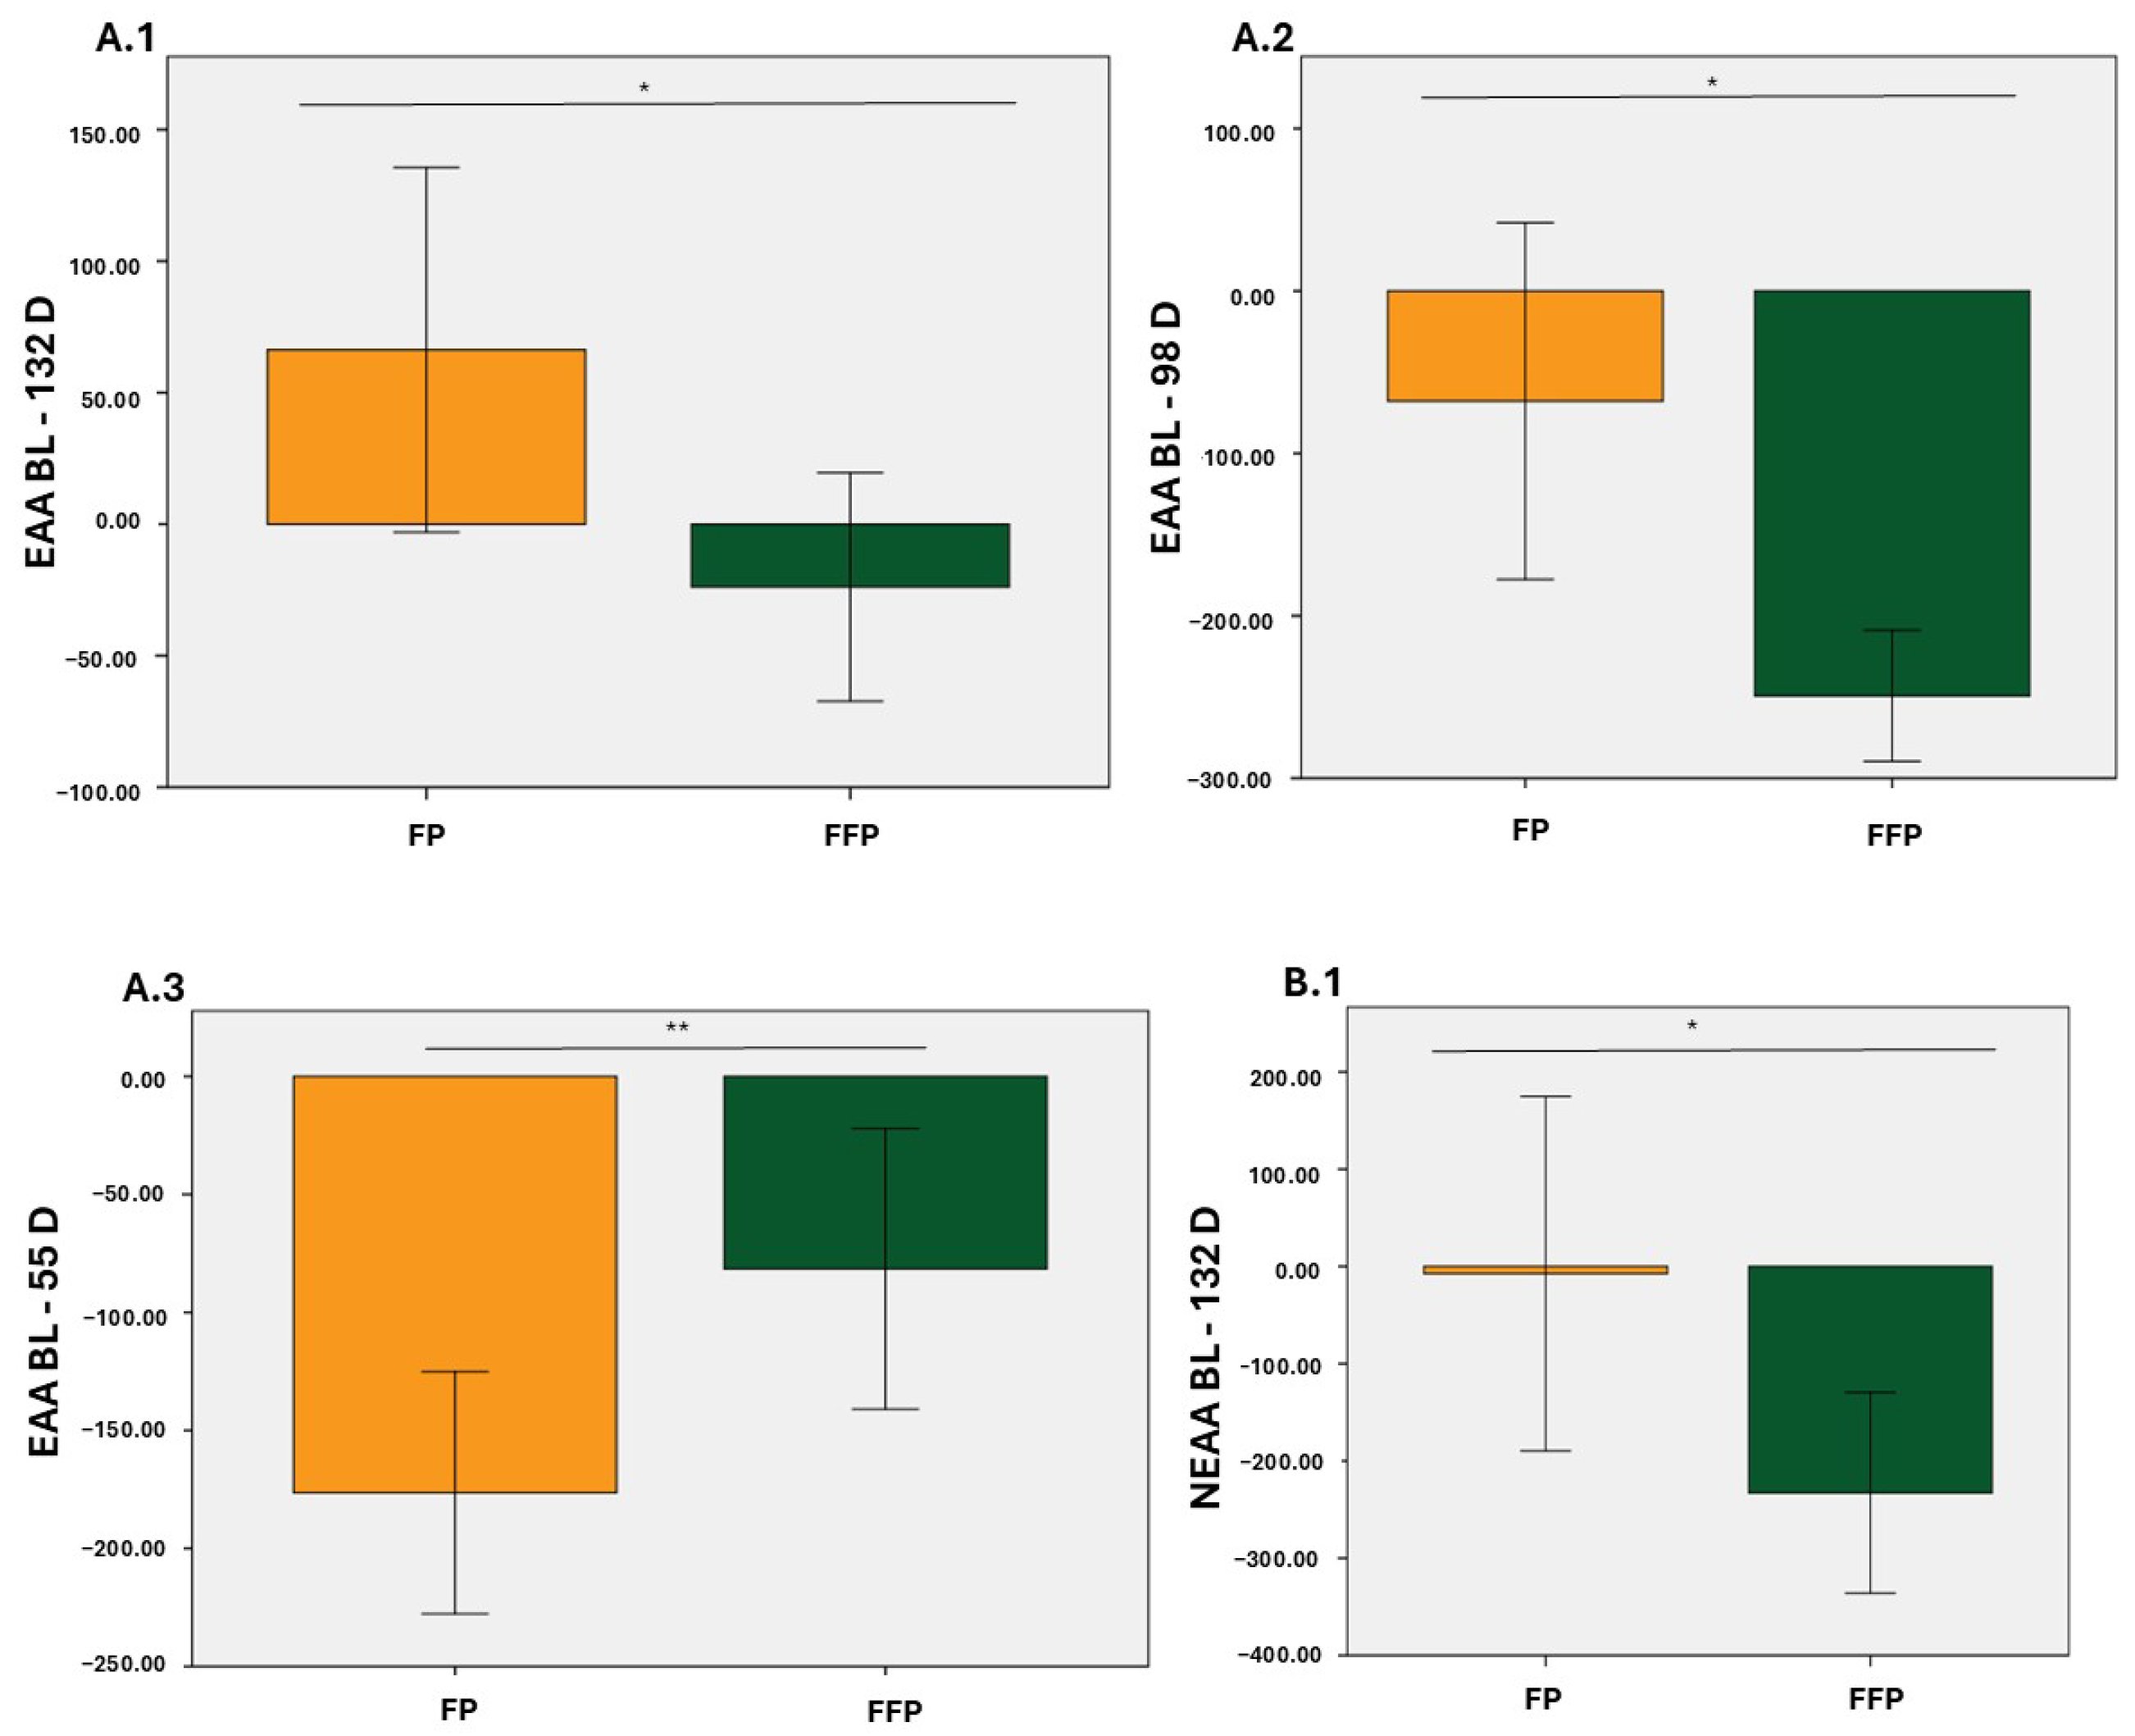
3.2. Plasma Concentrations of EAA, NEAA, BCAA and AAA
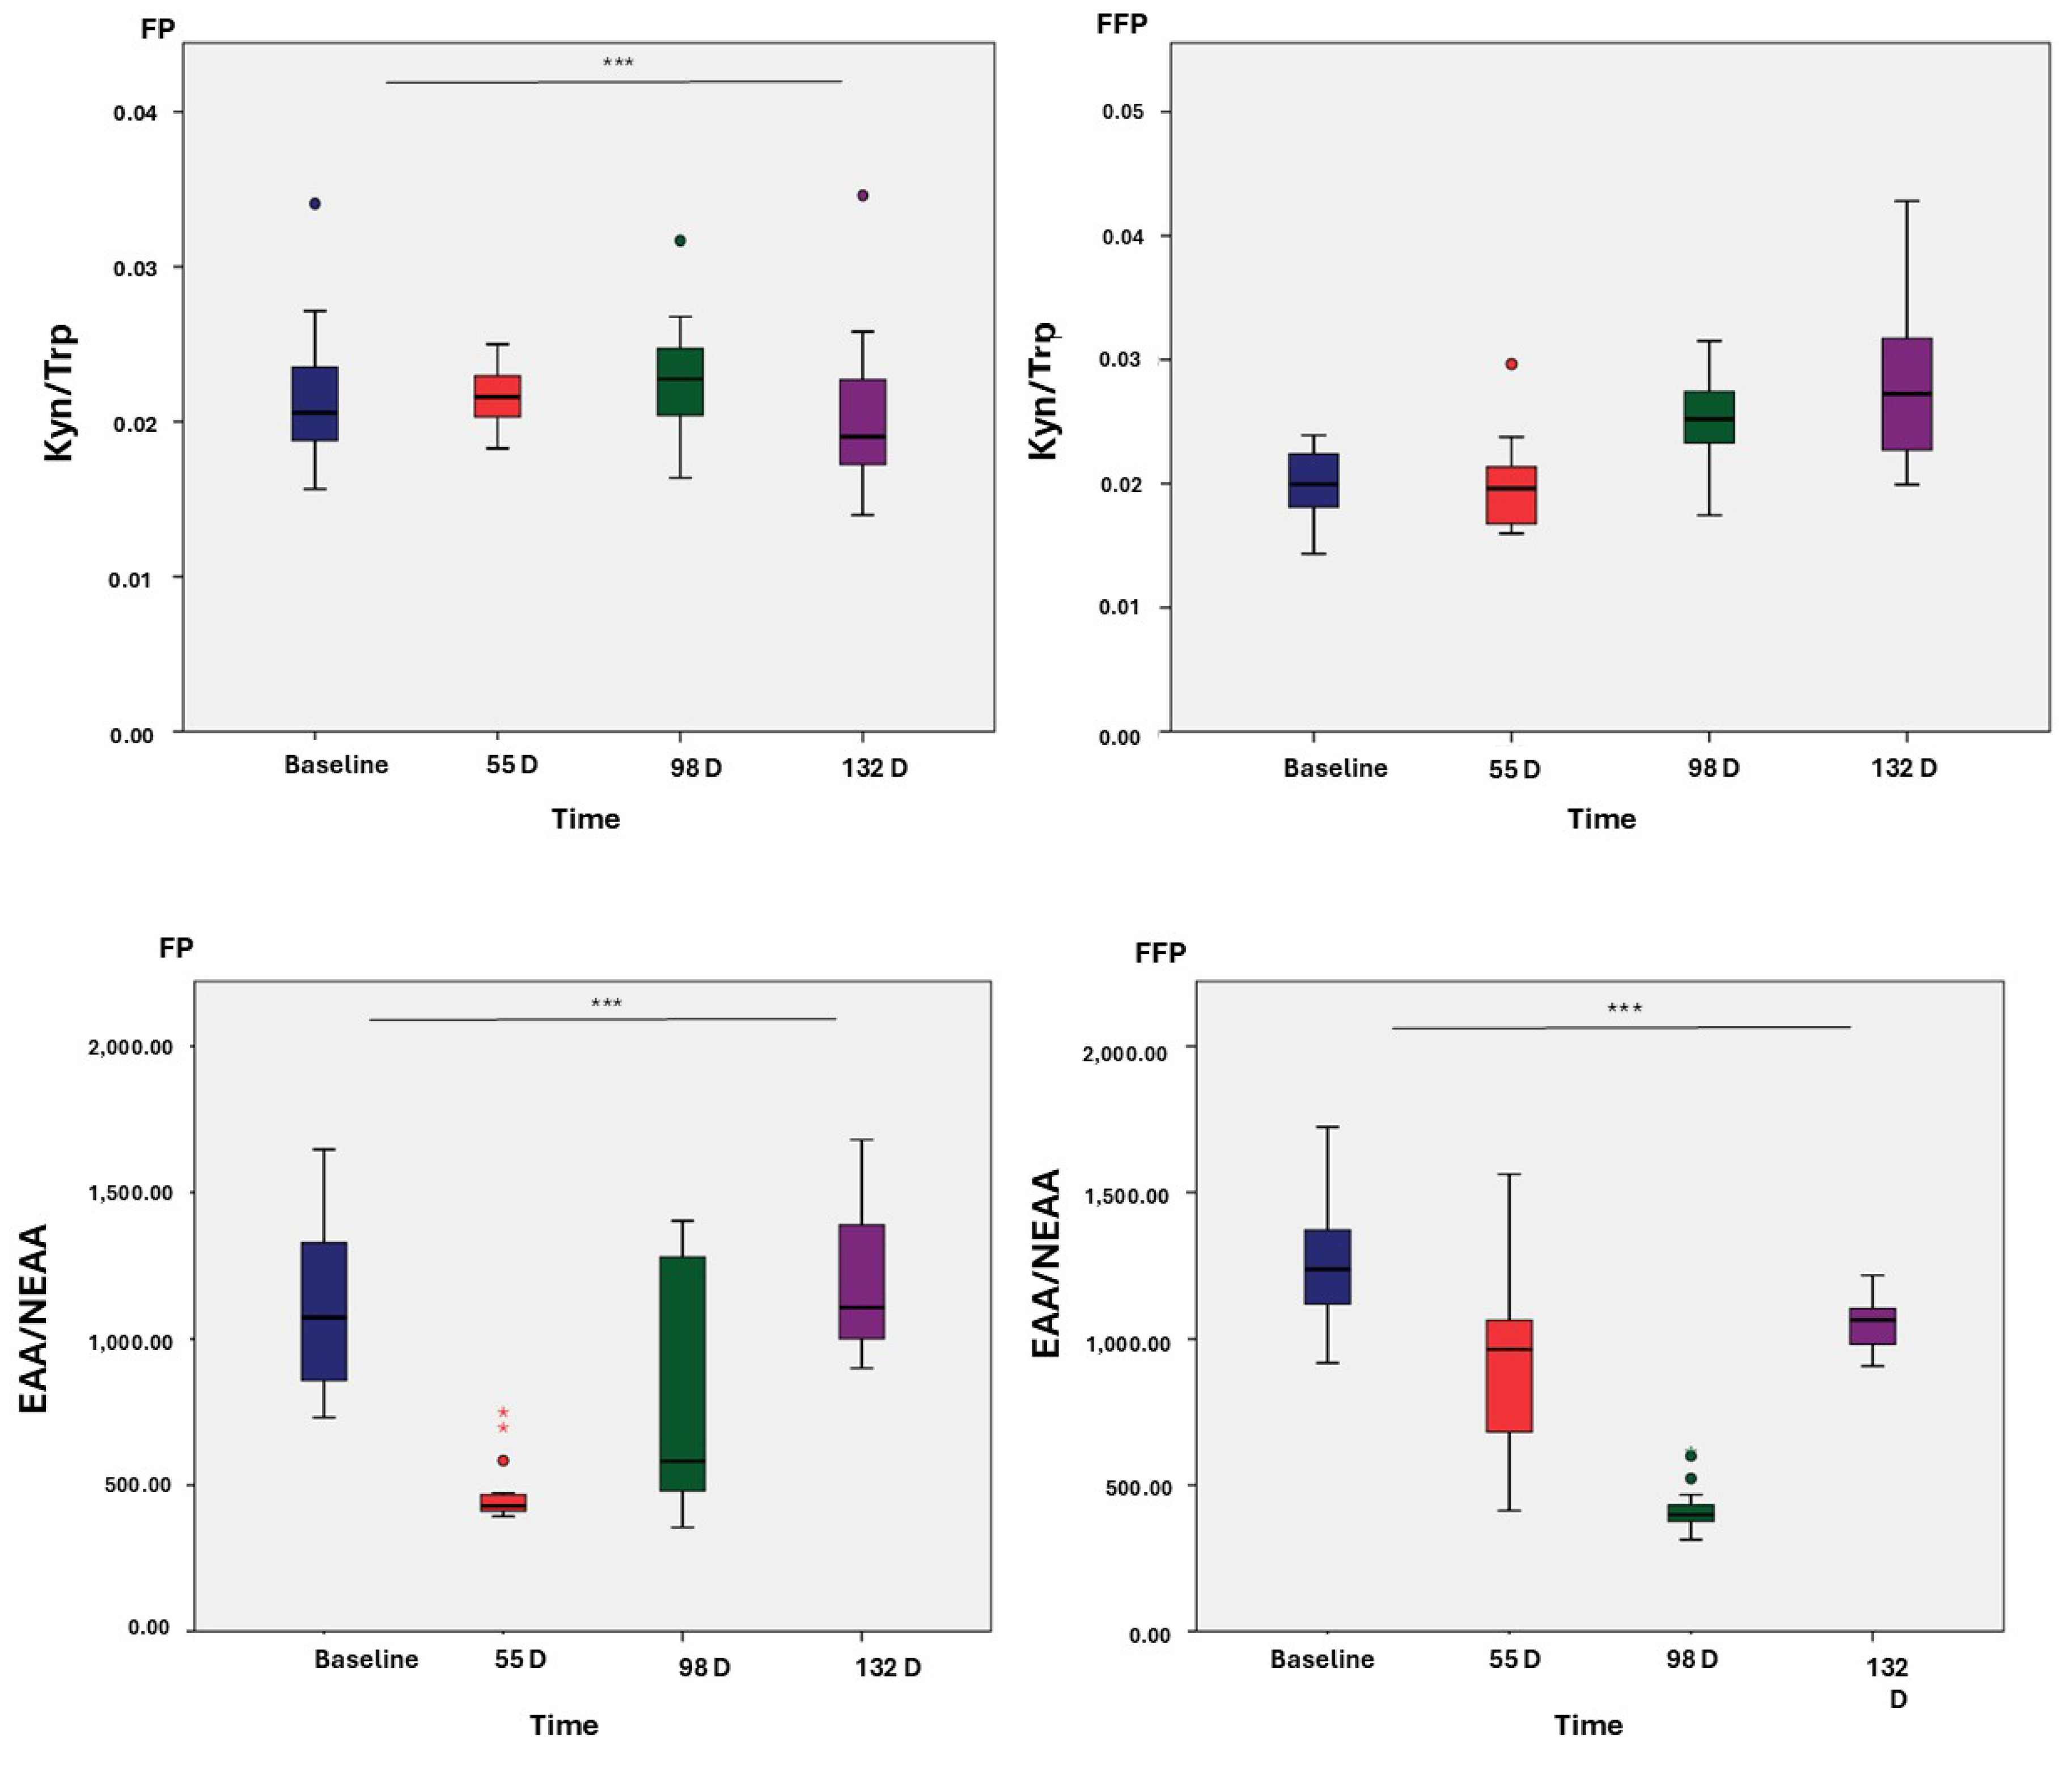
3.3. Ratios of Amino Acids
3.4. Metabolic Profiles
3.5. Amino Acids and Amines as Differentiating Metabolites of the Intervention Diet
4. Discussion
5. Concluding Remarks
Supplementary Materials
Author Contributions
Funding
Institutional Review Board Statement
Informed Consent Statement
Data Availability Statement
Acknowledgments
Conflicts of Interest
Abbreviations
| Amino Acids | AA |
| Aromatic Amino Acids | AAA |
| Branched-Chain Amino Acids | BCAA |
| Electrospray ionization | ESI |
| Essential Amino Acids | EAA |
| Liquid Chromatography-Mass Spectrometry | LC-MS/MS |
| Non-Essential Amino Acids | NEAA |
References
- Kortesniemi, M.; Noerman, S.; Kårlund, A.; Raita, J.; Meuronen, T.; Koistinen, V.; Landberg, R.; Hanhineva, K. Nutritional metabolomics: Recent developments and future needs. Curr. Opin. Chem. Biol. 2023, 77, 102400. [Google Scholar] [CrossRef] [PubMed]
- Gundogdu, A.; Nalbantoglu, O.U. The role of the Mediterranean diet in modulating the gut microbiome: A review of current evidence. Nutrition 2023, 114, 112118. [Google Scholar] [CrossRef] [PubMed]
- Muguruma, Y.; Nunome, M.; Inoue, K. A review on foodomics based on liquid chromatography mass spectrometry. Chem. Pharm. Bull. 2022, 70, 12–18. [Google Scholar] [CrossRef]
- Rodríguez-Carrasco, Y. Foodomics: Current and future perspectives in food analysis. Foods 2022, 11, 1238. [Google Scholar] [CrossRef]
- Papandreou, C. Nutrition, Metabolites, and Human Health. Nutrients 2023, 15, 4286. [Google Scholar] [CrossRef]
- Roberts, L.D.; Souza, A.L.; Gerszten, R.E.; Clish, C.B. Targeted metabolomics. Curr. Protoc. Mol. Biol. 2012, 98, 30–32. [Google Scholar] [CrossRef]
- Nicholson, J.K.; Lindon, J.C.; Holmes, E. ‘Metabonomics’: Understanding the metabolic responses of living systems to pathophysiological stimuli via multivariate statistical analysis of biological NMR spectroscopic data. Xenobiotica 1999, 29, 1181–1189. [Google Scholar] [CrossRef]
- Saavedra-Charca, W.; Vásquez Villalobos, V.; Rojas, C. Analytical techniques used in food metabolomics. Agroind. Sci. 2015, 5, 191–210. [Google Scholar] [CrossRef]
- Bibbo, S.; Ianiro, G.; Giorgio, V.; Scaldaferri, F.; Masucci, L.; Gasbarrini, A.; Cammarota, G. The role of diet on gut microbiota composition. Eur. Rev. Med. Pharmacol. Sci. 2016, 20, 4742–4749. [Google Scholar]
- Adolph, T.E.; Tilg, H. Western diets and chronic diseases. Nat. Med. 2024, 30, 2133–2147. [Google Scholar] [CrossRef]
- Cassotta, M.; Forbes-Hernandez, T.Y.; Cianciosi, D.; Elexpuru Zabaleta, M.; Sumalla Cano, S.; Dominguez, I.; Battino, M. Nutrition and rheumatoid arthritis in the ‘omics’ era. Nutrients 2021, 13, 763. [Google Scholar] [CrossRef] [PubMed]
- Catussi, B.L.C.; Turco, E.G.L.; Pereira, D.M.; Teixeira, R.M.N.; Castro, B.P.; Massaia, I.F.D. Metabolomics: Unveiling biological matrices in precision nutrition and health. Clin. Nutr. ESPEN 2024, 64, 314–323. [Google Scholar] [CrossRef]
- Kölker, S. Metabolism of amino acid neurotransmitters: The synaptic disorder underlying inherited metabolic diseases. J. Inherit. Metab. Dis. 2018, 41, 1055–1063. [Google Scholar] [CrossRef] [PubMed]
- de Koning, T.J. Amino acid synthesis deficiencies. J. Inherit. Metab. Dis. 2017, 40, 609–620. [Google Scholar] [CrossRef]
- Yahyaoui, R.; Pérez-Frías, J. Amino acid transport defects in human inherited metabolic disorders. Int. J. Mol. Sci. 2020, 21, 119. [Google Scholar] [CrossRef]
- Yamakado, M.; Nagao, K.; Imaizumi, A.; Tani, M.; Toda, A.; Tanaka, T.; Jinzu, H.; Miyano, H.; Yamamoto, H.; Daimon, T.; et al. Plasma free amino acid profiles predict four-year risk of developing diabetes, metabolic syndrome, dyslipidemia and hypertension in Japanese population. Sci. Rep. 2015, 5, 11918. [Google Scholar] [CrossRef]
- Bi, X.; Henry, C.J. Plasma-free amino acid profiles are predictors of cancer and diabetes development. Nutr. Diabetes 2017, 7, e249. [Google Scholar] [CrossRef]
- Teng, J.; Xiang, L.; Long, H.; Gao, C.; Lei, L.; Zhang, Y. The serum citrulline and d-lactate are associated with gastrointestinal dysfunction and failure in critically ill patients. Int. J. Gen. Med. 2021, 14, 4125–4134. [Google Scholar] [CrossRef]
- Gervasini Rodríguez, G.; Verde, Z.; González, L.M.; Chicharro, C.; González-Rodríguez, L.; Fernández-Araque, A.; Mota-Zamorano, S.; Cancho, B.; Pérez-Hernández, A.; García-López, V.; et al. Prognostic Significance of Amino Acid and Biogenic Amines Profiling in Chronic Kidney Disease. Biomedicines 2013, 11, 2775. [Google Scholar] [CrossRef]
- Simińska, E.; Koba, M. Amino acid profiling as a method of discovering biomarkers for early diagnosis of cancer. Amino Acids 2016, 48, 1339–1345. [Google Scholar] [CrossRef]
- Zhang, C.; Wang, Y.; Cao, Y.; Shi, L.; Wang, R.; Sheng, N.; Wang, Q.; Zhu, Z. Study on plasma amino acids and piperonamide as potential diagnostic biomarkers of non-small cell lung cancer. Transl. Cancer Res. 2022, 11, 1269–1284. [Google Scholar] [CrossRef] [PubMed]
- Geng, P.; Qin, W.; Xu, G. Proline metabolism in cancer. Amino Acids 2021, 53, 1769–1777. [Google Scholar] [CrossRef] [PubMed]
- Jiang, J.; Batra, S.; Zhang, J. Asparagine: A metabolite to be targeted in cancers. Metabolites 2021, 11, 402. [Google Scholar] [CrossRef] [PubMed]
- Choi, B.H.; Coloff, J.L. The diverse functions of non-essential amino acids in cancer. Cancers 2019, 11, 675. [Google Scholar] [CrossRef]
- Combs, G.F.; Trumbo, P.R.; McKinley, M.C.; Milner, J.; Studenski, S.; Kimura, T.; Watkins, S.M.; Raiten, D.J. Biomarkers in nutrition: New frontiers in research and application. Ann. N. Y. Acad. Sci. 2013, 1278, 1–10. [Google Scholar] [CrossRef]
- Cutuli, D.; Giacovazzo, G.; Decandia, D.; Coccurello, R. Alzheimer’s disease and depression in the elderly: A trajectory linking gut microbiota and serotonin signaling. Front. Psychiatry 2022, 13, 1010169. [Google Scholar] [CrossRef]
- Adeyemi, O.S.; Awakan, O.J.; Afolabi, L.B.; Rotimi, D.E.; Oluwayemi, E.; Otuechere, C.A.; Ibraheem, O.; Elebiyo, T.C.; Alejolowo, O.; Arowolo, A.T. Hypoxia and the Kynurenine Pathway: Implications and Therapeutic Prospects in Alzheimer’s Disease. Oxidative Med. Cell. Longev. 2021, 10, 5522981. [Google Scholar] [CrossRef]
- Socha, E.; Koba, M.; Kośliński, P. Amino acid profiling as a method of discovering biomarkers for diagnosis of neurodegenerative diseases. Amino Acids 2019, 51, 367–371. [Google Scholar] [CrossRef]
- Ruiz-Canela, M.; Toledo, E.; Clish, C.B.; Hruby, A.; Liang, L.; Salas-Salvado, J.; Hu, F.B. Plasma branched-chain amino acids and incident cardiovascular disease in the PREDIMED trial. Clin. Chem. 2016, 62, 582–592. [Google Scholar] [CrossRef]
- Li, J.; Guasch-Ferré, M.; Chung, W.; Ruiz-Canela, M.; Toledo, E.; Corella, D.; Liang, L. The Mediterranean diet, plasma metabolome, and cardiovascular disease risk. Eur. Heart J. 2020, 41, 2645–2656. [Google Scholar] [CrossRef]
- Nishi, H.; Yamanaka, D.; Kamei, H.; Goda, Y.; Kumano, M.; Toyoshima, Y.; Takenaka, A.; Masuda, M.; Nakabayashi, Y.; Shioya, R.; et al. Importance of Serum Amino Acid Profile for Induction of Hepatic Steatosis under Protein Malnutrition. Sci. Rep. 2018, 8, 5461. [Google Scholar] [CrossRef] [PubMed]
- Ahn, S.; Lee, S.H.; Chung, K.S.; Ku, N.S.; Hyun, Y.-M.; Chun, S.; Park, M.S.; Lee, S.-G. Development and validation of a novel sepsis biomarker based on amino acid profiling. Clin. Nutr. 2021, 40, 3668–3676. [Google Scholar] [CrossRef] [PubMed]
- Moazzami, A.A.; Shrestha, A.; Morrison, D.A.; Poutanen, K.; Mykkänen, H. Metabolomics reveals differences in postprandial responses to breads and fasting metabolic characteristics associated with postprandial insulin demand in postmenopausal women. J. Nutr. 2014, 144, 807–814. [Google Scholar] [CrossRef] [PubMed]
- Shrestha, A.; Müllner, E.; Poutanen, K.; Mykkänen, H.; Moazzami, A.A. Metabolic changes in serum metabolome in response to a meal. Eur. J. Nutr. 2017, 56, 671–681. [Google Scholar] [CrossRef]
- Schmedes, M.; Balderas, C.; Aadland, E.K.; Jacques, H.; Lavigne, C.; Graff, I.E.; Eng, Ø.; Holthe, A.; Mellgren, G.; Young, J.F.; et al. The effect of lean-seafood and non-seafood diets on fasting and postprandial serum metabolites and lipid species: Results from a randomized crossover intervention study in healthy adults. Nutrients 2018, 10, 598. [Google Scholar] [CrossRef]
- Chorell, E.; Ryberg, M.; Larsson, C.; Sandberg, S.; Mellberg, C.; Lindahl, B.; Antti, H.; Olsson, T. Plasma metabolomic response to postmenopausal weight loss induced by different diets. Metabolomics 2016, 12, 85. [Google Scholar] [CrossRef]
- Noguchi, Y.; Sakai, R.; Kimura, T. Metabolomics and its potential for assessment of adequacy and safety of amino acid intake. J. Nutr. 2003, 133, 2097S–2100S. [Google Scholar] [CrossRef]
- Piccolo, B.D.; Comerford, K.B.; Karakas, S.E.; Knotts, T.A.; Fiehn, O.; Adams, S.H. Whey protein supplementation does not alter plasma branched-chained amino acid profiles but results in unique metabolomics patterns in obese women enrolled in an 8-week weight loss trial. J. Nutr. 2015, 145, 691–700. [Google Scholar] [CrossRef]
- Hagve, M.; Simbo, S.Y.; Ruebush, L.E.; Engelen, M.P.; Gutierrez-Osuna, R.; Mortazavi, B.J.; Cote, G.L.; Deutz, N.E. Postprandial concentration of circulating branched chain amino acids are able to predict the carbohydrate content of the ingested mixed meal. Clin. Nutr. 2021, 40, 5020–5029. [Google Scholar] [CrossRef]
- López Bascón, M.A. Analytical Strategies to Improve Qualitative and Quantitative Determination in Metabolomics by Mass Spectrometry. Ph.D. Thesis, Universidad de Córdoba, Córdoba, España, 2019. [Google Scholar]
- Montero, L.; Herrero, M. Two-dimensional liquid chromatography approaches in Foodomics—A review. Anal. Chim. Acta 2019, 1083, 1–18. [Google Scholar] [CrossRef]
- van de Velde, B.; Guillarme, D.; Kohler, I. Supercritical fluid chromatography–Mass spectrometry in metabolomics: Past, present, and future perspectives. J. Chromatogr. B 2020, 1161, 122444. [Google Scholar] [CrossRef] [PubMed]
- Duranton, F.; Lundin, U.; Gayrard, N.; Mischak, H.; Aparicio, M.; Mourad, G.; Daurès, J.-P.; Weinberger, K.M.; Argilés, A. Plasma and urinary amino acid metabolomic profiling in patients with different levels of kidney function. Clin. J. Am. Soc. Nephrol. 2014, 9, 37–45. [Google Scholar] [CrossRef] [PubMed]
- Corsetti, G.; Pasini, E.; Romano, C.; Calvani, R.; Picca, A.; Marzetti, E.; Flati, V.; Dioguardi, F.S. Body weight loss and tissue wasting in late middle-aged mice on slightly imbalanced essential/non-essential amino acids diet. Front. Med. 2018, 5, 136. [Google Scholar] [CrossRef]
- Romano, C.; Corsetti, G.; Flati, V.; Pasini, E.; Picca, A.; Calvani, R.; Marzetti, E.; Dioguardi, F.S. Influence of Diets with Varying Essential/Nonessential Amino Acid Ratios on Mouse Lifespan. Nutrients 2019, 11, 1367. [Google Scholar] [CrossRef]
- Gazi, A.; Siddique, A.; Alam, A.; Hossaini, F.; Hasan, M.; Fahim, S.M.; Wahid, B.Z.; Kabir, M.; Das, S.; Mahfuz, M.; et al. Plasma Kynurenine to Tryptophan Ratio Is Not Associated with Undernutrition in Adults but Reduced after Nutrition Intervention: Results from a Community-Based Study in Bangladesh. Nutrients 2022, 14, 1708. [Google Scholar] [CrossRef]
- Badawy, A.A.B.; Guillemin, G. The Plasma [Kynurenine]/[Tryptophan] Ratio and Indoleamine 2,3-Dioxygenase: Time for Appraisal. Int. J. Tryptophan Res. 2019, 12, 1178646919868978. [Google Scholar] [CrossRef]
- Wong, J.M.T.; Malec, P.A.; Mabrouk, O.S.; Ro, J.; Dus, M.; Kennedy, R.T. Benzoyl chloride derivatization with liquid chromatography–mass spectrometry for targeted metabolomics of neurochemicals in biological samples. J. Chromatogr. A 2016, 1446, 78–90. [Google Scholar] [CrossRef]
- Wang, J.; Cui, L.; Pan, G.; Li, Y.; Sun, X.; Zhang, Y.; Zhao, F.; Cao, Y. Simultaneous determination of human plasma 5 amino acid neurotransmitters using liquid chromatography-tandem mass spectrometry: Establishment of reference intervals in Chinese adult population and application to patients with schizophrenia. Clin. Chim. Acta 2024, 552, 117650. [Google Scholar] [CrossRef]
- Peng, M.-Z.; Cai, Y.-N.; Shao, Y.-X.; Zhao, L.; Jiang, M.-Y.; Lin, Y.-T.; Yin, X.; Sheng, H.-Y.; Liu, L. Simultaneous quantification of 48 plasma amino acids by liquid chromatography-tandem mass spectrometry to investigate urea cycle disorders. Clin. Chim. Acta 2019, 495, 406–416. [Google Scholar] [CrossRef]
- Lawton, K.A.; Berger, A.; Mitchell, M.; Milgram, K.E.; Evans, A.M.; Guo, L.; Hanson, R.W.; Kalhan, S.C.; A Ryals, J.; Milburn, M.V. Analysis of the adult human plasma metabolome. Pharmacogenomics 2008, 9, 383–397. [Google Scholar] [CrossRef]
- Pedersen, E.B.; Jørgensen, M.E.; Pedersen, M.B.; Siggaard, C.; Sørensen, T.B.; Mulvad, G.; Hansen, J.C.; Torstensen, A.M.; Aagaard, O.; Skjoldborg, H. Plasma amino acids in Greenlanders and Danes. Influence of seasons, residence, ethnicity, and diet. Am. J. Hum. Biol. 2006, 18, 99–111. [Google Scholar] [CrossRef] [PubMed]
- Nakamura, H.; Nishikata, N.; Kawai, N.; Imaizumi, A.; Miyano, H.; Mori, M.; Yamamoto, H.; Noguchi, Y. Plasma amino acid profiles in healthy East Asian subpopulations living in Japan. Am. J. Hum. Biol. 2016, 28, 236–239. [Google Scholar] [CrossRef] [PubMed]
- Tan, I.K.; Gajra, B. Plasma and urine amino acid profiles in a healthy adult population of Singapore. Ann. Acad. Med. Singap. 2006, 35, 468–475. [Google Scholar] [CrossRef]
- Mitchell, W.K.; Wilkinson, D.J.; Phillips, B.E.; Lund, J.N.; Smith, K.; Atherton, P.J. Human Skeletal Muscle Protein Metabolism Responses to Amino Acid Nutrition. Adv. Nutr. 2016, 7, 828S–838S. [Google Scholar] [CrossRef]
- Lee, C.K.; Klopp, R.G.; Weindruch, R.; Prolla, T.A. Gene expression profile of aging and its retardation by caloric restriction. Science 1999, 285, 1390–1393. [Google Scholar] [CrossRef]
- Pitkänen, H.T.; Oja, S.S.; Kemppainen, K.; Seppä, J.M.; Mero, A.A. Serum amino acid concentrations in aging men and women. Amino Acids 2003, 24, 413–421. [Google Scholar] [CrossRef]
- He, X.; Liu, M.; Li, X.; Sun, T.; Wang, X. Plasma amino acids by age and gender in Hangzhou, Eastern China. Asia Pac. J. Clin. Nutr. 2023, 32, 265–274. [Google Scholar] [CrossRef]
- Rohr, M.W.; Narasimhulu, C.A.; Rudeski-Rohr, T.A.; Parthasarathy, S. Negative Effects of a High-Fat Diet on Intestinal Permeability: A Review. Adv. Nutr. 2020, 11, 77–91. [Google Scholar] [CrossRef]
- Hutchison, A.T.; Piscitelli, D.; Horowitz, M.; Jones, K.L.; Clifton, P.M.; Standfield, S.; Hausken, T.; Feinle-Bisset, C.; Luscombe-Marsh, N.D. Acute load-dependent effects of oral whey protein on gastric emptying, gut hormone release, glycemia, appetite, and energy intake in healthy men. Am. J. Clin. Nutr. 2015, 102, 1574–1584. [Google Scholar] [CrossRef]
- Goetze, O.; Steingoetter, A.; Menne, D.; van der Voort, I.R.; Kwiatek, M.A.; Boesiger, P.; Weishaupt, D.; Thumshirn, M.; Fried, M.; Schwizer, W. The effect of macronutrients on gastric volume responses and gastric emptying in humans: A magnetic resonance imaging study. Am. J. Physiol. Liver Physiol. 2007, 292, 11–17. [Google Scholar] [CrossRef]
- Børsheim, E.; Cree, M.G.; Tipton, K.D.; Elliott, T.A.; Aarsland, A.; Wolfe, R.R. Effect of carbohydrate intake on net muscle protein synthesis during recovery from resistance exercise. J. Appl. Physiol. 2004, 96, 674–678. [Google Scholar] [CrossRef] [PubMed]
- Cynober, L.A. Plasma amino acid levels with a note on membrane transport: Characteristics, regulation, and metabolic significance. Nutrition 2002, 18, 761–766. [Google Scholar] [CrossRef] [PubMed]
- Ryan, P.J.; Riechman, S.E.; Fluckey, J.D.; Wu, G. Interorgan metabolism of amino acids in human health and disease. In Amino Acids in Nutrition and Health: Amino Acids in Gene Expression, Metabolic Regulation, and Exercising Performance; Springer: Cham, Switzerland, 2021; pp. 129–149. [Google Scholar] [CrossRef]
- Torres, N.; Tobón-Cornejo, S.; Velazquez-Villegas, L.A.; Noriega, L.G.; Alemán-Escondrillas, G.; Tovar, A.R. Amino Acid Catabolism: An Overlooked Area of Metabolism. Nutrients 2023, 15, 3378. [Google Scholar] [CrossRef] [PubMed]
- Peiró, P.S.; Lucas, M.O. Fisiología y Bioquímica en el ayuno. Med. Natur. 2007, 1, 10–19. [Google Scholar]
- Lukens, F.D.W. The Banting Memorial Lecture 1964 Insulin and Protein Metabolism. Diabetes 1964, 13, 451–461. [Google Scholar] [CrossRef]
- Yanagisawa, Y. How dietary amino acids and high protein diets influence insulin secretion. Physiol. Rep. 2023, 11, e15577. [Google Scholar] [CrossRef]
- Sun, P.; Wang, M.; Liu, Y.-X.; Li, L.; Chai, X.; Zheng, W.; Chen, S.; Zhu, X.; Zhao, S. High-fat diet-disturbed gut microbiota-colonocyte interactions contribute to dysregulating peripheral tryptophan-kynurenine metabolism. Microbiome 2023, 11, 154. [Google Scholar] [CrossRef]


| Type of Dietary Intervention | |||||||
|---|---|---|---|---|---|---|---|
| Variables | PF | PFF | |||||
| n | Mean | SD | n | Mean | SD | p-Value | |
| AGE (years) | 20 | 31.10 | 10.37 | 20 | 66.25 | 14.68 | <0.001 |
| BMI | 20 | 24.39 | 2.45 | 21 | 28.03 | 4.93 | <0.005 |
| FAT (%) | 20 | 29.06 | 4.30 | 19 | 33.47 | 7.46 | <0.029 |
| FFM (%) | 20 | 70.95 | 4.30 | 19 | 66.52 | 7.44 | <0.028 |
| WC (cm) | 20 | 73.38 | 4.75 | 20 | 85.25 | 13.71 | <0.001 |
| HR (bpm) | 20 | 67.10 | 6.36 | 20 | 75.30 | 13.03 | <0.016 |
| SBP (mmHg) | 20 | 113.50 | 11.83 | 20 | 118.90 | 14.80 | <0.210 |
| DBP (mmHg) | 20 | 70.00 | 7.36 | 20 | 72.65 | 9.14 | <0.319 |
| CHOL (mg/dL) | 20 | 178.67 | 24.26 | 21 | 206.99 | 27.67 | <0.001 |
| HDL (mg/dL) | 20 | 64.68 | 11.58 | 21 | 66.13 | 9.14 | <0.657 |
| LDL (mg/dL) | 20 | 103.85 | 26.42 | 21 | 124.52 | 30.29 | <0.025 |
| TG (mg/dL) | 20 | 53.27 | 11.43 | 21 | 81.86 | 18.74 | <0.001 |
| BASELINE | 55 D | 98 D | 132 D | |||||||||||||||||
|---|---|---|---|---|---|---|---|---|---|---|---|---|---|---|---|---|---|---|---|---|
| Type of Dietary Intervention | Type of Dietary Intervention | Type of Dietary Intervention | Type of Dietary Intervention | |||||||||||||||||
| PF | PFF | PF | PFF | PF | PFF | PF | PPF | |||||||||||||
| Mean | SD | Mean | SD | p-Value | Mean | SD | Mean | SD | p-Value | Mean | SD | Mean | SD | p-Value | Mean | SD | Mean | SD | p-Value | |
| Histidine | 22.38 | 10.07 | 30.19 | 9.77 | 0.017 | 8.04 | 2.03 | 16.15 | 5.37 | <0.001 | 36.46 | 33.27 | 8.48 | 2.19 | <0.001 | 57.32 | 17.99 | 44.44 | 8.54 | 0.009 |
| Isoleucine | 42.23 | 6.73 | 45.66 | 4.33 | 0.064 | 30.01 | 2.27 | 39.90 | 8.56 | <0.001 | 36.89 | 8.50 | 28.34 | 3.52 | <0.001 | 41.33 | 4.14 | 40.20 | 5.17 | 0.463 |
| Leucine | 60.38 | 10.45 | 66.21 | 9.47 | 0.072 | 36.96 | 3.34 | 55.91 | 12.06 | <0.001 | 43.66 | 12.62 | 34.81 | 5.99 | 0.040 | 57.14 | 8.51 | 50.74 | 6.68 | 0.014 |
| Lysine | 29.22 | 8.97 | 32.76 | 5.08 | 0.058 | 9.51 | 3.55 | 29.32 | 12.79 | <0.001 | 23.76 | 16.96 | 8.40 | 1.43 | <0.001 | 28.39 | 5.66 | 28.58 | 4.58 | 0.909 |
| Methionine | 4.14 | 11.56 | 1.14 | 0.54 | 0.253 | 0.44 | 0.45 | 1.37 | 1.29 | 0.009 | 1.47 | 1.69 | 0.19 | 0.42 | 0.006 | 4.11 | 1.81 | 3.20 | 0.87 | 0.059 |
| Phenylalanine | 50.10 | 13.45 | 55.38 | 10.28 | 0.171 | 32.95 | 6.13 | 45.47 | 10.54 | <0.001 | 35.79 | 14.00 | 27.08 | 6.43 | 0.023 | 51.33 | 6.95 | 48.48 | 5.57 | 0.157 |
| Threonine | 48.03 | 12.27 | 50.08 | 8.02 | 0.535 | 30.49 | 3.27 | 39.15 | 6.56 | <0.001 | 35.29 | 10.27 | 27.24 | 3.87 | 0.005 | 44.23 | 5.98 | 42.54 | 3.48 | 0.295 |
| Valine | 111.41 | 34.53 | 121.19 | 36.11 | 0.387 | 58.29 | 48.48 | 98.56 | 34.48 | <0.001 | 88.81 | 37.99 | 47.59 | 12.84 | <0.001 | 142.60 | 41.94 | 125.87 | 37.06 | 0.201 |
| Tryptophan | 57.97 | 8.74 | 62.73 | 9.99 | 0.117 | 42.80 | 6.72 | 62.97 | 13.46 | <0.001 | 53.39 | 21.38 | 33.83 | 5.36 | <0.001 | 72.80 | 9.95 | 58.85 | 8.06 | <0.001 |
| Alanine | 189.28 | 55.73 | 190.59 | 49.15 | 0.938 | 62.88 | 11.97 | 140.23 | 47.55 | <0.001 | 105.60 | 48.43 | 56.97 | 13.05 | <0.001 | 166.04 | 60.06 | 140.33 | 30.03 | 0.107 |
| Aspartate | 19.34 | 7.78 | 19.22 | 5.25 | 0.956 | 1.95 | 0.00 | 11.89 | 6.75 | <0.001 | 9.77 | 10.25 | 1.95 | 0.00 | 0.005 | 14.40 | 5.77 | 9.70 | 3.07 | 0.004 |
| Asparagine | 25.46 | 11.78 | 12.94 | 9.92 | 0.388 | 3.09 | 2.10 | 12.95 | 5.77 | <0.001 | 14.00 | 11.46 | 2.01 | 1.16 | <0.001 | 18.56 | 6.76 | 15.96 | 3.36 | 0.143 |
| Glutamate | 58.81 | 25.66 | 64.63 | 21.43 | 0.441 | 13.53 | 3.44 | 34.26 | 14.46 | <0.001 | 31.99 | 23.61 | 10.79 | 0.90 | <0.001 | 39.71 | 11.85 | 31.14 | 3.89 | 0.032 |
| Glutamine | 363.74 | 96.58 | 446.08 | 55.91 | 0.008 | 135.73 | 35.64 | 308.56 | 112.39 | <0.001 | 280.35 | 155.01 | 127.82 | 28.37 | <0.001 | 421.22 | 88.99 | 367.98 | 29.61 | 0.018 |
| Serine | 8.63 | 4.36 | 7.53 | 3.49 | 0.381 | 1.23 | 0.50 | 3.92 | 2.67 | <0.001 | 4.96 | 5.05 | 1.12 | 0.00 | 0.005 | 7.44 | 4.55 | 3.54 | 1.45 | <0.001 |
| Citrulline | 33.34 | 11.07 | 42.62 | 10.22 | 0.009 | 11.78 | 3.47 | 28.49 | 12.69 | <0.001 | 24.83 | 16.55 | 11.72 | 3.59 | <0.001 | 33.53 | 9.15 | 34.97 | 7.38 | 0.595 |
| Proline | 95.08 | 27.09 | 107.26 | 30.41 | 0.189 | 47.21 | 9.65 | 90.63 | 42.11 | <0.001 | 67.69 | 24.37 | 40.82 | 12.05 | <0.001 | 103.83 | 18.37 | 99.65 | 27.74 | 0.587 |
| Glycine | 86.68 | 21.12 | 84.13 | 44.32 | 0.817 | 28.47 | 5.91 | 58.33 | 18.31 | <0.001 | 50.44 | 25.51 | 27.62 | 4.20 | 0.003 | 79.99 | 21.65 | 64.98 | 10.57 | 0.012 |
| Arginine | 17.75 | 8.01 | 25.41 | 5.59 | 0.003 | 3.90 | 0.00 | 13.05 | 7.02 | <0.001 | 13.53 | 13.57 | 3.90 | 0.00 | 0.008 | 17.23 | 8.62 | 14.20 | 3.05 | 0.163 |
| Tyrosine | 19.03 | 3.55 | 18.21 | 7.89 | 0.676 | 8.79 | 2.76 | 13.68 | 9.26 | 0.008 | 20.14 | 15.92 | 8.44 | 3.42 | 0.014 | 24.95 | 4.16 | 29.63 | 7.63 | 0.029 |
| Cysteine | 1.23 | 0.06 | 1.31 | 0.05 | <0.001 | 1.12 | 0.01 | 1.27 | 0.10 | <0.001 | 1.21 | 0.10 | 1.11 | 0.01 | <0.001 | 1.37 | 0.25 | 1.16 | 0.02 | 0.008 |
| Creatine | 14.95 | 5.66 | 20.47 | 6.57 | 0.005 | 6.29 | 2.49 | 13.72 | 6.03 | <0.001 | 12.97 | 8.24 | 8.53 | 4.05 | 0.048 | 18.77 | 6.16 | 22.41 | 8.16 | 0.030 |
| Choline | 3.22 | 1.22 | 3.23 | 1.02 | 0.979 | 0.88 | 0.64 | 2.74 | 1.31 | <0.001 | 1.10 | 1.51 | 0.32 | 0.09 | 0.043 | 0.78 | 0.35 | 0.68 | 0.10 | 0.247 |
| Acetylcholine | 0.73 | 0.24 | 0.78 | 0.19 | 0.498 | 0.28 | 0.15 | 0.57 | 0.23 | <0.001 | 0.41 | 0.20 | 0.25 | 0.08 | 0.009 | 0.52 | 0.16 | 0.48 | 0.07 | 0.408 |
| ADMA | 0.33 | 0.13 | 0.41 | 0.12 | 0.058 | 0.05 | 0.03 | 0.21 | 0.11 | <0.001 | 0.16 | 0.14 | 0.06 | 0.04 | 0.004 | 0.24 | 0.06 | 0.20 | 0.03 | 0.022 |
| Kynurenine | 1.22 | 0.12 | 1.25 | 0.20 | 0.584 | 0.92 | 0.11 | 1.22 | 0.22 | <0.001 | 1.18 | 0.41 | 0.83 | 0.05 | 0.002 | 1.45 | 0.22 | 1.59 | 0.24 | 0.068 |
| Serotonin | 0.15 | 0.10 | 0.11 | 0.04 | 0.063 | 0.13 | 0.06 | 0.26 | 0.20 | 0.017 | 0.70 | 1.07 | 0.15 | 0.07 | 0.045 | 0.52 | 0.31 | 0.51 | 0.56 | 0.983 |
| EAA | 425.85 | 89.85 | 465.34 | 72.54 | 0.134 | 249.48 | 58.69 | 384.95 | 98.69 | <0.001 | 355.52 | 152.72 | 215.96 | 38.88 | <0.001 | 499.25 | 87.60 | 442.91 | 59.12 | 0.026 |
| NEAA | 918.34 | 249.56 | 1035.44 | 194.46 | 0.106 | 319.67 | 66.45 | 717.25 | 246.76 | <0.001 | 624.50 | 337.52 | 294.27 | 56.77 | 0.001 | 928.25 | 216.25 | 807.69 | 75.21 | 0.032 |
| BCAA | 214.03 | 49.49 | 233.06 | 45.86 | 0.215 | 125.26 | 49.15 | 194.36 | 52.85 | <0.001 | 169.35 | 58.43 | 110.74 | 21.69 | 0.001 | 241.06 | 52.04 | 216.81 | 46.36 | 0.138 |
| AAA | 127.08 | 19.46 | 136.32 | 22.74 | 0.176 | 84.53 | 12.62 | 122.12 | 21.59 | <0.001 | 109.32 | 48.96 | 69.34 | 12.82 | 0.003 | 149.07 | 18.25 | 135.82 | 13.31 | 0.017 |
Disclaimer/Publisher’s Note: The statements, opinions and data contained in all publications are solely those of the individual author(s) and contributor(s) and not of MDPI and/or the editor(s). MDPI and/or the editor(s) disclaim responsibility for any injury to people or property resulting from any ideas, methods, instructions or products referred to in the content. |
© 2025 by the authors. Licensee MDPI, Basel, Switzerland. This article is an open access article distributed under the terms and conditions of the Creative Commons Attribution (CC BY) license (https://creativecommons.org/licenses/by/4.0/).
Share and Cite
Chicharro, C.; Romero-Marco, P.; González, L.M.; González-Rodríguez, L.; Mateo-Vivaracho, L.; Guillamón, E.; Miguel-Tobal, F.; Bandrés, F.; Gervasini, G.; Fernández-Araque, A.; et al. Impact of Combined Macronutrient Diet on Amino Acids and Amines Plasma Levels. Nutrients 2025, 17, 1694. https://doi.org/10.3390/nu17101694
Chicharro C, Romero-Marco P, González LM, González-Rodríguez L, Mateo-Vivaracho L, Guillamón E, Miguel-Tobal F, Bandrés F, Gervasini G, Fernández-Araque A, et al. Impact of Combined Macronutrient Diet on Amino Acids and Amines Plasma Levels. Nutrients. 2025; 17(10):1694. https://doi.org/10.3390/nu17101694
Chicago/Turabian StyleChicharro, Celia, Patricia Romero-Marco, Luz M. González, Laura González-Rodríguez, Laura Mateo-Vivaracho, Eva Guillamón, Francisco Miguel-Tobal, Fernando Bandrés, Guillermo Gervasini, Ana Fernández-Araque, and et al. 2025. "Impact of Combined Macronutrient Diet on Amino Acids and Amines Plasma Levels" Nutrients 17, no. 10: 1694. https://doi.org/10.3390/nu17101694
APA StyleChicharro, C., Romero-Marco, P., González, L. M., González-Rodríguez, L., Mateo-Vivaracho, L., Guillamón, E., Miguel-Tobal, F., Bandrés, F., Gervasini, G., Fernández-Araque, A., & Verde, Z. (2025). Impact of Combined Macronutrient Diet on Amino Acids and Amines Plasma Levels. Nutrients, 17(10), 1694. https://doi.org/10.3390/nu17101694