
Plant-Based Diet Quality Is Associated with Cardiometabolic Health in Adults: A Cross-Sectional Analysis of the Australian Health Survey


Abstract
1. Introduction
2. Materials and Methods
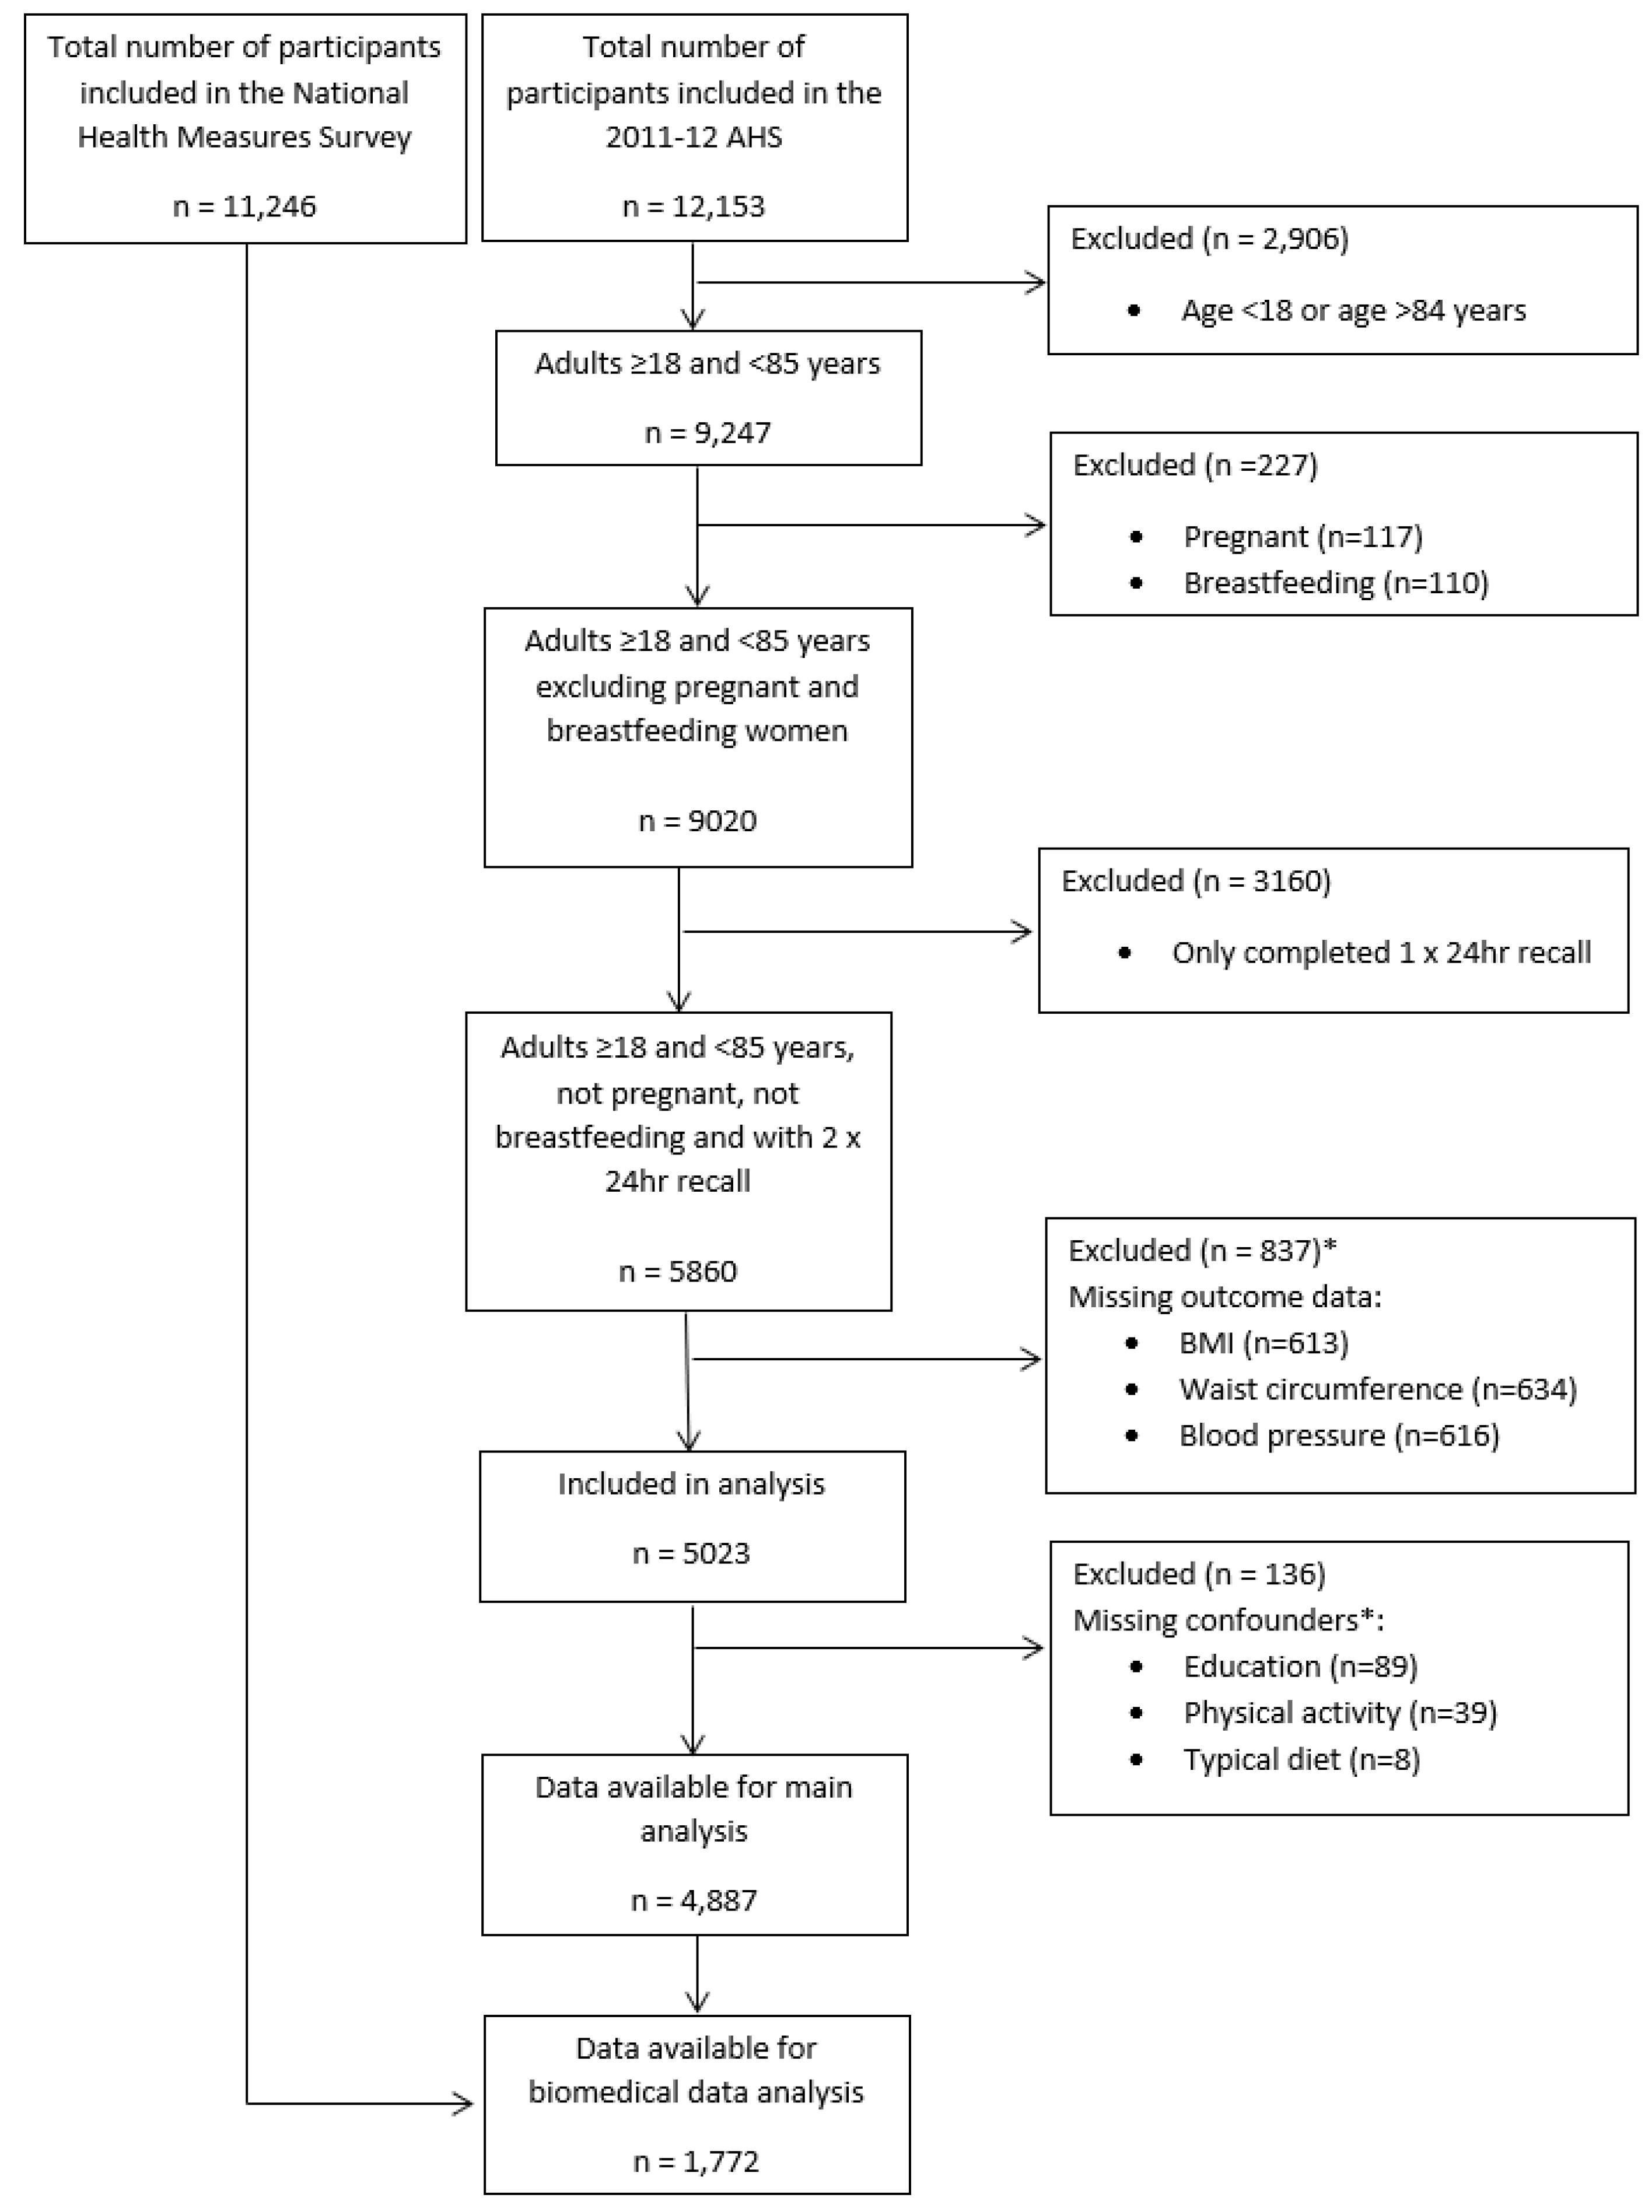
2.1. Study Population
2.2. Dietary Intake Assessment
2.3. Plant-Based Diet Quality
2.4. Outcomes
2.4.1. Body Mass Index and Waist Circumference
2.4.2. Blood Pressure
2.4.3. Lipid Profiles and Diabetes Status
2.5. Covariate Assessment
2.6. Data Access and Ethical Considerations
2.7. Statistical Analysis
3. Results
3.1. Plant-Based Diet Patterns and Outcomes
3.1.1. Weight Status, Waist Circumference, and Blood Pressure
3.1.2. Lipids and Glycaemic Control
4. Discussion
5. Conclusions
Supplementary Materials
Author Contributions
Funding
Institutional Review Board Statement
Informed Consent Statement
Data Availability Statement
Acknowledgments
Conflicts of Interest
Abbreviations
| AHS | Australian Health Survey |
| AUSNUT | Australian food and nutrient database |
| BMI | Body mass index |
| CATI | Computer assisted telephone interviewing |
| CVD | Cardiovascular disease |
| DAG | Directed acyclic graph |
| DASH | Dietary Approaches to Stop Hypertension |
| DGI | Dietary Guideline Index |
| HbA1C | Haemoglobin A1C |
| HDL | High-density lipoprotein |
| hPDI | Healthful plant-based-diet index |
| LDL | Low-density lipoprotein |
| MSM | Multiple source method |
| NNPAS | National Nutrition and Physical Activity Survey |
| OR | Odds ratio |
| PAL | Physical activity level |
| PDI | Overall plant-based diet index |
| STROBE-nut | Strengthening the Reporting of Observational Studies in Epidemiology–nutritional epidemiology |
| uPDI | Unhealthful plant-based diet index |
References
- Afshin, A.; Sur, P.J.; Fay, K.A.; Cornaby, L.; Ferrara, G.; Salama, J.S.; Mullany, E.C.; Abate, K.H.; Abbafati, C.; Abebe, Z.; et al. Health effects of dietary risks in 195 countries, 1990–2017: A systematic analysis for the Global Burden of Disease Study 2017. Lancet 2019, 393, 1958–1972. [Google Scholar] [CrossRef]
- Moreno, S.V.; Uddin, R.; McNaughton, S.A.; Livingstone, K.M.; George, E.S.; Siopis, G.; Maddison, R.; Huxley, R.R.; Islam, S.M.S. The burden of cardiovascular disease attributable to dietary risk factors in Australia between 1990 and 2019. PLoS ONE 2024, 19, e0295231. [Google Scholar] [CrossRef] [PubMed]
- Lichtenstein, A.H.; Appel, L.J.; Vadiveloo, M.; Hu, F.B.; Kris-Etherton, P.M.; Rebholz, C.M.; Sacks, F.M.; Thorndike, A.N.; Horn, L.V.; Wylie-Rosett, J. 2021 dietary guidance to improve cardiovascular health: A scientific statement from the American heart association. Circulation 2021, 144, e472–e487. [Google Scholar] [CrossRef]
- Zhang, B.; Pu, L.; Zhao, T.; Wang, L.; Shu, C.; Xu, S.; Sun, J.; Zhang, R.; Han, L. Global Burden of Cardiovascular Disease from 1990 to 2019 Attributable to Dietary Factors. J. Nutr. 2023, 153, 1730–1741. [Google Scholar] [CrossRef] [PubMed]
- Olstad, D.L.; Leech, R.M.; Livingstone, K.M.; Ball, K.; Thomas, B.; Potter, J.; Cleanthous, X.; Reynolds, R.; McNaughton, S.A. Are dietary inequalities among Australian adults changing? A nationally representative analysis of dietary change according to socioeconomic position between 1995 and 2011–13. Int. J. Behav. Nutr. Phys. Act. 2018, 15, 30. [Google Scholar] [CrossRef] [PubMed]
- Hemler, E.C.; Hu, F.B. Plant-Based Diets for Cardiovascular Disease Prevention: All Plant Foods Are Not Created Equal. Curr. Atheroscler. Rep. 2019, 21, 18. [Google Scholar] [CrossRef]
- Salehin, S.; Rasmussen, P.; Mai, S.; Mushtaq, M.; Agarwal, M.; Hasan, S.M.; Salehin, S.; Raja, M.; Gilani, S.; Khalife, W.I. Plant Based Diet and Its Effect on Cardiovascular Disease. Int. J. Environ. Res. Public Health 2023, 20, 3337. [Google Scholar] [CrossRef]
- Satija, A.; Hu, F.B. Plant-based diets and cardiovascular health. Trends Cardiovasc. Med. 2018, 28, 437–441. [Google Scholar] [CrossRef]
- Yu, E.; Malik, V.S.; Hu, F.B. Cardiovascular Disease Prevention by Diet Modification: JACC Health Promotion Series. J. Am. Coll. Cardiol. 2018, 72, 914–926. [Google Scholar] [CrossRef]
- Kent, G.; Kehoe, L.; Flynn, A.; Walton, J. Plant-based diets: A review of the definitions and nutritional role in the adult diet. Proc. Nutr. Soc. 2022, 81, 62–74. [Google Scholar] [CrossRef]
- Australian Government National Health and Medical Research Council Department of Health and Ageing. Eat for Health. In Australian Dietary Guidelines; Australian Government National Health and Medical Research Council Department of Health and Ageing: Canberra, Australia, 2013. [Google Scholar]
- Tapsell, L.C.; Neale, E.P.; Satija, A.; Hu, F.B. Foods, Nutrients, and Dietary Patterns: Interconnections and Implications for Dietary Guidelines. Adv. Nutr. Int. Rev. J. 2016, 7, 445–454. [Google Scholar] [CrossRef] [PubMed]
- Livingstone, K.M.; McNaughton, S.A. Diet quality is associated with obesity and hypertension in Australian adults: A cross sectional study. BMC Public Health 2016, 16, 1037. [Google Scholar] [CrossRef] [PubMed]
- Livingstone, K.M.; McNaughton, S.A. Association between diet quality, dietary patterns and cardiometabolic health in Australian adults: A cross-sectional study. Nutr. J. 2018, 17, 19. [Google Scholar] [CrossRef]
- Livingstone, K.; Olstad, D.; Leech, R.; Ball, K.; Meertens, B.; Potter, J.; Cleanthous, X.; Reynolds, R.; McNaughton, S. Socioeconomic Inequities in Diet Quality and Nutrient Intakes among Australian Adults: Findings from a Nationally Representative Cross-Sectional Study. Nutrients 2017, 9, 1092. [Google Scholar] [CrossRef]
- Marchese, L.E.; McNaughton, S.A.; Hendrie, G.A.; Wingrove, K.; Dickinson, K.M.; Livingstone, K.M. A scoping review of approaches used to develop plant-based diet quality indices. Curr. Dev. Nutr. 2023, 7, 100061. [Google Scholar] [CrossRef]
- Martínez-González, M.A.; Sánchez-Tainta, A.; Corella, D.; Salas-Salvadó, J.; Ros, E.; Arós, F.; Gómez-Gracia, E.; Fiol, M.; Lamuela-Raventós, R.M.; Schröder, H.; et al. A provegetarian food pattern and reduction in total mortality in the Prevención con Dieta Mediterránea (PREDIMED) study. Am. J. Clin. Nutr. 2014, 100, 320S–328S. [Google Scholar] [CrossRef] [PubMed]
- Satija, A.; Bhupathiraju, S.N.; Spiegelman, D.; Chiuve, S.E.; Manson, J.E.; Willett, W.; Rexrode, K.M.; Rimm, E.B.; Hu, F.B. Healthful and Unhealthful Plant-Based Diets and the Risk of Coronary Heart Disease in U.S. Adults. J. Am. Coll. Cardiol. 2017, 70, 411–422. [Google Scholar] [CrossRef]
- Willett, W.; Rockström, J.; Loken, B.; Springmann, M.; Lang, T.; Vermeulen, S.; Garnett, T.; Tilman, D.; DeClerck, F.; Wood, A.; et al. Food in the Anthropocene: The EAT-Lancet Commission on healthy diets from sustainable food systems. Lancet 2019, 393, 447–492. [Google Scholar] [CrossRef]
- Baden, M.Y.; Satija, A.; Hu, F.B.; Huang, T. Change in Plant-Based Diet Quality Is Associated with Changes in Plasma Adiposity-Associated Biomarker Concentrations in Women. J. Nutr. 2019, 149, 676–686. [Google Scholar] [CrossRef]
- Schorr, K.A.; Agayn, V.; de Groot, L.C.P.G.M.; Slagboom, P.E.; Beekman, M. A plant-based diet index to study the relation between diet and disease risk among adults: A narrative review. J. Nutr. Health Aging 2024, 28, 100272. [Google Scholar] [CrossRef]
- Stanford, J.; Stefoska-Needham, A.; Lambert, K.; Batterham, M.J.; Charlton, K. Association between plant-based diet quality and chronic kidney disease in Australian adults. Public Health Nutr. 2024, 27, e142. [Google Scholar] [CrossRef]
- Australian Bureau of Statistics. 4363.0.55.001-Australian Health Survey: Users’ Guide, 2011–2013. Available online: https://www.abs.gov.au/ausstats/abs@.nsf/Lookup/DE1E5B32B280E24FCA257B8D00229E7A?opendocument (accessed on 1 June 2020).
- Australian Bureau of Statistics. About the National Nutrition and Physical Activity Survey; Australian Bureau of Statistics: Canberra, Australia, 2015. [Google Scholar]
- Lachat, C.; Hawwash, D.; Ocke, M.C.; Berg, C.; Forsum, E.; Hornell, A.; Larsson, C.L.; Sonestedt, E.; Wirfalt, E.; Akesson, A.; et al. Strengthening the Reporting of Observational Studies in Epidemiology-nutritional epidemiology (STROBE-nut): An extension of the STROBE statement. Nutr. Bull. 2016, 41, 240–251. [Google Scholar] [CrossRef] [PubMed]
- Food Standards Australia New Zealand. AUSNUT 2011-13: Australian Food, Supplement and Nutrient Database. Available online: https://www.foodstandards.gov.au/science-data/food-composition-databases/ausnut-2011-13/food-nutrient-database (accessed on 12 December 2021).
- Satija, A.; Bhupathiraju, S.N.; Rimm, E.B.; Spiegelman, D.; Chiuve, S.E.; Borgi, L.; Willett, W.C.; Manson, J.E.; Sun, Q.; Hu, F.B. Plant-Based Dietary Patterns and Incidence of Type 2 Diabetes in US Men and Women: Results from Three Prospective Cohort Studies. PLoS Med. 2016, 13, e1002039. [Google Scholar] [CrossRef] [PubMed]
- O’Sullivan, T.A.; Wilson, C.; Hafekost, K.; Mitrou, F.; Lawrence, D.; Food Standards Australia New Zealand. Narrative Review: The Relationship Between Dietary Trans-Fatty Acids and Adverse Health Outcomes; FSANZ: Canberra, Australia, 2014.
- European Food Consumption Validation. Multiple Source Method (MSM) for Estimating Usual Dietary Intake from Short-Term Measurement Data. User Guide. Available online: https://msm.dife.de/static/MSM_UserGuide.pdf (accessed on 3 March 2020).
- World Health Organisation. Waist Circumference and Waist-Hip Ratio: Report of a WHO Expert Consultation; World Health Organisation: Geneva, Switzerland, 2008. [Google Scholar]
- National Heart Foundation of Australia. Guideline for the Diagnosis and Management of Hypertension in Adults-2016; National Heart Foundation of Australia: Melbourne, Australia, 2016. [Google Scholar]
- Whelton, P.K.; Carey, R.M.; Aronow, W.S.; Casey, D.E.; Collins, K.J.; Dennison Himmelfarb, C.; DePalma, S.M.; Gidding, S.; Jamerson, K.A.; Jones, D.W.; et al. 2017 ACC/AHA/AAPA/ABC/ACPM/AGS/APhA/ASH/ASPC/NMA/PCNA Guideline for the Prevention, Detection, Evaluation, and Management of High Blood Pressure in Adults: Executive Summary: A Report of the American College of Cardiology/American Heart Association Task Force on Clinical Practice Guidelines. Hypertension 2018, 71, 1269–1324. [Google Scholar] [CrossRef]
- Huang, T.T.; Roberts, S.B.; Howarth, N.C.; McCrory, M.A. Effect of screening out implausible energy intake reports on relationships between diet and BMI. Obes. Res. 2005, 13, 1205–1217. [Google Scholar] [CrossRef]
- Benatar, J.R.; Stewart, R.A.H. Cardiometabolic risk factors in vegans; A meta-analysis of observational studies. PLoS ONE 2018, 13, e0209086. [Google Scholar] [CrossRef] [PubMed]
- Chen, Z.; Schoufour, J.D.; Rivadeneira, F.; Lamballais, S.; Ikram, M.A.; Franco, O.H.; Voortman, T. Plant-based Diet and Adiposity Over Time in a Middle-aged and Elderly Population: The Rotterdam Study. Epidemiology 2019, 30, 303–310. [Google Scholar] [CrossRef]
- Cacau, L.T.; Bensenor, I.M.; Goulart, A.C.; Cardoso, L.O.; Lotufo, P.A.; Moreno, L.A.; Marchioni, D.M. Adherence to the planetary health diet index and obesity indicators in the Brazilian longitudinal study of adult ealth (ELSA-Brasil). Nutrients 2021, 13, 3691. [Google Scholar] [CrossRef]
- Angulo, E.; Stern, D.; Castellanos-Gutiérrez, A.; Monge, A.; Lajous, M.; Bromage, S.; Fung, T.T.; Li, Y.; Bhupathiraju, S.N.; Deitchler, M.; et al. Changes in the Global Diet Quality Score, Weight, and Waist Circumference in Mexican Women. J. Nutr. 2021, 151, 152S–161S. [Google Scholar] [CrossRef]
- Roswall, N.; Ängquist, L.; Ahluwalia, T.S.; Romaguera, D.; Larsen, S.C.; Østergaard, J.N.; Halkjaer, J.; Vimaleswaran, K.S.; Wareham, N.J.; Bendinelli, B.; et al. Association between Mediterranean and Nordic diet scores and changes in weight and waist circumference: Influence of FTO and TCF7L2 loci. Am. J. Clin. Nutr. 2014, 100, 1188–1197. [Google Scholar] [CrossRef]
- Chew, H.S.J.; Heng, F.K.X.; Tien, S.A.; Thian, J.Y.; Chou, H.S.; Loong, S.S.E.; Ang, W.H.D.; Chew, N.W.S.; Lo, K.-H.K. Effects of Plant-Based Diets on Anthropometric and Cardiometabolic Markers in Adults: An Umbrella Review. Nutrients 2023, 15, 2331. [Google Scholar] [CrossRef]
- Choi, Y.; Larson, N.; Gallaher, D.D.; Odegaard, A.O.; Rana, J.S.; Shikany, J.M.; Steffen, L.M.; Jacobs, D.R., Jr. A Shift Toward a Plant-Centered Diet From Young to Middle Adulthood and Subsequent Risk of Type 2 Diabetes and Weight Gain: The Coronary Artery Risk Development in Young Adults (CARDIA) Study. Diabetes Care 2020, 43, 2796–2803. [Google Scholar] [CrossRef] [PubMed]
- Pagliai, G.; Dinu, M.; Madarena, M.P.; Bonaccio, M.; Iacoviello, L.; Sofi, F. Consumption of ultra-processed foods and health status: A systematic review and meta-analysis. Br. J. Nutr. 2021, 125, 308–318. [Google Scholar] [CrossRef]
- Kim, H.; Rebholz, C.M.; Garcia-Larsen, V.; Steffen, L.M.; Coresh, J.; Caulfield, L.E. Operational Differences in Plant-Based Diet Indices Affect the Ability to Detect Associations with Incident Hypertension in Middle-Aged US Adults. J. Nutr. 2020, 150, 842–850. [Google Scholar] [CrossRef] [PubMed]
- Laouali, N.; Shah, S.; MacDonald, C.-J.; Mahamat-Saleh, Y.; El Fatouhi, D.; Mancini, F.; Fagherazzi, G.; Boutron-Ruault, M.-C. BMI in the Associations of Plant-Based Diets with Type 2 Diabetes and Hypertension Risks in Women: The E3N Prospective Cohort Study. J. Nutr. 2021, 151, 2731–2740. [Google Scholar] [CrossRef] [PubMed]
- Kim, J.; Kim, H.; Giovannucci, E.L. Quality of plant-based diets and risk of hypertension: A Korean genome and examination study. Eur. J. Nutr. 2021, 60, 3841–3851. [Google Scholar] [CrossRef]
- Onwuzo, C.; Olukorode, J.O.; Omokore, O.A.; Odunaike, O.S.; Omiko, R.; Osaghae, O.W.; Sange, W.; Orimoloye, D.A.; Kristilere, H.O.; Addeh, E.; et al. DASH Diet: A Review of Its Scientifically Proven Hypertension Reduction and Health Benefits. Cureus 2023, 15, e44692. [Google Scholar] [CrossRef]
- De Pergola, G.; D’Alessandro, A. Influence of Mediterranean Diet on Blood Pressure. Nutrients 2018, 10, 1700. [Google Scholar] [CrossRef]
- Jenkins, D.J.A.; Jones, P.J.; Frohlich, J.; Lamarche, B.; Ireland, C.; Nishi, S.K.; Srichaikul, K.; Galange, P.; Pellini, C.; Faulkner, D.; et al. The effect of a dietary portfolio compared to a DASH-type diet on blood pressure. Nutr. Metab. Cardiovasc. Dis. 2015, 25, 1132–1139. [Google Scholar] [CrossRef]
- Altawili, A.A.; Altawili, M.; Alwadai, A.M.; Alahmadi, A.S.; Alshehri, A.M.A.; Muyini, B.H.; Alshwwaf, A.R.; Almarzooq, A.M.; Alqarni, A.H.A.; Alruwili, Z.A.L.; et al. An Exploration of Dietary Strategies for Hypertension Management: A Narrative Review. Cureus 2023, 15, e50130. [Google Scholar] [CrossRef]
- Allen, T.S.; Bhatia, H.S.; Wood, A.C.; Momin, S.R.; Allison, M.A. State-of-the-Art Review: Evidence on Red Meat Consumption and Hypertension Outcomes. Am. J. Hypertens. 2022, 35, 679–687. [Google Scholar] [CrossRef]
- Elliott, P.S.; Kharaty, S.S.; Phillips, C.M. Plant-Based Diets and Lipid, Lipoprotein, and Inflammatory Biomarkers of Cardiovascular Disease: A Review of Observational and Interventional Studies. Nutrients 2022, 14, 5371. [Google Scholar] [CrossRef] [PubMed]
- Nikparast, A.; Mirzaei, P.; Tadayoni, Z.S.; Asghari, G. The Association Between Overall, Healthy, and Unhealthy Plant-Based Diet Index and Risk of Prediabetes and Type 2 Diabetes Mellitus: A Systematic Review and Dose-Response Meta-Analysis of Prospective Studies. Nutr. Rev. 2024, 83, e157–e177. [Google Scholar] [CrossRef] [PubMed]
- del Carmen Fernández-Fígares Jiménez, M. Plant foods, healthy plant-based diets, and type 2 diabetes: A review of the evidence. Nutr. Rev. 2023, 82, 929–948. [Google Scholar] [CrossRef] [PubMed]
- Whiteley, C.; Benton, F.; Matwiejczyk, L.; Luscombe-Marsh, N. Determining Dietary Patterns to Recommend for Type 2 Diabetes: An Umbrella Review. Nutrients 2023, 15, 861. [Google Scholar] [CrossRef]
- Qian, F.; Liu, G.; Hu, F.B.; Bhupathiraju, S.N.; Sun, Q. Association Between Plant-Based Dietary Patterns and Risk of Type 2 Diabetes: A Systematic Review and Meta-analysis. JAMA Intern. Med. 2019, 179, 1335–1344. [Google Scholar] [CrossRef]
- Anastasios, T.; Triece, T.; Isaura, A.-B. Effectiveness of plant-based diets in promoting well-being in the management of type 2 diabetes: A systematic review. BMJ Open Diabetes Res. Care 2018, 6, e000534. [Google Scholar] [CrossRef]
- Australian Bureau of Statistics. 4324.0.55.001-Microdata: Australian Health Survey, National Health Survey, 2011–2012. Using the expanded CURF. Available online: https://www.abs.gov.au/AUSSTATS/abs@.nsf/Lookup/4324.0.55.001Main+Features502011-12?OpenDocument (accessed on 3 March 2020).
- Brooker, P.G.; Hendrie, G.A.; Anastasiou, K.; Colgrave, M.L. The range and nutrient profile of alternative protein products sold in Australian supermarkets between 2014 and 2021. Int. J. Food Sci. Nutr. 2022, 73, 1067–1079. [Google Scholar] [CrossRef]
- Marchese, L.E.; Hendrie, G.A.; McNaughton, S.A.; Brooker, P.G.; Dickinson, K.M.; Livingstone, K.M. Comparison of the nutritional composition of supermarket plant-based meat and dairy alternatives with the Australian Food Composition Database. J. Food Compos. Anal. 2024, 129, 106017. [Google Scholar] [CrossRef]

| PDI | hPDI | uPDI | All | |||||||
|---|---|---|---|---|---|---|---|---|---|---|
| T1 (n = 1845) | T2 (n = 1561) | T3 (n = 1481) | T1 (n = 1731) | T2 (n = 1689) | T3 (n = 1467) | T1 (n = 1705) | T2 (n = 1738) | T3 (n = 1444) | (n = 4887) | |
| Age, years, mean (95%CI) | 45.2 (44.2, 46.3) | 45.0 (43.9, 46.1) | 44.9 (43.9, 46.0) | 38.3 (37.4, 39.2) | 47.1 (46.1, 48.1) | 51.8 (50.7, 52.9) | 54.7 (53.6, 55.8) | 45.6 (44.7, 46.6) | 35.5 (34.5, 36.6) | 45.1 (44.7, 45.4) |
| Male sex | 952 (58.1) | 706 (48.9) | 687 (47.7) | 1272 (77.4) | 756 (46.5) | 317 (24.1) | 598 (36.7) | 806 (51.0) | 941 (67.0) | 2345 (52.0) |
| Body mass index, kg/m2, mean (95%CI) | 27.6 (27.2, 28.1) | 27.2 (26.8, 27.6) | 26.8 (26.4, 27.3) | 26.9 (26.6, 27.3) | 27.6 (27.2, 27.9) | 27.3 (26.8, 27.7) | 27.5 (27.1, 27.9) | 27.4 (27.0, 27.8) | 26.9 (26.4, 27.3) | 27.2 (27.0, 27.5) |
| Weight status | ||||||||||
| Underweight/Healthy weight | 615 (35.9) | 529 (38.6) | 577 (40.8) | 610 (39.8) | 570 (36.8) | 541 (38.0) | 603 (36.1) | 577 (37.1) | 541 (41.6) | 1721 (38.3) |
| Overweight/Obesity | 1230 (64.1) | 1032 (61.4) | 904 (59.2) | 1121 (60.2) | 1119 (63.2) | 926 (62.0) | 1102 (63.9) | 1161 (62.9) | 903 (58.4) | 3166 (61.7) |
| Education | ||||||||||
| No non-school qualification | 771 (41.9) | 585 (38.6) | 459 (32.1) | 642 (39.3) | 624 (36.9) | 549 (36.9) | 637 (37.0) | 626 (35.4) | 552 (41.0) | 1815 (37.8) |
| Diploma/Certificate | 638 (34.5) | 555 (34.8) | 524 (34.9) | 671 (36.6) | 589 (35.1) | 457 (31.8) | 559 (32.8) | 620 (36.1) | 538 (35.1) | 1717 (34.7) |
| Tertiary | 436 (23.5) | 421 (26.6) | 498 (33.0) | 418 (24.1) | 476 (27.9) | 461 (31.3) | 509 (30.1) | 492 (28.5) | 354 (23.9) | 1355 (27.4) |
| Physical activity a | ||||||||||
| Did not meet guidelines | 1101 (57.7) | 861 (54.8) | 738 (49.0) | 1001 (56.9) | 975 (55.6) | 724 (48.5) | 898 (53.8) | 956 (53.0) | 846 (55.4) | 2700 (54.1) |
| Met guidelines | 744 (42.3) | 700 (45.2) | 743 (51.0) | 730 (43.1) | 714 (44.4) | 743 (51.5) | 807 (46.2) | 782 (47.0) | 598 (44.6) | 2187 (45.9) |
| Smoking status | ||||||||||
| Current smoker | 377 (20.5) | 293 (18.1) | 181 (11.0) | 384 (20.7) | 299 (16.0) | 168 (12.5) | 170 (9.7) | 320 (16.3) | 361 (23.9) | 851 (16.8) |
| Ex-smoker | 601 (28.6) | 541 (32.7) | 496 (32.3) | 531 (25.7) | 576 (32.8) | 531 (36.1) | 684 (39.2) | 580 (32.6) | 374 (21.9) | 1638 (31.0) |
| Never smoked | 867 (50.9) | 727 (49.2) | 804 (56.8) | 816 (53.6) | 814 (51.2) | 768 (51.4) | 851 (51.1) | 838 (51.1) | 709 (54.2) | 2398 (52.2) |
| Dietary intake | ||||||||||
| More than usual | 176 (9.7) | 152 (8.8) | 162 (13.0) | 179 (10.4) | 183 (10.4) | 128 (10.5) | 182 (11.4) | 183 (10.5) | 125 (9.5) | 490 (10.5) |
| Usual | 1200 (63.0) | 1074 (67.2) | 1046 67.0) | 1112 (62.5) | 1153 (65.9) | 1055 (69.5) | 1254 (72.8) | 1183 (65.6) | 883 (59.0) | 3320 (65.6) |
| Less than usual | 469 (27.3) | 335 (23.9) | 273 (20.0) | 440 (27.1) | 353 (23.7) | 284 (20.0) | 269 (15.9) | 372 (23.9) | 436 (31.5) | 1077 (23.9) |
| Misreporting b | ||||||||||
| Over-reporting | 61 (4.4) | 65 (4.7) | 99 (5.9) | 95 (6.0) | 71 (4.4) | 59 (4.2) | 103 (6.0) | 72 (4.9) | 50 (4.1) | 225 (5.0) |
| Plausible | 1288 (70.2) | 1153 (72.3) | 1155 (79.3) | 1338 (78.7) | 1202 (69.3) | 1056 (72.1) | 1337 (79.5) | 1279 (72.7) | 980 (69.2) | 3596 (73.7) |
| Under-reporting | 496 (25.4) | 343 (23.0) | 227 (14.9) | 298 (15.3) | 416 (26.3) | 352 (23.7) | 265 (14.6) | 387 (22.3) | 414 (26.7) | 1066 (21.4) |
| Consumed red wine | ||||||||||
| No | 1502 (82.5) | 1292 (84.0) | 1228 (84.6) | 1390 (83.5) | 1386 (83.4) | 1246 (84.1) | 1396 (81.5) | 1414 (82.3) | 1212 (86.9) | 4022 (83.6) |
| Yes | 343 (17.5) | 269 (16.0) | 253 (15.4) | 341 (16.5) | 303 (16.6) | 221 (15.9) | 309 (18.5) | 324 (17.7) | 232 (13.1) | 865 (16.4) |
| n (%) a | PDI | hPDI | uPDI | |||||||
|---|---|---|---|---|---|---|---|---|---|---|
| Mean PDI (95%CI) | Unadjusted OR (95%CI) | Adjusted OR b (95%CI) | Mean hPDI (95%CI) | Unadjusted OR (95%CI) | Adjusted OR b (95%CI) | Mean uPDI (95%CI) | Unadjusted OR (95%CI) | Adjusted OR b (95%CI) | ||
| Weight status c | ||||||||||
| Underweight/ Normal weight | 1721 (38.3%) | 54.0 (53.5, 54.4) | Reference | Reference | 52.7 (52.1, 53.3) | Reference | Reference | 56.0 (55.5, 56.6) | Reference | Reference |
| Overweight/ Obesity | 3166 (61.7%) | 53.3 (53.0, 53.6) | 0.98 (0.97, 1.00) | 1.00 (0.98, 1.01) | 52.9 (52.5, 53.2) | 1.00 (0.99, 1.02) | 0.98 (0.96, 1.00) | 55.1 (54.7, 55.5) | 0.98 (0.97, 1.00) | 1.00 (0.98, 1.02) |
| Waist circumference d | ||||||||||
| Not at risk | 1644 (38.1%) | 53.7 (53.2, 54.1) | Reference | Reference | 51.5 (51.0, 52.1) | Reference | Reference | 56.8 (56.3, 57.3) | Reference | Reference |
| Increased/ Substantially increased risk | 3243 (61.9%) | 53.5 (53.2, 53.8) | 1.00 (0.98, 1.01) | 1.01 (0.99, 1.03) | 53.6 (53.3, 53.9) | 1.03 (1.02, 1.05) | 0.98 (0.96, 0.99) | 54.6 (54.2, 55.0) | 0.96 (0.95, 0.97) | 1.00 (0.99, 1.02) |
| Blood pressure e | ||||||||||
| Normal | 1942 (42.6%) | 54.1 (53.7, 54.4) | Reference | Reference | 52.7 (52.3, 53.1) | Reference | Reference | 56.2 (55.7, 56.8) | Reference | Reference |
| High | 2945 (57.4%) | 53.2 (52.8, 53.6) | 0.98 (0.96, 0.99) | 0.99 (0.97, 1.00) | 52.9 (52.5, 53.2) | 1.00 (0.99, 1.01) | 0.99 (0.98, 1.01) | 54.9 (54.4, 55.3) | 0.98 (0.96, 0.99) | 1.01 (0.99, 1.03) |
| Hypertension f | ||||||||||
| Not hypertensive | 3789 (79.2%) | 53.8 (53.5, 54.0) | Reference | Reference | 52.6 (52.3, 52.9) | Reference | Reference | 55.8 (55.4, 56.1) | Reference | Reference |
| Hypertensive | 1098 (20.8%) | 52.9 (52.3, 53.4) | 0.98 (0.96, 0.99) | 0.98 (0.96, 1.00) | 53.5 (52.9, 54.2) | 1.02 (1.00, 1.03) | 0.99 (0.96, 1.01) | 54.3 (53.6, 54.9) | 0.97 (0.96, 0.99) | 1.02 (1.00, 1.04) |
| n (%) a | PDI | hPDI | uPDI | |||||||
|---|---|---|---|---|---|---|---|---|---|---|
| Mean PDI (95%CI) | Unadjusted OR (95%CI) | Adjusted OR b (95%CI) | Mean hPDI (95%CI) | Unadjusted OR (95%CI) | Adjusted OR b (95%CI) | Mean uPDI (95%CI) | Unadjusted OR (95%CI) | Adjusted OR b (95%CI) | ||
| Total cholesterol status c | ||||||||||
| Normal | 1022 (66.4%) | 53.7 (53.1, 54.2) | Reference | Reference | 51.9 (51.1, 52.7) | Reference | Reference | 56.8 (56.0, 57.6) | Reference | Reference |
| Abnormal | 750 (33.6%) | 53.6 (53.0, 54.2) | 1.00 (0.97, 1.02) | 1.00 (0.98, 1.03) | 54.4 (53.4, 55.4) | 1.04 (1.02, 1.06) | 1.01 (0.99, 1.04) | 53.5 (52.6, 54.5) | 0.94 (0.92, 0.97) | 0.98 (0.95, 1.00) |
| HDL cholesterol status d | ||||||||||
| Normal | 1399 (79.3%) | 53.6 (53.1, 54.0) | Reference | Reference | 52.8 (52.1, 53.5) | Reference | Reference | 55.6 (54.9, 56.4) | Reference | Reference |
| Abnormal | 373 (20.7%) | 53.9 (52.9, 54.9) | 1.01 (0.98, 1.04) | 1.01 (0.98, 1.04) | 52.5 (51.2, 53.9) | 1.00 (0.97, 1.02) | 0.97 (0.94, 1.00) | 55.9 (55.0, 56.9) | 1.01 (0.98, 1.03) | 1.01 (0.98, 1.04) |
| Fasting LDL cholesterol status e | ||||||||||
| Normal | 1032 (65.1%) | 53.6 (53.1, 54.2) | Reference | Reference | 52.1 (51.4, 52.8) | Reference | Reference | 56.7 (55.9, 57.5) | Reference | Reference |
| Abnormal | 740 (34.9%) | 53.7 (53.0, 54.3) | 1.00 (0.98, 1.03) | 1.01 (0.98, 1.04) | 53.9 (52.9, 54.9) | 1.03 (1.01, 1.05) | 1.01 (0.98, 1.04) | 53.8 (52.9, 54.7) | 0.95 (0.93, 0.97) | 0.98 (0.96, 1.01) |
| Fasting triglycerides status f | ||||||||||
| Normal | 1543 (88.9%) | 53.7 (53.2, 54.1) | Reference | Reference | 52.8 (52.2, 53.5) | Reference | Reference | 55.7 (55.0, 56.3) | Reference | Reference |
| Abnormal | 229 (11.1%) | 53.5 (52.3, 54.7) | 0.99 (0.96, 1.03) | 1.02 (0.97, 1.06) | 51.9 (49.9, 53.9) | 0.98 (0.95, 1.02) | 1.00 (0.96, 1.04) | 56.0 (55.0, 56.9) | 1.01 (0.98, 1.03) | 1.00 (0.97, 1.04) |
| Dyslipidaemia g | ||||||||||
| No | 671 (45.2%) | 53.5 (52.7, 54.2) | Reference | Reference | 51.9 (50.9, 52.9) | Reference | Reference | 57.3 (56.2, 58.3) | Reference | Reference |
| Yes | 1101 (54.8%) | 53.8 (53.2, 54.4) | 1.01 (0.98, 1.04) | 1.01 (0.98, 1.05) | 53.4 (52.6, 54.2) | 1.03 (1.00, 1.05) | 1.00 (0.96, 1.03) | 54.4 (53.7, 55.1) | 0.95 (0.93, 0.97) | 0.98 (0.95, 1.01) |
| Diabetes status (based on glucose) h | ||||||||||
| No | 1690 (96.4%) | 53.7 (53.3, 54.0) | Reference | Reference | 52.7 (52.1, 53.3) | Reference | Reference | 55.7 (55.1, 56.3) | Reference | Reference |
| Yes or impaired fasting plasma glucose | 82 (3.6%) | 53.1 (50.7, 55.6) | 0.98 (0.92, 1.06) | 1.00 (0.94, 1.07) | 52.6 (49.4, 55.8) | 1.00 (0.94, 1.05) | 1.00 (0.94, 1.07) | 54.5 (52.5, 56.6) | 0.98 (0.94, 1.02) | 1.01 (0.95, 1.08) |
| Diabetes status (based on HbA1c) i | ||||||||||
| No | 1674 (95.0%) | 53.7 (53.3, 54.1) | Reference | Reference | 52.6 (52.0, 53.2) | Reference | Reference | 55.8 (55.2, 56.4) | Reference | Reference |
| Yes or at risk of diabetes | 98 (5.0%) | 53.0 (50.8, 55.2) | 0.98 (0.92, 1.04) | 0.99 (0.93, 1.05) | 54.7 (52.7, 56.7) | 1.03 (1.00, 1.07) | 1.02 (0.97, 1.07) | 53.5 (51.9, 55.1) | 0.96 (0.93, 0.99) | 1.01 (0.97, 1.06) |
Disclaimer/Publisher’s Note: The statements, opinions and data contained in all publications are solely those of the individual author(s) and contributor(s) and not of MDPI and/or the editor(s). MDPI and/or the editor(s) disclaim responsibility for any injury to people or property resulting from any ideas, methods, instructions or products referred to in the content. |
© 2025 by the authors. Licensee MDPI, Basel, Switzerland. This article is an open access article distributed under the terms and conditions of the Creative Commons Attribution (CC BY) license (https://creativecommons.org/licenses/by/4.0/).
Share and Cite
Dickinson, K.M.; Marchese, L.E.; Livingstone, K.M. Plant-Based Diet Quality Is Associated with Cardiometabolic Health in Adults: A Cross-Sectional Analysis of the Australian Health Survey. Nutrients 2025, 17, 1621. https://doi.org/10.3390/nu17101621
Dickinson KM, Marchese LE, Livingstone KM. Plant-Based Diet Quality Is Associated with Cardiometabolic Health in Adults: A Cross-Sectional Analysis of the Australian Health Survey. Nutrients. 2025; 17(10):1621. https://doi.org/10.3390/nu17101621
Chicago/Turabian StyleDickinson, Kacie M., Laura E. Marchese, and Katherine M. Livingstone. 2025. "Plant-Based Diet Quality Is Associated with Cardiometabolic Health in Adults: A Cross-Sectional Analysis of the Australian Health Survey" Nutrients 17, no. 10: 1621. https://doi.org/10.3390/nu17101621
APA StyleDickinson, K. M., Marchese, L. E., & Livingstone, K. M. (2025). Plant-Based Diet Quality Is Associated with Cardiometabolic Health in Adults: A Cross-Sectional Analysis of the Australian Health Survey. Nutrients, 17(10), 1621. https://doi.org/10.3390/nu17101621