
Triglyceride to HDL Cholesterol Ratio for the Identification of MASLD in Obesity: A Liver Biopsy-Based Case-Control Study

 , , , ,
Abstract
1. Introduction
2. Methods
2.1. Study Design and Participants
2.2. Anthropometric and Biochemical Evaluation
2.3. Liver Biopsies Collection and Processing
2.4. Statistical Analysis
3. Results
3.1. Characteristics of the Study Population
3.2. Correlations between the TG/HDL-C Ratio and Histopathological Parameters in Subjects with MASLD and Obesity
3.3. Accuracy of TG/HDL-C Ratio to Detect MASLD in Patients with Obesity
4. Discussion
5. Conclusions
Supplementary Materials
Author Contributions
Funding
Institutional Review Board Statement
Informed Consent Statement
Data Availability Statement
Acknowledgments
Conflicts of Interest
References
- Riazi, K.; Azhari, H.; Charette, J.H.; Underwood, F.E.; King, J.A.; Afshar, E.E.; Swain, M.G.; Congly, S.E.; Kaplan, G.G.; Shaheen, A.-A. The prevalence and incidence of NAFLD worldwide: A systematic review and meta-analysis. Lancet Gastroenterol. Hepatol. 2022, 7, 851–861. [Google Scholar] [CrossRef]
- Wang, X.J.; Malhi, H. Nonalcoholic Fatty Liver Disease. Ann. Intern. Med. 2018, 169, ITC65. [Google Scholar] [CrossRef] [PubMed]
- Younossi, Z.M.; Blissett, D.; Blissett, R.; Henry, L.; Stepanova, M.; Younossi, Y.; Racila, A.; Hunt, S.; Beckerman, R. The economic and clinical burden of nonalcoholic fatty liver disease in the United States and Europe. Hepatology 2016, 64, 1577–1586. [Google Scholar] [CrossRef] [PubMed]
- Jiang, W.; Mao, X.; Liu, Z.; Zhang, T.; Jin, L.; Chen, X. Global Burden of Nonalcoholic Fatty Liver Disease, 1990 to 2019. J. Clin. Gastroenterol. 2023, 57, 631–639. [Google Scholar] [CrossRef] [PubMed]
- Younossi, Z.M.; Anstee, Q.M.; Marietti, M.; Hardy, T.; Henry, L.; Eslam, M.; George, J.; Bugianesi, E. Global burden of NAFLD and NASH: Trends, predictions, risk factors and prevention. Nat. Rev. Gastroenterol. Hepatol. 2018, 15, 11–20. [Google Scholar] [CrossRef] [PubMed]
- Friedman, S.L.; Neuschwander-Tetri, B.A.; Rinella, M.; Sanyal, A.J. Mechanisms of NAFLD development and therapeutic strategies. Nat. Med. 2018, 24, 908–922. [Google Scholar] [CrossRef] [PubMed]
- Katsiki, N.; Mikhailidis, D.P.; Mantzoros, C.S. Non-alcoholic fatty liver disease and dyslipidemia: An update. Metabolism 2016, 65, 1109–1123. [Google Scholar] [CrossRef] [PubMed]
- Deprince, A.; Haas, J.T.; Staels, B. Dysregulated lipid metabolism links NAFLD to cardiovascular disease. Mol. Metab. 2020, 42, 101092. [Google Scholar] [CrossRef] [PubMed]
- Yanai, H.; Adachi, H.; Hakoshima, M.; Iida, S.; Katsuyama, H. Metabolic-Dysfunction-Associated Steatotic Liver Disease-Its Pathophysiology, Association with Atherosclerosis and Cardiovascular Disease, and Treatments. Int. J. Mol. Sci. 2023, 24, 15473. [Google Scholar] [CrossRef]
- Targher, G.; Byrne, C.D.; Tilg, H. MASLD: A systemic metabolic disorder with cardiovascular and malignant complications. Gut 2024, 73, 691–702. [Google Scholar] [CrossRef]
- Cordero, A.; Laclaustra, M.; León, M.; Casasnovas, J.A.; Grima, A.; Luengo, E.; MESYAS Registry Investigators. Comparison of Serum Lipid Values in Subjects with and without the Metabolic Syndrome. Am. J. Cardiol. 2008, 102, 424–428. [Google Scholar] [CrossRef] [PubMed]
- Wang, H.; Wang, C.; Xuan, X.; Xie, Z.; Qiu, Y.; Qin, H.; Xiaoning, Z. Association between triglyceride to high-density lipoprotein cholesterol ratio and type 2 diabetes risk in Japanese. Sci. Rep. 2023, 13, 3719. [Google Scholar] [CrossRef]
- Murguía-Romero, M.; Jiménez-Flores, J.R.; Sigrist-Flores, S.C.; Espinoza-Camacho, M.A.; Jiménez-Morales, M.; Piña, E.; Reaven, G.M. Plasma triglyceride/HDL-cholesterol ratio, insulin resistance, and cardiometabolic risk in young adults. J. Lipid Res. 2013, 54, 2795–2799. [Google Scholar] [CrossRef] [PubMed]
- Chen, Y.; Chang, Z.; Liu, Y.; Zhao, Y.; Fu, J.; Zhang, Y.; Liu, Y.; Fan, Z. Triglyceride to high-density lipoprotein cholesterol ratio and cardiovascular events in the general population: A systematic review and meta-analysis of cohort studies. Nutr. Metab. Cardiovasc. Dis. 2022, 32, 318–329. [Google Scholar] [CrossRef] [PubMed]
- Eeg-Olofsson, K.; Gudbjörnsdottir, S.; Eliasson, B.; Zethelius, B.; Cederholm, J. The triglycerides-to-HDL-cholesterol ratio and cardiovascular disease risk in obese patients with type 2 diabetes: An observational study from the Swedish National Diabetes Register (NDR). Diabetes Res. Clin. Pract. 2014, 106, 136–144. [Google Scholar] [CrossRef]
- Wu, K.-T.; Kuo, P.-L.; Su, S.-B.; Chen, Y.-Y.; Yeh, M.-L.; Huang, C.-I.; Yang, J.-F.; Lin, C.-I.; Hsieh, M.-H.; Hsieh, M.-Y.; et al. Nonalcoholic fatty liver disease severity is associated with the ratios of total cholesterol and triglycerides to high-density lipoprotein cholesterol. J. Clin. Lipidol. 2016, 10, 420–425.e1. [Google Scholar] [CrossRef] [PubMed]
- Fan, N.; Peng, L.; Xia, Z.; Zhang, L.; Song, Z.; Wang, Y.; Peng, Y. Triglycerides to high-density lipoprotein cholesterol ratio as a surrogate for nonalcoholic fatty liver disease: A cross-sectional study. Lipids Health Dis. 2019, 18, 39. [Google Scholar] [CrossRef] [PubMed]
- Li, R.; Kong, D.; Ye, Z.; Zong, G.; Hu, K.; Xu, W.; Fang, P.; Zhang, L.; Zhou, Y.; Zhang, K.; et al. Correlation of multiple lipid and lipoprotein ratios with nonalcoholic fatty liver disease in patients with newly diagnosed type 2 diabetic mellitus: A retrospective study. Front. Endocrinol. 2023, 14, 1127134. [Google Scholar] [CrossRef] [PubMed]
- Fukuda, Y.; Hashimoto, Y.; Hamaguchi, M.; Fukuda, T.; Nakamura, N.; Ohbora, A.; Kato, T.; Kojima, T.; Fukui, M. Triglycerides to high-density lipoprotein cholesterol ratio is an independent predictor of incident fatty liver; a population-based cohort study. Liver Int. 2016, 36, 713–720. [Google Scholar] [CrossRef]
- Chen, Z.; Qin, H.; Qiu, S.; Chen, G.; Chen, Y. Correlation of triglyceride to high-density lipoprotein cholesterol ratio with nonalcoholic fatty liver disease among the non-obese Chinese population with normal blood lipid levels: A retrospective cohort research. Lipids Health Dis. 2019, 18, 162. [Google Scholar] [CrossRef]
- European Association for the Study of the Liver (EASL); European Association for the Study of Diabetes (EASD); European Association for the Study of Obesity (EASO). EASL–EASD–EASO Clinical Practice Guidelines for the management of non-alcoholic fatty liver disease. J. Hepatol. 2016, 64, 1388–1402. [Google Scholar] [CrossRef]
- Martínez-Montoro, J.I.; Núñez-Sánchez, M.; Martinez-Sanchez, M.A.; Balaguer-Román, A.; Fernández-Ruiz, V.E.; Ferrer-Gómez, M.; Sledzinski, T.; Frutos, M.D.; Fernández-García, J.C.; Mika, A.; et al. Hepatic and serum branched-chain fatty acid profile in patients with nonalcoholic fatty liver disease: A case–control study. Obesity 2023, 31, 1064–1074. [Google Scholar] [CrossRef] [PubMed]
- Núñez-Sánchez, M.; Martínez-Sánchez, M.A.; Martínez-Montoro, J.I.; Balaguer-Román, A.; Murcia-García, E.; Fernández-Ruiz, V.E.; Ferrer-Gómez, M.; Martínez-Cáceres, C.M.; Sledzinski, T.; Frutos, M.D.; et al. Lipidomic Analysis Reveals Alterations in Hepatic FA Profile Associated with MASLD Stage in Patients with Obesity. J. Clin. Endocrinol. Metab. 2024, dgae028. [Google Scholar] [CrossRef]
- Bedossa, P.; Poitou, C.; Veyrie, N.; Bouillot, J.-L.; Basdevant, A.; Paradis, V.; Tordjman, J.; Clement, K. Histopathological algorithm and scoring system for evaluation of liver lesions in morbidly obese patients. J. Hepatol. 2012, 56, 1751–1759. [Google Scholar] [CrossRef]
- Matthews, D.R.; Hosker, J.P.; Rudenski, A.S.; Naylor, B.A.; Treacher, D.F.; Turner, R.C. Homeostasis model assessment: Insulin resistance and beta-cell function from fasting plasma glucose and insulin concentrations in man. Diabetologia 1985, 28, 412–419. [Google Scholar] [CrossRef] [PubMed]
- Lee, J.-H.; Kim, D.; Kim, H.J.; Lee, C.-H.; Yang, J.I.; Kim, W.; Kim, Y.J.; Yoon, J.-H.; Cho, S.-H.; Sung, M.-W.; et al. Hepatic steatosis index: A simple screening tool reflecting nonalcoholic fatty liver disease. Dig. Liver Dis. 2010, 42, 503–508. [Google Scholar] [CrossRef]
- Shah, A.G.; Lydecker, A.; Murray, K.; Tetri, B.N.; Contos, M.J.; Sanyal, A.J.; Nash Clinical Research Network. Comparison of Noninvasive Markers of Fibrosis in Patients with Nonalcoholic Fatty Liver Disease. Clin. Gastroenterol. Hepatol. 2009, 7, 1104–1112. [Google Scholar] [CrossRef]
- Sung, K.C.; Ryan, M.C.; Kim, B.S.; Cho, Y.K.; Kim, B.I.; Reaven, G.M. Relationships Between Estimates of Adiposity, Insulin Resistance, and Nonalcoholic Fatty Liver Disease in a Large Group of Nondiabetic Korean Adults. Diabetes Care 2007, 30, 2113–2118. [Google Scholar] [CrossRef] [PubMed]
- Ting, Y.-W.; Jalaludin, M.Y.; Zaini, A.A.; Mohamed, R. Triglyceride to high-density lipoprotein cholesterol ratio is an independent predictor of liver fibrosis among pediatrics non-alcoholic fatty liver disease. Front. Endocrinol. 2022, 13, 1071350. [Google Scholar] [CrossRef]
- Kashyap, S.R.; Diab, D.L.; Baker, A.R.; Yerian, L.; Bajaj, H.; Gray-McGuire, C.; Stein, C.M. Triglyceride Levels and Not Adipokine Concentrations Are Closely Related to Severity of Nonalcoholic Fatty Liver Disease in an Obesity Surgery Cohort. Obesity 2009, 17, 1696–1701. [Google Scholar] [CrossRef]
- Ganjooei, N.A.; Jamialahmadi, T.; Nematy, M.; Jangjoo, A.; Goshayeshi, L.; Khadem-Rezaiyan, M.; Sahebkar, A. The Role of Lipid Profile as an Independent Predictor of Non-alcoholic Steatosis and Steatohepatitis in Morbidly Obese Patients. Front. Cardiovasc. Med. 2021, 8, 682352. [Google Scholar] [CrossRef] [PubMed]

| No MASLD (n = 53) | MASL (n = 45) | MASH (n = 55) | p Value | |
|---|---|---|---|---|
| Sex (F, M) | 50/3 | 30/15 | 36/19 | 0.001 |
| Age (years) | 42 (34–51) a | 50 (42–55) b | 48 (42–55) b | 0.007 |
| Weight (kg) | 116.6 (108–124) | 117.9 (104.8–132.5) | 116.4 (97.4–135.6) | 0.880 |
| BMI (kg/m2) | 43.4 ± 5.9 | 43.6 ± 5.3 | 43.4 ± 6.9 | 0.975 |
| WC (cm) | 122.4 ± 12.8 | 126.6 ± 12.8 | 128.4 ± 15.5 | 0.088 |
| SBP (mm Hg) | 131 (120–143) a | 140 (128.5–153.5) b | 141 (130–150) b | 0.018 |
| DBP (mm Hg) | 85 (75–90) | 85 (80–93) | 82.5 (76.8–90.2) | 0.563 |
| Glucose (mg/dL) | 88 (80–96.5) a | 94 (85.5–104) b | 101 (89–123) c | <0.001 |
| HbA1c (%) | 5.4 (5.1–5.8) a | 5.7 (5.4–6.1) b | 5.8 (5.6–6.8) b | <0.001 |
| Insulin (μIU/mL) | 8.6 (5.8–15.2) a | 13.1 (9.3–18.5) b | 14.7 (9.2–26.7) b | 0.005 |
| HOMA-IR | 1.9 (1.2–3) a | 3.1 (2.2–4.3) b | 3.7 (2.1–7.8) b | <0.001 |
| Cholesterol (mg/dL) | 159 ± 30.6 | 165.1 ± 32 | 163.4 ± 31.6 | 0.609 |
| HDL-C (mg/dL) | 48 (37.3–54) a | 39 (33–45) b | 38 (33–44) b | 0.001 |
| LDL-C (mg/dL) | 87.6 ± 26.8 | 85.7 ± 27.9 | 85.4 ± 30.8 | 0.920 |
| Triglycerides (mg/dL) | 124 (103.8–161) a | 175 (148.5–229.5) b | 184 (153–230) b | <0.001 |
| TG/HDL-C ratio | 2.9 (2.2–3.9) a | 4.3 (3.4–7.4) b | 4.6 (3.3–6.6) b | <0.001 |
| AST (U/L) | 16 (13–19.3) a | 18 (14.3–21.5) a | 21.5 (17.8–28.8) b | <0.001 |
| ALT (U/L) | 14.5 (11–19) a | 18 (14–28.5) b | 24 (19–40) c | <0.001 |
| MASL (n = 45) | MASH (n = 55) | p Value | |
|---|---|---|---|
| SAF score (0/1/2/3/4/5/6/7/8/9) | (0/20/17/7/1/0/0/0/0) | (0/0/0/19/13/13/6/2/1/1) | ˂0.001 |
| Steatosis (0/1/2/3) | (0/34/11/0) | (0/30/14/11) | 0.009 |
| Hepatocellular ballooning (0/1/2) | (26/18/1) | (0/43/12) | ˂0.001 |
| Lobular inflammation (0/1/2/3) | (41/4/0/0) | (0/41/14/0) | ˂0.001 |
| Fibrosis (0/1/2/3) | (44/1/0/0) | (42/12/1/0) | 0.009 |
| TG | HDL-C | TG/HDL-C | |
|---|---|---|---|
| SAF score | 0.366 ** | −0.314 ** | 0.383 ** |
| Steatosis | 0.393 ** | −0.333 ** | 0.422 ** |
| Hepatocyte ballooning | 0.305 ** | −0.228 ** | 0.291 ** |
| Lobular inflammation | 0.247 ** | −0.232 ** | 0.261 ** |
| Fibrosis | 0.099 | −0.136 | 0.111 |
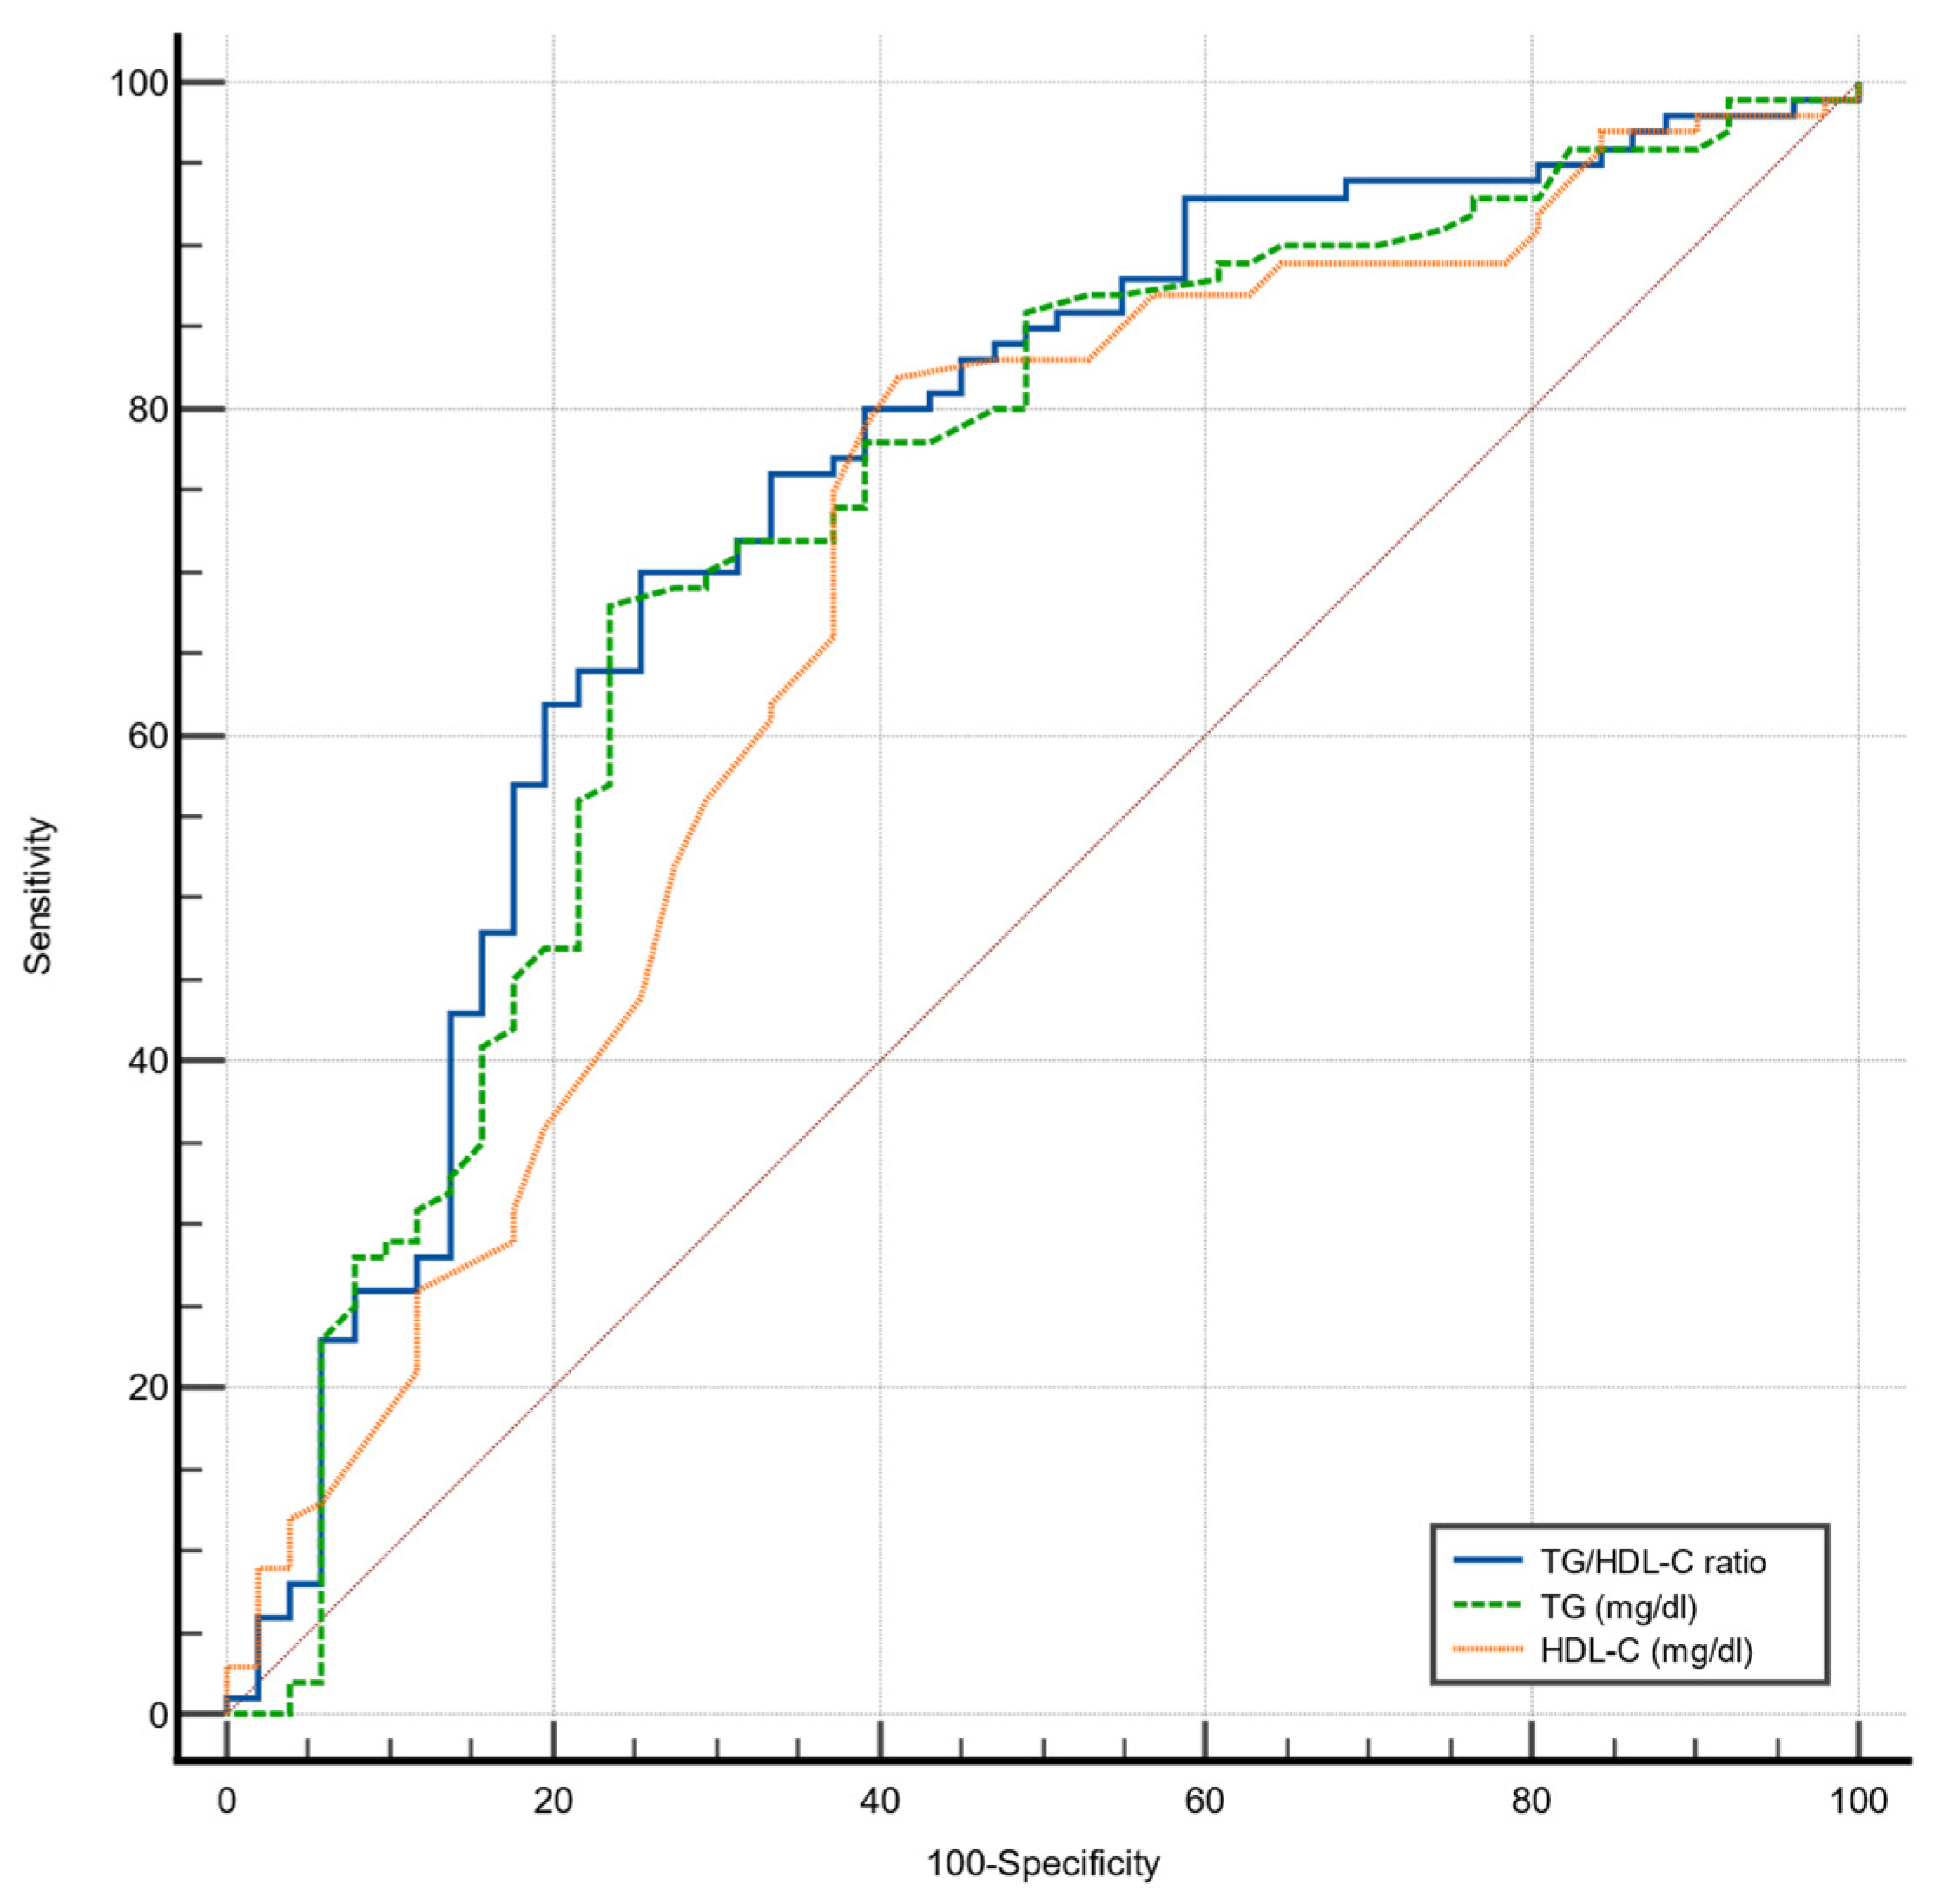
| AUC | 95% CI | Cut-Off Value | Sensitivity | Specificity | p Value | |
|---|---|---|---|---|---|---|
| TG/HDL-C ratio | 0.747 | 0.670–0.814 | 3.7 | 70.0% | 74.5% | <0.001 |
| TG | 0.730 | 0.653–0.799 | 161 | 68.0% | 76.9% | <0.001 |
| HDL-C | 0.685 | 0.605–0.758 | 46 | 82.0% | 57.7% | <0.001 |
Disclaimer/Publisher’s Note: The statements, opinions and data contained in all publications are solely those of the individual author(s) and contributor(s) and not of MDPI and/or the editor(s). MDPI and/or the editor(s) disclaim responsibility for any injury to people or property resulting from any ideas, methods, instructions or products referred to in the content. |
© 2024 by the authors. Licensee MDPI, Basel, Switzerland. This article is an open access article distributed under the terms and conditions of the Creative Commons Attribution (CC BY) license (https://creativecommons.org/licenses/by/4.0/).
Share and Cite
Martínez-Montoro, J.I.; Martínez-Sánchez, M.A.; Balaguer-Román, A.; Fernández-Ruiz, V.E.; Hernández-Barceló, J.E.; Ferrer-Gómez, M.; Frutos, M.D.; Núñez-Sánchez, M.Á.; Fernández-García, J.C.; Ramos-Molina, B. Triglyceride to HDL Cholesterol Ratio for the Identification of MASLD in Obesity: A Liver Biopsy-Based Case-Control Study. Nutrients 2024, 16, 1310. https://doi.org/10.3390/nu16091310
Martínez-Montoro JI, Martínez-Sánchez MA, Balaguer-Román A, Fernández-Ruiz VE, Hernández-Barceló JE, Ferrer-Gómez M, Frutos MD, Núñez-Sánchez MÁ, Fernández-García JC, Ramos-Molina B. Triglyceride to HDL Cholesterol Ratio for the Identification of MASLD in Obesity: A Liver Biopsy-Based Case-Control Study. Nutrients. 2024; 16(9):1310. https://doi.org/10.3390/nu16091310
Chicago/Turabian StyleMartínez-Montoro, José Ignacio, María Antonia Martínez-Sánchez, Andrés Balaguer-Román, Virginia Esperanza Fernández-Ruiz, José Emilio Hernández-Barceló, Mercedes Ferrer-Gómez, María Dolores Frutos, María Ángeles Núñez-Sánchez, José Carlos Fernández-García, and Bruno Ramos-Molina. 2024. "Triglyceride to HDL Cholesterol Ratio for the Identification of MASLD in Obesity: A Liver Biopsy-Based Case-Control Study" Nutrients 16, no. 9: 1310. https://doi.org/10.3390/nu16091310
APA StyleMartínez-Montoro, J. I., Martínez-Sánchez, M. A., Balaguer-Román, A., Fernández-Ruiz, V. E., Hernández-Barceló, J. E., Ferrer-Gómez, M., Frutos, M. D., Núñez-Sánchez, M. Á., Fernández-García, J. C., & Ramos-Molina, B. (2024). Triglyceride to HDL Cholesterol Ratio for the Identification of MASLD in Obesity: A Liver Biopsy-Based Case-Control Study. Nutrients, 16(9), 1310. https://doi.org/10.3390/nu16091310