
Vitamin D and Dyslipidemia: Is There Really a Link? A Narrative Review

 and
and
Abstract
1. Introduction
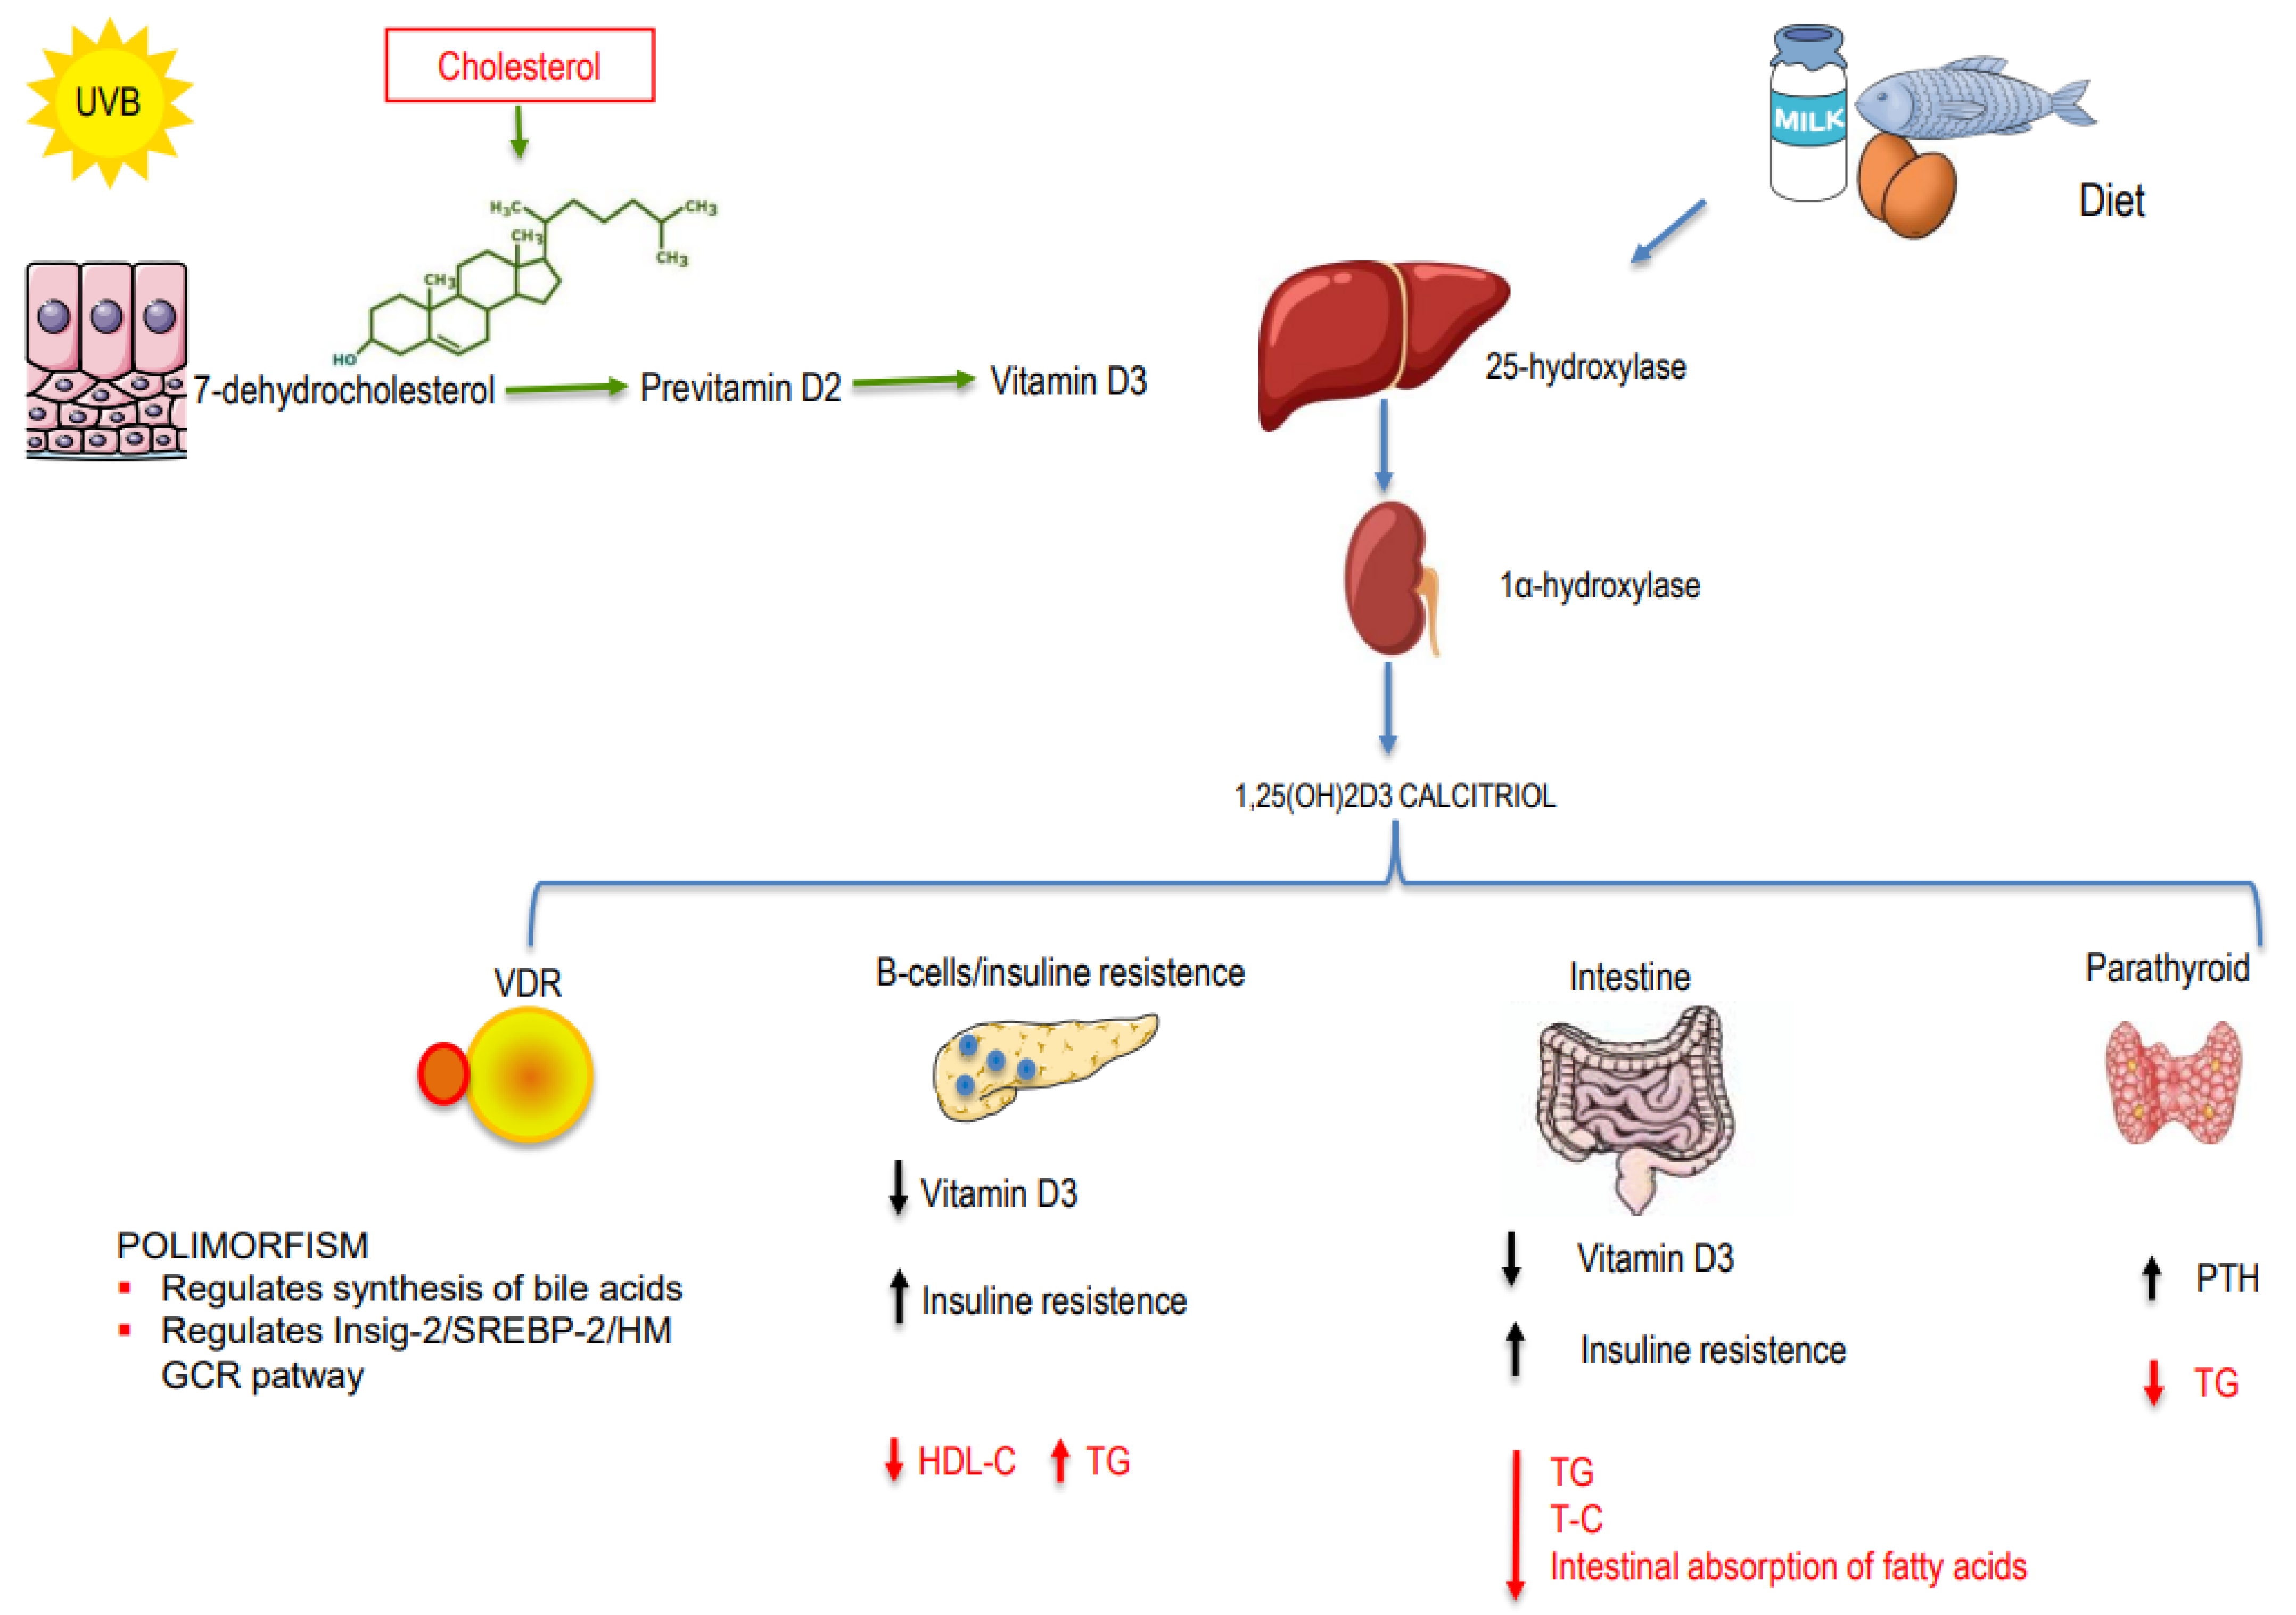
1.1. Genetic Mechanisms
1.2. Non-Genetic Mechanisms
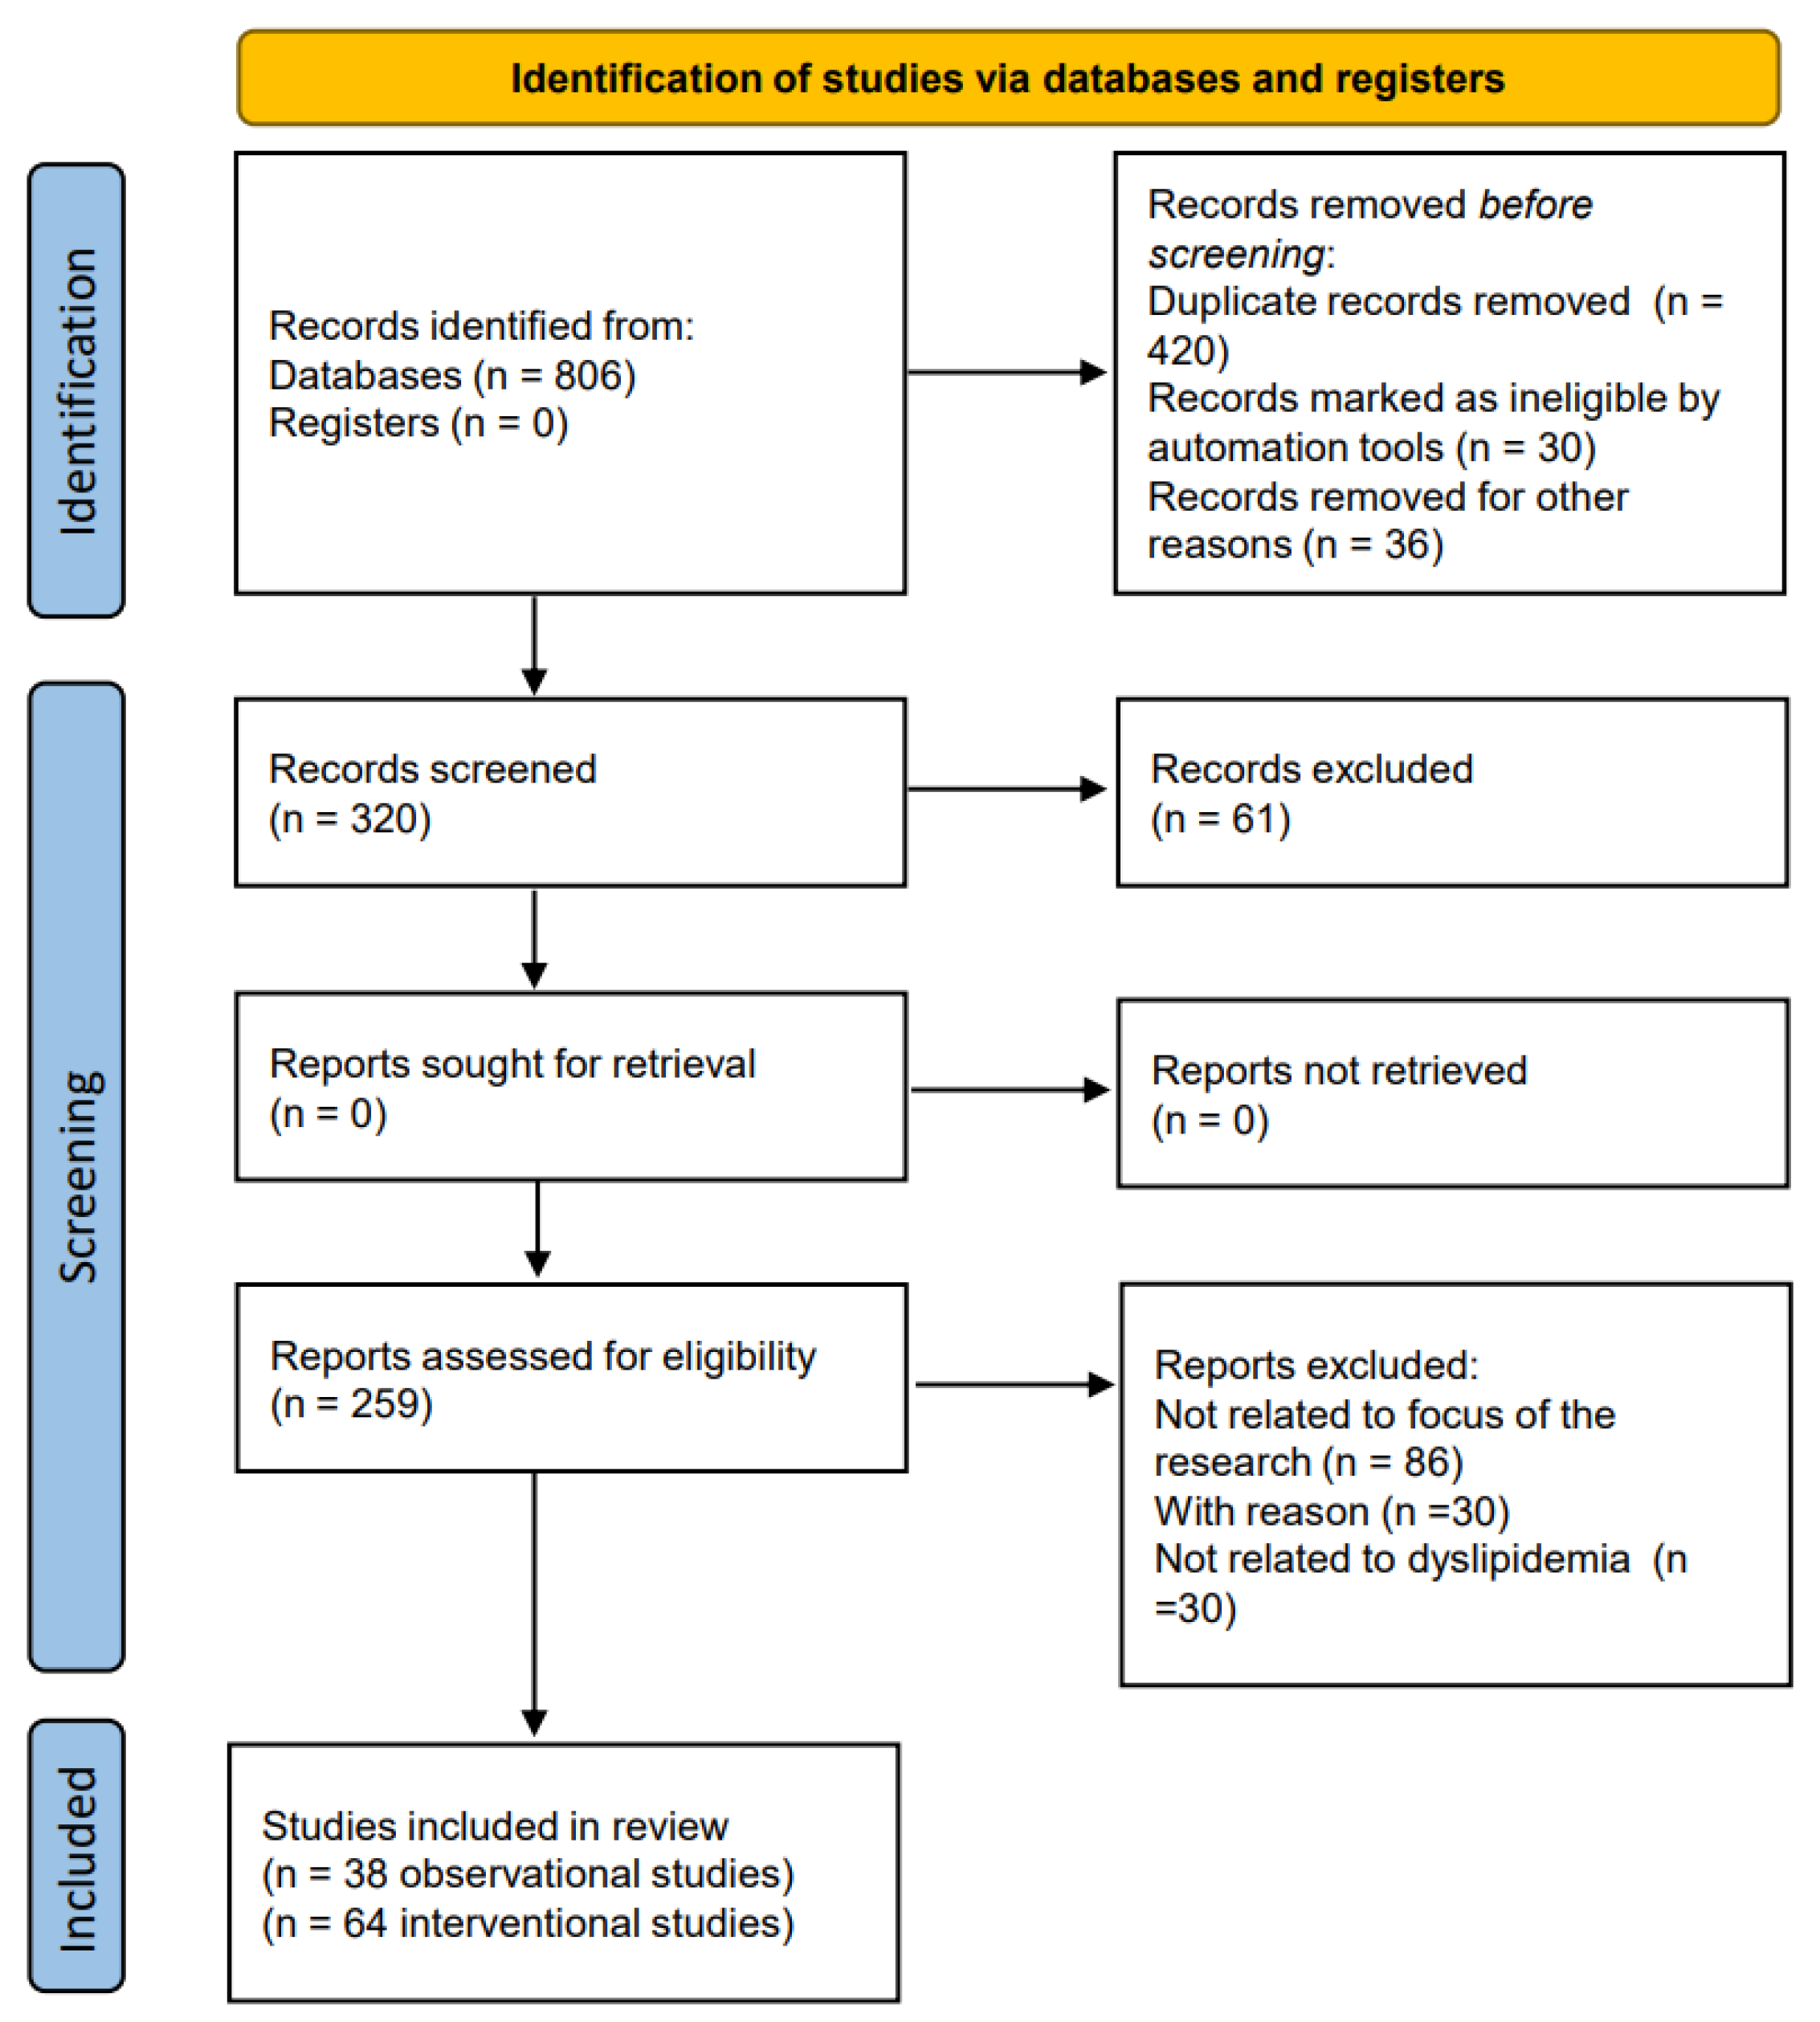
2. Materials and Methods
3. Results
3.1. Observational Studies
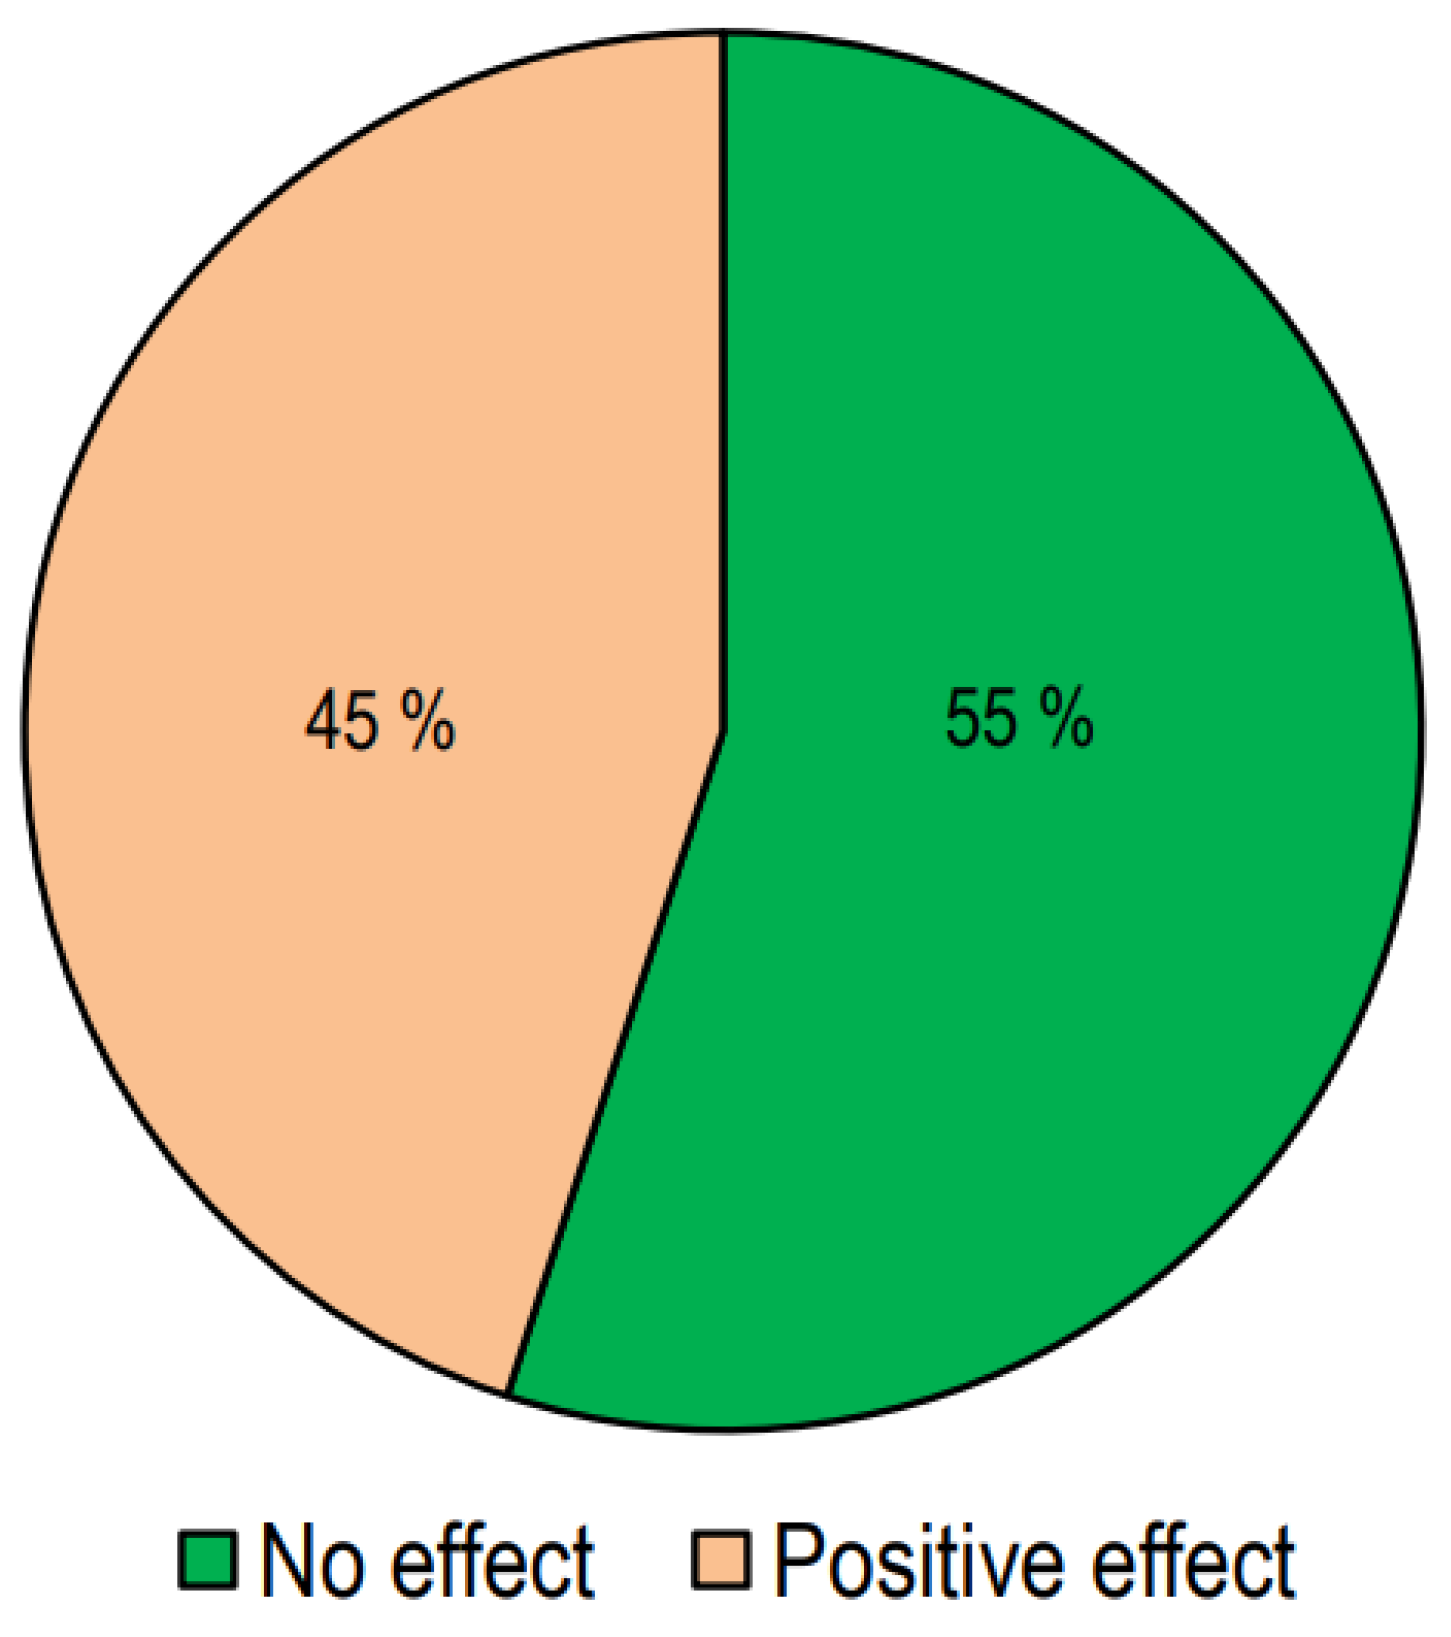
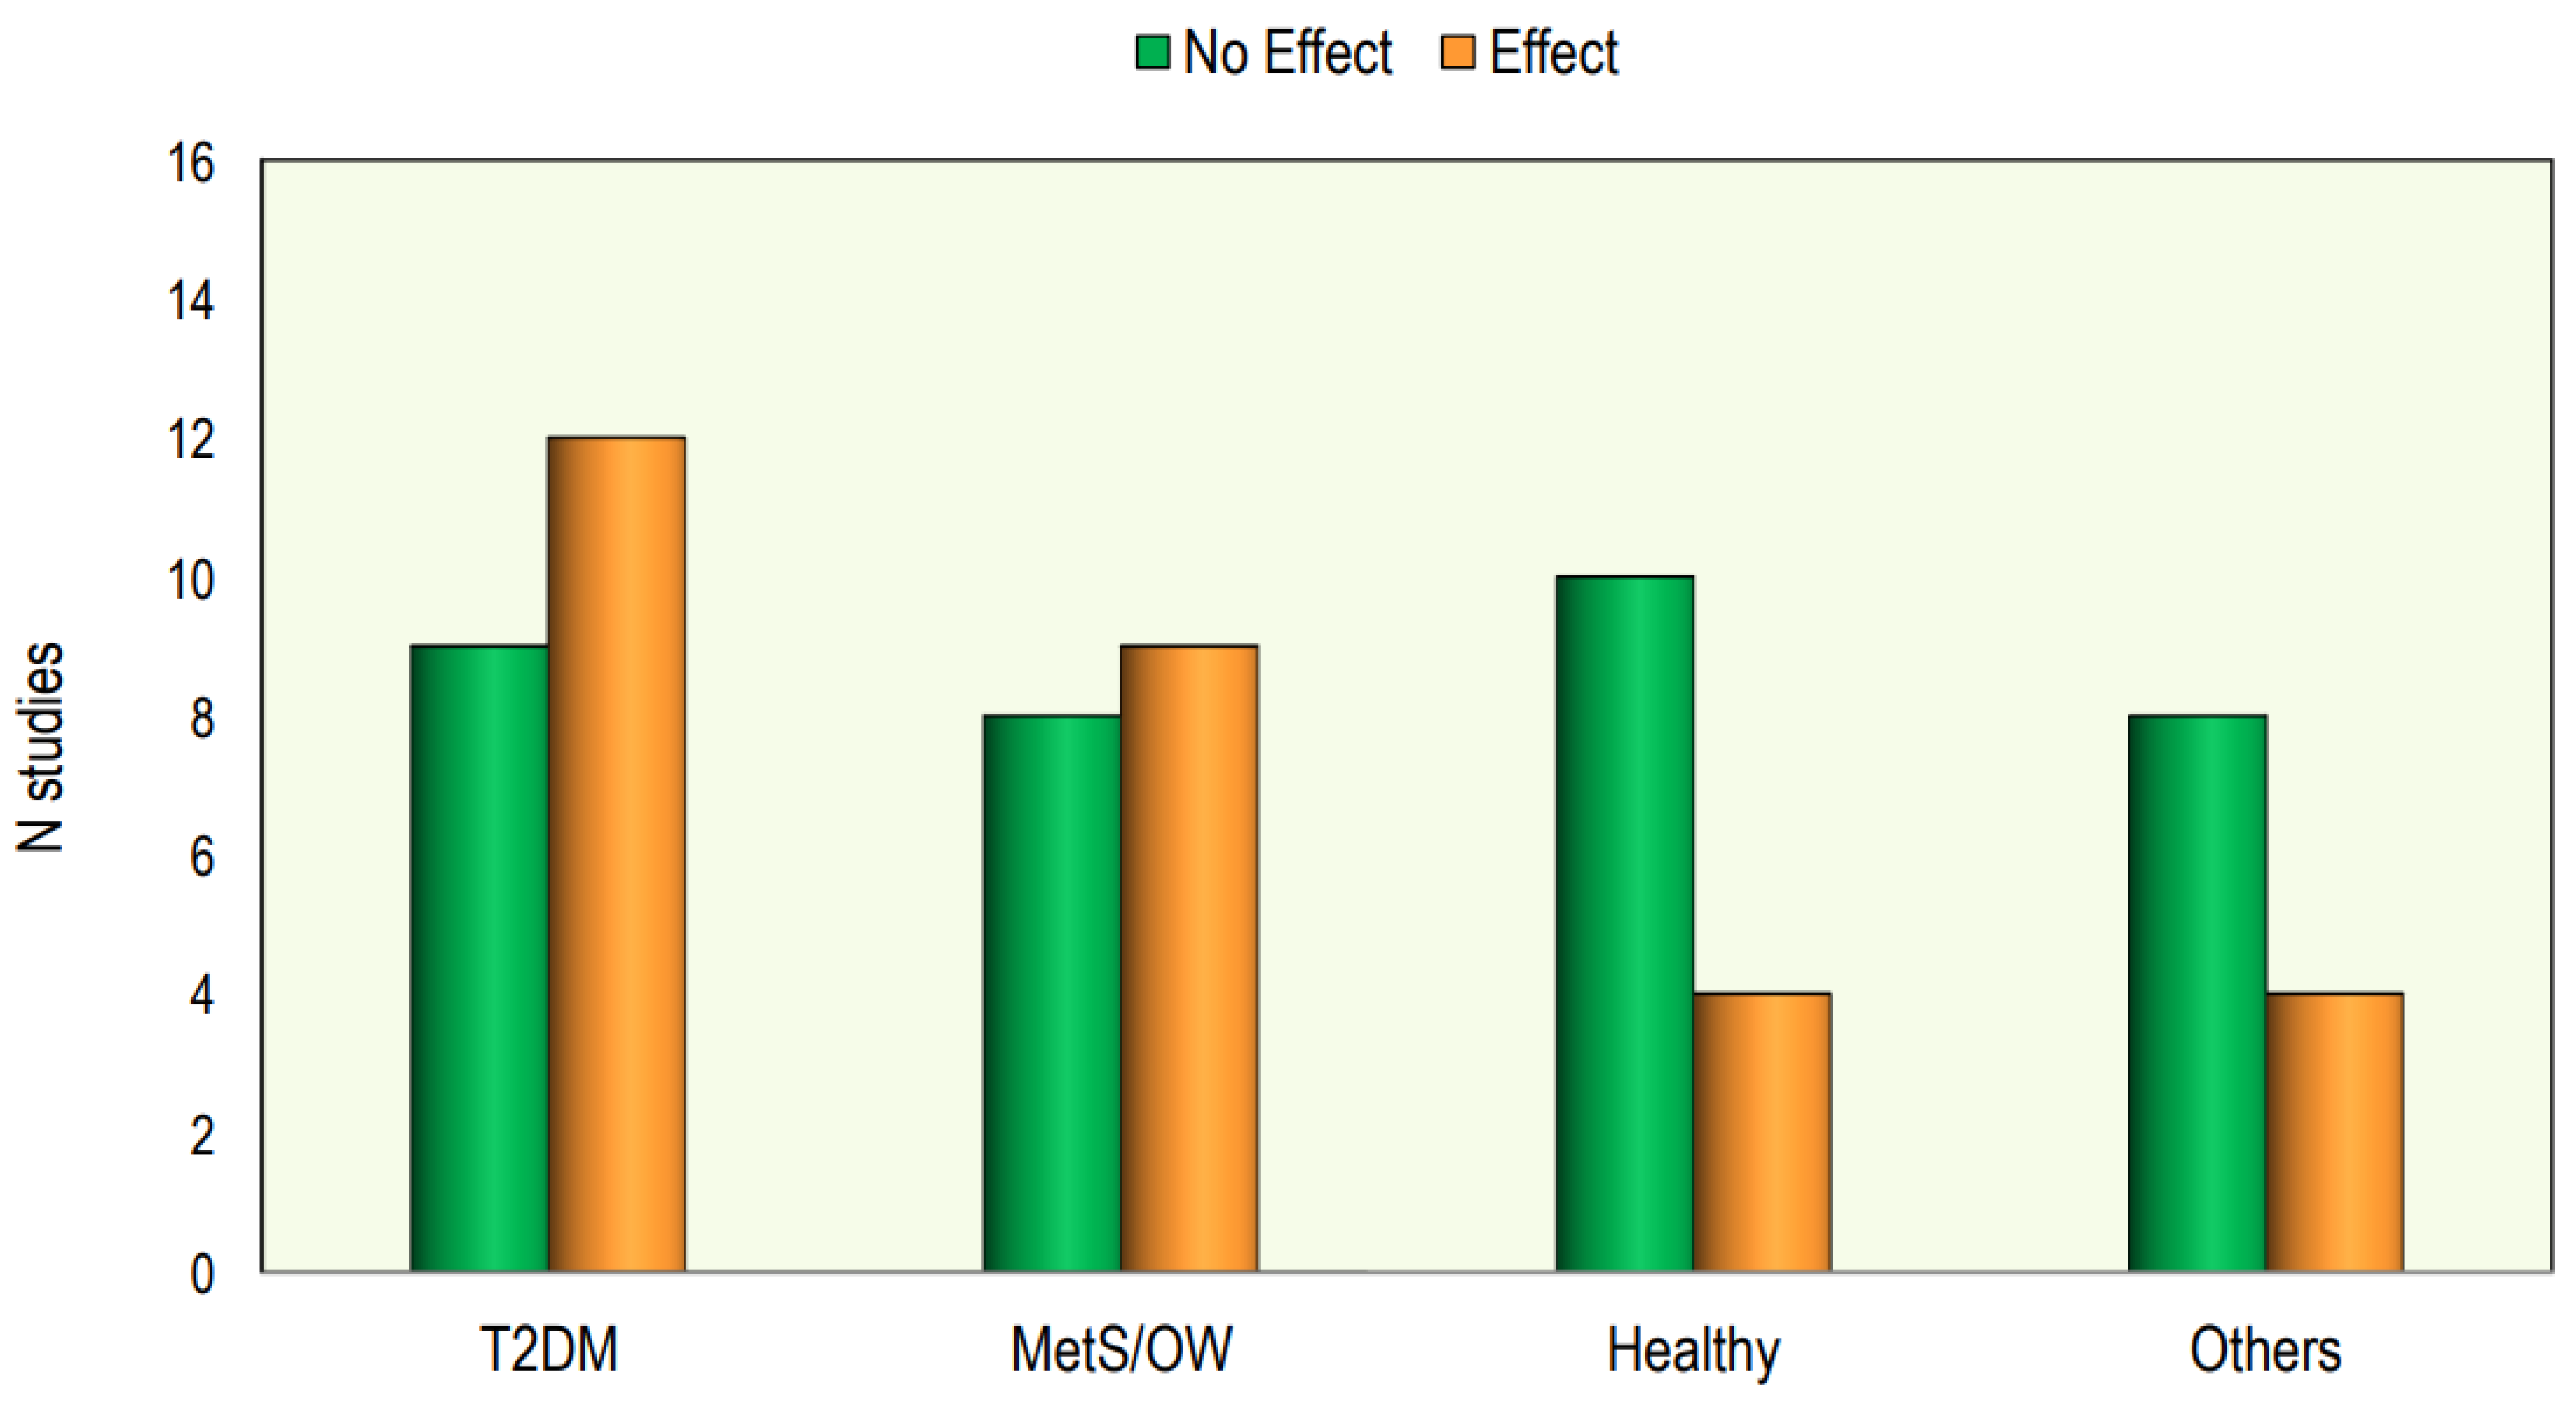
3.2. Interventional Studies


| Study/Years | Country | Subjects | Study | Description/Evaluation | Results/Conclusion |
|---|---|---|---|---|---|
| Auwerx J et al. (1992) [16] | Belgium | 185 ♂. Age: 38.7 ± 10.9 yrs 25OHD: 29.6 ± 12.1 ng/mL 173 ♀. Age: 37.2 ± 10.4 yrs 25OHD: 30.4 ± 14.5 ng/mL | Observational | total serum calcium, 25OHD, y-GT, TC, HDL-C, apo A-1, apo B, and total protein | Positive correlation between 25OHD and apoA-1 and HDL-C levels |
| Botella-CarreteroJI et al. (2007) [21] | Spain | 73 obese patients 36 without vit D deficiency (Age: 42.17 ± 11.6 yrs 25OHD: 45.7 ± 35.5 ng/mL 37 with vit D deficiency (Age: 39.07 ± 12.7 yrs 25OHD 13.3 ± 3.8 ng/mL) | Transversal, observational | BMI, FG, 25OHD, lipid profile, glucose, insulin and insulin resistance | 25OHD deficiency was more prevalent in morbidly obese patients with metabolic syndrome; HDL-C was lower and TGs were higher in the hypovitaminosis D group |
| Kostecka D et al. (2022) [23] | Poland | 191 ♀ (45–65 yrs) 25OHD: 23 ng/mL | Observational | lipid profile, glycemia and 25OHD | Negative correlation between 25OHD and TC, LDL-C, and TGs |
| Chaudhuri J.R. et al. (2012) [18] | India | 91 (48 ♂ and 43 ♀) normal vit D (Age: 49 ± 16.1 yrs) 91 (48 ♂ and 43 ♀) vit D deficiency (Age: 50.1 ± 15.1 yrs) | Observational | FG, lipid profile calcium, alkaline phosphatase, phosphorus, CRP, 25OHD | Hypovitaminosis D was associated with increased levels of TC, LDL-C and TGs and lower levels of HDL-C |
| Karhapää P. et al. (2010) [19] | Finland | 909 ♂ DMT2 Age: 45–70 yrs 25OHD = 22.1–163.6 nmol/L | Observational | lipid profile, 25OHD, and 1,25OHD | Low levels of 1,25OHD were associated with low HDL-C levels; low levels of 25OHD were associated with high levels of TC, LDL-C and TGs |
| Guasch A. et al. (2012) [20] | Spain | 76 ♂ Age: 49.28 yrs 25OHD: 65.01 nmol/L 240 ♀ Age: 46.08 yrs 25OHD: 53.55 nmol/L | Retrospective | FG, calcium, phosphate, alkaline phosphatase, lipid profile, creatinine, serum albumin, erythrocyte sedimentation rate (ESR) and leukocyte count, uCRP | Low levels of 25OHD were associated higher levels of TGs |
| Jiang X et al. (2019) [12] | China | 3788 adults 2056 (54.28%) had dyslipidemia 25OHD: ≤8.02–≥33.71 nmol/L | Cross-sectional | lipid profile and 25OHD | 25OHD was inversely correlated with LDL-C and TG levels, and positively correlated with HDL-C |
| Sharba ZF et al. (2020) [22] | Iraq | 58 ♂ and 72 ♀. Age: 20–70 yrs 3 groups by serum level of vit D: <10 ng/mL—vit D deficient 10–30 ng/mL—vit D insufficient 30–100 ng/mL vit D normal | Cross-sectional | lipid profile and 25OHD | HDL-C was significantly reduced in low levels of 25OHD, while LDL-C and TG levels were increased |
| Saheb Sharif-Askari F S et al. (2020) [24] | Arab Emirates | 1848 ♂, 641 ♀. Age: 18 to 80 yrs Insulin resistance group 25OHD: 28.50 ng/mL Insulin-sensitive group 25OHD: 31.20 ng/mL | Cross-sectional | lipid profile and 25OHD, IL-6, IL-8, and soluble thrombomodulin | Hypovitaminosis D was associated with lower HDL-C |
| Guan C. et al. (2020) [25] | China | 10,038 subjects 25OHD: <20 ng/mL | Cross-sectional | lipid profile and 25OHD | Deficient serum 25OHD was associated with higher TC, LDL-C, and TGs |
| Han YY et al. (2021) [28] | China | 715 (527 ♂ and 188 ♀) Age: 35–65 yrs first group: 25OHD < 15 ng/mL second group: 25OHD ≥15 ng/mL | Observational | lipid profile and 25OHD, glucose | Hypovitaminosis D was associated with increased levels of LDL-C, TGs and VLDL-C |
| Yang K. et al. (2020) [30] | China | 1928 (958 ♂–970 ♀) Age: 18–87 yrs 25OHD: <15 nmol/L | Observational | lipid profile, 25OHD, FPG, H2PG, BMI | 25OHD level was negatively correlated with FPG, TC and TGs |
| Wang Y. et al. (2016) [49] | China | 1475 829 ♂ Age: 25–64.5 yrs 646 ♀ Age: 24–64 yrs 25OHD: 27–92.25 nmol/L | Cross-sectional | lipid profile and 25OHD, BMI | In ♂, elevated TGs and reduced HDL-C were associated with hypovitaminosis D; in ♀, no significant difference |
| AlQuaiz AM et al. (2020) [35] | Saudi Arabia | 653 ♂ Age: 40.1 ± 10.2 yrs 1064 ♀ Age: 39.1 ± 8.3 yrs first group 25OHD: <50 nmol/L second group 25OHD: ≥50 nmol/L | Cross-sectional | lipid profile and 25OHD | Hypovitaminosis D was associated with low levels of HDL-C (higher in ♂ than in ♀) and high levels of TGs (in ♀ but not in ♂) |
| Kostrova GN. et al. (2022) [36] | Russia | 64 boys and 214 girls Age: 18–24 yrs 25OHD: 14.9–26.3 ng/mL | Observational | lipid profile and 25OHD, BMI | In ♂, a negative correlation was found between 25OHD levels and TC and LDL |
| Kim MR. et al. (2019) [37] | Korea | 117 boys and 126 girls Age: 9–18 yrs 25OHD: 17.27 ng/mL | Observational | lipid profile and 25OHD, BMI | The vitamin D-deficient group showed higher TG levels and TG/HDL-C ratios |
| Delvin EE et al. (2010) [38] | French Canadian | 878 boys and 867 girls Age: 9–16 yrs Boys: 25OHD: 45.9 ± 12.2 nmol/L Girls: 25OHD: 45.9 ± 13.0 nmol/L | Cross-sectional | lipid profile and 25OHD, fasting plasma insulin, glucose, apolipoproteins (apo) A1 and B | Modestly higher concentration of plasma TC, TGs, apoA1, and apoB for each 10 nmol/L of 25OHD increase in plasma in girls only |
| Williams DM et al. (2011) [39] | USA | 7078 subjects Age: 12–19 yrs 25OHD: 50.4 nmol/L | Cross-sectional | lipid profile and 25OHD, fasting insulin and glucose, post-load glucose and HbA1c | 25OHD was positively associated with HDL-C values |
| Rajakumar K. et al. (2011) [40] | USA | 237 subjects Age: 12.7 ± 2.2 yrs 25OHD: 19.4 ± 7.4 ng/mL | Observational | lipid profile and 25OHD, BMI | Lower levels of 25OHD are associated with lower HDL-C |
| Birken CS et al. (2015) [41] | Canada | 996 boys and 965 girls Age: 1–5 yrs 25OHD: 85 nmol/l | Cross-sectional | lipid profile and 25OHD | A significant association between increased 25OHD and decreased non-HDL-C; each 10 nmol/L increase in 25OHD was associated with a decrease in non-fasting TC and in non-fasting TGs |
| Yarparvar, A. et al. (2020) [43] | Iran | 71 boys (17 yrs) 25OHD: first group < 25 ng/mL second group ≥ 25 ng/mL | Observational | lipid profile and 25OHD, IL-10, IL-6, hsCRP, and TNFR-2 | HDL-C level was lower in hypovitaminosis D |
| Saeidlou N. et al. (2017) [44] | Iran | 541 subjects Age: 5–60 yrs; In winter: 25OHD: 45.8 ± 24.26 ng/mL; in summer: 25OHD: 55.24 ± 37.47 ng/mL | Cross-sectional | lipid profile and 25OHD and comparison of values between summer and winter | Comparing serum lipid levels in summer and in winter showed a significant difference in TC, LDL-C, and HDL-C, but no significant effect was found for TGs |
| Song K. et al. (2020) [45] | Korea | 3183 subjects Age: 12–18 yrs 25OHD: 6.15 ng/mL | Cross-sectional | lipid profile and 25OHD | Vitamin D deficiency is related with low HDL-C levels |
| Al-Ajlan, A et al. (2015) [46] | Saudi Arabia | 515 pregnant ♀ Age: 28.71 ± 6.07 yrs 25OHD: 24.42 ± 15.4 nmol/L | Cross-sectional | lipid profile and 25OHD | Serum vitamin D values correlated positively with serum levels of TC and TGs |
| Lepsch, J. et al. (2017) [47] | Brazil | 194 pregnant ♀ Age: 26.7 ± 5.5 yrs first group 25OHD: ≥75 nmol/L second group25OHD: <75 nmol/L | Cross-sectional | lipid profile and 25OHD | Women with low levels of 25OHD had higher LDL-C than those with adequate concentrations |
| Jin D. et al. (2020) [48] | China | 2479 pregnant ♀ Age: 29.3 ± 4.2 yrs 25OHD: 40.08 nmol/L | Observational | lipid profile and 25OHD hs-CRP | Increased serum 25OHD was significantly associated with decreasing TC, TGs, HDL-C, LDL-C, and hs-CRP levels |
| Wang L. et al. (2020) [49] | China | 2659 (Age: 54–66 yrs) 849 T2DM (324 ♂, 525 ♀) 25OHD: 29.77 ng/mL 913 IFG (352 ♂, 561 ♀) 25OHD: 29.26 ng/mL 897 NGT (344 ♂, 553 ♀) 25OHD: 31.12 ng/mL | Case–control | lipid profile and 25OHD, HOMA-IR, BMI | Adequate vitamin D levels could reduce the risk of IFG and T2DM by reducing the lipid profile |
| Saedisomeolia, A. et al. (2014) [50] | Iran | T2DM 108 Age: 47.65 ± 12.08 yrs sufficient group 25OHD: ≥50 nmol/L deficiency group 25OHD: <50 nmol/L | Cross-sectional | lipid profile and 25OHD, calcium, phosphorus, PTH | Subjects with vit D deficiency had higher serum levels of TC, TGs, and LDL-C and lower levels of HDL-C compared to subjects with vit D sufficiency. Association was statistically significant only for TGs |
| Huang, Y. et al. (2013) [51] | China | T2DM 1326 ♂ Age: 47.6 ± 11.3 yrs T2DM 1326 ♀ Age: 49.4 ± 13.1 yrs 25OHD: 25.4 ± 6.5 ng/mL | Cross-sectional | lipid profile and 25OHD, LPL, FFAs, FG, fasting insulin, apoA and apoB | Serum 25OHD concentration was positively associated with LPL |
| Raheem M. et al. (2022) [52] | Iraq | 47 T2DM subjects (Age: 35–64 yrs) 43 healthy (Age: 37–65 yrs) first group 25OHD: >22.5 ng/dL second group 25OHD: <22.5 ng/dL | Observational | lipid profile and 25OHD, HOMA-IR, HbA1c, FG | FG, HOMA-IR, TC and TGs were significantly elevated in T2DM compared to controls when the serum 25OHD was markedly low |
| Ponda M. et al. (2012) [56] | USA | 107.811 subjects Retrospective 2332 subjects 25OHD: <20 ng/mL 6260 subjects 25OHD: 20–30 ng/mL | Cross-sectional Retrospective cohort | association between lipid profile and 25OHD how changes in 25OHD levels relate to changes in lipid levels | Subjects with optimal levels ≥30 ng/mL had lower TC, LDL-C, TGs and higher HDL-C; correcting vitamin D deficiency had no effect on lipids |
| Li Y. et al. (2021) [28] | USA | Cohort 1: N = 5580 Age: 48 (38–56) yrs 25OHD: 32 ng/mL Cohort 2: N = 6057 Age: 48 (38–56) yrs 25OHD: 34 ng/mL Cohort 3: N = 7249 Age: 49 (39–57) yrs 25OHD: 32 ng/mL | Observational, cross-sectional | lipid profile and 25OHD | Changes in vit D levels correlated negatively with changes in TC, LDL-C, and TGs; no changes in HDL-C levels |
| Gong T. et al. (2022) [27] | China | 153 T2DM ♂ Age: 50.45 ± 11.14 yrs 153 T2DM ♀ Age: 54.14 ± 11.59 yrs | Observational | lipid profile and 25OHD, HOMA-IR, BMI | In overweight/obese with T2DM, serum 25OHD was independently, negatively correlated with TGs |
| Jorde R. et al. (2010) [114] | Norway | Nonsmokers 8018 Age: 55.9 ± 12.6 yrs 25OHD: 54.1 ± 16.2 nmol/L Smokers 2087 Age: 53.6 ± 11.4 yrs 25OHD: 75.4 ± 20.9 nmol/L Nonsmokers 1762 Age: 55.5 ± 9.8 yrs 25OHD: 55.0 ± 17.7 nmol/L Smokers 397 Age: 52.1 ± 10.3 yrs 25OHD: 68.7 ± 20.8 nmol/L | Cross-sectional Longitudinal | serum 25OHD, TC, HDL-C, LDL-C, LDL-C/HDL-C ratio and triacylglycerol (TAG) | A significative decrease in TGs with the increase in vitamin D |
| Pathania M. et al. (2023) [29] | India | 120 ♂ and 115 ♀ MetS patients Age: 43.81 ± 10.45 yrs 25OHD: 19.14 ± 20.44 ng/mL | Single-center Cross-sectional | serum 25OHD, TC, HDL-C, LDL-C, LDL-C/HDL-C ratio, TGs | Low vit D serum levels show weak correlation with TC, TGs and LDL-C |
| Atia T. (2023) [32] | Saudi Arabia | n145 non diabetes: 25OHD: 30.28 ± 12.51 ng/mL n104 prediabetes: 25OHD: 24.86 ± 10.59 ng/mL | Cross-sectional study | serum 25OHD, TC, HDL-C, LDL-C, TGs, HOMA-IR, BMI, FG, | Vitamin D deficiency was more prevalent in prediabetes and it was associated with high TG and low HDL levels, with no significant changes in TC or LDL levels |
| Cheng YL (2023) [31] | Taiwan | 118 (53 ♂ 65 ♀; Age, 54.4 ± 10.6 yrs) 25OHD at baseline: 22.7 (17.6–29.2) (ng/mL) | Retrospective study | serum 25OHD, TC, HDL-C, LDL-C, TGs, HbA1c | Increased of 25OHD levels showed a significant reduction in TGs and TC |
| Chen CW et al. (2023) [33] | Taiwan | 407 ♂ and 569 ♀ Age: 20–45 yrs 25OHD < 12 ng/mL N = 205 age: 31.64 ± 4.59 yrs 25OHD 12–200 ng/mL N = 345 age: 31.54 ± 4.34 yrs 25OHD 20–30 ng/mL N = 344 age: 32.35 ± 4.61 yrs 25OHD > 30 N = 82 age: 32.65 ± 4.32 yrs | Single-center Cross-sectional | serum 25OHD, TC, HDL-C, LDL-C, TGs | Vit D deficiency was associated with higher TC, LDL-C, TGs, and non HDL-C |
| Study/Year | Country | Healthy/ Comorbidity | Subjects | Study | Description | Results |
|---|---|---|---|---|---|---|
| Carlson LA et al. (1970) [57] | Sweden | Healthy | 121 ♂ aged 34.6 (range 21–64 yrs) Group A N = 43 Group B N = 32 Group C N = 46 | interventional | Duration of treatment: 6 weeks (A) No treatment (B) 500 IU vitamin D/day (C) 1000 IU vitamin D/day | vitamin D had no effect on the serum lipid levels |
| Scragg R et al. (1995) [61] | UK | Healthy | 199 subjects Age: 70 yrs (range 63–76) Vit D: N = 95 Placebo: N = 94 | randomized double-blind trial | Duration of treatment: a single oral dose of 2.5 mg cholecalciferol Assessment after 5 weeks | vitamin D supplementation had no effect on serum lipid levels |
| Andersen R et al. (2009) [62] | Denmark | Healthy | 89 ♀–84 ♂ Pakistani immigrants Vit D 10 mcg: N = 56 Vit D 20 mcg: N = 61 Placebo N = 56 | 1-year-long randomized double-blind placebo-controlled intervention | Duration of treatment: 12 months: Vit D 10 mcg daily Vit D 20 mcg daily | vitamin D had no effect on serum lipid levels |
| Makariou S et al. (2017) [63] | Greece | MetS subjects | 50 MetS subjects Vit D: N = 25 Age: 52 ± 9 yrs 25OHD status: 16.1 ng/mL Placebo: N = 25 Age: 51 ± 12 yrs 25OHD status: 9.9 ng/mL | pilot study PROBE (prospective, randomized, open-label, blinded end-point) design | Duration of treatment: 3 months: Vit D: 2000 IU vitamin D/day | vitamin D had no effect on serum lipid levels |
| Makariou S et al. (2019) [64] | Greece | MetS subjects | 50 MetS subjects Vit D: N = 25 Age: 52 ± 9 yrs 25OHD status: 16.1 ng/mL Placebo: N = 25 Age: 53 ± 7 yrs 25OHD status: 9.9 ng/mL | pre-specified analysis of a previous study | Duration of treatment: 3 months: Vit D: 2000 IU vitamin D/day | vitamin D had no effect on oxidative stress markers |
| Wongwiwatthananukit S et al. (2013) [65] | USA | MetS subjects | 46 ♀–44 ♂ patients with MetS Age: 63.6 ± 11.7 yrs 25-OHD status: 15.19 ± 3.23 ng/mL Placebo: N = 30 DP 20.000 IU: N = 30 DD 40.000 IU: N = 30 | a prospective, randomized, double-blind, double-dummy, parallel trial | Duration of treatment: 8 weeks: Group DP: vitamin D 20.000 IU/week, Group DD: vitamin D 40.000 IU/week, | vitamin D had no effect on serum lipid levels |
| Yin X et al. (2016) [67] | China | MetS subjects | 126 MetS subjects Age: 49.5 ± 8.72 yrs 25-OHD status: 14.5 ± 3.3 ng/mL Vit D: N = 61 Placebo: N = 62 | 1-year long randomized double-blind placebo-controlled | Duration of treatment: 1 year: Vit D: daily 700 IU vitamin D | vitamin D had no effect on serum lipid levels |
| Farag A et al. (2019) [92] | Iraq | MetS subjects | 70 MetS patients Vit D: N = 24 Age: 40.5 ± 5.9 yrs 25-OHD status: 10.7 ± 2.8 ng/mL Vit D + PA: N = 21 Age: 40.4 ± 5.9 yrs 25-OHD status: 10.4 ± 3.2 ng/mL Placebo: N = 25 Age: 42.6 ± 5.6 yrs 25-OHD status: 12.2 ± 3.9 ng/mL | randomized controlled trial | Duration of treatment: 12 weeks: Vit D: 2000 UI/day vitamin D, Vit D + PA: 2000 UI/day vitamin D and physical activity | only vitamin D + PA reduced TC, LDL-C and HDL-C |
| Imga N N et al. (2019) [101] | Turkey | Overweight/obese | 72 ♀ overweight Age: 42.5 ± 10.8 yrs 25OHD status: 6.1 ng/mL 50 ♀ obese Age: 43.9 ± 10.1 yrs 25OHD status= 5.6 ng/mL | interventional study | Duration of treatment: 6 months: 100.000 IU/week as a loading dose for 8 weeks following a maintenance dose of 3000 IU/day | vitamin D reduced LDL-C and HOMA-IR |
| Patwardhan V. et al. (2017) [91] | India | Healthy | 150 healthy Indians Increase Sunlight: N = 50 Age: 47.6 ± 6.6 yrs 25OHD status: 35.6 ± 11.8 nmol/L Vit D: N = 50 Age: 47.5 ± 6.4 yrs 25OHD status: 31.9 ± 12.7 nmol/L Control: N = 50 Age: 47.7 ± 6.8 yrs 25OHD status: 66.3 ± 13.8 nmol/L | prospective, randomized open-label trial | Duration of treatment: 6 months: Increase Sunlight: Sunlight exposure 20 min forearms and face between 11 a.m. and 3 p.m.; Vit D: cholecalciferol 1000 IU/day | sunlight exposure reduced TC, LDL-C, and HDL-C vitamin D supplementation increased TC and HDL-C |
| Jorde R et al. (2010) [116] | Norway | Overweight/obese | 438 overweight or obese subjects Vit DD group: N = 150 Age: 46.3 ± 11.3 yrs 25-OHD status: 57.7 ± 21.2 nmol/L Vit DP group: N = 139 Age: 47.3 ± 11.9 yrs 25-OHD status: 56.7 ± 21.2 nmol/L Placebo group: N = 149 Age: 48.9 ± 11.0 yrs 25-OHD status: 58.8 ± 21 nmol/L | 1 year, double-blind placebo-controlled intervention trial | Duration of treatment: 1 yrs: Vit DD: cholecalciferol 40,000 IU per week, Vit DP: cholecalciferol 20,000 IU per week, | vitamin D had no effect on serum lipid levels |
| Salekzamani S et al. (2016) [93] | Iran | MetS subjects | 80 MetS subjects (40.49 ± 5.04 yrs) 25OHD status < 75 nmol/L Vit D group: N = 35 Placebo group: N = 36 | randomized, controlled, double-blind study | Duration of treatment: 16 weeks: Vit D group: 50.000 IU vitamin D weekly | vitamin D supplementation decreased TGs and TG/HDL |
| Heikkinen A M et al. (1997) [60] | Finland | Postmenopausal women in hormone replacement therapy | 464 ♀ HRT group N = 65 Age: 52.9 ± 0.29 yrs Vit D N = 83 Age: 52.8 ± 0.24 yrs HRT + Vit D N = 77 Age: 52.4 ± 0.28 yrs Placebo N = 95 Age: 52.5 ± 0.22 yrs | interventional study | Duration of treatment: 3 yrs: HRT (2 mg estradiol valerate + 1 mg cyproterone acetate) Vit D3 (cholecalciferol 300 IU/day) HRT + Vit D3 (both as above), Placebo (calcium lactate 500 mg/day) | vitamin D had no effect on serum lipid levels |
| Zittermann A. et al. (2009) [114] | Germany | Overweight/obese | 200 overweight subjects 25OHD status= 12 ng/mL Vit D group: N = 82 Age: 47.4 ± 10.3 yrs Placebo group: N = 83 Age: 48.8 ± 10.1 yrs | double-blind placebo-controlled intervention trial | Duration of treatment: 12 months: Vit D group: 83.3 mcg/day (3332 IU) cholecalciferol/daily | vitamin D reduced TGs and increased LDL-C |
| von Hurst P. et al. (2010) [70] | New Zealand | Insulin resistance | 81 ♀ insulin resistant 25OHD status < 50 nmol/L Vit D group: N = 42 Age: 41.8 ± 10.1 yrs Placebo: N = 39 Age: 41.5 ± 9.1 yrs | randomized, placebo- controlled, double-blind trial | Duration of treatment: 6 months: Vit D: cholecalciferol 4000 IU/day | vitamin D had no effect on serum lipid levels |
| Nagpal J. et al. (2009) [66] | India | Healthy | 100 ♂ Vit D: N = 35 Age: 42.4 ± 6.6 yrs Control: N = 36 Age: 45.0 ± 9.2 yrs | double-blind randomized controlled trial | Duration of treatment: 6 weeks: Vit D: 3 doses of vitamin D (120,000 IU) fortnightly | vitamin D had no effect on serum lipid levels |
| Witham M D et al. (2013) [69] | UK | Healthy | 50 ♀ Vit D group N = 25 Age: 41.7 ± 13.4 yrs 25OHD status: 27 ± 13 nmol/L Placebo N = 25 Age: 39.4 ± 11.8 yrs 25OHD status: 28.7 ± 5.5 nmol/L | parallel-group, double-blind, randomized placebo-controlled trial. | Duration of treatment: 8 week: Vit D group: a single dose of 100,000 IU vitamin D3 | vitamin D had no effect on serum lipid levels |
| Shab-Bidar S. et al. (2011) [103] | Iran | T2DM | 43 ♂–57 ♀ T2DM (52.5 ± 7.4 yrs) PYD group: N = 50 FYD group: N = 50 | randomized controlled clinical trial (RCT) | Duration of treatment: 12 weeks: PYD: yogurt drink (170 mg calcium) twice a day; FYD: D-fortified yogurt drink (170 mg calcium + Vit D 500 IU/250 mL) twice a day | vitamin D decreased TGs, TC and LDL-C and increased HDL-C |
| Nikooyeh B. et al. (2011) [68] | Iran | T2DM | 35 ♂–55 ♀ T2DM Age: 50.7 ± 6.1 yrs PY: N = 30 DY: N = 30 DCY: N = 30 | interventional study | Duration of treatment: 12 weeks: PY= plain yogurt (150 mg Ca) twice per day; DY = vit D-fortified yogurt drink (500 IU vitamin D3 and 150 mg Ca) twice per day; DCY = calcium + vit D-fortified yogurt drink (500 IU vitamin D3 and 250 mg Ca) twice per day; | vitamin D had no effect on serum lipid levels |
| Wood A. et al. (2012) [71] | UK | Healthy post menopausal women | 305 healthy PMO ♀ Age: 63.8 ± 2.2 yrs Vit D 400 IU: N = 102 25OHD status: 32.7 ± 12.9 nmol/L Vit D 1000 IU: N = 101 25OHD status: 32.4 ± 13.8 nmol/L Placebo: N = 102 25OHD status: 36.2 ± 17.1 nmol/L | parallel-group, double-blind, placebo-controlled randomized controlled trial. | Duration of treatment: 1 yrs: Vit D3 400 UI daily Vit D3 1000 UI daily | vitamin D had no effect on serum lipid levels |
| Muldowney S. et al. (2012) [73] | Ireland | Healthy | aged 20–40 yrs N = 202 Age: 29.9 ± 6 yrs 25OHD status: 70.4 nmol/L aged > 64 yrs N = 192 Age: 70.8 ± 5 yrs 25OHD status: 54.2 nmol/L | two separate, identical, double-blind, randomized, placebo-controlled intervention studies | Duration of treatment: 22 weeks in winter: All group assumed doses of 0, 5, 10, or 15 mcg daily of cholecalciferol | vitamin D had no effect on serum lipid levels |
| Chai W. et al. (2013) [72] | Hawaii | Patients with colorectal adenoma | 92 colorectal adenoma (30–75 yrs of age) Placebo Group: N = 23 Age: 58.5 ± 21.2 yrs Ca group: N = 23 Age: 61.9 ± 8.2 yrs Vit D group: N = 23 Age: 60.2 ± 8.1 yrs Ca + Vit D group: N = 23 Age: 62.1 ± 7.5 yrs | pilot, randomized, double-blind, placebo-controlled, 2 × 2 factorial design, 6-month clinical trial | Duration of treatment: 6 months: Ca group: calcium carbonate 1 g twice daily Vit D group: cholecalciferol 400 IU twice daily Ca + Vit D group: calcium carbonate 1 g twice daily + 400 IU vitamin D twice daily | vitamin D had no effect on serum lipid levels |
| Breslavsky A. et al. (2013) [74] | Israel | T2DM | 47 T2DM patients Group Vit D N = 24 Age: 66.8 ± 9.2 yrs 25OHD status: 12.91 ± 10.69 ng/mL Group placebo N = 23 Age: 65.8 ± 9.7 yrs 25OHD status: = 10.79 ± 6.57 ng/mL | randomized, double-blind, placebo-controlled study | Duration of treatment: 12 months: Group Vit D: cholecalciferol 1000 IU/day | vitamin D had no effect on serum lipid levels |
| Sadiya A. at al. (2015) [75] | UAE | Obese and T2DM | 87 obese and T2DM Vit D group: N = 45 Age: 49 ± 8 yrs 25OHD status: 28.5 ± 9.2 nmol/L Placebo group: N = 45 Age: 48 ± 8 yrs 25OHD status: 30.5 ± 11.3.2 nmol/L | randomized double-blind clinical trial | Duration of treatment: 3 months: Vit D group 6000 IU vit D/day For 3 months: Vit D group 3000 IU vit D/day For 6 months: All 2200 IU vit D/day | vitamin D had no effect on serum lipid levels |
| Moghassemi S et al. (2014) [76] | Iran | Healthy postmenopausal women | 76 ♀ healthy PM Vit D group: N = 43 Age: 52.73 ± 4.56 yrs 25OHD status: 34.45 ± 4.9 nmol/L Placebo group: N = 36 Age 51.90 ± 9.94 yrs 25OHD status 33.13 ± 19.77 nmol/L | randomized, double-blind, placebo-controlled, parallel-group study | Duration of treatment: 12 weeks: Vit D3 group: 2000 IU once daily | vitamin D had no effect on serum lipid levels |
| Dalbeni A. et al. (2014) [78] | Italy | Chronic heart failure patients | 23 chronic HF patients Vit D group: N = 13 Age: 71.2 (67.0–75.4) yrs 25OHD status: 16.2 (11.8–20.7) ng/mL Placebo group: N = 10 Age: 73.4 (64.1–82.7) yrs 25OHD status: 16.0 (11.9–20.2) ng/mL | a double-blind, randomized, placebo-controlled trial | Duration of treatment: 6 months; 4000 IU/daily of cholecalciferol | vitamin D had no effect on serum lipid levels |
| Ryu O. et al. (2014) [79] | Korea | T2DM | 62 T2DM subjects Vit D group: N = 40 Age: 54.5 ± 7.4 yrs 25OHD status: 10.7 ± 2.6 ng/mL Placebo group: N = 41 Age: 56.7 ± 7.9 yrs 25OHD status: 12.3 ± 3.0 ng/mL | prospective, randomized, double-blind-ed, placebo-controlled trial | Duration of treatment: 24 weeks; Vit D group: 1000 IU of cholecalciferol + 100 mg calcium twice daily Placebo group: 100 mg calcium twice daily | vitamin D had no effect on serum lipid levels |
| Yousefi Rad E. et al. (2014) [58] | Iran | T2DM | 58 T2DM subjects Vit D group: N = 28 Age: 50.03 yrs 25OHD status: 15.55 ± 1.91 ng/mL Placebo group: N = 30 Age: 49.9 yrs 25OHD status: 14.64 ± 2.22 ng/mL | randomized controlled trial study | Duration of treatment: 2 months: 4000 IU Vitamin D/day | HDL-C level increased significantly in both groups |
| Kim HJ. et al. (2014) [80] | Korea | T2DM | 52 T2DM subjects Vit D + Training group: N = 15 Age: 69.53 ± 0.84 yrs 25OHD status: 11.91 ± 1.66 ng/mL Training group: N = 13 Age: 68.54 ± 1.18 yrs 25OHD status: 13.05 ± 1.43 ng/mL Vit D group: N = 11 Age: 73.27 ± 2.0 6 yrs 25OHD status: 10.44 ± 1.80 ng/mL Control group: N = 13 Age: 70.08 ± 1.37 yrs 25OHD status: 11.66 ± 2.80 ng/mL | interventional study | Duration of treatment: 12 weeks: Vit D + Training group: Vitamin D 1200 IU + exercise 3–4 times/week for 20 min Training group: exercise Vit D group: vitamin D 1200 IU per day | vitamin D combined with exercise training reduced TC, TGs, LDL-C and increase HDL-C |
| Kampmann U. et al. (2014) [81] | Denmark | T2DM | 16 T2DM patients Vit D group: N = 8 Age: 61.6 ± 4.4 yrs 25OHD status: 31.0 ± 4.9 nmol/L Placebo group: N = 8 Age: 57 ± 4.5 yrs 25OHD status: 34.8 ± 3.8 nmol/L | a randomized, placebo-controlled, double-blind trial | Duration of treatment: 2 weeks: Vit D group: cholecalciferol 11,200 IU daily For 10 weeks: Vit D group: cholecalciferol 5600 IU daily | vitamin D had no effect on serum lipid levels |
| Eftekhari MH et al. (2014) [59] | Iran | T2DM | 70 T2DM patients Treatment group: N = 35 Age: 53.8 ± 8.9 yrs Placebo group: N = 35 Age: 52.4 ± 7.8 yrs | double-blind randomized placebo-controlled | Duration of treatment: 12 weeks: Treatment group: Calcitriol 0.25 mcg twice/day | there was a reduction in TC, TGs and LDL-C in all groups; HDL-C only in placebo group |
| Al-Zahrani MK et al. (2014) [82] | Saudi Arabia | T2DM | 200 T2DM patients Vit D group: N = 100 Age: 56.9 ± 9.4 yrs 25OHD status: 25.3 ± 13.8 nmol/L Placebo group: N = 100 Age: 52.5 ± 8.1 yrs 25OHD status: 22.0 ± 15.2 nmol/L | randomized placebo-controlled | Duration of treatment: 3 months: Vit D group: cholecalciferol 45,000 IU orally once every week for 2 months and a single 45,000 I.U. dose in the last month | vitamin D had no effect on serum lipid levels |
| Asemi Z et al. (2015) [94] | Iran | Overweight/obese women with PCOS | 104 ♀ overweight and obese with PCOS Placebo group: N = 26 Age: 24.3 ± 5.2 yrs 25OHD status: 14.0 ± 4.1 ng/mL Calcium group: N = 26 Age 25.0 ± 6.7 yrs 25OHD status: 13.9 ± 2.0 ng/mL Vit D group: N = 26 Age 25.6 ± 4.4 yrs 25OHD status: 11.6 ± 4.7 ng/mL Vit D + Calcium group: N = 26 Age: 24.9 ± 5.1 yrs 25OHD status: 15.1 ± 3.6 ng/mL | randomized double-blind placebo controlled clinical trial | Duration of treatment: 8 weeks Calcium group: 1000 mg/d calcium Vit D group: 50,000 IU/week Vit D + calcium group: 1000 mg calcium/d + 50.000 IU/week | calcium + vitamin D reduced TGs and VLDL-C |
| Qin XF et al. (2015) [95] | China | Hypercholesterolemia | 56 subjects with hypercholesterolemia Vit D group: N = 100 Age: 67.7 ± 8.9 yrs 25OHD status: 21.1 ± 11.7 ng/mL Placebo group: N = 100 Age: 67.8 ± 8.1 yrs 25OHD status: 21.2 ± 11.4 ng/mL | single-center, double-blind, placebo-controlled trial | Duration of treatment: 6 months: Vit D group: add-on to statin vitamin D 2000 IU/day | vitamin D reduced TC, LDL-C and TGs and increase HDL-C |
| Muñoz-Aguirre P. at al. (2015) [96] | Mexico | T2DM | 104 ♀ T2DM Vit D group: N = 52 Age: 56.1 ± 5.1 yrs 25OHD status: 54.8 ± 14.3 nmol/L Placebo group: N = 52 Age: 57.4 ± 5.0 yrs 25OHD status: 54.3 ± 17.1 nmol/L | randomized, double-blind, placebo-controlled, | Duration of treatment: 6 months; Vit D group: 4000 IU vitamin D daily | vitamin D reduced TGs |
| Jafari T. et al. (2015) [55] | Iran | T2DM | 59 ♀ T2DM Vit D fortified yogurt (FY): N = 30 Age: 57.8 ± 5.5 yrs 25OHD status: 62.23 ± 4.52 nmol/L plain yogurt (PY): N = 29 Age: 56.8 ± 5.7 yrs 25OHD status: 62.72 ± 4.27 nmol/L | double-blind randomized placebo-controlled trial | Duration of treatment: 12 weeks: FY: 2000 IU vitamin D in 100 g/day | vitamin D had no effect on serum lipid levels |
| Riek AE et al. (2018) [109] | USA | T2DM | 26 T2DM patients 25OHD: 17 ng/mL Vit D group: N = 11 Age: 57.6 ± 1.9 yrs Placebo group: N = 15 Age: 57.4 ± 1.8 yrs | interventional study | Duration of treatment: 4 months: Vit D group: vitamin D 4000 IU/day | vitamin D had no effect in plasma lipid (vitamin D reduced total monocyte cholesterol content by suppressing oxidized LDL cholesterol uptake) |
| Liyanage GC. et al. (2017) [106] | Sri Lanka | T2DM + early stage nephropathy | 85 T2DM + early stage nephropathy patients Vit D3 group: N = 42 Age: 56 ± 10 yrs 25OHD status: 55.9 ± 12.3 nmol/L Placebo group: N = 43 Age: 59 ± 8 yrs 25OHD status: 50.0 ± 9 nmol/L | randomized double-blind clinical trial | Duration of treatment: 6 months: 50.000 UI vitamin D/month intramuscularly | vitamin D reduce TC, LDL-C and increase HDL-C |
| Jamilian M. et al. (2017) [97] | Iran | Gestational diabetes | 140 ♀ GDM Placebo: N = 35 Age: 30.7 ± 4.1 yrs 25OHD status: 16.6 ± 2.6 ng/mL Vit D: N = 35 Age: 31.5 ± 7.0 yrs 25OHD status: 15.2 ± 3.8 ng/mL Omega-3: N = 35 Age: 30.7 ± 3.5 yrs 25OHD status: 16.9 ± 3.5 ng/mL Vit D + Omega-3: N = 35 Age: 31.2 ± 4.3 yrs 25OHD status: 15.5 ± 3.1 ng/mL | randomized double-blind placebo-controlled clinical trial | Duration of treatment: 6 weeks: Vit D: 50,000 IU vitamin D every 2 weeks Omega-3: 1000 mg omega 3 twice a day Vit D + Omega-3: 50,000 IU vitamin D every 2 weeks + 1000 mg omega 3 twice a day | in the group with vit D + omega 3 co-supplementation there was a reduction in TGs |
| Ghaderi A. et al. (2017) [98] | Iran | Patients in maintenance methadone treatment | 68 MMT subjects Vit D3 group N = 34 Age: 42.5 ± 8.9 yrs 25OHD status: 13.9 ± 4.5 ng/mL Placebo group N = 34 Age: 40.1 ± 9.2 yrs 25OHD status: 13.5 ± 4.5 ng/mL | randomized, double-blind, placebo-controlled, clinical trial | Duration of treatment: 12 weeks: Vit D: 50,000 IU vitamin D every 2 weeks | vitamin D supplementation reduced TC, TGs, LDL-C and increased HDL-C |
| Ghaderi A. et al. (2019) [99] | Iran | Chronic schizophrenia patients | 60 chronic schizophrenia patients Vit D3 group N = 30 Age: 44.8 ± 8.3 yrs 25OHD status: 15.0 ± 4.1 ng/mL Placebo group N = 30 Age: 43.2 ± 6.0 yrs 25OHD status: 13.7 ± 3.2 ng/mL | randomized, double-blind, placebo-controlled, clinical trial | Duration of treatment: 12 weeks: Vit D: 50,000 IU vitamin D + probiotic every 2 weeks Placebo: probiotic | vitamin D + probiotic reduced TGs, TC, LDL-C and VLDL-C |
| Tamadon M. et al. (2018) [77] | Iran | Diabetic patients on hemodialysis | 60 diabetic hemodialysis patients Vit D group: N = 30 Placebo group: N = 30 | randomized, double-blind, placebo-controlled, clinical trial | Duration of treatment: 12 weeks: Vit D: 50.000 UI every 2 weeks; | vitamin D had no effect on serum lipid levels |
| Yarparvar A. et al. (2020) [43] | Austria | Healthy | 71 healthy adolescent boys (age 17 yrs) Vit D group: N = 34 25OHD status: 24.16 ± 10.16 ng/mL Placebo group: N = 37 25OHD status: 22.15 ± 12.33 ng/mL | randomized single-blind placebo-controlled trial | Duration of treatment: 6 months: Vit D: 50.000 IU monthly | vitamin D reduced TC and LDL-C |
| Schwetz V. at al. (2018) [113] | Austria | Hypertension | 163 subjects with hypertension Vit D3 group N = 79 Age: 62.2 yrs 25OHD status: 52.5 nmol/L Placebo group N = 84 Age: 62.1 yrs 25OHD status: 58.8 nmol/L | single-center, double-blind, randomized, placebo-controlled | Duration of treatment: 8 weeks: Vit D group: 2800 IU of vitamin D daily | vitamin D increased TC and TGs |
| Hafez M. at al. (2019) [83] | Egypt | T1DM children | 50 children with T1DM (for >2 yrs) and dyslipidemia VD sufficiency (>30 ng/mL) N = 20 VD deficiency (VDD) or insufficiency (<29 ng/mL) N = 30 | prospective cohort study | Duration of treatment: 4 months: VDD: 4000 UI/day of vitamin D | vitamin D had no effect on serum lipid levels |
| Mohamad M.at al. (2016) [84] | Egypt | T2DM | 100 T2DM patients Age: 47.35 ± 6 25OHD status: 16 ± 5.3 ng/mL | interventional study | Duration of treatment: 2 months: 4500 IU/day of vitamin D | vitamin D had no effect on serum lipid levels |
| Miao J. et al. (2021) [100] | USA | Hypertension | 289 subjects at high risk of hypertension Age: 37.0 yrs 25OHD status: 15.1 ng/mL Low-dose Vit D: N = 144 High-dose Vit D: N = 145 | randomized, double-blind, controlled trial | Duration of treatment: 6 months: Low-dose Vit D: 400 IU/daily vitamin D; High-dose Vit D: 4000 IU/daily vitamin D | vitamin D increased TGs in high-dose vitamin D group |
| Jastrzebski Z.at al. (2016) [85] | Poland | Healthy | 16 professional rowers Vit D group N = 8 Age: 23.1 ± 2.7 yrs 25OHD status: 35.7 ± 17.0 nmol/L Placebo group N = 8 Age: 23.1 ± 3.2 yrs 25OHD status: 31.4 ± 15.2 nmol/L | interventional study | Duration of treatment: 4 weeks: Vit D: 5.000 IU of vitamin D every day | vitamin D had no effect on serum lipid levels |
| Khosravi ZS et al. (2018) [86] | Iran | Overweight/obese | 53 ♀ overweight and obese Intervention N = 26 Age: 29.1 ± 9.6 yrs 25OHD status: 22 ± 6.5 nmol/L Placebo N = 27 Age: 26.9 ± 9.1 yrs 25OHD status: 18 ± 5 nmol/L | double-blind clinical trial study | Duration of treatment: 6 weeks: Intervention: 50.000 IU/week | vitamin D had no effect on serum lipid levels |
| Ramiro-Lozano JM et al. (2015) [104] | Spain | T2DM | 28 T2DM Age: 71.7 ± 9.6 25OHD status: 10.6 ± 3.6 | interventional study | Duration of treatment: 8 weeks: 16.000 IU of calcifediol orally once a week | vitamin D decreased TC and LDL-C |
| Hu J. et al. (2018) [111] | China | Mild cognitive impairment | 181 subjects with mild cognitive impairment Vit D N = 93 Age: 67.22 ± 6.09 yrs 25OHD status: 19.07 ± 2.91 ng/mL Placebo N = 88 Age: 66.60 ± 5.24 yrs 25OHD status: 19.77 ± 2.91 ng/mL | randomized, double-blind, placebo-controlled trial | Duration of treatment: 12 months: Vit D: 400 UI/day vitamin D | vitamin D reduced TC, TGs, HDL-C and LDL-C |
| Angellotti E. et al. (2019) [88] | USA | T2DM | 127 T2DM patients Vit D N = 66 Age: 60.1 ± 8.4 yrs 25OHD status: 26.6 ± 11.1 ng/mL Placebo N = 61 Age: 60.1 ± 8.1 yrs 25OHD = 25.8 ± 10.3 ng/mL | double-blind, randomized, placebo-controlled clinical trial | Duration of treatment: 48 weeks: Vit D: 4000 IU/day of vit D | vitamin D had no effect on serum lipid levels |
| Al-Daghri NM et al. (2012) [101] | Saudi Arabia | T2DM | 34 ♂ 58 ♀ T2DM patients Vit D levels baseline: 32.2 ± 1.5 nmol/L | multi-center, interventional study | Duration of treatment: 18 months: 2000 IU vitamin D daily | vitamin D supplementation reduced TC and LDL-C and increased HOMA-IR |
| Dutta D. et al. (2014) [87] | India | Prediabetes and diabetes | 121 Prediabetic and diabetic subjects Group A: N = 68 Age: 48.37 ± 10.47 yrs 25OHD status: 17.04 ± 7.66 ng/mL Group B: N = 57 Age: 47.4 ± 11.51 yrs 25OHD status: 18 ± 7.16 ng/mL Group C: N = 45 Age: 46.6 ± 11.01 yrs 25OHD status: 37.89 ± 8.26 ng/mL | interventional study | Duration of treatment: 12 months: Group A: cholecalciferol 60,000 UI/once weekly for 8 weeks than monthly for 12 months + calcium carbonate 1250 mg/day; Group B: calcium carbonate Group C: calcium carbonate All: lifestyle interventions | vitamin D supplementation in prediabetes and diabetes is associated with an improvement in dyslipidemia |
| Bhatt SP et al. (2020) [89] | India | Prediabetes | 121 ♀ prediabetes Aged 20–60 yrs Intervention N = 61 25OHD status: 29.9 ± 5.9 nmol/L Placebo N = 60 25OHD status: 32.1 ± 5.2 nmol/L | open-label randomized placebo-controlled trial | Duration of treatment: 8 weeks: Intervention: cholecalciferol 60,000 IU once per week | vitamin D had no effect on serum lipid levels |
| Jorde R. et al. (2016) [116] | Norway | Prediabetes | 511 subjects with prediabetes Vit D N = 256 Age: 62.3 ± 8.1 yrs 25OHD status: 24 ± 8.8 ng/mL Placebo N = 255 Age: 61.9 ± 9.2 yrs 25OHD status: 24.4 ± 8.5 ng/mL | randomized controlled trial | Duration of treatment: 5 yrs: Vit D: cholecalciferol 20,000 IU weekly for | in the vit D group, there was a decrease in LDL-C only at 1 year |
| Rajabi-Naeeni M. et al. (2020) [107] | Iran | Prediabetes | 168 ♀ prediabetes Placebo: N = 42 Age: 41.8 ± 7.8 yrs 25OHD status: 25.5 ± 5.8 ng/mL Omega-3: N = 42 Age: 39.8 ± 6.9 yrs 25OHD status: 23.6 ± 6.4 ng/mL Vit D: N = 42 Age: 39.9 ± 6.0 yrs 25OHD status: 21.4 ± 8.0 ng/mL Vit D + Omega-3: N = 42 Age: 39.0 ± 7.7 yrs 25OHD status: 22.0 ± 8.9 ng/mL | factorial, triple-blind clinical trial | Duration of treatment: 8 weeks: Omega-3: 1000 mg omega 3 twice daily Vit D: cholecalciferol 50,000 IU every 2 weeks Vit D + Omega-3: 1000 mg omega 3 twice daily + cholecalciferol 50,000 IU every 2 weeks | TC, TGs and LDL-C decrease and HDL-C increase in the vit D + omega 3 group TC and LDL-C decrease in Vit D group |
| Misra P. et al. (2021) [90] | India | Prediabetes | 132 ♀ prediabetes Intervention N = 67 Age: 48.1 ± 6.7 yrs 25OHD status: 27.6 ± 6.5 ng/mL Placebo N = 65 Age: 46.1 ± 8.1 yrs 25OHD status: 27.7 ± 14.6 ng/mL | open-label randomized placebo-controlled trial | Duration of treatment: 8 weeks: Intervention: cholecalciferol 60,000 IU + calcium carbonate 1 gr Placebo: calcium carbonate 1 gr | vitamin D had no effect on serum lipid levels |
| Sacheck J. et al. (2022) [105] | USA | Healthy children | 604 children (8–15 yrs) 600 UI group: N = 207 25OHD status: 21.9 ± 0.5 ng/mL 1000 UI group: N = 190 25OHD status: 21.7 ± 0.5 ng/mL 2000 UI group: N = 207 25OHD status: 22.4 ± 0.5 ng/mL | a randomized double-blind clinical trial | Duration of treatment: 6 months: 600 IU or 1000 IU or 2000 IU daily | vitamin D at low dosage increased HDL-C and at high dosage decreased LDL-C and TC |
| Samimi M et al. (2015) [108] | Iran | Pregnant women at risk of pre-eclampsia | 60 ♀ pregnancy at risk of risk for pre-eclampsia Vit D group: N = 30 Age: 27.3 ± 3.7 yrs 25OHD status: 13.1 ± 6.4 ng/mL Placebo: N = 30 Age: 27.1 ± 5.2 yrs 25OHD status: 16.2 ± 3.5 ng/mL | prospective, double-blind, placebo-controlled trial | Duration of treatment: 20 to 30 weeks of gestation: Vit D group: 50,000 IU cholecalciferol every 2 weeks + calcium 1000 mg day | vit D + calcium increased serum HDL-C |
| Sabico S et al. (2023) [112] | Saudi Arabia | Healthy | 58 ♂ 62 ♀ healthy adults age 40.6 ± 10.8 yrs 25OHD status < 50 nmol/L | interventional study | Duration of treatment: 6 months: 50,000 IU cholecalciferol weekly once for first 2 months, then once in two weeks for month 3 and 4, and a daily dose of 1000 IU for the last two months | vitamin D increased HDL-C and reduced ASCVD risk score |
| Bahramian H et al. (2023) [117] | Iran | PCOS | 80 PCOS ♀ vit D < 20 ng/mL Vit D N = 18 Age 23.6 ± 3.4 yrs Omega 3 N = 20 Age 22.3 ± 3.6 yrs Vit D + Omega-3 N = 20 Age 24.6 ± 3.1 yrs Placebo N = 18 Age 22.3 ± 3.1 yrs | double-blind, randomized clinical trial | Duration of treatment: 6 weeks 50,000 IU/weekly Omega-3 | vitamin D + Omega-3 treatment reduce TC |
| Safari S et al. (2023) [118] | Iran | subclinical hypothyroidism | 44 ♀ subclinical hypothyroidism Vit D N = 22 Age 36.3 ± 11.6 yrs placebo N = 22 Age 36.0 ± 11.125 yrs | randomized, double-blind, placebo-controlled clinical trial | Duration of treatment: 12 weeks 50,000 IU/week of vitamin D | vitamin D reduce TC |
| Ku CW et al. (2024) [119] | Overweight/obese pregnant women | Intervention N = 137 Age: 30.5 ± 4.6 yrs 25OHD = 39.9 4 ± 17.0 nmol/L Control N = 137 Age: 30.6 ± 4.2 yrs 25OHD = 38.9 ± 11.97 nmol/L | two-arm, parallel, non-blind randomized controlled trial | Duration of treatment: from week 16 of gestation to delivery Intervention: 800 UI/daily of Vit D Control: 400 UI/daily of Vit D | vitamin D had no effect on serum lipid levels |
4. Discussion
5. Conclusions
Author Contributions
Funding
Data Availability Statement
Conflicts of Interest
References
- Rai, V.; Agrawal, D.K. Role of Vitamin D in Cardiovascular Diseases. Endocrinol. Metab. Clin. N. Am. 2017, 46, 1039–1059. [Google Scholar] [CrossRef]
- Prabhu, A.V.; Luu, W.; Sharpe, L.J.; Brown, A.J. Cholesterol-mediated Degradation of 7-Dehydrocholesterol Reductase Switches the Balance from Cholesterol to Vitamin D Synthesis. J. Biol. Chem. 2016, 29, 8363–8373. [Google Scholar] [CrossRef]
- Zou, L.; Porter, T.D. Rapid suppression of 7-dehydrocholesterol reductase activity in keratinocytes by vitamin D. J. Steroid Biochem. Mol. Biol. 2015, 148, 64–71. [Google Scholar] [CrossRef]
- Xia, Z.; Hu, Y.; Han, Z.; Gao, Y.; Bai, J.; He, Y.; Zhao, H.; Zhang, H. Association of vitamin D receptor gene polymorphisms with diabetic dyslipidemia in the elderly male population in North China. Clin. Interv. Aging 2017, 12, 1673–1679. [Google Scholar] [CrossRef][Green Version]
- Hajj, A.; Chedid, R.; Chouery, E.; Megarbané, A.; Gannagé-Yared, M.H. Relationship between vitamin D receptor gene polymorphisms, cardiovascular risk factors and adiponectin in a healthy young population. Pharmacogenomics 2016, 17, 1675–1686. [Google Scholar] [CrossRef]
- He, L.; Wang, M. Association of vitamin d receptor-a gene polymorphisms with coronary heart disease in Han Chinese. Int. J. Clin. Exp. Med. 2015, 8, 6224–6229. [Google Scholar]
- Jia, J.; Tang, Y.; Shen, C.; Zhang, N.; Ding, H.; Zhan, Y. Vitamin D receptor polymorphism rs2228570 is significantly associated with risk of dyslipidemia and serum LDL levels in Chinese Han population. Lipids Health Dis. 2018, 17, 193. [Google Scholar] [CrossRef]
- Gonzalez, F.J.; Moschetta, A. Potential role of the vitamin D receptor in control of cholesterol levels. Gastroenterology 2014, 146, 899–902. [Google Scholar] [CrossRef]
- Jiang, W.; Miyamoto, T.; Kakizawa, T.; Nishio, S.I.; Oiwa, A.; Takeda, T.; Suzuki, S.; Hashizume, K. Inhibition of LXRalpha signaling by vitamin D receptor: Possible role of VDR in bile acid synthesis. Biochem. Biophys. Res. Commun. 2006, 351, 176–184. [Google Scholar] [CrossRef]
- Li, S.; He, Y.; Lin, S.; Hao, L.; Ye, Y.; Lv, L.; Sun, Z.; Fan, H.; Shi, Z.; Li, J.; et al. Increase of circulating cholesterol in vitamin D deficiency is linked to reduced vitamin D receptor activity via the Insig-2/SREBP-2 pathway. Mol. Nutr. Food Res. 2016, 60, 798–809. [Google Scholar] [CrossRef]
- Hussain, M.M.; Nijstad, N.; Franceschini, L. Regulation of microsomal triglyceride transfer protein. Clin. Lipidol. 2011, 6, 293–303. [Google Scholar] [CrossRef] [PubMed]
- Martins, D.; Wolf, M.; Pan, D.; Zadshir, A.; Tareen, N.; Thadhani, R.; Felsenfeld, A.; Levine, B.; Mehrotra, R.; Norris, K. Prevalence of cardiovascular risk factors and the serum levels of 25-hydroxyvitamin D in the United States: Data from the Third National Health and Nutrition Examination Survey. Arch. Intern. Med. 2007, 167, 1159–1165. [Google Scholar] [CrossRef] [PubMed]
- Ginsberg, H.N.; Zhang, Y.L.; Hernandez-Ono, A. Regulation of plasma triglycerides in insulin resistance and diabetes. Arch. Med. Res. 2005, 36, 232–240. [Google Scholar] [CrossRef] [PubMed]
- Malekmohammad, K.; Bezsonov, E.E.; Rafieian-Kopaei, M. Role of Lipid Accumulation and Inflammation in Atherosclerosis: Focus on Molecular and Cellular Mechanisms. Front. Cardiovasc. Med. 2021, 8, 707529. [Google Scholar] [CrossRef] [PubMed]
- Riek, A.E.; Oh, J.; Bernal-Mizrachi, C. 1,25(OH)2 vitamin D suppresses macrophage migration and reverses atherogenic cholesterol metabolism in type 2 diabetic patients. J. Steroid Biochem. Mol. Biol. 2013, 136, 309–312. [Google Scholar] [CrossRef] [PubMed]
- Auwerx, J.; Bouillon, R.; Kesteloot, H. Relation between 25-hydroxyvitamin D3, apolipoprotein A-I, and high density lipoprotein cholesterol. Arterioscler. Thromb. 1992, 12, 671–674. [Google Scholar] [CrossRef] [PubMed]
- Jiang, X.; Peng, M.; Chen, S.; Wu, S.; Zhang, W. Vitamin D deficiency is associated with dyslipidemia: A cross-sectional study in 3788 subjects. Curr. Med. Res. Opin. 2019, 35, 1059–1063. [Google Scholar] [CrossRef] [PubMed]
- Chaudhuri, J.R.; Mridula, K.R.; Anamika, A.; Boddu, D.B.; Misra, P.K.; Lingaiah, A.; Balaraju, B.; Bandaru, V.S. Deficiency of 25-hydroxyvitamin d and dyslipidemia in Indian subjects. J. Lipids 2013, 2013, 623420. [Google Scholar] [CrossRef] [PubMed]
- Karhapää, P.; Pihlajamäki, J.; Pörsti, I.; Kastarinen, M.; Mustonen, J.; Niemelä, O.; Kuusisto, J. Diverse associations of 25-hydroxyvitamin D and 1,25-dihydroxy-vitamin D with dyslipidaemias. J. Intern. Med. 2010, 268, 604–610. [Google Scholar] [CrossRef]
- Guasch, A.; Bulló, M.; Rabassa, A.; Bonada, A.; Del Castillo, D.; Sabench, F.; Salas-Salvadó, J. Plasma vitamin D and parathormone are associated with obesity and atherogenic dyslipidemia: A cross-sectional study. Cardiovasc. Diabetol. 2012, 11, 149. [Google Scholar] [CrossRef]
- Botella-Carretero, J.I.; Alvarez-Blasco, F.; Villafruela, J.J.; Balsa, J.A.; Vázquez, C.; Escobar-Morreale, H.F. Vitamin D deficiency is associated with the metabolic syndrome in morbid obesity. Clin. Nutr. 2007, 26, 573–580. [Google Scholar] [CrossRef] [PubMed]
- Sharba, Z.F.; Shareef, R.H.; Abd, B.A.; Hameed, E.N. Association between Dyslipidemia and Vitamin D Deficiency: A Cross-Sectional Study. Folia Med. 2021, 63, 965–969. [Google Scholar] [CrossRef] [PubMed]
- Kostecka, D.; Schneider-Matyka, D.; Barczak, K.; Starczewska, M.; Szkup, M.; Ustianowski, P.; Brodowski, J.; Grochans, E. The effect of vitamin D levels on lipid, glucose profiles and depression in perimenopausal women. Eur. Rev. Med. Pharmacol. Sci. 2022, 26, 3493–3505. [Google Scholar] [PubMed]
- Saheb Sharif-Askari, F.; Saheb Sharif-Askari, N.; Halwani, R.; Abusnana, S.; Hamoudi, R.; Sulaiman, N. Low Vitamin D Serum Level Is Associated with HDL-C Dyslipidemia and Increased Serum Thrombomodulin Levels of Insulin-Resistant Individuals. Diabetes Metab. Syndr. Obes. 2020, 13, 1599–1607. [Google Scholar] [CrossRef] [PubMed]
- Guan, C.; Fu, S.; Zhen, D.; Li, X.; Niu, J.; Cheng, J.; Zhao, N.; Liu, J.; Yin, H.; Tang, X. Correlation of serum vitamin D with lipid profiles in middle-aged and elderly Chinese individuals. Asia Pac. J. Clin. Nutr. 2020, 29, 839–845. [Google Scholar]
- Han, Y.Y.; Hsu, S.H.; Su, T.C. Association between Vitamin D Deficiency and High Serum Levels of Small Dense LDL in Middle-Aged Adults. Biomedicines 2021, 9, 464. [Google Scholar] [CrossRef] [PubMed]
- Gong, T.; Di, H.; Han, X.; Hu, X.; Liu, C.; Chen, G. Vitamin D is negatively associated with triglyceride in overweight/obese patients with type 2 diabetes. Endocrine 2022, 76, 304–311. [Google Scholar] [CrossRef] [PubMed]
- Li, Y.; Tong, C.H.; Rowland, C.M.; Radcliff, J.; Bare, L.A.; McPhaul, M.J.; Devlin, J.J. Association of changes in lipid levels with changes in vitamin D levels in a real-world setting. Sci. Rep. 2021, 11, 21536. [Google Scholar] [CrossRef]
- Pathania, M.; Dhar, M.; Kumar, A.; Saha, S.; Malhotra, R. Association of Vitamin D Status with Metabolic Syndrome and Its Individual Risk Factors: A Cross-Sectional Study. Cureus 2023, 15, e38344. [Google Scholar] [CrossRef]
- Yang, K.; Liu, J.; Fu, S.; Tang, X.; Ma, L.; Sun, W.; Niu, Y.; Jing, G.; Niu, Q. Vitamin D Status and Correlation with Glucose and Lipid Metabolism in Gansu Province, China. Diabetes Metab. Syndr. Obes. 2020, 13, 1555–1563. [Google Scholar] [CrossRef]
- Cheng, Y.L.; Lee, T.I.; Chien, Y.M.; Lee, T.W.; Chen, Y.J. Vitamin D level regulates serum lipids discrepantly in adults with and without dyslipidemia. Endocr. Connect. 2023, 12, e230013. [Google Scholar] [CrossRef] [PubMed]
- Atia, T.; Abdelzaher, M.H.; Nassar, S.A.; Gafar, H.H.; Husseini, M.A.M.; Kaabi, A.M.Y.; Sakr, H.I. Investigating the relationship between vitamin-D deficiency and glycemia status and lipid profile in nondiabetics and prediabetics in Saudi population. Medicine 2023, 102, e36322. [Google Scholar] [CrossRef] [PubMed]
- Chen, C.W.; Han, Y.Y.; Hwang, J.S.; Rizzo, M.; Yamashita, S.; Hsu, S.H.; Su, T.C. Association Between Adequate Serum 25(OH)D Levels and Atherogenic Dyslipidemia in Young Adults. J. Atheroscler. Thromb. 2023, 64523. [Google Scholar] [CrossRef] [PubMed]
- Wang, Y.; Si, S.; Liu, J.; Wang, Z.; Jia, H.; Feng, K.; Sun, L.; Song, S.J. The Associations of Serum Lipids with Vitamin D Status. PLoS ONE 2016, 11, e0165157. [Google Scholar] [CrossRef] [PubMed]
- AlQuaiz, A.M.; Kazi, A.; Youssef, R.M.; Alshehri, N.; Alduraywish, S.A. Association between standardized vitamin 25(OH)D and dyslipidemia: A community-based study in Riyadh, Saudi Arabia. Environ. Health Prev. Med. 2020, 25, 4. [Google Scholar] [CrossRef] [PubMed]
- Kostrova, G.N.; Malyavskaya, S.I.; Lebedev, A.V. Relationship between vitamin D level and lipid profile in young adults. Vopr. Pitan. 2022, 91, 26–34. [Google Scholar] [CrossRef]
- Kim, M.R.; Jeong, S.J. Relationship between Vitamin D Level and Lipid Profile in Non-Obese Children. Metabolites 2019, 9, 125. [Google Scholar] [CrossRef] [PubMed]
- Delvin, E.E.; Lambert, M.; Levy, E.; O’Loughlin, J.; Mark, S.; Gray-Donald, K.; Paradis, G. Vitamin D status is modestly associated with glycemia and indicators of lipid metabolism in French-Canadian children and adolescents. J. Nutr. 2010, 140, 987–991. [Google Scholar] [CrossRef] [PubMed]
- Williams, D.M.; Fraser, A.; Lawlor, D.A. Associations of vitamin D, parathyroid hormone and calcium with cardiovascular risk factors in US adolescents. Heart 2011, 97, 315–320. [Google Scholar] [CrossRef]
- Rajakumar, K.; de las Heras, J.; Chen, T.C.; Lee, S.; Holick, M.F.; Arslanian, S.A. Vitamin D status, adiposity, and lipids in black American and Caucasian children. J. Clin. Endocrinol. Metab. 2011, 96, 1560–1567. [Google Scholar] [CrossRef]
- Birken, C.S.; Lebovic, G.; Anderson, L.N.; McCrindle, B.W.; Mamdani, M.; Kandasamy, S.; Khovratovich, M.; Parkin, P.C.; Maguire, J.L.; TARGet Kids! collaboration. Association between Vitamin D and Circulating Lipids in Early Childhood. PLoS ONE 2015, 10, e0131938. [Google Scholar] [CrossRef]
- Kelishadi, R.; Farajzadegan, Z.; Bahreynian, M. Association between vitamin D status and lipid profile in children and adolescents: A systematic review and meta-analysis. Int. J. Food Sci. Nutr. 2014, 65, 404–410. [Google Scholar] [CrossRef] [PubMed]
- Yarparvar, A.; Elmadfa, I.; Djazayery, A.; Abdollahi, Z.; Salehi, F. The Association of Vitamin D Status with Lipid Profile and Inflammation Biomarkers in Healthy Adolescents. Nutrients 2020, 12, 590. [Google Scholar] [CrossRef]
- Nouri Saeidlou, S.; Vahabzadeh, D.; Babaei, F.; Vahabzadeh, Z. Seasonal variations of vitamin D and its relation to lipid profile in Iranian children and adults. J. Health Popul. Nutr. 2017, 36, 21. [Google Scholar] [CrossRef]
- Song, K.; Park, G.; Choi, Y.; Oh, J.S.; Choi, H.S.; Suh, J.; Kwon, A.; Kim, H.S.; Chae, H.W. Association of Vitamin D Status and Physical Activity with Lipid Profile in Korean Children and Adolescents: A Population-Based Study. Children 2020, 7, 241. [Google Scholar] [CrossRef] [PubMed]
- Al-Ajlan, A.; Krishnaswamy, S.; Alokail, M.S.; Aljohani, N.J.; Al-Serehi, A.; Sheshah, E.; Alshingetti, N.M.; Fouda, M.; Turkistani, I.Z.; Al-Daghri, N.M. Vitamin D deficiency and dyslipidemia in early pregnancy. BMC Pregnancy Childbirth 2015, 15, 314. [Google Scholar] [CrossRef]
- Lepsch, J.; Eshriqui, I.; Farias, D.R.; Vaz, J.S.; Cunha Figueiredo, A.C.; Adegboye, A.R.; Brito, A.; Mokhtar, R.; Allen, L.H.; Holick, M.F.; et al. Association between early pregnancy vitamin D status and changes in serum lipid profiles throughout pregnancy. Metabolism 2017, 70, 85–97. [Google Scholar] [CrossRef]
- Jin, D.; Zhu, D.M.; Hu, H.L.; Yao, M.N.; Yin, W.J.; Tao, R.X.; Zhu, P. Vitamin D status affects the relationship between lipid profile and high-sensitivity C-reactive protein. Nutr. Metab. 2020, 17, 57. [Google Scholar] [CrossRef]
- Wang, L.; Liu, X.; Hou, J.; Wei, D.; Liu, P.; Fan, K.; Zhang, L.; Nie, L.; Li, X.; Huo, W.; et al. Serum Vitamin D Affected Type 2 Diabetes though Altering Lipid Profile and Modified the Effects of Testosterone on Diabetes Status. Nutrients 2020, 13, 90. [Google Scholar] [CrossRef]
- Saedisomeolia, A.; Taheri, E.; Djalali, M.; Moghadam, A.M.; Qorbani, M. Association between serum level of vitamin D and lipid profiles in type 2 diabetic patients in Iran. J. Diabetes Metab. Disord. 2014, 13, 7. [Google Scholar] [CrossRef]
- Huang, Y.; Li, X.; Wang, M.; Ning, H.A.L.; Li, Y.; Sun, C. Lipoprotein lipase links vitamin D, insulin resistance, and type 2 diabetes: A cross-sectional epidemiological study. Cardiovasc. Diabetol. 2013, 12, 17. [Google Scholar] [CrossRef] [PubMed]
- Faris Raheem, M.H.; Ali, S.; Shareef, L. Impact of serum levels of vitamin D on lipid profiles, glycemic indices, and insulin resistance in obese type 2 diabetes patients: An observational study. Research 2022, 11, 1002. [Google Scholar] [CrossRef]
- Howard, B.V. Insulin resistance and lipid metabolism. Am. J. Cardiol. 1999, 84, 28J–32J. [Google Scholar] [CrossRef] [PubMed]
- Talaei, A.; Mohamadi, M.; Adgi, Z. The effect of vitamin D on insulin resistance in patients with type 2 diabetes. Diabetol. Metab. Syndr. 2013, 5, 8. [Google Scholar] [CrossRef] [PubMed]
- Jafari, T.; Fallah, A.A.; Barani, A. Effects of vitamin D on serum lipid profile in patients with type 2 diabetes: A meta-analysis of randomized controlled trials. Clin. Nutr. 2016, 35, 1259–1268. [Google Scholar] [CrossRef]
- Ponda, M.P.; Huang, X.; Odeh, M.A.; Breslow, J.L.; Kaufman, H.W. Vitamin D may not improve lipid levels: A serial clinical laboratory data study. Circulation 2012, 126, 270–277. [Google Scholar] [CrossRef] [PubMed]
- Carlson, L.A.; Derblom, H.; Lanner, A. Effects of different doses of vitamin D on serum cholesterol and triglycerides in healthy men. Atherosclerosis 1970, 12, 313–317. [Google Scholar] [CrossRef] [PubMed]
- Yousefi Rad, E.; Djalali, M.; Koohdani, F.; Saboor-Yaraghi, A.A.; Eshraghian, M.R.; Javanbakht, M.H.; Saboori, S.; Zarei, M.; Hosseinzadeh-Attar, M.J. The effects of vitamin D supplementation on glucose control and insulin resistance in patients with diabetes type 2: A randomized clinical trial study. Iran. J. Public. Health 2014, 43, 1651–1656. [Google Scholar] [PubMed]
- Eftekhari, M.H.; Akbarzadeh, M.; Dabbaghmanesh, M.H.; Hassanzadeh, J. The effect of calcitriol on lipid profile and oxidative stress in hyperlipidemic patients with type 2 diabetes mellitus. ARYA Atheroscler. 2014, 10, 82–88. [Google Scholar]
- Heikkinen, A.M.; Tuppurainen, M.T.; Niskanen, L.; Komulainen, M.; Penttilä, I.; Saarikoski, S. Long-term vitamin D3 supplementation may have adverse effects on serum lipids during postmenopausal hormone replacement therapy. Eur. J. Endocrinol. 1997, 137, 495–502. [Google Scholar] [CrossRef][Green Version]
- Scragg, R.; Khaw, K.T.; Murphy, S. Effect of winter oral vitamin D3 supplementation on cardiovascular risk factors in elderly adults. Eur. J. Clin. Nutr. 1995, 49, 640–646. [Google Scholar]
- Andersen, R.; Brot, C.; Mejborn, H.; Mølgaard, C.; Skovgaard, L.T.; Trolle, E.; Ovesen, L. Vitamin D supplementation does not affect serum lipids and lipoproteins in Pakistani immigrants. Eur. J. Clin. Nutr. 2009, 63, 1150–1153. [Google Scholar] [CrossRef]
- Makariou, S.E.; Elisaf, M.; Challa, A.; Tentolouris, N.; Liberopoulos, E.N. No effect of vitamin D supplementation on cardiovascular risk factors in subjects with metabolic syndrome: A pilot randomised study. Arch. Med. Sci. Atheroscler. Dis. 2017, 2, e52–e60. [Google Scholar] [CrossRef] [PubMed]
- Makariou, S.E.; Elisaf, M.; Challa, A.; Tellis, C.C.; Tselepis, A.D.; Liberopoulos, E.N. No effect of vitamin D administration plus dietary intervention on emerging cardiovascular risk factors in patients with metabolic syndrome. J. Nutr. Intermed. Metab. 2019, 16, 100093. [Google Scholar] [CrossRef]
- Wongwiwatthananukit, S.; Sansanayudh, N.; Phetkrajaysang, N.; Krittiyanunt, S. Effects of vitamin D(2) supplementation on insulin sensitivity and metabolic parameters in metabolic syndrome patients. J. Endocrinol. Investig. 2013, 36, 558–563. [Google Scholar]
- Nagpal, J.; Pande, J.N.; Bhartia, A. A double-blind, randomized, placebo-controlled trial of the short-term effect of vitamin D3 supplementation on insulin sensitivity in apparently healthy, middle-aged, centrally obese men. Diabet. Med. 2009, 26, 19–27. [Google Scholar] [CrossRef]
- Yin, X.; Yan, L.; Lu, Y.; Jiang, Q.; Pu, Y.; Sun, Q. Correction of hypovitaminosis D does not improve the metabolic syndrome risk profile in a Chinese population: A randomized controlled trial for 1 year. Asia Pac. J. Clin. Nutr. 2016, 25, 71–77. [Google Scholar]
- Nikooyeh, B.; Neyestani, T.R.; Farvid, M.; Alavi-Majd, H.; Houshiarrad, A.; Kalayi, A.; Shariatzadeh, N.; Gharavi, A.; Heravifard, S.; Tayebinejad, N.; et al. Daily consumption of vitamin D- or vitamin D + calcium-fortified yogurt drink improved glycemic control in patients with type 2 diabetes: A randomized clinical trial. Am. J. Clin. Nutr. 2011, 93, 764–771. [Google Scholar] [CrossRef]
- Witham, M.D.; Adams, F.; Kabir, G.; Kennedy, G.; Belch, J.J.; Khan, F. Effect of short-term vitamin D supplementation on markers of vascular health in South Asian women living in the UK-a randomized controlled trial. Atherosclerosis 2013, 230, 293–299. [Google Scholar] [CrossRef]
- von Hurst, P.R.; Stonehouse, W.; Coad, J. Vitamin D supplementation reduces insulin resistance in South Asian women living in New Zealand who are insulin resistant and vitamin D deficient—A randomized, placebo-controlled trial. Br. J. Nutr. 2010, 103, 549–555. [Google Scholar] [CrossRef]
- Wood, A.D.; Secombes, K.R.; Thies, F.; Aucott, L.; Black, A.J.; Mavroeidi, A.; Simpson, W.G.; Fraser, W.D.; Reid, D.M.; Macdonald, H.M. Vitamin D3 supplementation has no effect on conventional cardiovascular risk factors: A parallel-group, double-blind, placebo-controlled RCT. J. Clin. Endocrinol. Metab. 2012, 97, 3557–3568. [Google Scholar] [CrossRef] [PubMed]
- Chai, W.; Cooney, R.V.; Franke, A.A.; Bostick, R.M. Effects of calcium and vitamin D supplementation on blood pressure and serum lipids and carotenoids: A randomized, double-blind, placebo-controlled, clinical trial. Ann. Epidemiol. 2013, 23, 564–570. [Google Scholar] [CrossRef] [PubMed]
- Muldowney, S.; Lucey, A.J.; Hill, T.R.; Seamans, K.M.; Taylor, N.; Wallace, J.M.; Horigan, G.; Barnes, M.S.; Bonham, M.P.; Duffy, E.M. Incremental cholecalciferol supplementation up to 15 μg/d throughout winter at 51–55° N has no effect on biomarkers of cardiovascular risk in healthy young and older adults. J. Nutr. 2012, 142, 1519–1525. [Google Scholar] [CrossRef] [PubMed]
- Breslavsky, A.; Frand, J.; Matas, Z.; Boaz, M.; Barnea, Z.; Shargorodsky, M. Effect of high doses of vitamin D on arterial properties, adiponectin, leptin and glucose homeostasis in type 2 diabetic patients. Clin. Nutr. 2013, 32, 970–975. [Google Scholar] [CrossRef]
- Sadiya, A.; Ahmed, S.M.; Carlsson, M.; Tesfa, Y.; George, M.; Ali, S.H.; Siddieg, H.H.; Abusnana, S. Vitamin D supplementation in obese type 2 diabetes subjects in Ajman, UAE: A randomized controlled double-blinded clinical trial. Eur. J. Clin. Nutr. 2015, 69, 707–711. [Google Scholar] [CrossRef]
- Moghassemi, S.; Marjani, A. The effect of short-term vitamin D supplementation on lipid profile and blood pressure in post-menopausal women: A randomized controlled trial. Iran. J. Nurs. Midwifery Res. 2014, 19, 517–521. [Google Scholar]
- Tamadon, M.R.; Soleimani, A.; Keneshlou, F.; Mojarrad, M.Z.; Bahmani, F.; Naseri, A.; Kashani, H.H.; Hosseini, E.S.; Asemi, Z. Clinical Trial on the Effects of Vitamin D Supplementation on Metabolic Profiles in Diabetic Hemodialysis. Horm. Metab. Res. 2018, 50, 50–55. [Google Scholar] [CrossRef] [PubMed]
- Dalbeni, A.; Scaturro, G.; Degan, M.; Minuz, P.; Delva, P. Effects of six months of vitamin D supplementation in patients with heart failure: A randomized double-blind controlled trial. Nutr. Metab. Cardiovasc. Dis. 2014, 24, 861–868. [Google Scholar] [CrossRef] [PubMed]
- Ryu, O.H.; Chung, W.; Lee, S.; Hong, K.S.; Choi, M.G.; Yoo, H.J. The effect of high-dose vitamin D supplementation on insulin resistance and arterial stiffness in patients with type 2 diabetes. Korean J. Intern. Med. 2014, 29, 620–629. [Google Scholar] [CrossRef]
- Kim, H.J.; Kang, C.K.; Park, H.; Lee, M.G. Effects of vitamin D supplementation and circuit training on indices of obesity and insulin resistance in T2D and vitamin D deficient elderly women. J. Exerc. Nutr. Biochem. 2014, 18, 249–257. [Google Scholar] [CrossRef]
- Kampmann, U.; Mosekilde, L.; Juhl, C.; Moller, N.; Christensen, B.; Rejnmark, L.; Wamberg, L.; Orskov, L. Effects of 12 weeks high dose vitamin D3 treatment on insulin sensitivity, beta cell function, and metabolic markers in patients with type 2 diabetes and vitamin D insufficiency—A double-blind, randomized, placebo-controlled trial. Metabolism 2014, 63, 1115–1124. [Google Scholar] [CrossRef]
- Al-Zahrani, M.K.; Elnasieh, A.M.; Alenezi, F.M.; Almoushawah, A.A.; Almansour, M.; Alshahrani, F.; Rahman, S.U.; Al-Zahrani, A. A 3-month oral vitamin D supplementation marginally improves diastolic blood pressure in Saudi patients with type 2 diabetes mellitus. Int. J. Clin. Exp. Med. 2014, 7, 5421–5428. [Google Scholar]
- Hafez, M.; Musa, N.; Abdel Atty, S.; Ibrahem, M.; Abdel Wahab, N. Effect of Vitamin D Supplementation on Lipid Profile in Vitamin D-Deficient Children with Type 1 Diabetes and Dyslipidemia. Horm. Res. Paediatr. 2019, 91, 311–318. [Google Scholar] [CrossRef] [PubMed]
- Mohamad, M.I.; El-Sherbeny, E.E.; Bekhet, M.M. The Effect of Vitamin D Supplementation on Glycemic Control and Lipid Profile in Patients with Type 2 Diabetes Mellitus. J. Am. Coll. Nutr. 2016, 35, 399–404. [Google Scholar] [CrossRef]
- Jastrzebski, Z.; Kortas, J.; Kaczor, K.; Antosiewicz, J. Vitamin D Supplementation Causes a Decrease in Blood Cholesterol in Professional Rowers. J. Nutr. Sci. Vitaminol. 2016, 62, 88–92. [Google Scholar] [CrossRef] [PubMed]
- Khosravi, Z.S.; Kafeshani, M.; Tavasoli, P.; Zadeh, A.H.; Entezari, M.H. Effect of Vitamin D Supplementation on Weight Loss, Glycemic Indices, and Lipid Profile in Obese and Overweight Women: A Clinical Trial Study. Int. J. Prev. Med. 2018, 9, 63. [Google Scholar]
- Dutta, D.; Maisnam, I.; Shrivastava, A.; Sinha, A.; Ghosh, S.; Mukhopadhyay, P.; Mukhopadhyay, S.; Chowdhury, S. Serum vitamin-D predicts insulin resistance in individuals with prediabetes. Indian J. Med. Res. 2013, 138, 853–860. [Google Scholar]
- Angellotti, E.; D’Alessio, D.; Dawson-Hughes, B.; Chu, Y.; Nelson, J.; Hu, P.; Cohen, R.M.; Pittas, A.G. Effect of vitamin D supplementation on cardiovascular risk in type 2 diabetes. Clin. Nutr. 2019, 38, 2449–2453. [Google Scholar] [CrossRef] [PubMed]
- Bhatt, S.P.; Misra, A.; Pandey, R.M.; Upadhyay, A.D.; Gulati, S.; Singh, N. Vitamin D Supplementation in Overweight/obese Asian Indian Women with Prediabetes Reduces Glycemic Measures and Truncal Subcutaneous Fat: A 78 Weeks Randomized Placebo-Controlled Trial (PREVENT-WIN Trial). Sci. Rep. 2020, 10, 220. [Google Scholar] [CrossRef]
- Misra, P.; Kant, S.; Misra, A.; Jha, S.; Kardam, P.; Thakur, N.; Bhatt, S.P. A Community Based Randomized Controlled Trial to See the Effect of Vitamin D Supplementation on Development of Diabetes Among Women with Prediabetes Residing in A Rural Community of Northern India. J. Fam. Med. Prim. Care 2021, 10, 3122–3129. [Google Scholar] [CrossRef]
- Patwardhan, V.G.; Mughal, Z.M.; Padidela, R.; Chiplonkar, S.A.; Khadilkar, V.V.; Khadilkar, A.V. Randomized Control Trial Assessing Impact of Increased Sunlight Exposure versus Vitamin D Supplementation on Lipid Profile in Indian Vitamin D Deficient Men. Indian J. Endocrinol. Metab. 2017, 21, 393–398. [Google Scholar] [PubMed]
- Farag, H.A.M.; Hosseinzadeh-Attar, M.J.; Muhammad, B.A.; Esmaillzadeh, A.; Hamid El Bilbeisi, A. Effects of vitamin D supplementation along with endurance physical activity on lipid profile in metabolic syndrome patients: A randomized controlled trial. Diabetes Metab. Syndr. 2019, 13, 1093–1098. [Google Scholar] [CrossRef] [PubMed]
- Salekzamani, S.; Mehralizadeh, H.; Ghezel, A.; Salekzamani, Y.; Jafarabadi, M.A.; Bavil, A.S.; Gargari, B.P. Effect of high-dose vitamin D supplementation on cardiometabolic risk factors in subjects with metabolic syndrome: A randomized controlled double-blind clinical trial. J. Endocrinol. Investig. 2016, 39, 1303–1313. [Google Scholar] [CrossRef] [PubMed]
- Asemi, Z.; Foroozanfard, F.; Hashemi, T.; Bahmani, F.; Jamilian, M.; Esmaillzadeh, A. Calcium plus vitamin D supplementation affects glucose metabolism and lipid concentrations in overweight and obese vitamin D deficient women with polycystic ovary syndrome. Clin. Nutr. 2015, 34, 586–592. [Google Scholar] [CrossRef] [PubMed]
- Qin, X.F.; Zhao, L.S.; Chen, W.R.; Yin, D.W.; Wang, H. Effects of vitamin D on plasma lipid profiles in statin-treated patients with hypercholesterolemia: A randomized placebo-controlled trial. Clin. Nutr. 2015, 34, 201–206. [Google Scholar] [CrossRef]
- Muñoz-Aguirre, P.; Flores, M.; Macias, N.; Quezada, A.D.; Denova-Gutiérrez, E.; Salmerón, J. The effect of vitamin D supplementation on serum lipids in postmenopausal women with diabetes: A randomized controlled trial. Clin. Nutr. 2015, 34, 799–804. [Google Scholar] [CrossRef] [PubMed]
- Jamilian, M.; Samimi, M.; Ebrahimi, F.A.; Hashemi, T.; Taghizadeh, M.; Razavi, M.; Sanami, M.; Asemi, Z. The effects of vitamin D and omega-3 fatty acid co-supplementation on glycemic control and lipid concentrations in patients with gestational diabetes. J. Clin. Lipidol. 2017, 11, 459–468. [Google Scholar] [CrossRef] [PubMed]
- Ghaderi, A.; Banafshe, H.R.; Motmaen, M.; Rasouli-Azad, M.; Bahmani, F.; Asemi, Z. Clinical trial of the effects of vitamin D supplementation on psychological symptoms and metabolic profiles in maintenance methadone treatment patients. Prog. Neuropsychopharmacol. Biol. Psychiatry 2017, 79, 84–89. [Google Scholar] [CrossRef] [PubMed]
- Ghaderi, A.; Banafshe, H.R.; Mirhosseini, N.; Moradi, M.; Karimi, M.A.; Mehrzad, F.; Bahmani, F.; Asemi, Z. Clinical and metabolic response to vitamin D plus probiotic in schizophrenia patients. BMC Psychiatry 2019, 19, 77. [Google Scholar] [CrossRef]
- Miao, J.; Bachmann, K.N.; Huang, S.; Su, Y.R.; Dusek, J.; Newton-Cheh, C.; Arora, P.; Wang, T.J. Effects of Vitamin D Supplementation on Cardiovascular and Glycemic Biomarkers. J. Am. Heart Assoc. 2021, 10, e017727. [Google Scholar] [CrossRef]
- Imga, N.N.; Karci, A.C.; Oztas, D.; Berker, D.; Guler, S. Effects of vitamin D supplementation on insulin resistance and dyslipidemia in overweight and obese premenopausal women. Arch. Med. Sci. 2019, 15, 598–606. [Google Scholar] [CrossRef] [PubMed]
- Al-Daghri, N.M.; Alkharfy, K.M.; Al-Othman, A.; El-Kholie, E.; Moharram, O.; Alokail, M.S.; Al-Saleh, Y.; Sabico, S.; Kumar, S.; Chrousos, G.P. Vitamin D supplementation as an adjuvant therapy for patients with T2DM: An 18-month prospective interventional study. Cardiovasc. Diabetol. 2012, 11, 85. [Google Scholar] [CrossRef] [PubMed]
- Shab-Bidar, S.; Neyestani, T.R.; Djazayery, A.; Eshraghian, M.R.; Houshiarrad, A.; Gharavi, A.; Kalayi, A.; Shariatzadeh, N.; Zahedirad, M.; Khalaji, N.; et al. Regular consumption of vitamin D-fortified yogurt drink (Doogh) improved endothelial biomarkers in subjects with type 2 diabetes: A randomized double-blind clinical trial. BMC Med. 2011, 9, 125. [Google Scholar] [CrossRef] [PubMed]
- Ramiro-Lozano, J.M.; Calvo-Romero, J.M. Effects on lipid profile of supplementation with vitamin D in type 2 diabetic patients with vitamin D deficiency. Ther. Adv. Endocrinol. Metab. 2015, 6, 245–248. [Google Scholar] [CrossRef] [PubMed]
- Sacheck, J.M.; Huang, Q.; Van Rompay, M.I.; Chomitz, V.R.; Economos, C.D.; Eliasziw, M.; Gordon, C.M.; Goodman, E. Vitamin D supplementation and cardiometabolic risk factors among diverse schoolchildren: A randomized clinical trial. Am. J. Clin. Nutr. 2022, 115, 73–82. [Google Scholar] [CrossRef] [PubMed]
- Liyanage, G.C.; Lekamwasam, S.; Weerarathna, T.P.; Liyanage, C.E. Effects of high-dose parenteral vitamin D therapy on lipid profile and blood pressure in patients with diabetic nephropathy: A randomized double-blind clinical trial. Diabetes Metab. Syndr. 2017, 2, S767–S770. [Google Scholar] [CrossRef] [PubMed]
- Rajabi-Naeeni, M.; Dolatian, M.; Qorbani, M.; Vaezi, A.A. The effect of omega-3 and vitamin D co-supplementation on glycemic control and lipid profiles in reproductive-aged women with pre-diabetes and hypovitaminosis D: A randomized controlled trial. Diabetol. Metab. Syndr. 2020, 12, 41. [Google Scholar] [CrossRef] [PubMed]
- Samimi, M.; Kashi, M.; Foroozanfard, F.; Karamali, M.; Bahmani, F.; Asemi, Z.; Hamidian, Y.; Talari, H.R.; Esmaillzadeh, A. The effects of vitamin D plus calcium supplementation on metabolic profiles, biomarkers of inflammation, oxidative stress and pregnancy outcomes in pregnant women at risk for pre-eclampsia. J. Hum. Nutr. Diet. 2016, 29, 505–515. [Google Scholar] [CrossRef]
- Riek, A.E.; Oh, J.; Darwech, I.; Worthy, V.; Lin, X.; Ostlund, R.E., Jr.; Zhang, R.M.; Bernal-Mizrachi, C. Vitamin D3 supplementation decreases a unique circulating monocyte cholesterol pool in patients with type 2 diabetes. J. Steroid Biochem. Mol. Biol. 2018, 177, 187–192. [Google Scholar] [CrossRef]
- Giulietti, A.; van Etten, E.; Overbergh, L.; Stoffels, K.; Bouillon, R.; Mathieu, C. Monocytes from type 2 diabetic patients have a pro-inflammatory profile. 1,25-Dihydroxyvitamin D(3) works as anti-inflammatory. Diabetes Res. Clin. Pract. 2007, 77, 47–57. [Google Scholar] [CrossRef]
- Hu, J.; Jia, J.; Zhang, Y.; Miao, R.; Huo, X.; Ma, F. Effects of vitamin D3 supplementation on cognition and blood lipids: A 12-month randomized, double-blind, placebo-controlled trial. J. Neurol. Neurosurg. Psychiatry 2018, 89, 1341–1347. [Google Scholar] [CrossRef] [PubMed]
- Sabico, S.; Wani, K.; Grant, W.B.; Al-Daghri, N.M. Improved HDL Cholesterol through Vitamin D Status Correction Substantially Lowers 10-Year Atherosclerotic Cardiovascular Disease Risk Score in Vitamin D-Deficient Arab Adults. Nutrients 2023, 15, 551. [Google Scholar] [CrossRef] [PubMed]
- Schwetz, V.; Scharnagl, H.; Trummer, C.; Stojakovic, T.; Pandis, M.; Grübler, M.R.; Verheyen, N.; Gaksch, M.; Zittermann, A.; Aberer, F.; et al. Vitamin D supplementation and lipoprotein metabolism: A randomized controlled trial. J. Clin. Lipidol. 2018, 12, 588–596. [Google Scholar] [CrossRef] [PubMed]
- Zittermann, A.; Frisch, S.; Berthold, H.K.; Götting, C.; Kuhn, J.; Kleesiek, K.; Stehle, P.; Koertke, H.; Koerfer, R. Vitamin D supplementation enhances the beneficial effects of weight loss on cardiovascular disease risk markers. Am. J. Clin. Nutr. 2009, 89, 1321–1327. [Google Scholar] [CrossRef]
- Jorde, R.; Figenschau, Y.; Hutchinson, M.; Emaus, N.; Grimnes, G. High serum 25-hydroxyvitamin D concentrations are associated with a favorable serum lipid profile. Eur. J. Clin. Nutr. 2010, 64, 1457–1464. [Google Scholar] [CrossRef]
- Jorde, R.; Sollid, S.T.; Svartberg, J.; Schirmer, H.; Joakimsen, R.M.; Njølstad, I.; Fuskevåg, O.M.; Figenschau, Y.; Hutchinson, M.Y. Vitamin D 20,000 IU per Week for Five Years Does Not Prevent Progression from Prediabetes to Diabetes. J. Clin. Endocrinol. Metab. 2016, 101, 1647–1655. [Google Scholar] [CrossRef]
- Bahramian, H.; Sherafatmanesh, S.; Asadi, N.; Bakhshi, A.; Hassan Eftekhari, M.; Ekramzadeh Comma, M. Effects of single-dose and co-supplementation of vitamin D and omega-3 on metabolic profile in women with polycystic ovary syndrome: An RCT. Int. J. Reprod. Biomed. 2023, 21, 541–550. [Google Scholar] [CrossRef]
- Safari, S.; Rafraf, M.; Malekian, M.; Molani-Gol, R.; Asghari-Jafarabadi, M.; Mobasseri, M. Effects of vitamin D supplementation on metabolic parameters, serum irisin and obesity values in women with subclinical hypothyroidism: A double-blind randomized controlled trial. Front. Endocrinol. 2023, 14, 1306470. [Google Scholar] [CrossRef] [PubMed]
- Ku, C.W.; Lee, A.J.W.; Oh, B.; Lim, C.H.F.; Chang, T.Y.; Yap, F.; Chan, J.K.Y.; Loy, S.L. The Effect of Vitamin D Supplementation in Pregnant Women with Overweight and Obesity: A Randomised Controlled Trial. Nutrients 2024, 16, 146. [Google Scholar] [CrossRef]
- Pittas, A.G.; Jorde, R.; Kawahara, T.; Dawson-Hughes, B. Vitamin D Supplementation for Prevention of Type 2 Diabetes Mellitus: To D or Not to D? J. Clin. Endocrinol. Metab. 2020, 105, 3721–3733. [Google Scholar] [CrossRef]
- di Filippo, L.; Uygur, M.; Locatelli, M.; Nannipieri, F.; Frara, S.; Giustina, A. Low vitamin D levels predict outcomes of COVID-19 in patients with both severe and non-severe disease at hospitalization. Endocrine 2023, 80, 669–683. [Google Scholar] [CrossRef] [PubMed]
- MacGiriley, R.; Phoswa, W.N.; Mokgalaboni, K. Modulatory Properties of Vitamin D in Type 2 Diabetic Patients: A Focus on Inflammation and Dyslipidemia. Nutrients 2023, 15, 4575. [Google Scholar] [CrossRef] [PubMed]


Disclaimer/Publisher’s Note: The statements, opinions and data contained in all publications are solely those of the individual author(s) and contributor(s) and not of MDPI and/or the editor(s). MDPI and/or the editor(s) disclaim responsibility for any injury to people or property resulting from any ideas, methods, instructions or products referred to in the content. |
© 2024 by the authors. Licensee MDPI, Basel, Switzerland. This article is an open access article distributed under the terms and conditions of the Creative Commons Attribution (CC BY) license (https://creativecommons.org/licenses/by/4.0/).
Share and Cite
Al Refaie, A.; Baldassini, L.; Mondillo, C.; De Vita, M.; Giglio, E.; Tarquini, R.; Gonnelli, S.; Caffarelli, C. Vitamin D and Dyslipidemia: Is There Really a Link? A Narrative Review. Nutrients 2024, 16, 1144. https://doi.org/10.3390/nu16081144
Al Refaie A, Baldassini L, Mondillo C, De Vita M, Giglio E, Tarquini R, Gonnelli S, Caffarelli C. Vitamin D and Dyslipidemia: Is There Really a Link? A Narrative Review. Nutrients. 2024; 16(8):1144. https://doi.org/10.3390/nu16081144
Chicago/Turabian StyleAl Refaie, Antonella, Leonardo Baldassini, Caterina Mondillo, Michela De Vita, Elisa Giglio, Roberto Tarquini, Stefano Gonnelli, and Carla Caffarelli. 2024. "Vitamin D and Dyslipidemia: Is There Really a Link? A Narrative Review" Nutrients 16, no. 8: 1144. https://doi.org/10.3390/nu16081144
APA StyleAl Refaie, A., Baldassini, L., Mondillo, C., De Vita, M., Giglio, E., Tarquini, R., Gonnelli, S., & Caffarelli, C. (2024). Vitamin D and Dyslipidemia: Is There Really a Link? A Narrative Review. Nutrients, 16(8), 1144. https://doi.org/10.3390/nu16081144