
A Randomized, Double-Blind, Placebo-Controlled Trial: Efficacy of Opuntia ficus-indica Prebiotic Supplementation in Subjects with Gut Dysbiosis


 , ,
, ,  , and
, and 
Abstract

1. Introduction
2. Materials and Methods
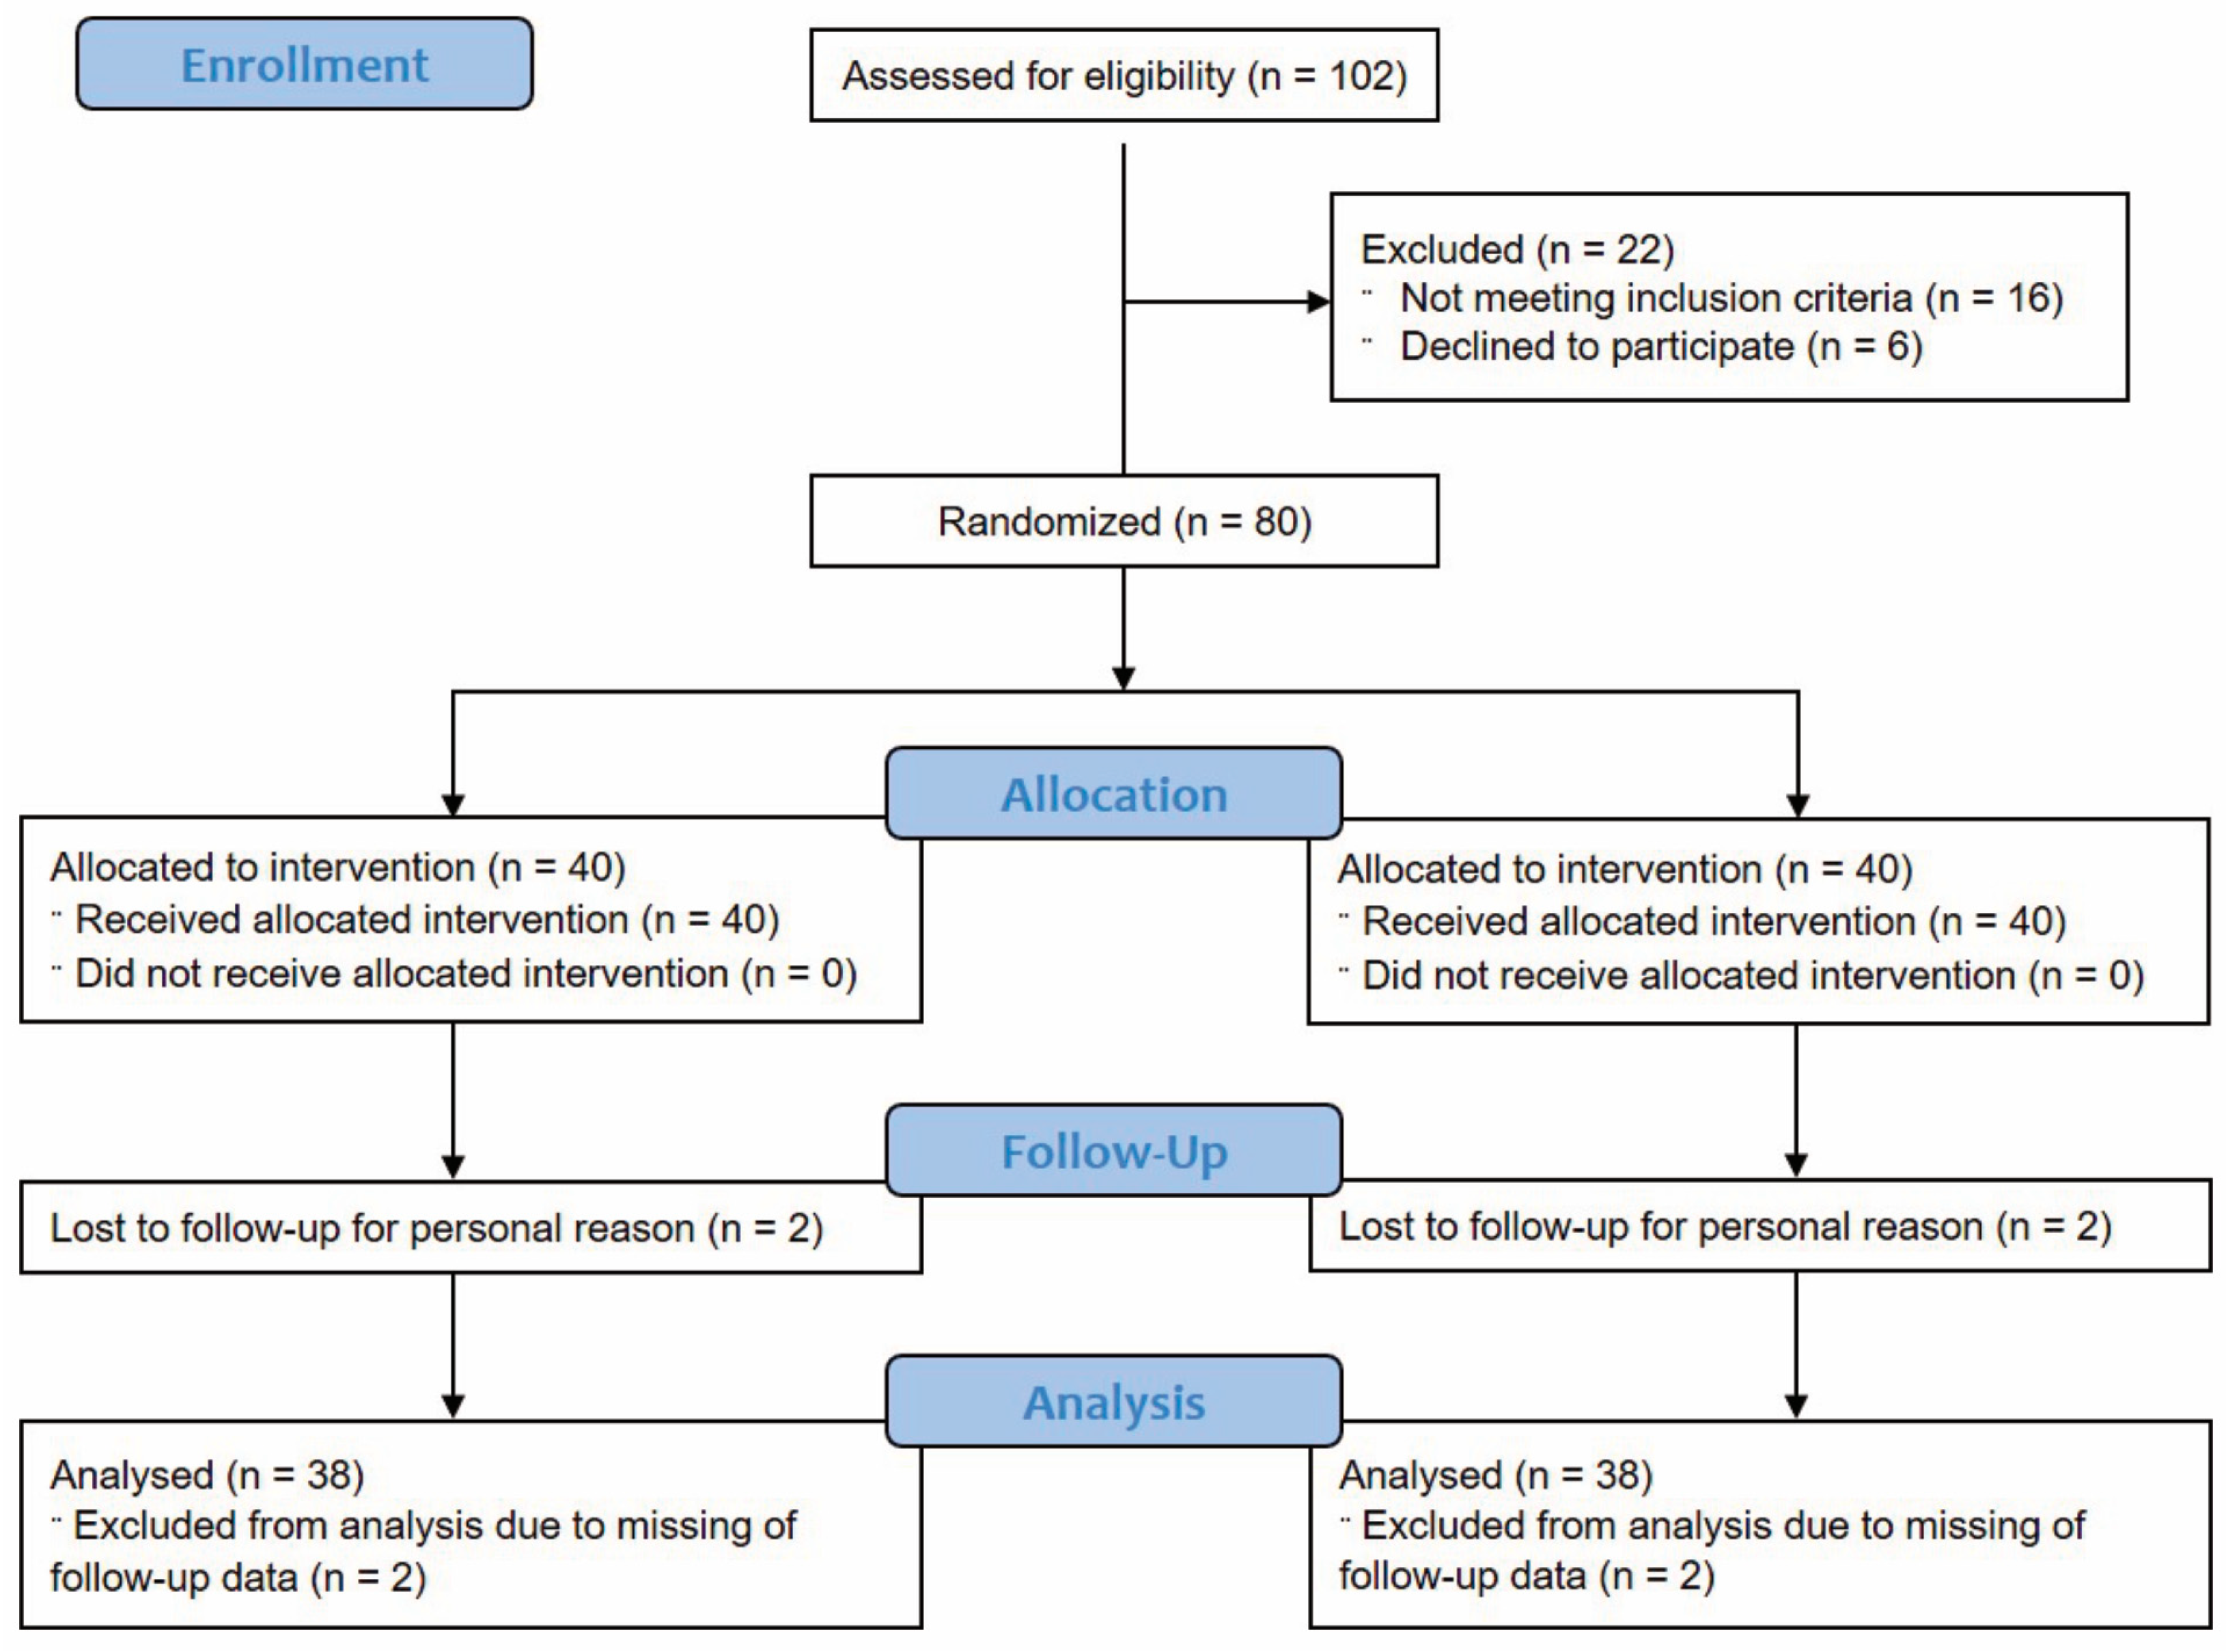
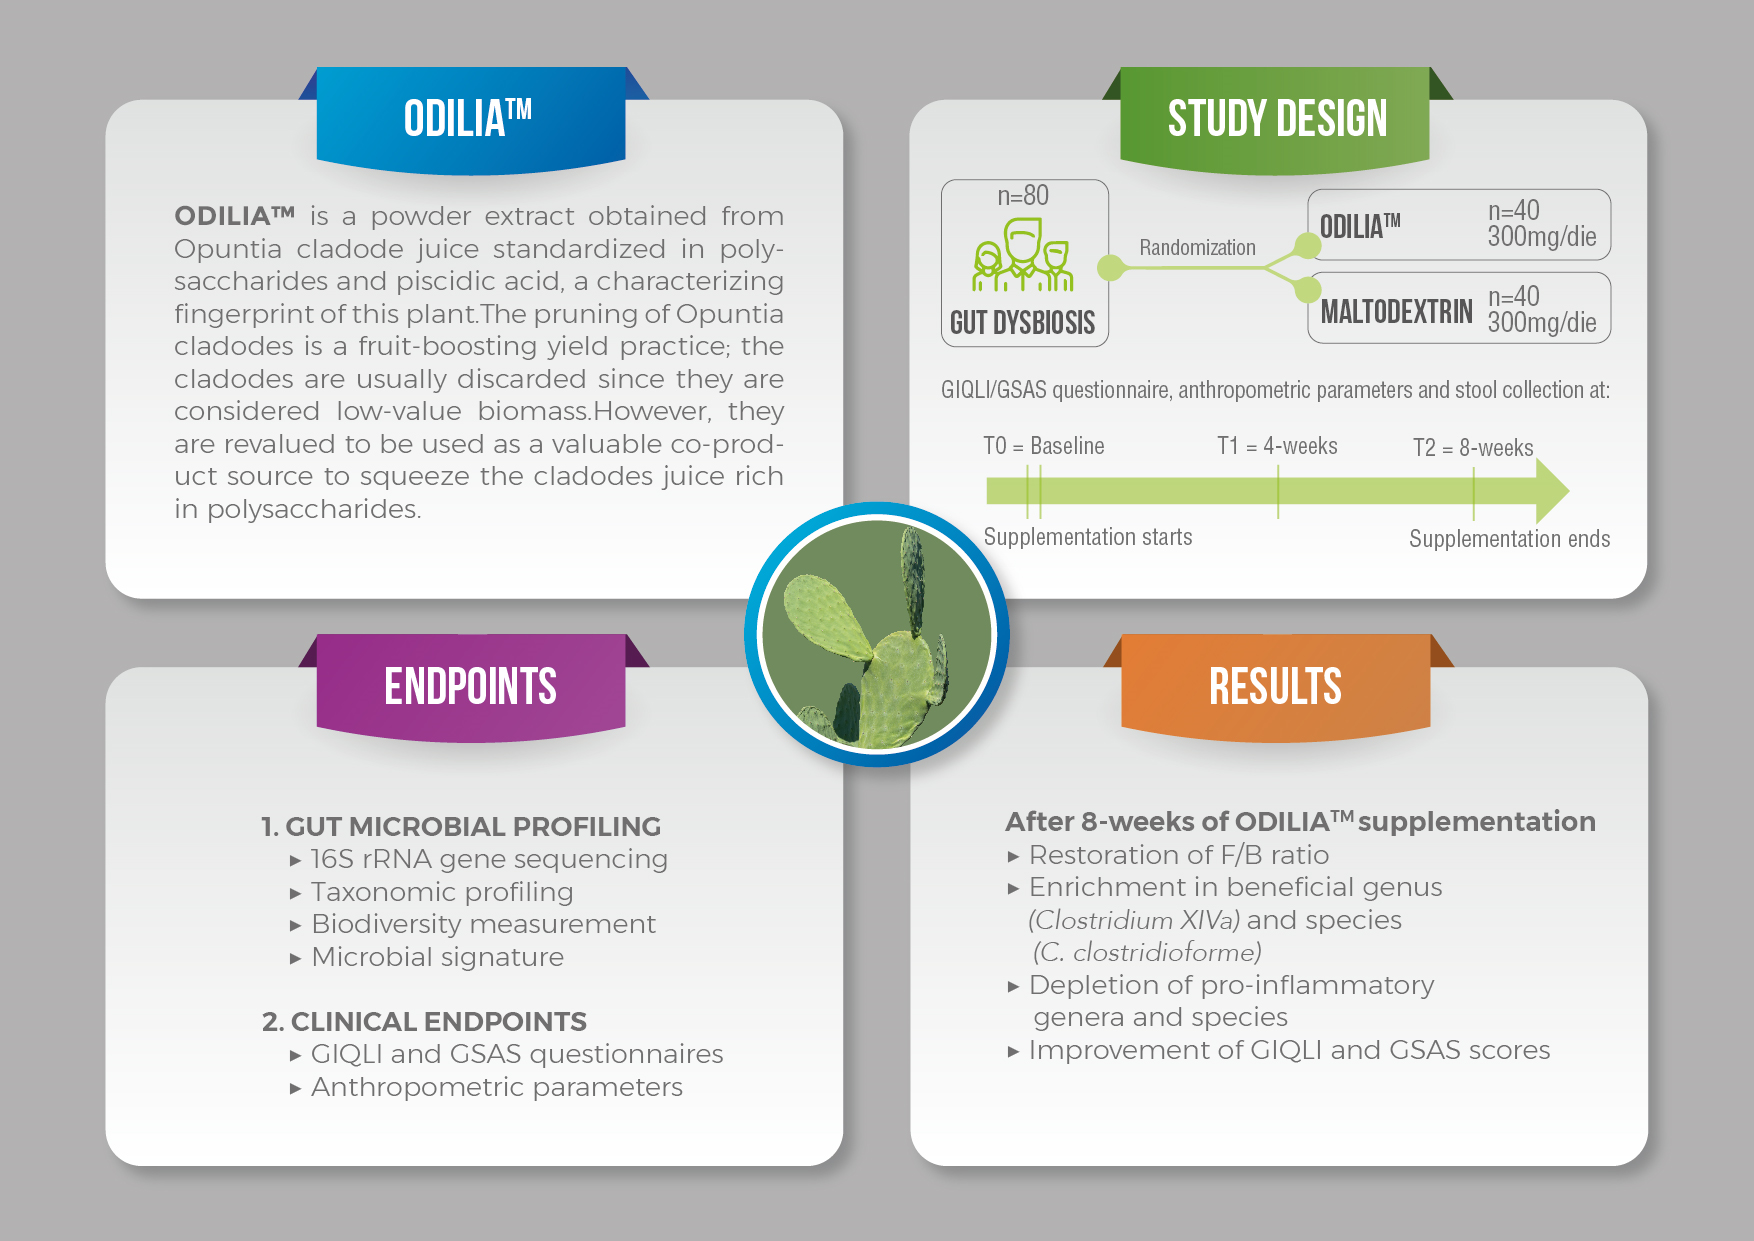
2.1. Trial Design
2.2. Participants
2.3. Intervention
2.4. Randomization
2.5. Primary and Secondary Efficacy Endpoints
2.6. 16S Metagenomics
2.6.1. DNA Isolation
2.6.2. 16S rRNA Gene Sequencing
2.6.3. Raw Sequence Processing
2.7. Clinical Endpoints
2.7.1. Anthropometric Measurements
2.7.2. Gastrointestinal Health Assessment
2.8. Statistical Methods
2.8.1. Analysis of Microbial Communities Using MicrobiomeAnalyst
2.8.2. Analysis of Clinical Endpoints
3. Results
3.1. Subject Characteristics
3.2. 16S Metagenomics: Microbial Community Profiling
3.2.1. Data Processing and Quality Control
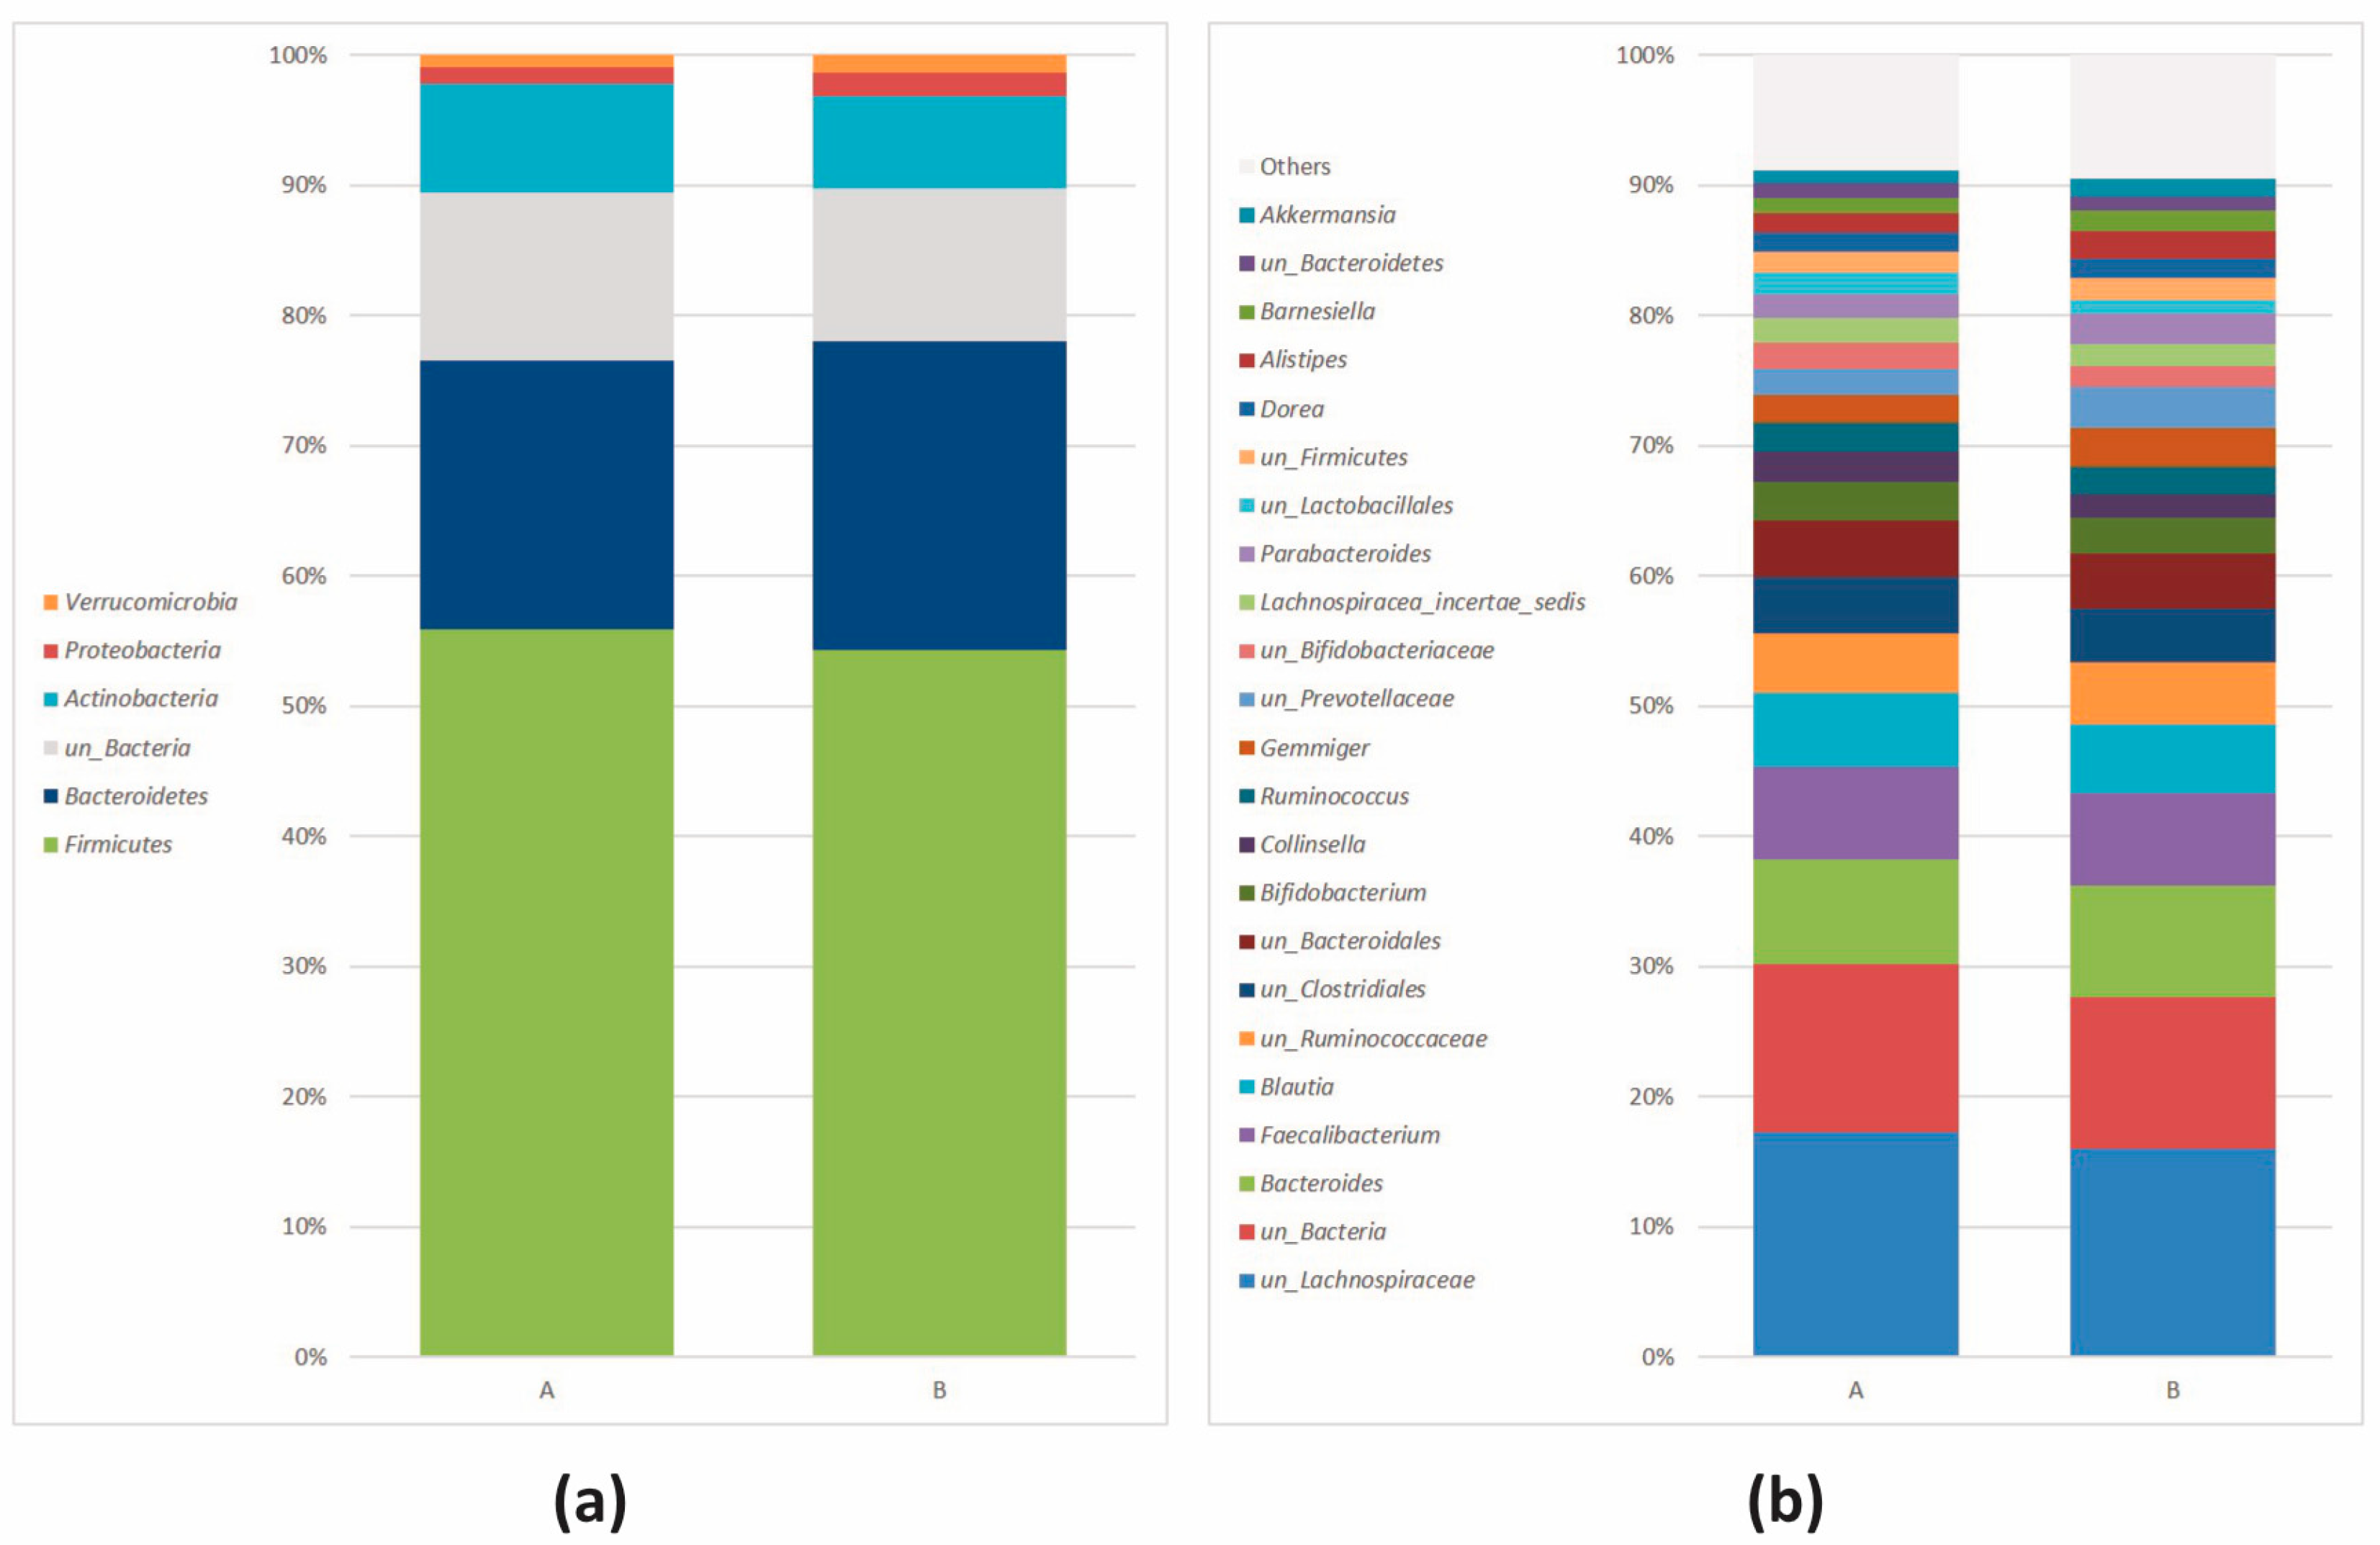
3.2.2. Microbial Community Profiling at the Baseline
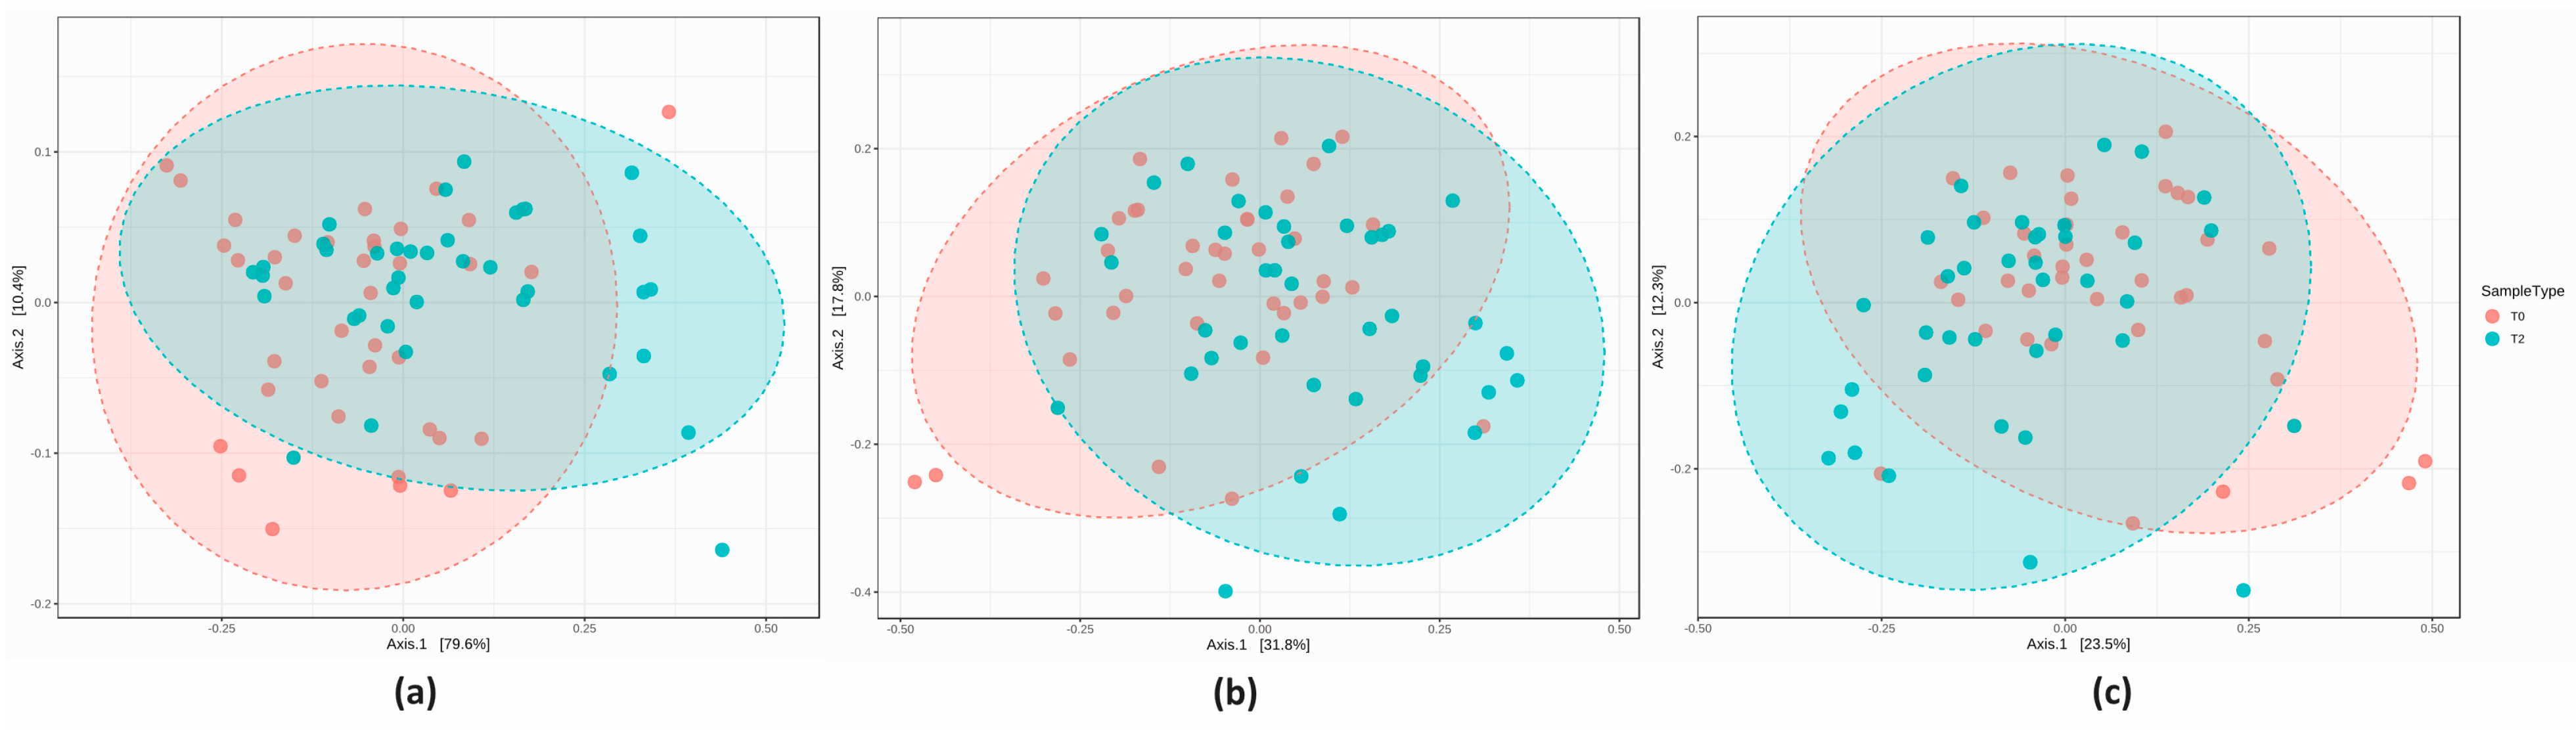
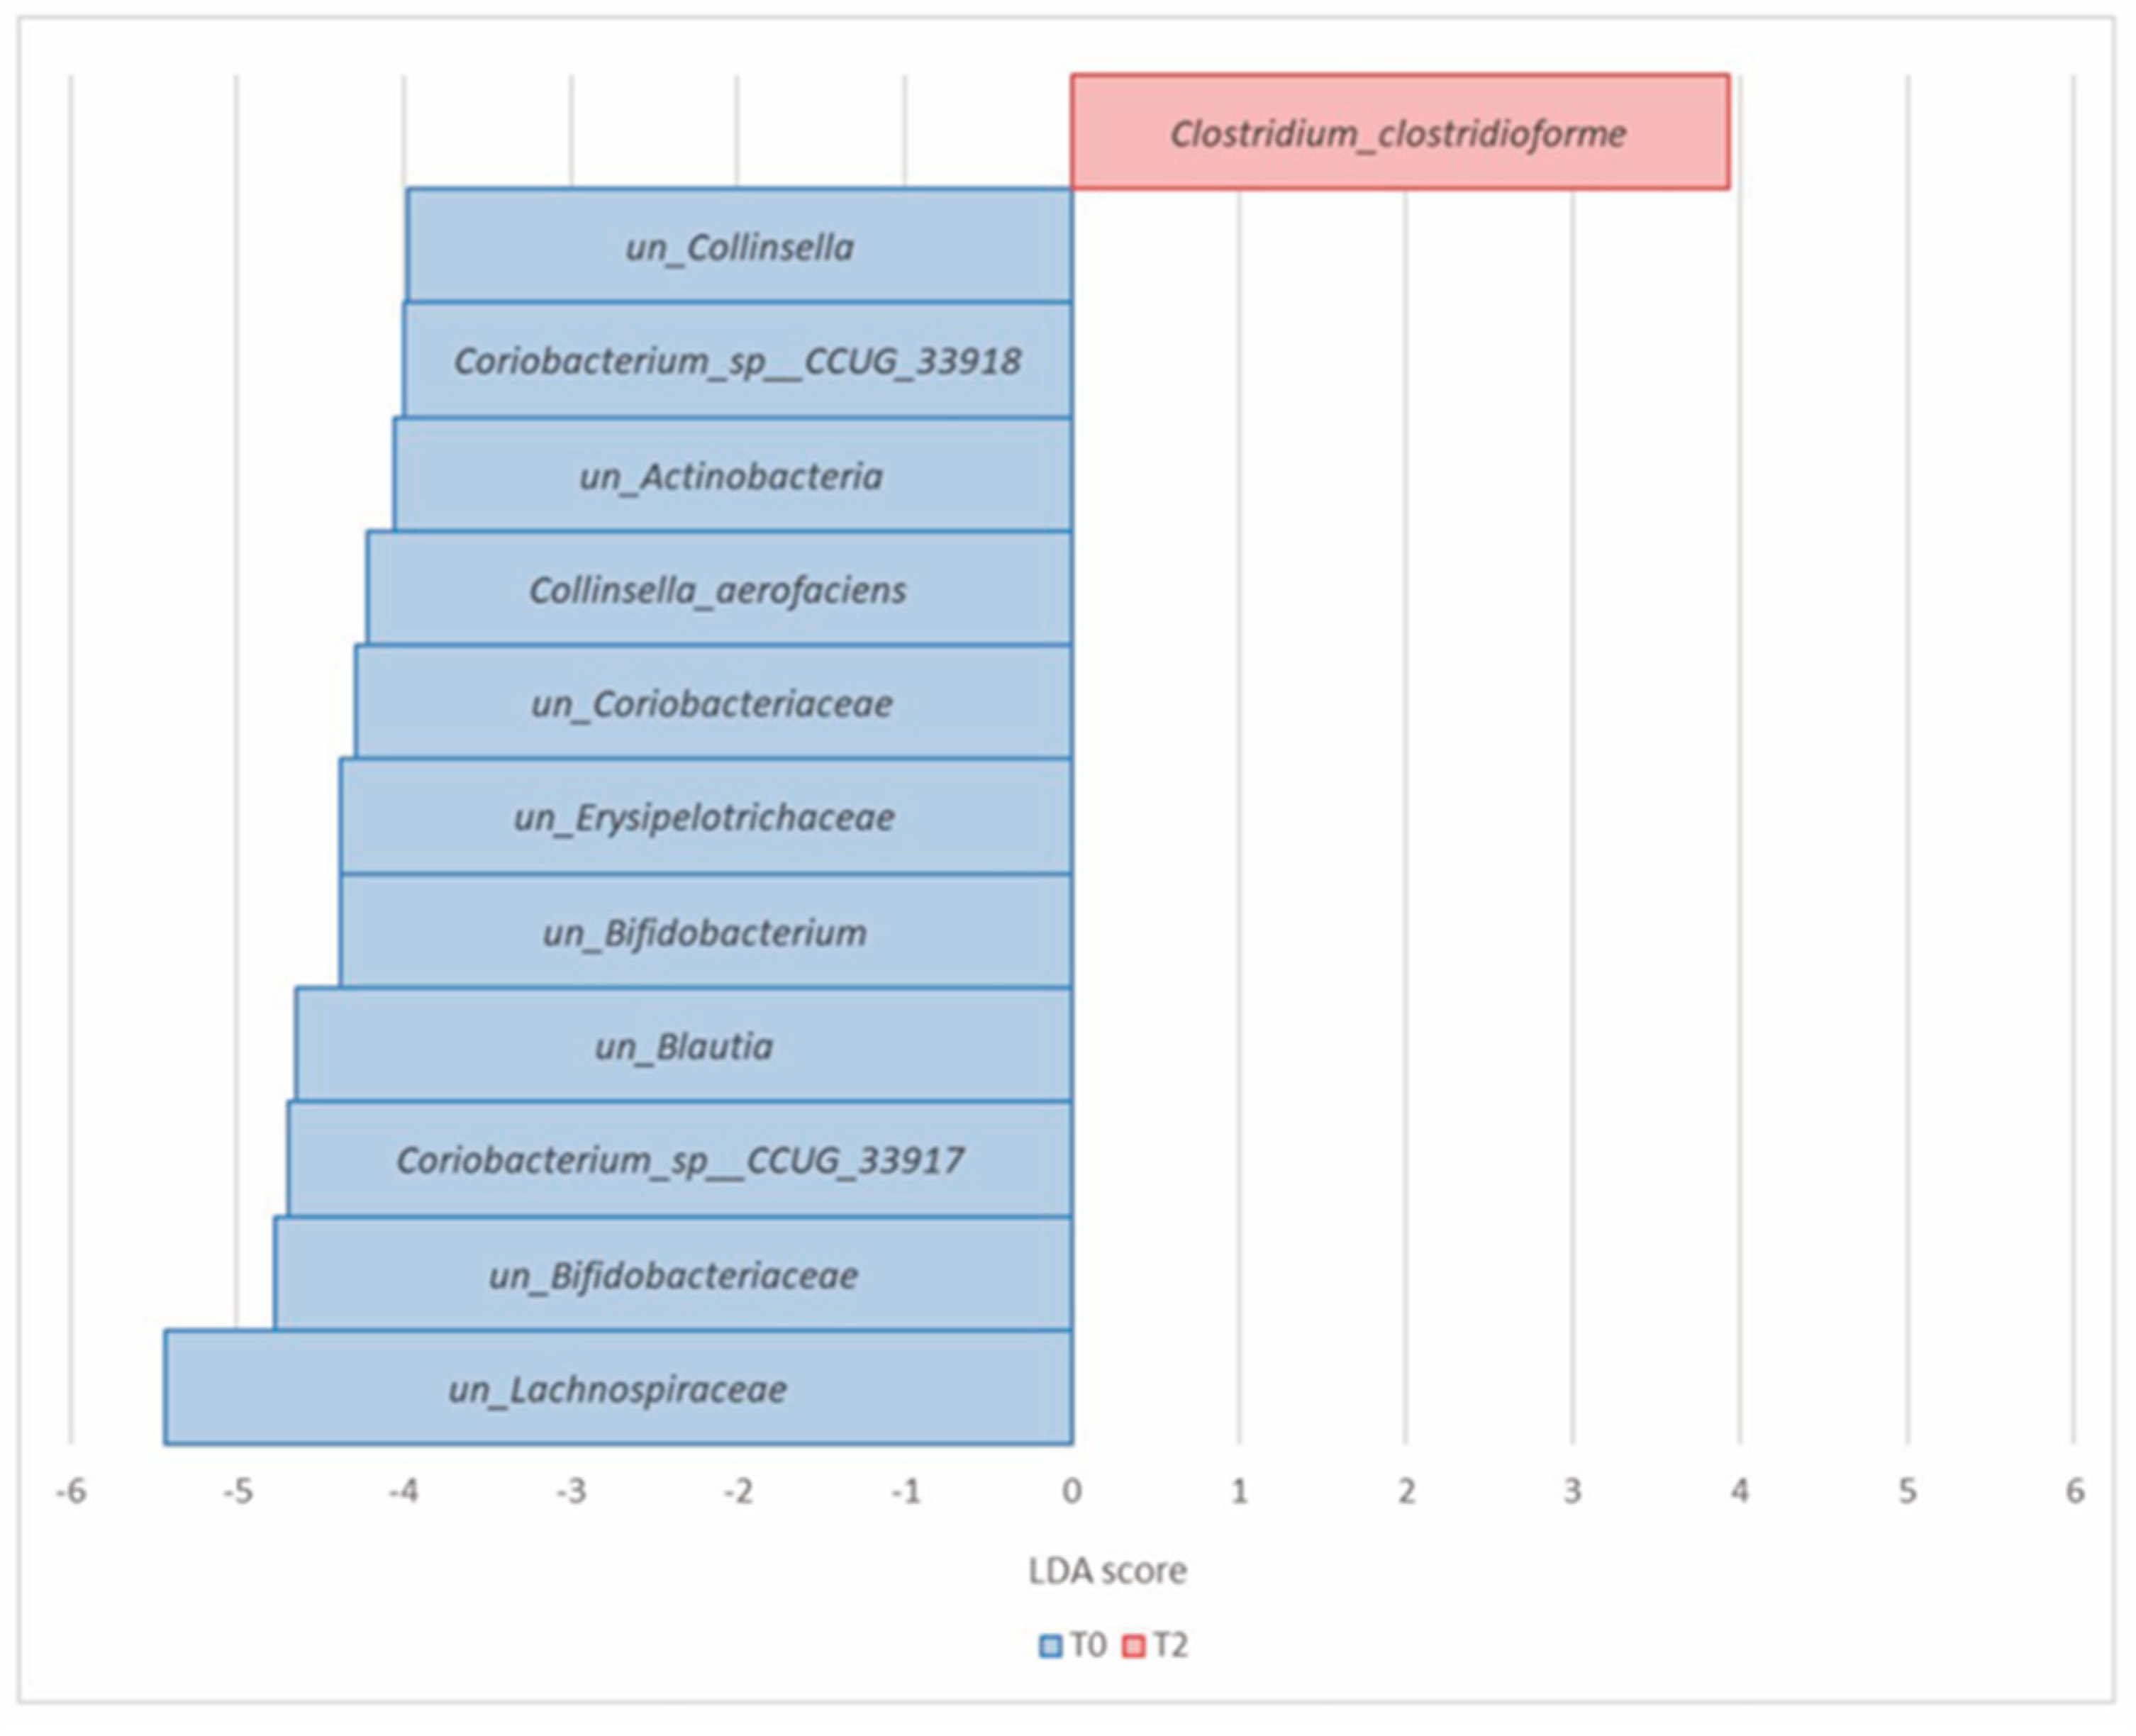
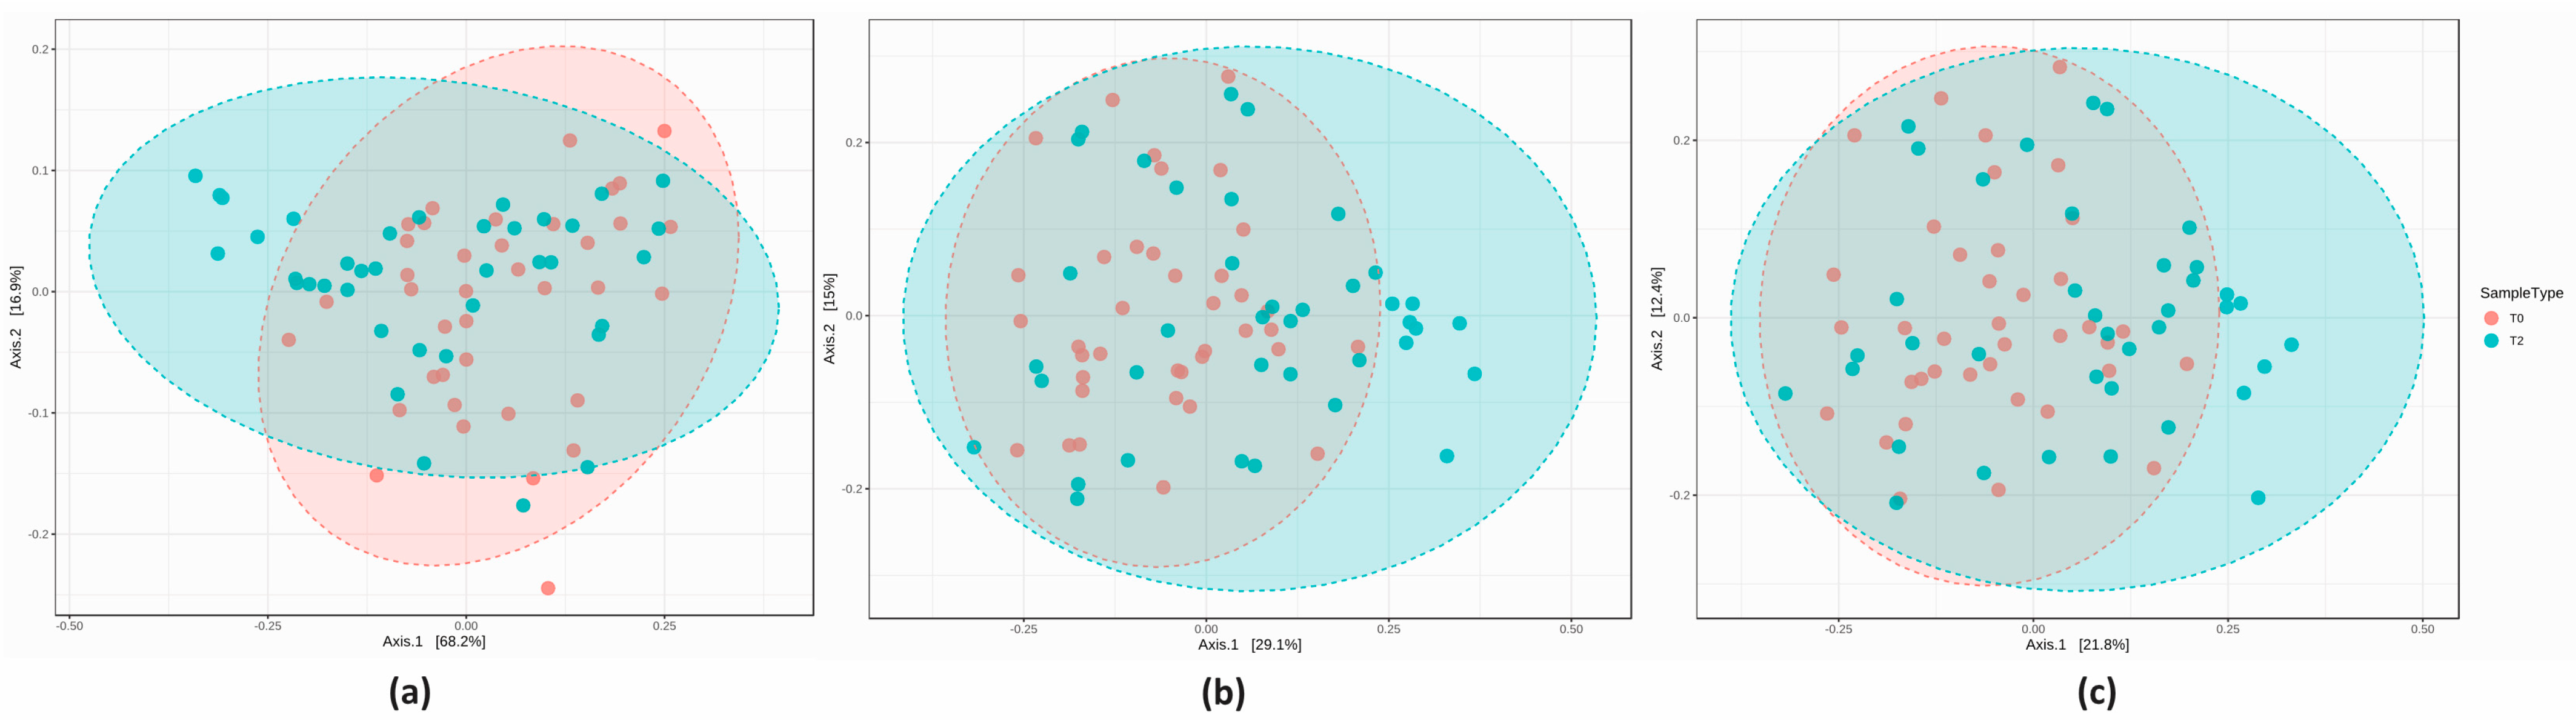
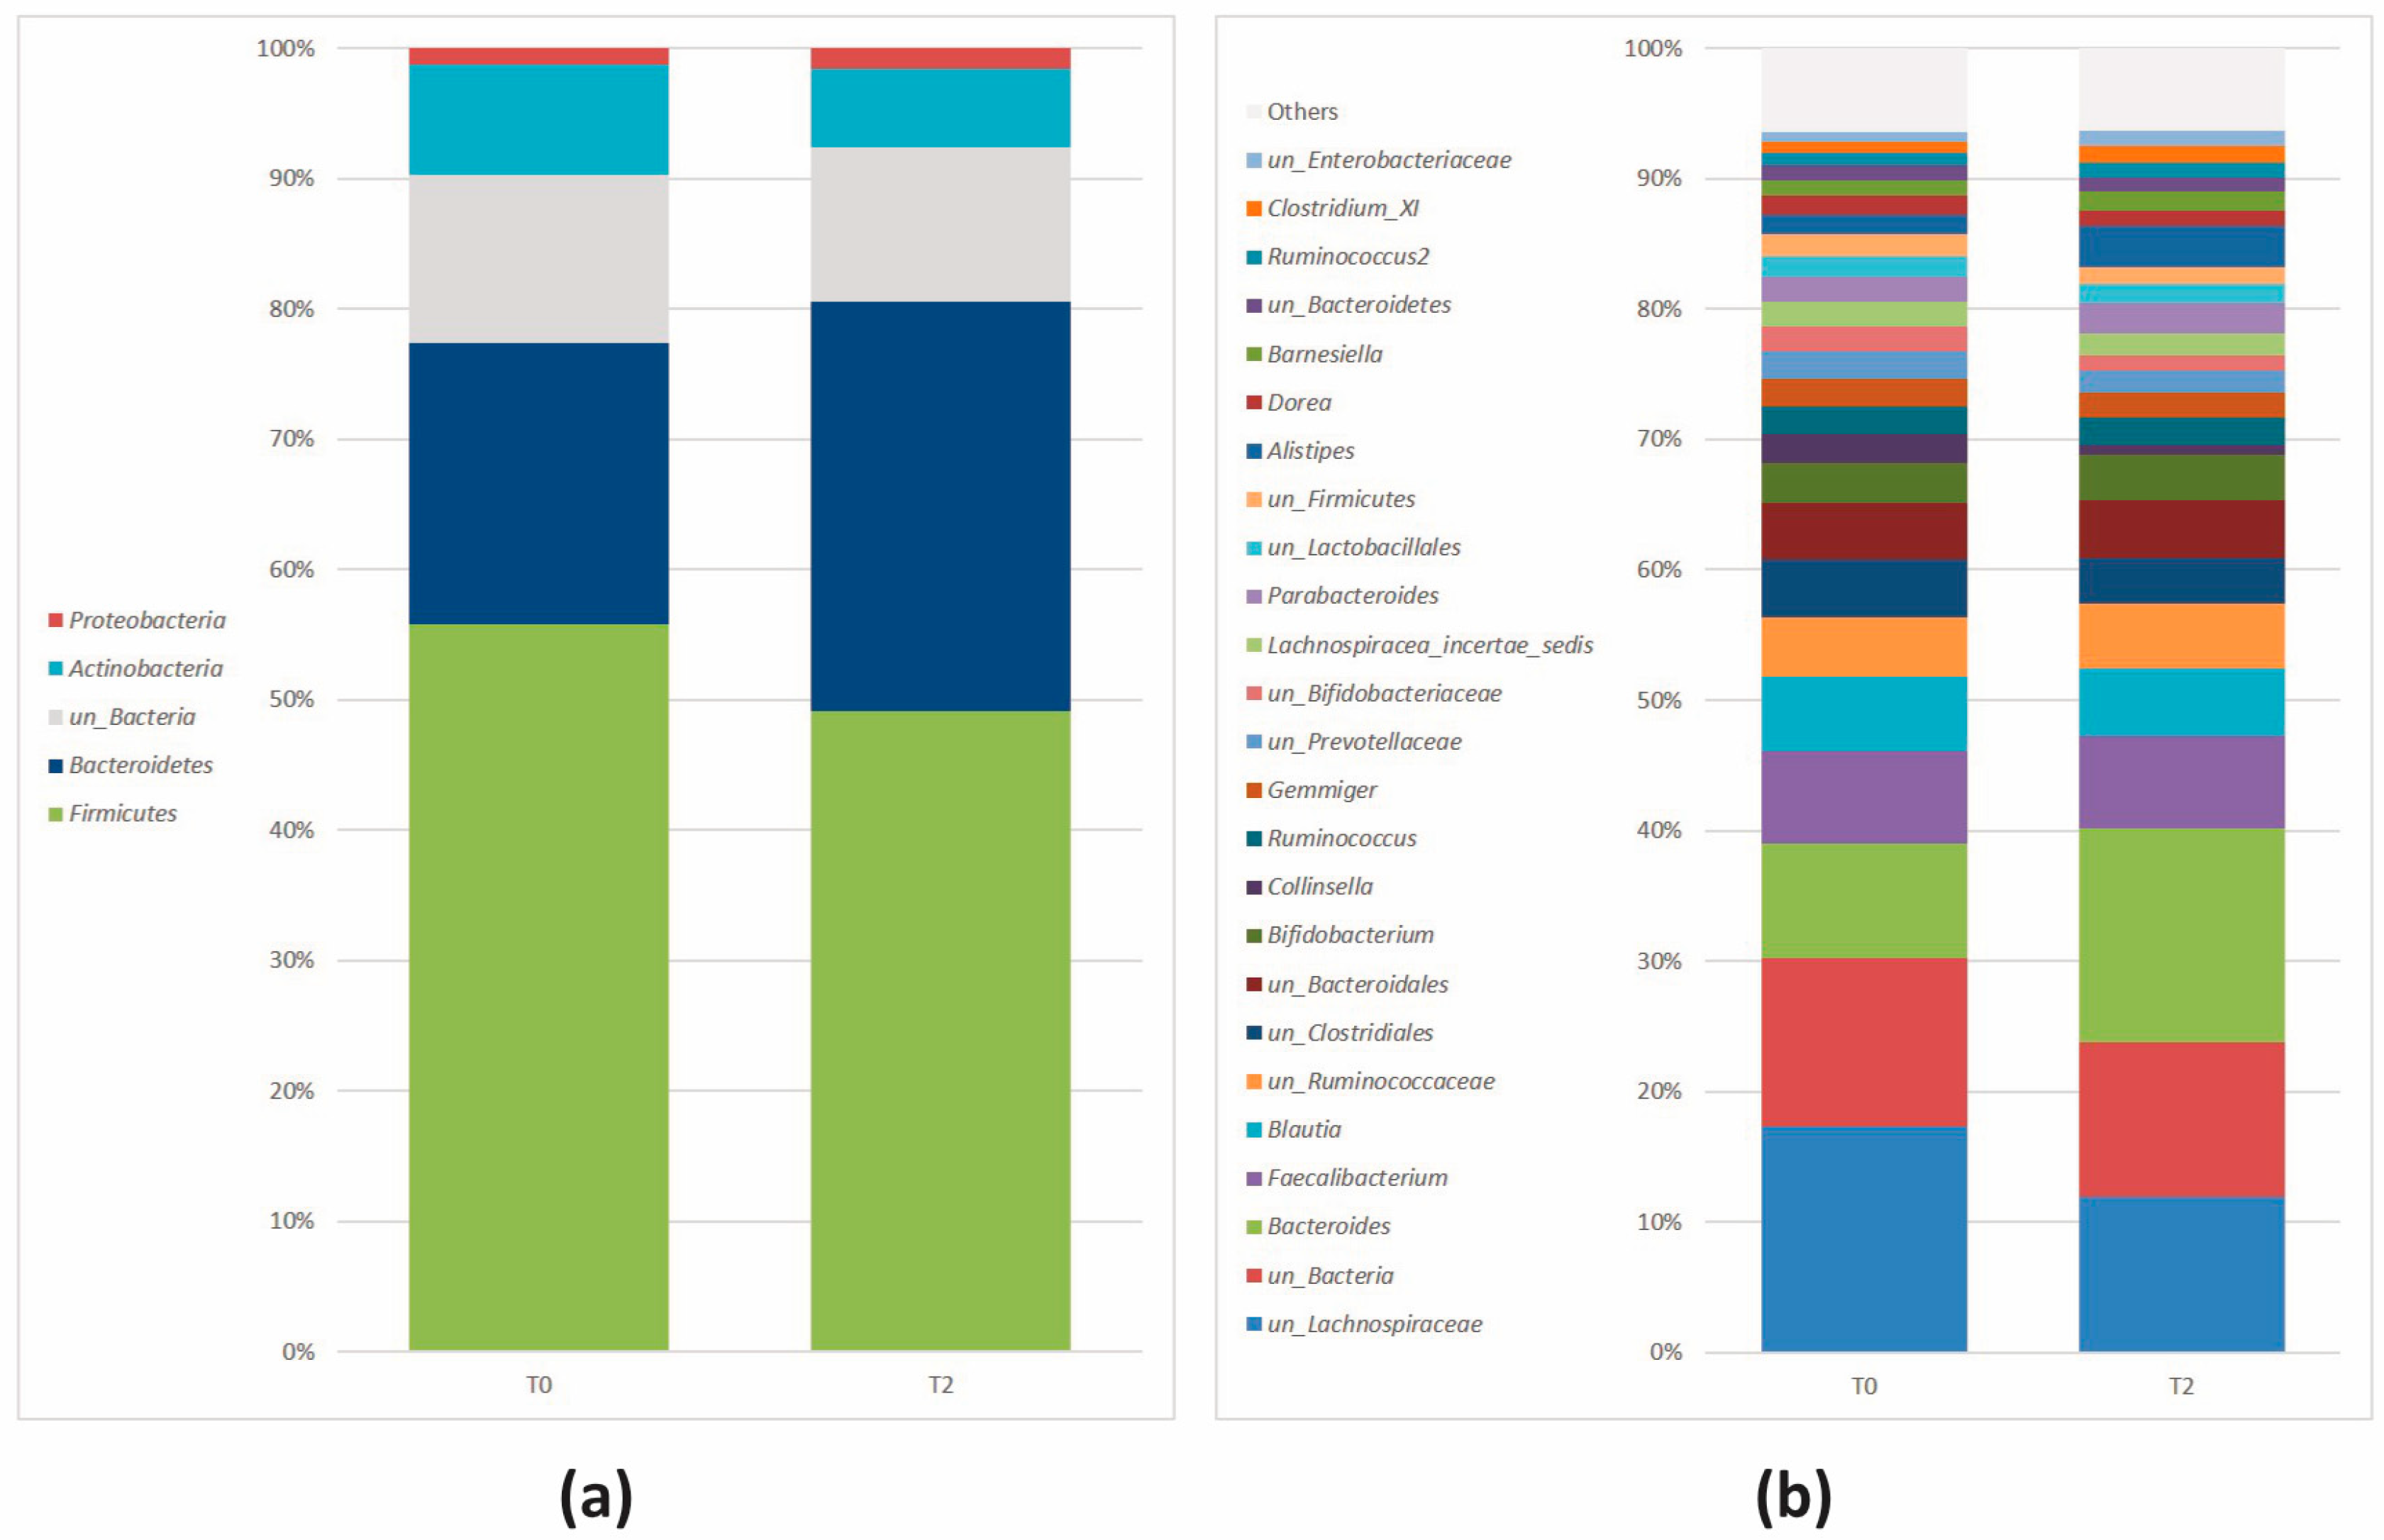
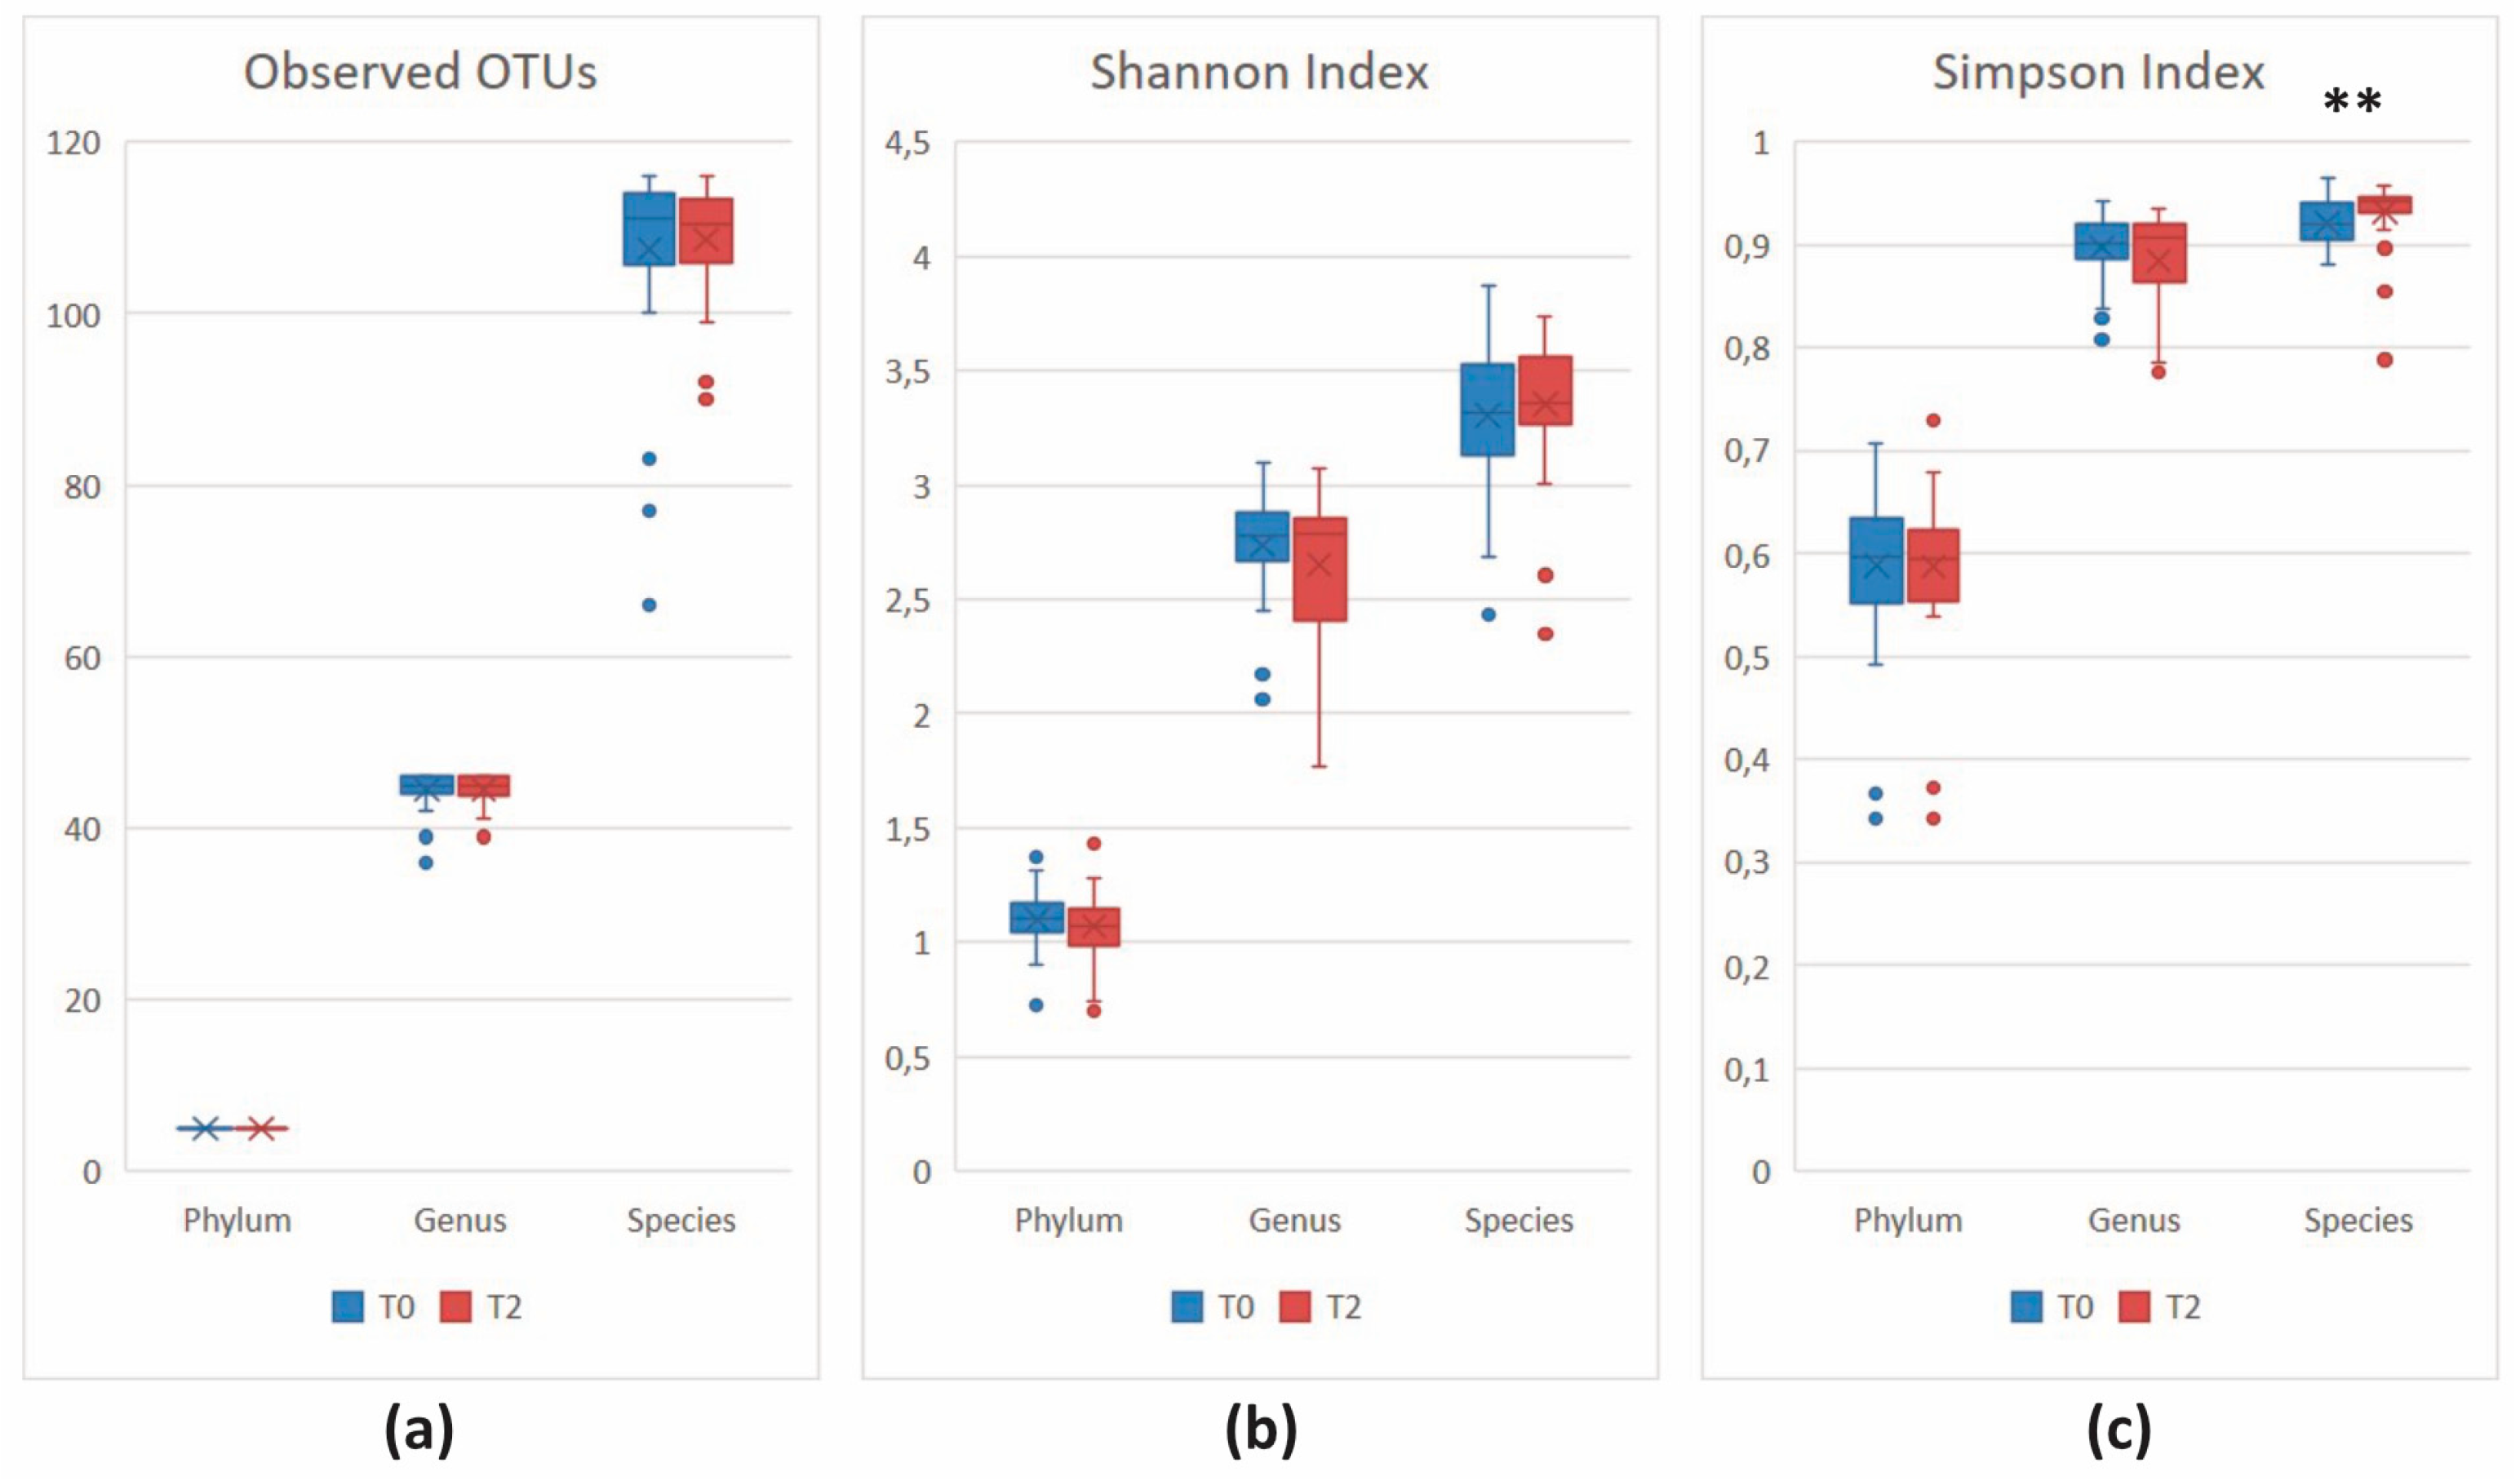
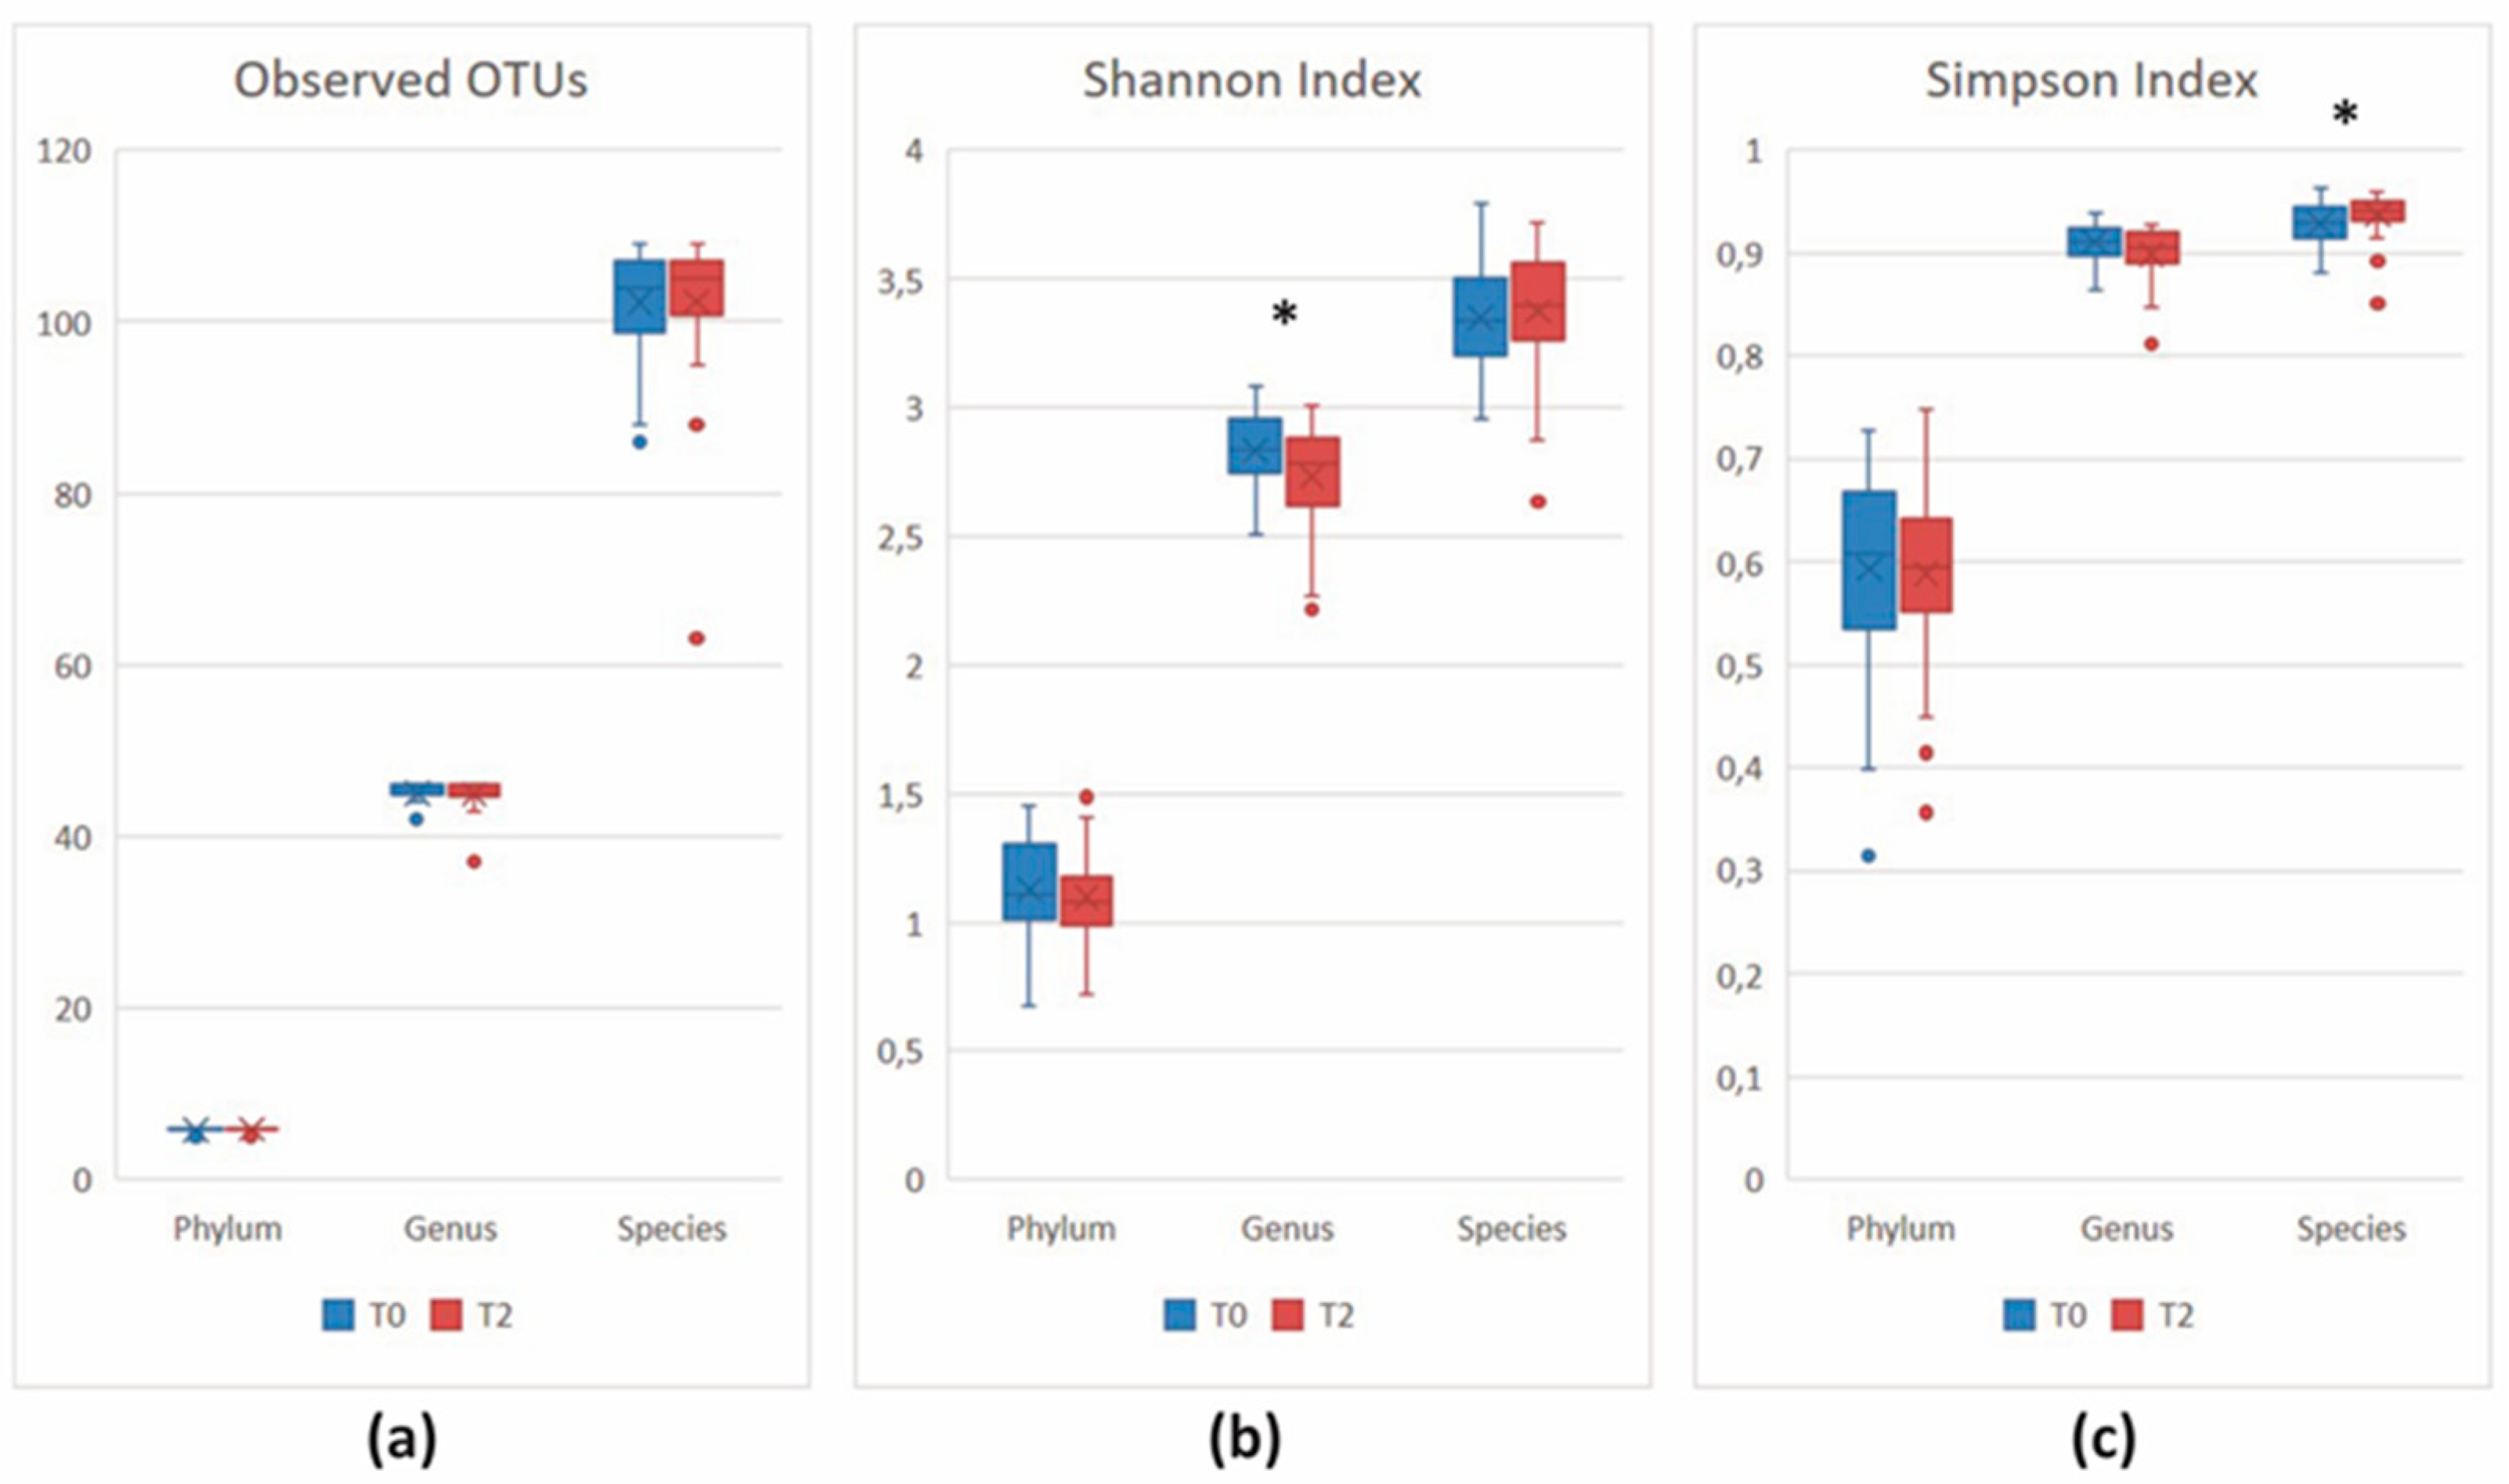
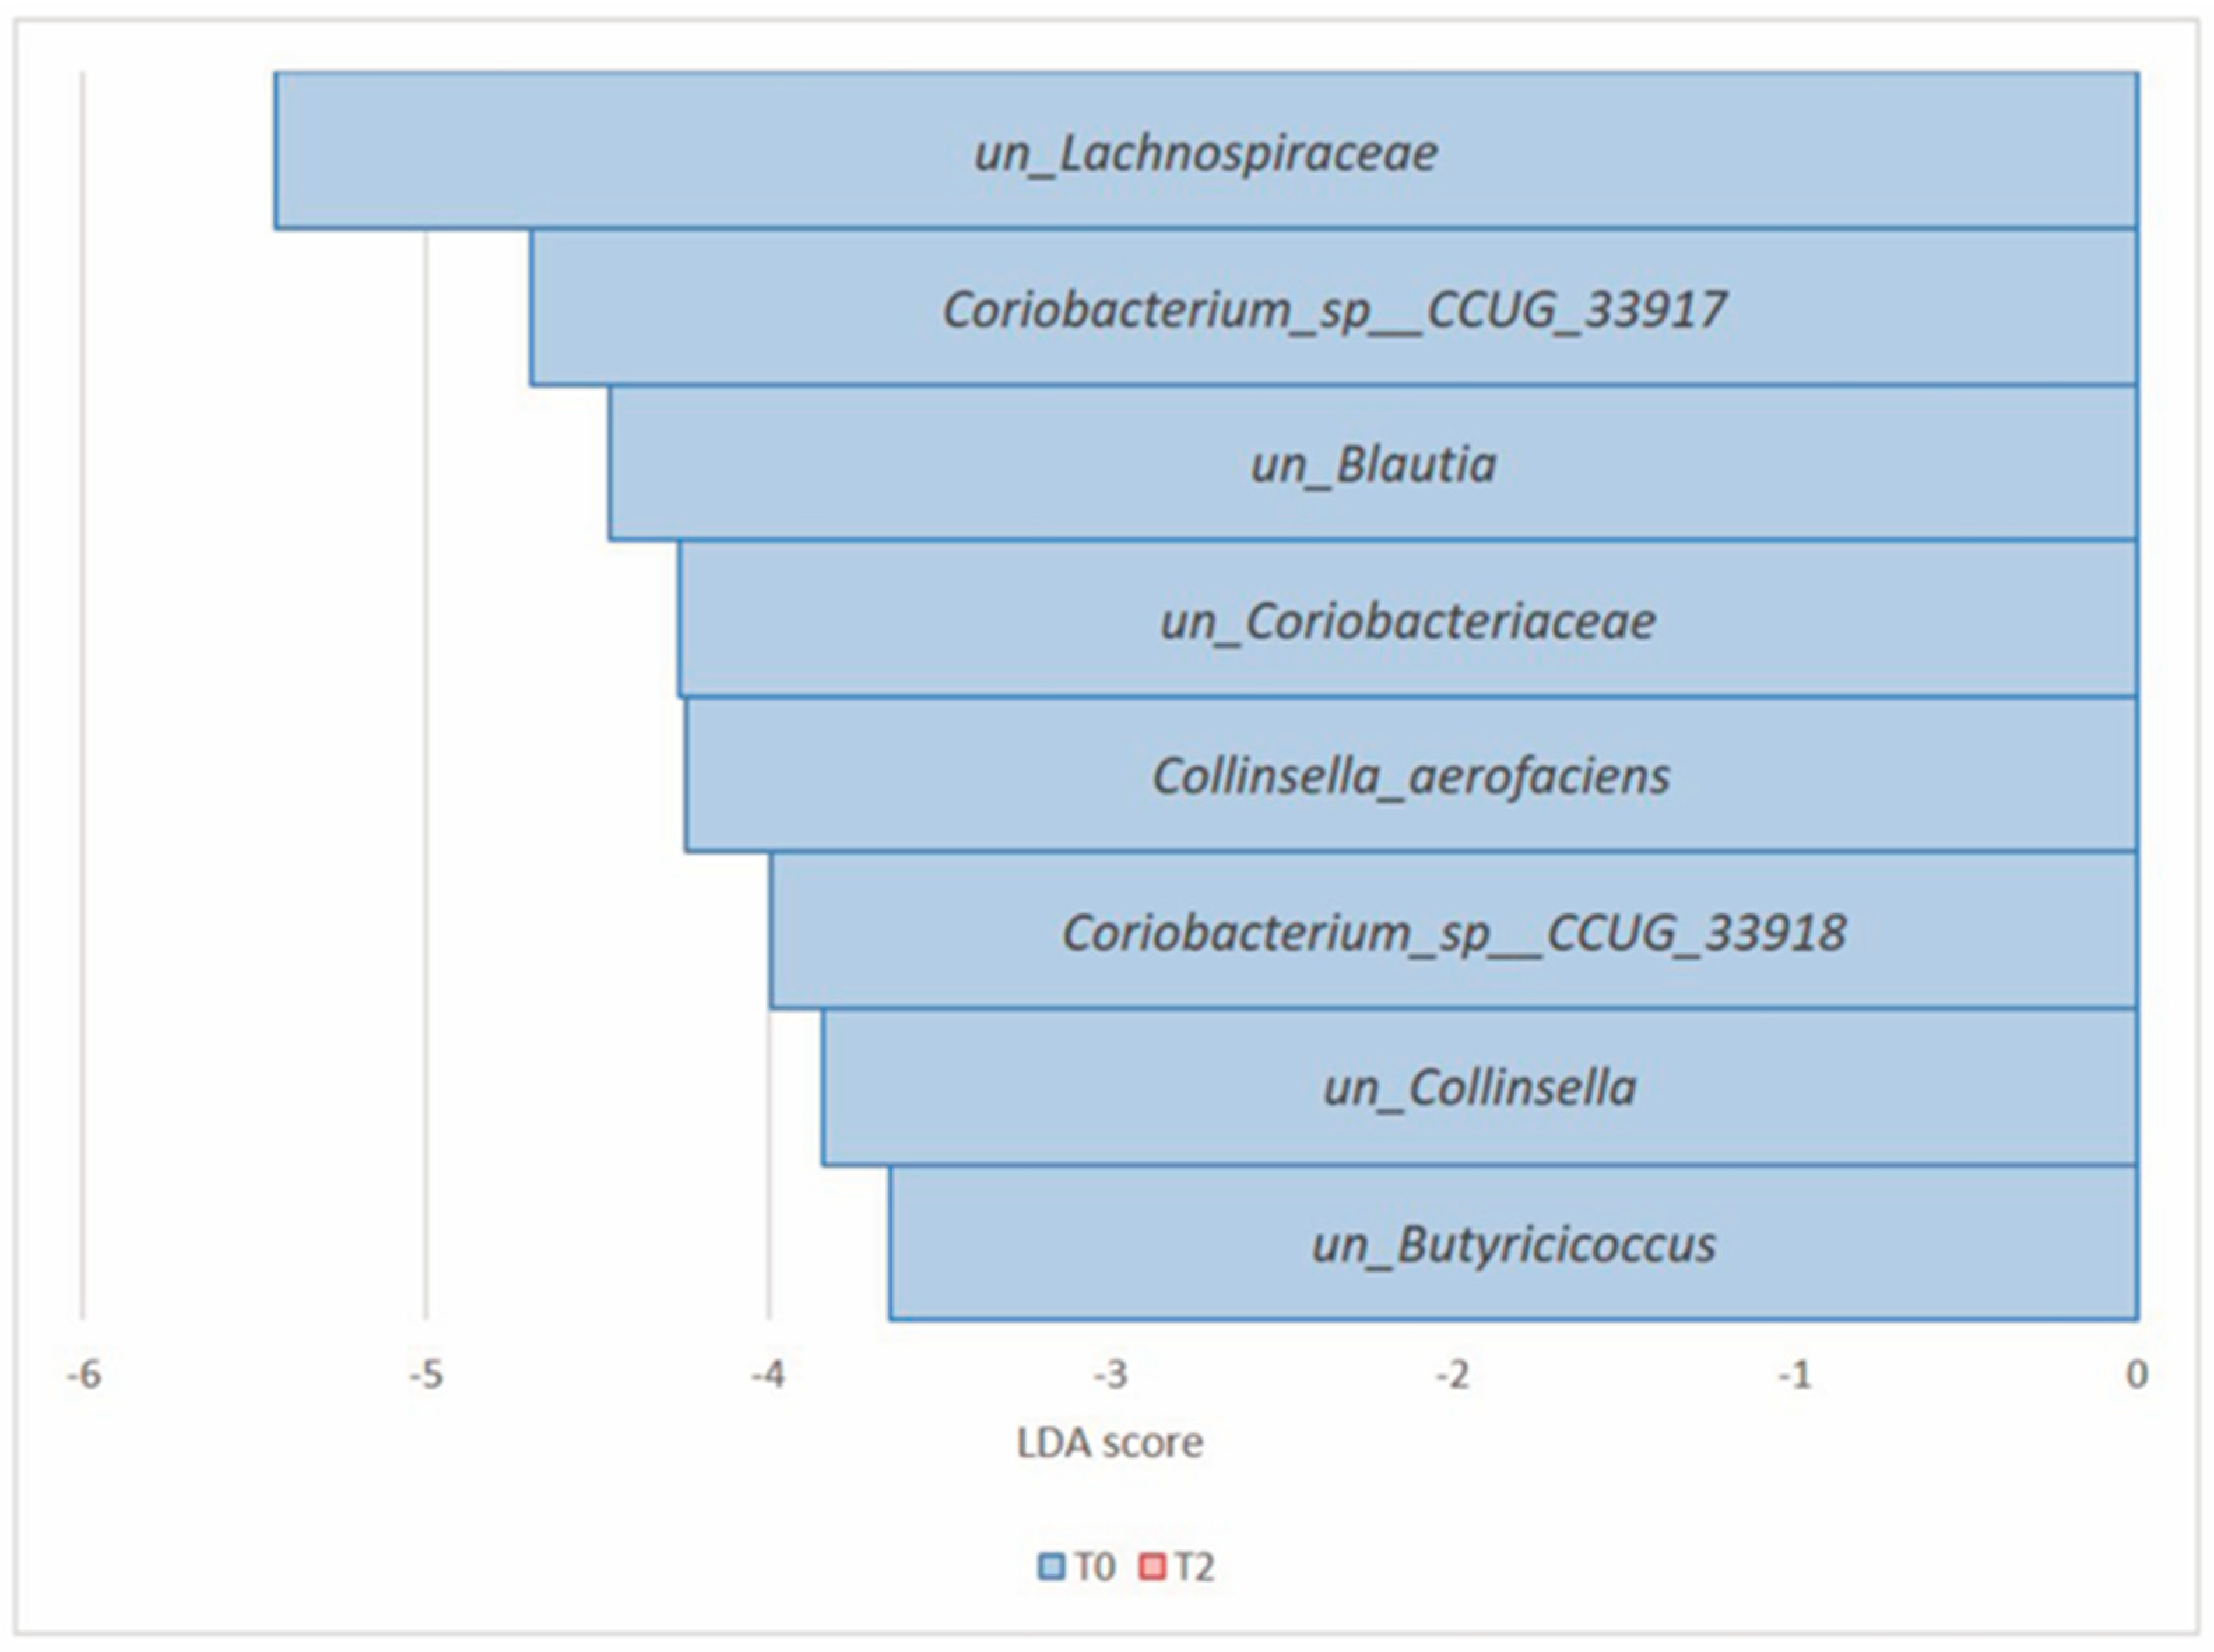
3.2.3. Comparison of the Microbial Diversity in Group A at T0 and T2
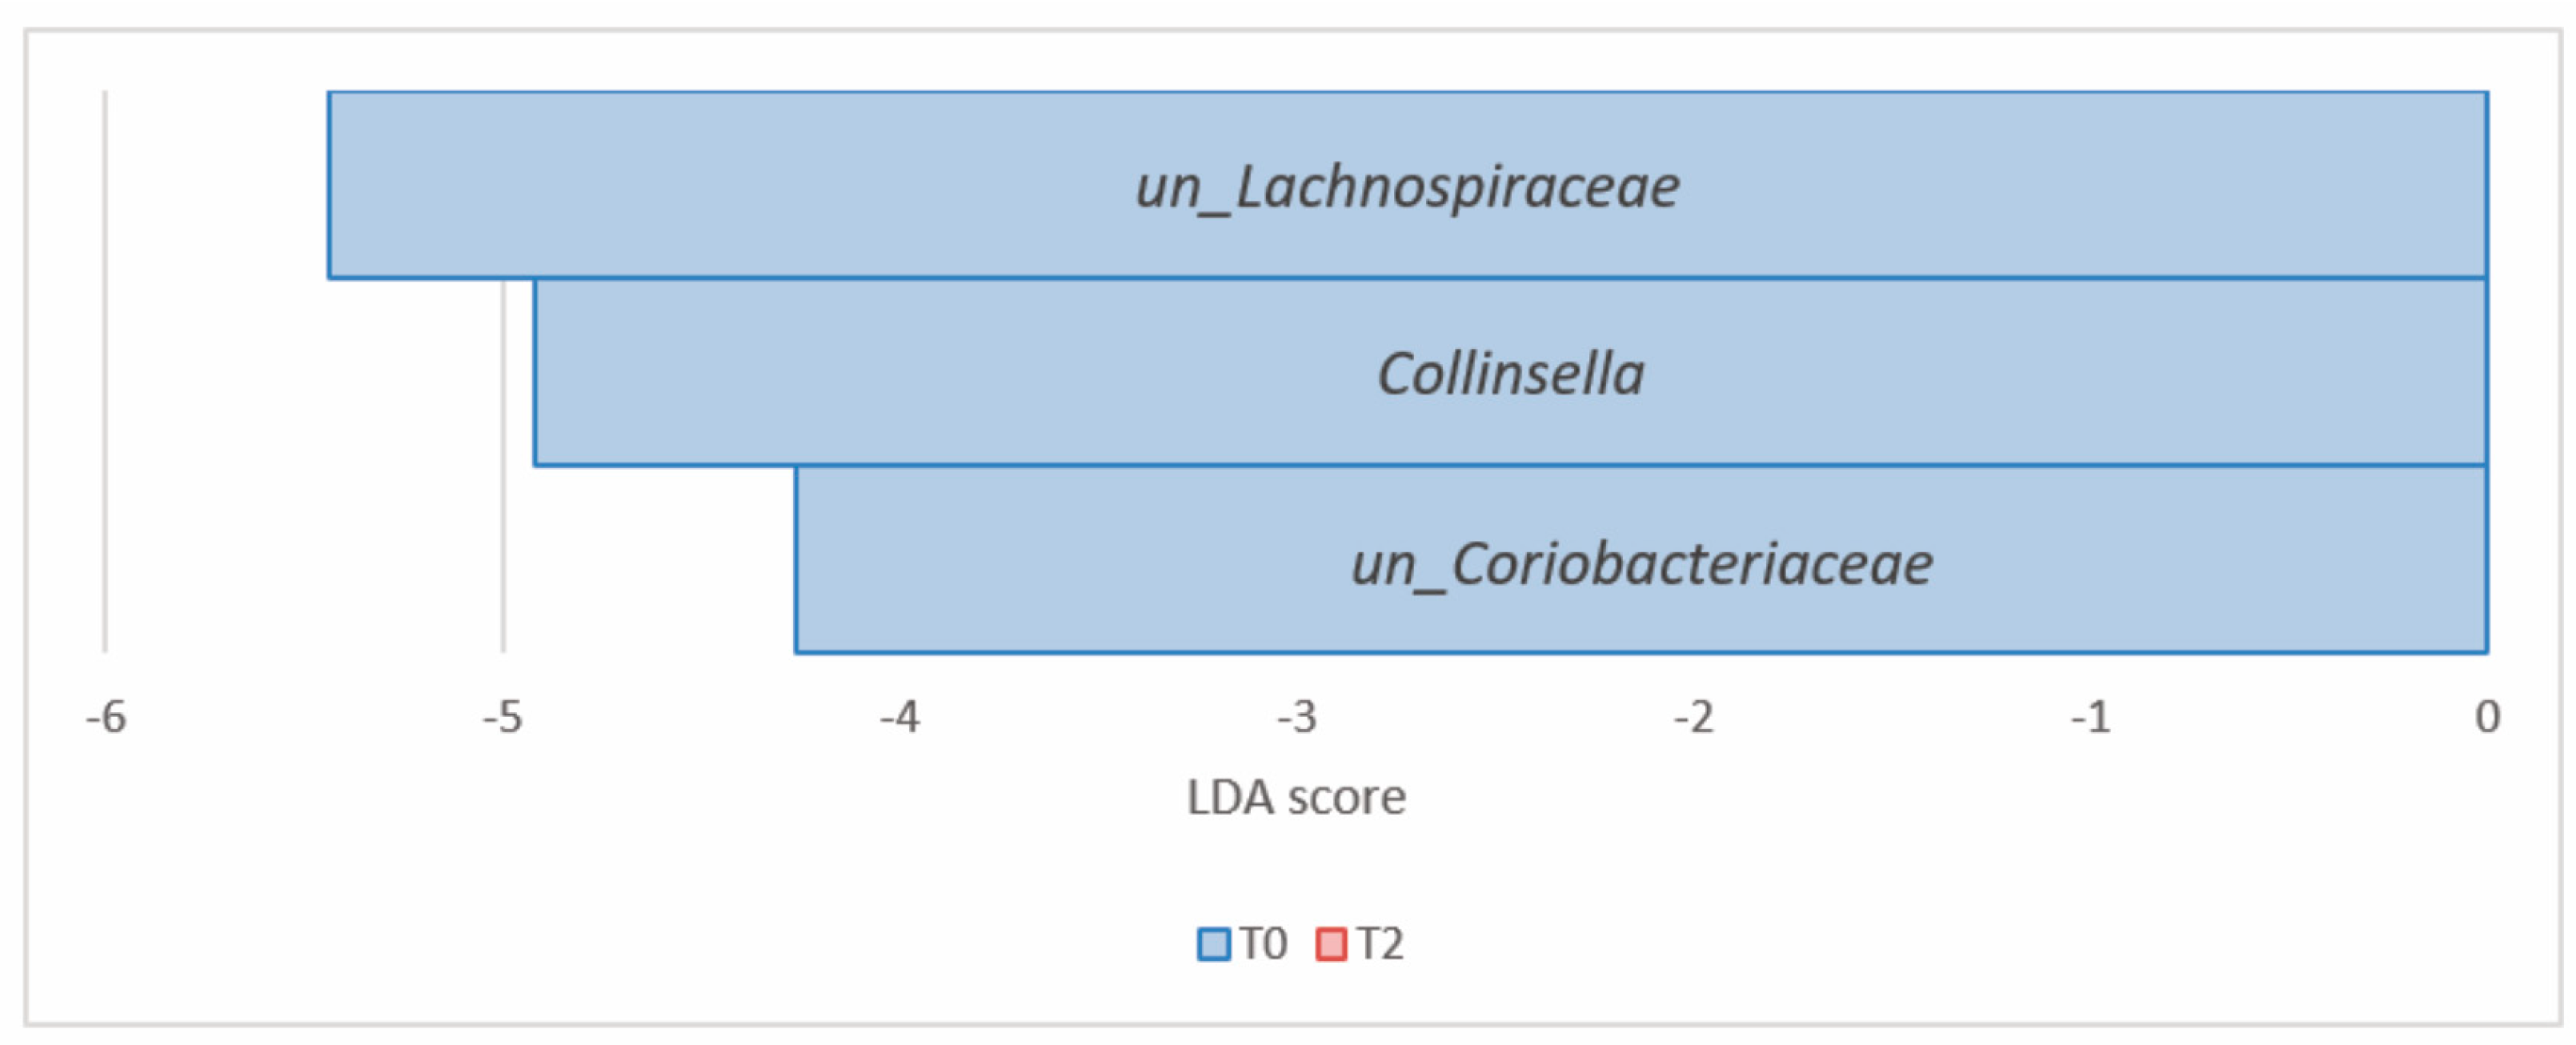
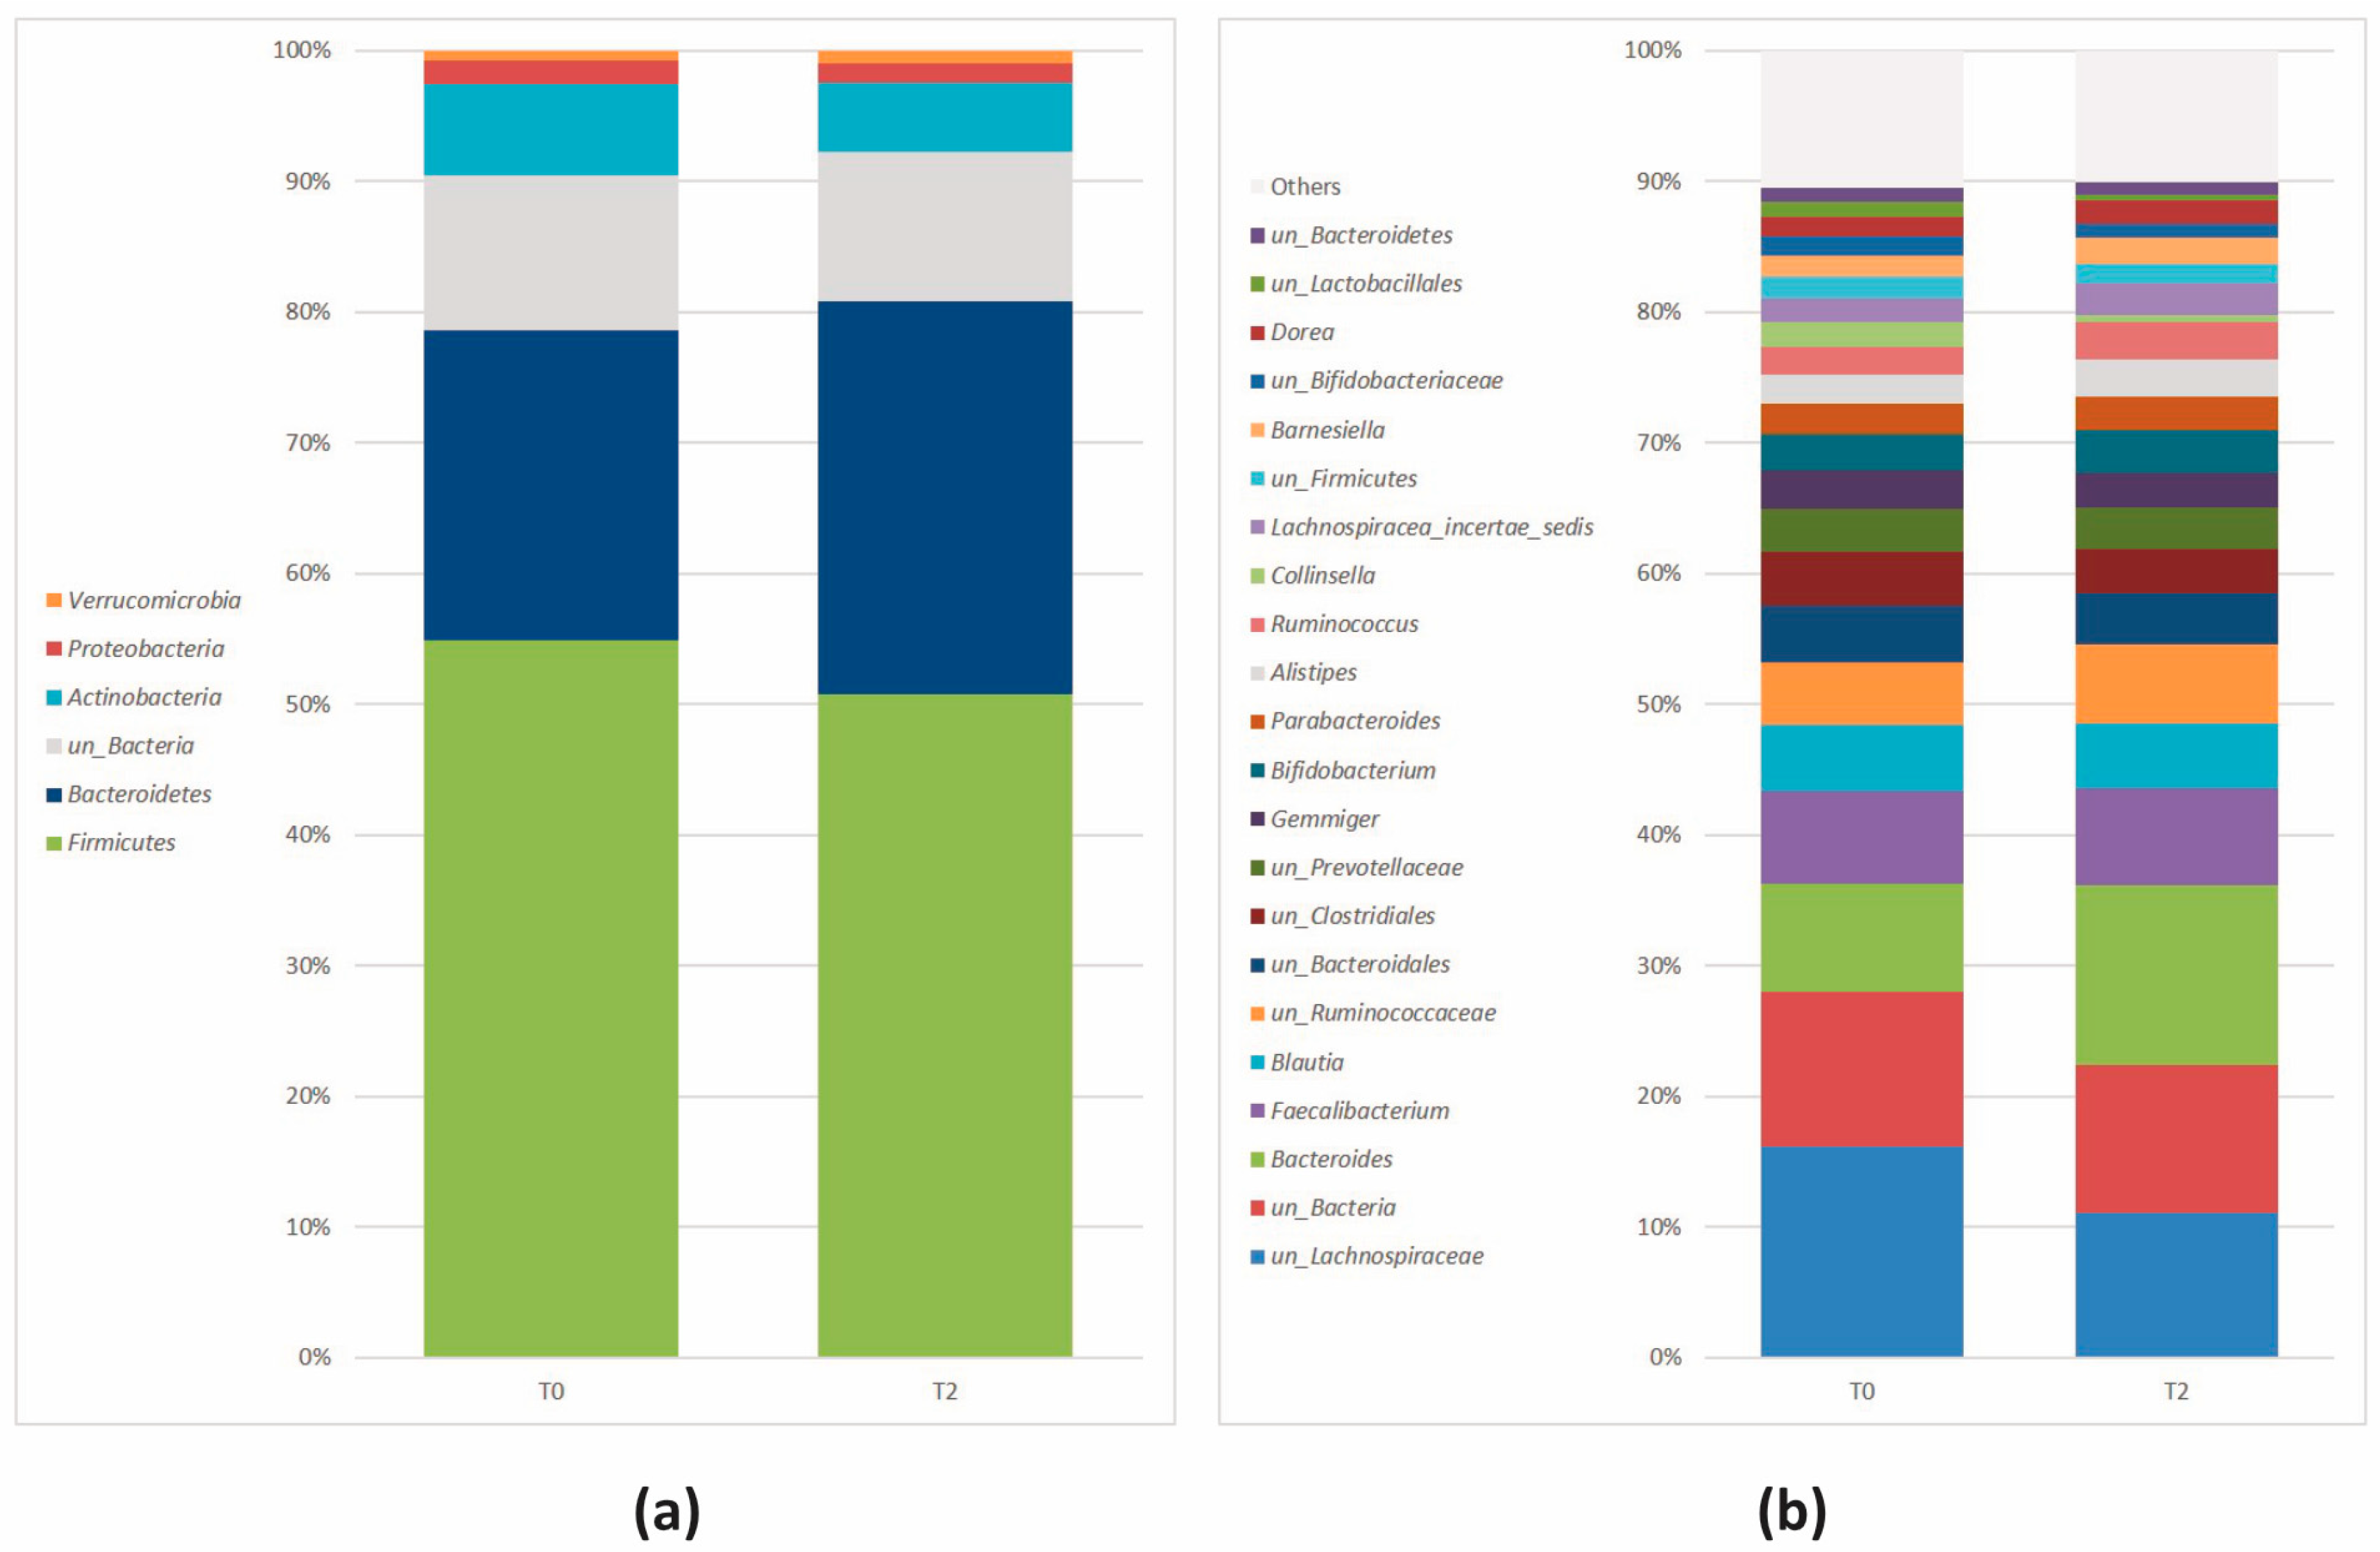
3.2.4. Comparison of the Microbial Diversity of Group B at T0 and T2
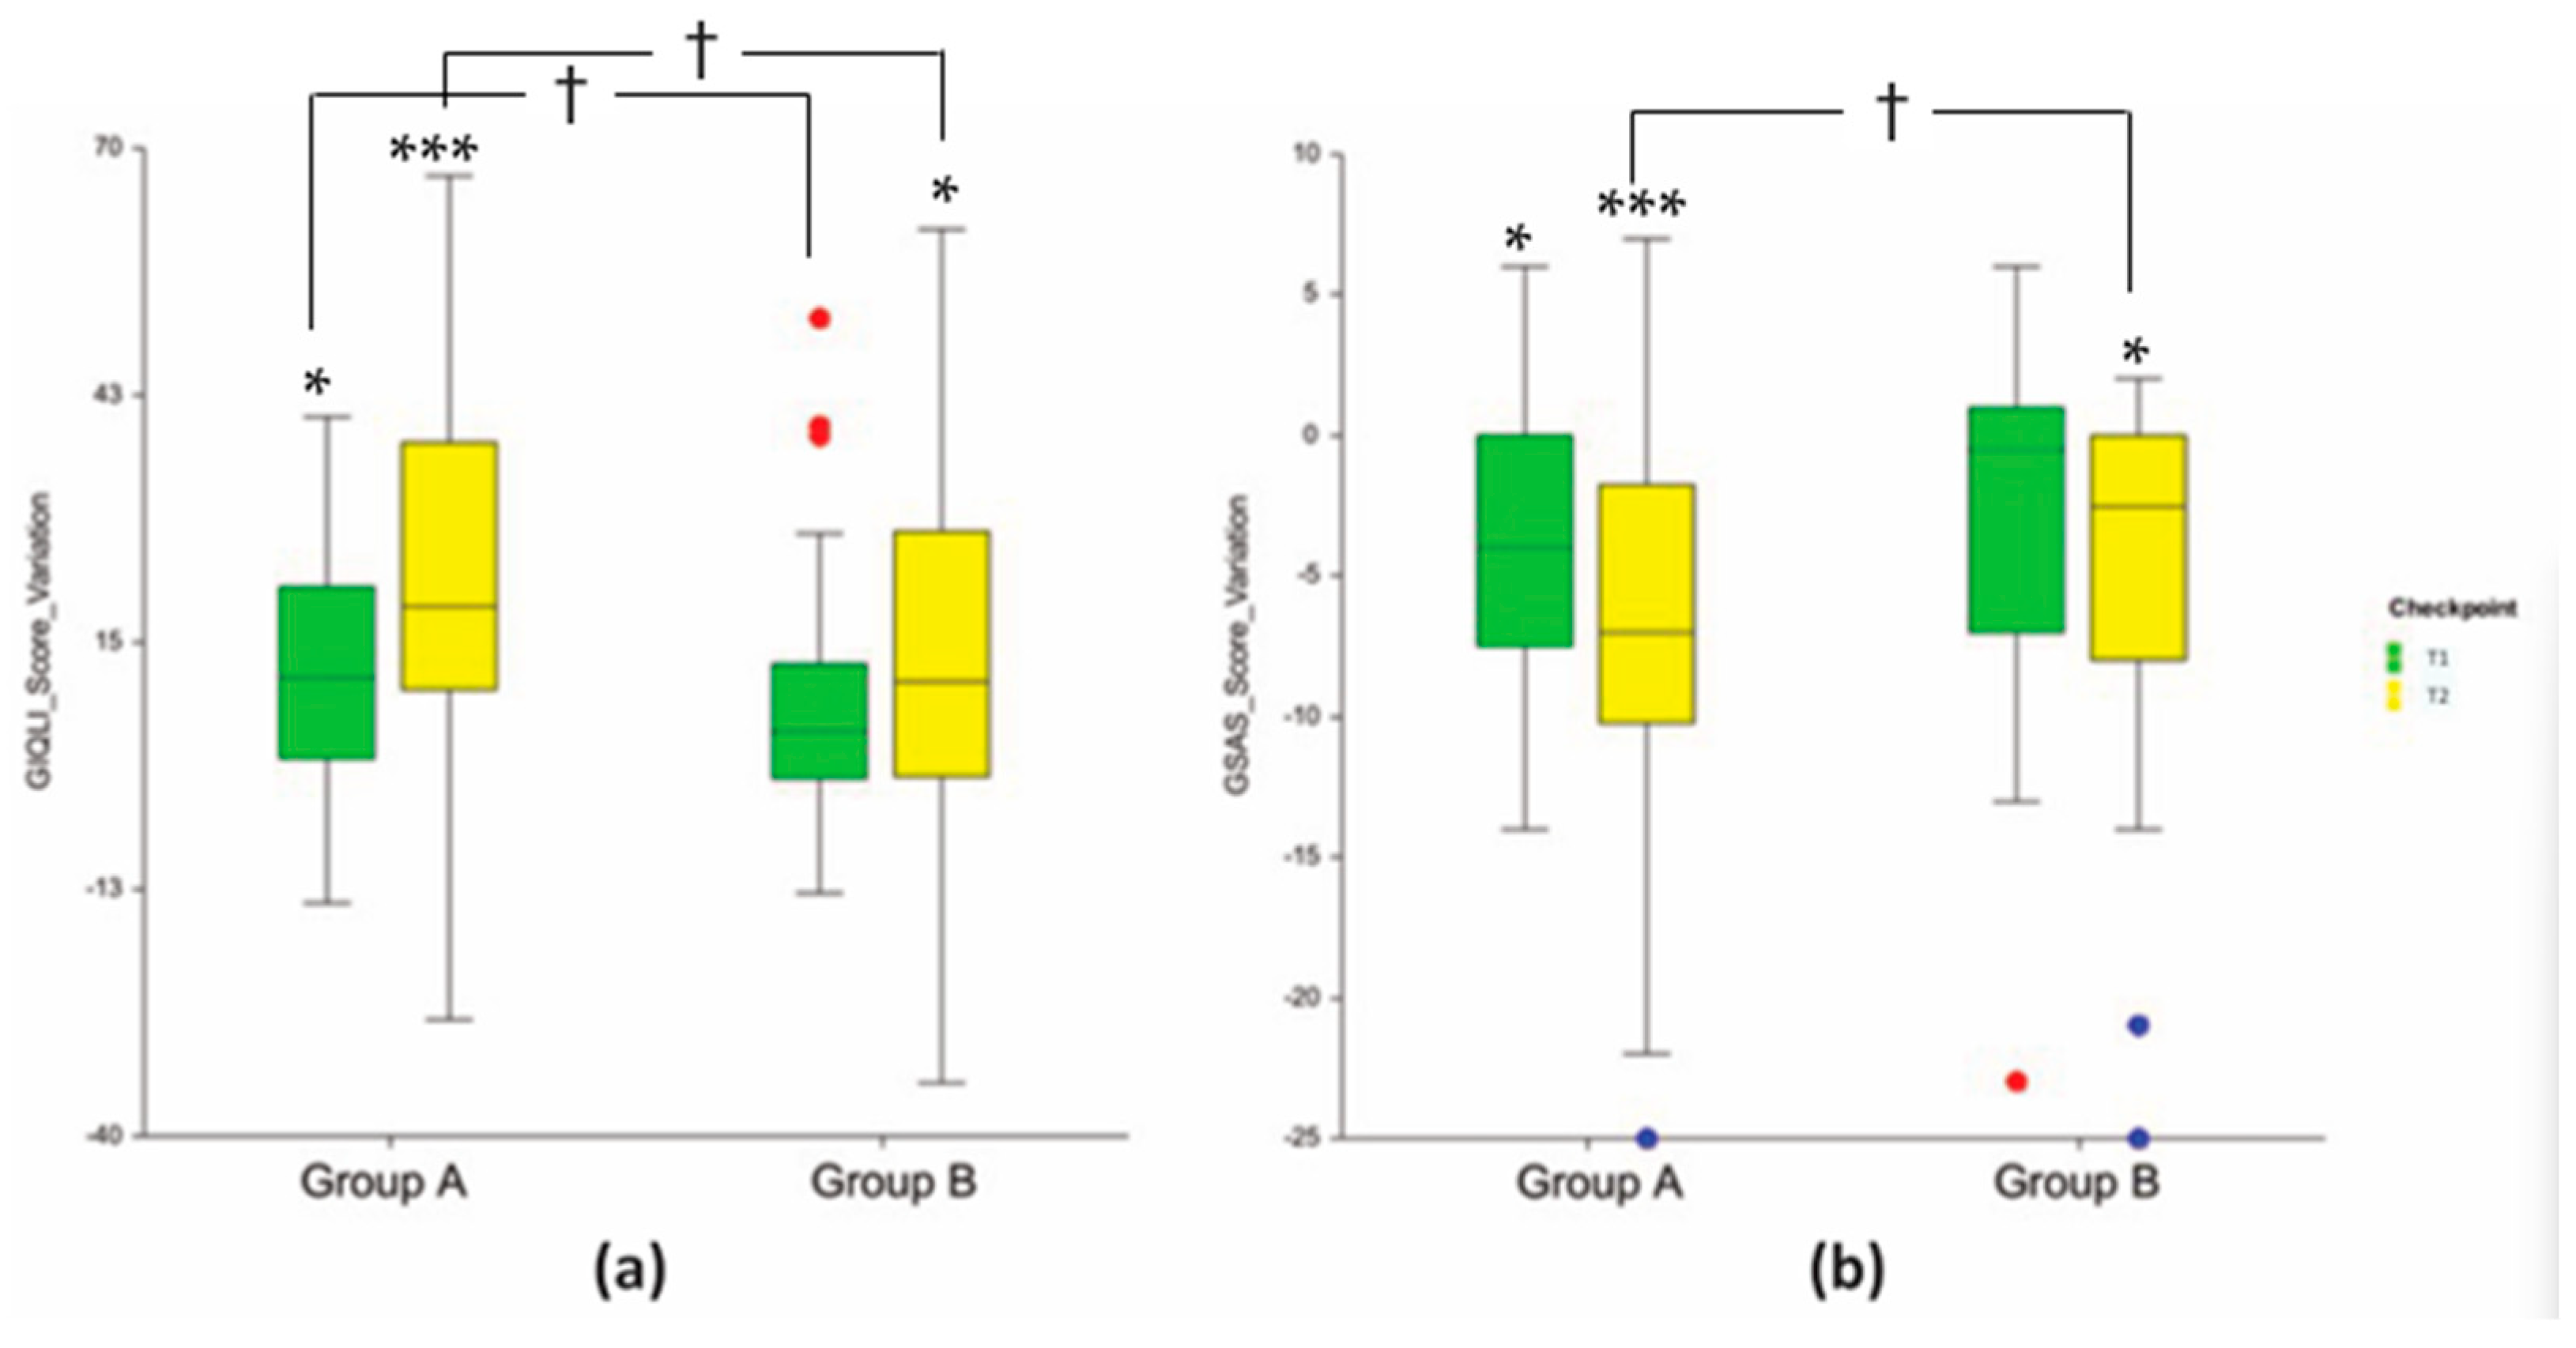
3.3. Clinical Endpoints
4. Discussion
5. Conclusions
Supplementary Materials
Author Contributions
Funding
Institutional Review Board Statement
Informed Consent Statement
Data Availability Statement
Acknowledgments
Conflicts of Interest
References
- Fan, Y.; Pedersen, O. Gut microbiota in human metabolic health and disease. Nat. Rev. Microbiol. 2021, 19, 55–71. [Google Scholar] [CrossRef] [PubMed]
- Hrncir, T. Gut Microbiota Dysbiosis: Triggers, Consequences, Diagnostic and Therapeutic Options. Microorganisms 2022, 10, 578. [Google Scholar] [CrossRef] [PubMed]
- Wei, L.; Singh, R.; Ro, S.; Ghoshal, U.C. Gut microbiota dysbiosis in functional gastrointestinal disorders: Underpinning the symptoms and pathophysiology. JGH Open 2021, 5, 976–987. [Google Scholar] [CrossRef] [PubMed]
- Di Vincenzo, F.; Del Gaudio, A.; Petito, V.; Lopetuso, L.R.; Scaldaferri, F. Gut microbiota, intestinal permeability, and systemic inflammation: A narrative review. Intern. Emerg. Med. 2023, 1–19. [Google Scholar] [CrossRef]
- Holmes, A.; Finger, C.; Morales-Scheihing, D.; Lee, J.; McCullough, L.D. Gut dysbiosis and age-related neurological diseases; an innovative approach for therapeutic interventions. Transl. Res. 2020, 226, 39–56. [Google Scholar] [CrossRef]
- Gallego, C.G.; Salminen, S. Novel Probiotics and Prebiotics: How Can They Help in Human Gut Microbiota Dysbiosis? Appl. Food Biotechnol. 2016, 3, 72–81. [Google Scholar]
- Sanders, M.E.; Merenstein, D.J.; Reid, G.; Gibson, G.R.; Rastall, R.A. Probiotics and prebiotics in intestinal health and disease: From biology to the clinic. Nat. Rev. Gastroenterol. Hepatol. 2019, 16, 605–616. [Google Scholar] [CrossRef] [PubMed]
- Abbas, E.Y.; Ezzat, M.I.; El Hefnawy, H.M.; Abdel-Sattar, E. An overview and update on the chemical composition and potential health benefits of Opuntia ficus-indica (L.) Miller. J. Food. Biochem. 2022, 46, e14310. [Google Scholar] [CrossRef] [PubMed]
- Martins, M.; Ribeiro, M.H.; Almeida, C.M.M. Physicochemical, Nutritional, and Medicinal Properties of Opuntia ficus-indica (L.) Mill. and Its Main Agro-Industrial Use: A Review. Plants 2023, 12, 1512. [Google Scholar] [CrossRef]
- Andreu-Coll, L.; Cano-Lamadrid, M.; Sendra, E.; Carbonell-Barrachina, A.; Legua, P.; Hernández, F. Fatty acid profile of fruits (pulp and peel) and cladodes (young and old) of prickly pear [Opuntia ficus-indica (L.) Mill.] from six Spanish cultivars. J. Food Compos. Anal. 2019, 84, 103294. [Google Scholar] [CrossRef]
- Zhang, Y.; Chang, H.; Shao, S.; Zhao, L.; Zhang, R.; Zhang, S. Anthocyanins from Opuntia ficus-indica Modulate Gut Microbiota Composition and Improve Short-Chain Fatty Acid Production. Biology 2022, 11, 1505. [Google Scholar] [CrossRef] [PubMed]
- Rocchetti, G.; Pellizzoni, M.; Montesano, D.; Lucini, L. Italian Opuntia ficus-indica Cladodes as Rich Source of Bioactive Compounds with Health-Promoting Properties. Foods 2018, 7, 24. [Google Scholar] [CrossRef] [PubMed]
- Messina, C.M.; Arena, R.; Morghese, M.; Santulli, A.; Liguori, G.; Inglese, P. Seasonal characterization of nutritional and antioxidant properties of Opuntia ficus-indica [(L.) Mill.] mucilage. Food Hydrocoll. 2021, 111, 106398. [Google Scholar] [CrossRef]
- Di Lorenzo, F.; Silipo, A.; Molinaro, A.; Parrilli, M.; Schiraldi, C.; D’Agostino, A.; Izzo, E.; Rizza, L.; Bonina, A.; Bonina, F.; et al. The polysaccharide and low molecular weight components of Opuntia ficus indica cladodes: Structure and skin repairing properties. Carbohydr. Polym. 2017, 157, 128–136. [Google Scholar] [CrossRef]
- Missaoui, M.; D’Antuono, I.; D’Imperio, M.; Linsalata, V.; Boukhchina, S.; Logrieco, A.F.; Cardinali, A. Characterization of Micronutrients, Bioaccessibility and Antioxidant Activity of Prickly Pear Cladodes as Functional Ingredient. Molecules 2020, 25, 2176. [Google Scholar] [CrossRef]
- Moran-Ramos, S.; He, X.; Chin, E.L.; Tovar, A.R.; Torres, N.; Slupsky, C.M.; Raybould, H.E. Nopal feeding reduces adiposity, intestinal inflammation and shifts the cecal microbiota and metabolism in high-fat fed rats. PLoS ONE 2017, 12, e0171672. [Google Scholar] [CrossRef]
- Del Socorro Santos Díaz, M.; Barba de la Rosa, A.P.; Héliès-Toussaint, C.; Guéraud, F.; Nègre-Salvayre, A. Opuntia spp.: Characterization and Benefits in Chronic Diseases. Oxid. Med. Cell. Longev. 2017, 2017, 8634249. [Google Scholar] [CrossRef]
- Corona-Cervantes, K.; Parra-Carriedo, A.; Hernández-Quiroz, F.; Martínez-Castro, N.; Vélez-Ixta, J.M.; Guajardo-López, D.; García-Mena, J.; Hernández-Guerrero, C. Physical and Dietary Intervention with Opuntia ficus-indica (Nopal) in Women with Obesity Improves Health Condition through Gut Microbiota Adjustment. Nutrients 2022, 14, 1008. [Google Scholar] [CrossRef]
- Cruz-Rubio, J.M.; Mueller, M.; Viernstein, H.; Loeppert, R.; Praznik, W. Corrigendum to “Prebiotic potential and chemical characterization of the poly and oligosaccharides present in the mucilage of Opuntia ficus-indica and Opuntia joconostle” [Food Chemistry 362 (2021) 130167]. Food Chem. 2023, 418, 136007. [Google Scholar] [CrossRef]
- Malfa, G.A.; Di Giacomo, C.; Cardia, L.; Sorbara, E.E.; Mannucci, C.; Calapai, G. A standardized extract of Opuntia ficus-indica (L.) Mill and Olea europaea L. improves gastrointestinal discomfort: A double-blinded randomized-controlled study. Phytother. Res. 2021, 35, 3756–3768. [Google Scholar] [CrossRef]
- Cammisuli, D.M.; Fusi, J.; Scarfò, G.; Daniele, S.; Castelnuovo, G.; Franzoni, F. A Minireview Exploring the Interplay of the Muscle-Gut-Brain (MGB) Axis to Improve Knowledge on Mental Disorders: Implications for Clinical Neuroscience Research and Therapeutics. Oxid. Med. Cell Longev. 2022, 8806009. [Google Scholar] [CrossRef]
- Ewing, B.; Hillier, L.; Wendl, M.C.; Green, P. Base-calling of automated sequencer traces using phred. I. Accuracy assessment. Genome Res. 1996, 3, 175–185. [Google Scholar] [CrossRef]
- Cole, R.J.; Wang, Q.; Fish, J.A.; Chai, B.; McGarrell, D.M.; Sun, Y.; Brown, C.T.; Porras-Alfaro, A.; Kuske, C.R.; Tiedje, J.M. Ribosomal Database Project: Data and tools for high throughput rRNA analysis. Nucleic Acids Res. 2014, 42, D633–D642. [Google Scholar] [CrossRef]
- Bona, E.; Massa, N.; Toumatia, O.; Novello, G.; Cesaro, P.; Todeschini, V.; Boatti, L.; Mignone, F.; Titouah, H.; Zitouni, A.; et al. Climatic Zone and Soil Properties Determine the Biodiversity of the Soil Bacterial Communities Associated to Native Plants from Desert Areas of North-Central Algeria. Microorganisms 2021, 9, 1359. [Google Scholar] [CrossRef]
- Torre, E.; Sola, D.; Caramaschi, A.; Mignone, F.; Bona, E.; Fallarini, S. A Pilot Study on Clinical Scores, Immune Cell Modulation, and Microbiota Composition in Allergic Patients with Rhinitis and Asthma Treated with a Probiotic Preparation. Int. Arch. Allergy Immunol. 2022, 183, 186–200. [Google Scholar] [CrossRef] [PubMed]
- Oren, A.; Garrity, G.M. Valid publication of the names of forty-two phyla of prokaryotes. Int. J. Syst. Evol. Microbiol. 2021, 71, 005056. [Google Scholar] [CrossRef] [PubMed]
- Eypasch, E.; Wood-Dauphinée, S.; Williams, J.I.; Neugebauer, E.; Troidl, H. The gastrointestinal quality of life index. A clinical index for measuring patient status in gastroenterologic surgery. Der Chir. Z. Fur Alle Geb. Der Oper. Medizen 1993, 64, 264–274. [Google Scholar]
- Borgaonkar, M.R.; Irvine, E.J. Quality of life measurement in gastrointestinal and liver disorders. Gut 2000, 47, 444–454. [Google Scholar] [CrossRef]
- Damiano, A.; Handley, K.; Adler, E.; Siddique, R.; Bhattacharyja, A. Measuring symptom distress and health-related quality of life in clinical trials of gastroesophageal reflux disease treatment: Further validation of the Gastroesophageal Reflux Disease Symptom Assessment Scale (GSAS). Dig. Dis. Sci. 2002, 47, 1530–1537. [Google Scholar] [CrossRef] [PubMed]
- Fass, R. Symptom assessment tools for gastroesophageal reflux disease (GERD) treatment. J. Clin. Gastroenterol. 2007, 41, 437–444. [Google Scholar] [CrossRef]
- McMurdie, P.J.; Holmes, S. phyloseq: An R package for reproducible interactive analysis and graphics of microbiome census data. PLoS ONE 2013, 8, e61217. [Google Scholar] [CrossRef]
- Dhariwal, A.; Chong, J.; Habib, S.; King, I.; Agellon, L.; Xia, J. MicrobiomeAnalyst: A web-based tool for comprehensive statistical, visual and meta-analysis of microbiome data. Nucleic Acids Res. 2017, 45, W180–W188. [Google Scholar] [CrossRef]
- Programma Nazionale sul Trapianto Fecale del Ministero della Salute-DGPRE 0018191-P-15/06/2018. Available online: https://www.salute.gov.it/imgs/C_17_pubblicazioni_2800_allegato.pdf (accessed on 19 April 2023).
- Cuevas-Sierra, A.; Ramos-Lopez, O.; Riezu-Boj, J.I.; Milagro, F.I.; Martinez, J.A. Diet, Gut Microbiota, and Obesity: Links with Host Genetics and Epigenetics and Potential Applications. Adv. Nutr. 2019, 10, S17–S30. [Google Scholar] [CrossRef]
- Liu, B.N.; Liu, X.T.; Liang, Z.H.; Wang, J.H. Gut microbiota in obesity. World J. Gastroenterol. 2021, 27, 3837–3850. [Google Scholar] [CrossRef]
- Perrotta, G. Intestinal dysbiosis: Definition, clinical implications, and proposed treatment protocol (Perrotta Protocol for Clinical Management of Intestinal Dysbiosis, PID) for the management and resolution of persistent or chronic dysbiosis. Arch. Clin. Gastroenterol. 2021, 7, 056–063. [Google Scholar] [CrossRef]
- Di Pierro, F. Gut Microbiota Parameters Potentially Useful in Clinical Perspective. Microorganisms 2021, 9, 2402. [Google Scholar] [CrossRef] [PubMed]
- Magne, F.; Gotteland, M.; Gauthier, L.; Zazueta, A.; Pesoa, S.; Navarrete, P.; Balamurugan, R. The Firmicutes/Bacteroidetes Ratio: A Relevant Marker of Gut Dysbiosis in Obese Patients? Nutrients 2020, 12, 1474. [Google Scholar] [CrossRef] [PubMed]
- Clavel, T.; Lepage, P.; Charrier, C. The Family Coriobacteriaceae. In The Prokaryotes, 4th ed.; Rosenberg, E., DeLong, E.F., Lory, S., Stackebrandt, E., Thompson, F., Eds.; Springer: Berlin/Heidelberg, Germany, 2014; pp. 201–238. [Google Scholar]
- Chen, J.; Wright, K.; Davis, J.M.; Jeraldo, P.; Marietta, E.V.; Murray, J.; Nelson, H.; Matteson, E.L.; Taneja, V. An expansion of rare lineage intestinal microbes characterizes rheumatoid arthritis. Genome Med. 2016, 8, 43. [Google Scholar] [CrossRef] [PubMed]
- Ozato, N.; Saito, S.; Yamaguchi, T.; Katashima, M.; Tokuda, I.; Sawada, K.; Katsuragi, Y.; Kakuta, M.; Imoto, S.; Ihara, K.; et al. Blautia genus associated with visceral fat accumulation in adults 20–76 years of age. npj Biofilms Microbiomes 2019, 5, 28. [Google Scholar] [CrossRef] [PubMed]
- Vacca, M.; Celano, G.; Calabrese, F.M.; Portincasa, P.; Gobbetti, M.; De Angelis, M. The Controversial Role of Human Gut Lachnospiraceae. Microorganisms 2020, 8, 573. [Google Scholar] [CrossRef] [PubMed]
- Brunkwall, L.; Ericson, U.; Nilsson, P.M.; Orho-Melander, M.; Ohlsson, B. Self-reported bowel symptoms are associated with differences in overall gut microbiota composition and enrichment of Blautia in a population-based cohort. J. Gastroenterol. Hepatol. 2021, 36, 174–180. [Google Scholar] [CrossRef]
- Strandwitz, P.; Kim, K.H.; Terekhova, D.; Liu, J.K.; Sharma, A.; Levering, J.; McDonald, D.; Dietrich, D.; Ramadhar, T.R.; Lekbua, A.; et al. GABA-modulating bacteria of the human gut microbiota. Nat. Microbiol. 2019, 3, 396–403. [Google Scholar] [CrossRef] [PubMed]
- Otaru, N.; Ye, K.; Mujezinovic, D.; Berchtold, L.; Constancias, F.; Cornejo, F.A.; Krzystek, A.; de Wouters, T.; Braegger, C.; Lacroix, C.; et al. GABA Production by Human Intestinal Bacteroides spp.: Prevalence, Regulation, and Role in Acid Stress Tolerance. Front. Microbiol. 2021, 12, 656895. [Google Scholar] [CrossRef] [PubMed]
- Guo, P.; Zhang, K.; Ma, X.; He, P. Clostridium species as probiotics: Potentials and challenges. J. Anim. Sci. Biotechnol. 2020, 11, 24. [Google Scholar] [CrossRef] [PubMed]
- Yano, J.M.; Yu, K.; Donaldson, G.P.; Shastri, G.G.; Ann, P.; Ma, L.; Nagler, C.R.; Ismagilov, R.F.; Mazmanian, S.K.; Hsiao, E.Y. Indigenous bacteria from the gut microbiota regulate host serotonin biosynthesis. Cell 2015, 161, 264–276, Erratum in Cell 2015, 163, 258. [Google Scholar] [CrossRef]
- Dalile, B.; Van Oudenhove, L.; Vervliet, B.; Verbeke, K. The role of short-chain fatty acids in microbiota-gut-brain communication. Nat. Rev. Gastroenterol. Hepatol. 2019, 16, 461–478. [Google Scholar] [CrossRef] [PubMed]
- Silva, Y.P.; Bernardi, A.; Frozza, R.L. The Role of Short-Chain Fatty Acids From Gut Microbiota in Gut-Brain Communication. Front. Endocrinol. 2020, 11, 25. [Google Scholar] [CrossRef] [PubMed]
- Shandilya, S.; Kumar, S.; Kumar Jha, N.; Kumar Kesari, K.; Ruokolainen, J. Interplay of gut microbiota and oxidative stress: Perspective on neurodegeneration and neuroprotection. J. Adv. Res. 2021, 38, 223–244. [Google Scholar] [CrossRef] [PubMed]
- Geirnaert, A.; Calatayud, M.; Grootaert, C.; Laukens, D.; Devriese, S.; Smagghe, G.; De Vos, M.; Boon, N.; Van de Wiele, T. Butyrate-producing bacteria supplemented in vitro to Crohn’s disease patient microbiota increased butyrate production and enhanced intestinal epithelial barrier integrity. Sci. Rep. 2017, 7, 11450. [Google Scholar] [CrossRef]
- Almutairi, R.; Basson, A.R.; Wearsh, P.; Cominelli, F.; Rodriguez-Palacios, A. Validity of food additive maltodextrin as placebo and effects on human gut physiology: Systematic review of placebo-controlled clinical trials. Eur. J. Nutr. 2022, 61, 2853–2871. [Google Scholar] [CrossRef]
- Calgaro, M.; Pandolfo, M.; Salvetti, E.; Marotta, A.; Larini, I.; Pane, M.; Amoruso, A.; Del Casale, A.; Vitulo, N.; Fiorio, M.; et al. Metabarcoding analysis of gut microbiota of healthy individuals reveals impact of probiotic and maltodextrin consumption. Benef. Microbes. 2021, 12, 121–136. [Google Scholar] [CrossRef] [PubMed]
- Cook, S.I.; Sellin, J.H. Review article: Short chain fatty acids in health and disease. Aliment. Pharmacol. Ther. 1998, 12, 499–507. [Google Scholar] [CrossRef]
- Sun, J.; Ling, Z.; Wang, F.; Chen, W.; Li, H.; Jin, J.; Zhang, H.; Pang, M.; Yu, J.; Liu, J. Clostridium butyricum pretreatment at-tenuates cerebral ischemia/reperfusion injury in mice via anti-oxidation and anti-apoptosis. Neurosci. Lett. 2016, 613, 30–35. [Google Scholar] [CrossRef] [PubMed]
- Boets, E.; Gomand, S.V.; Deroover, L.; Preston, T.; Vermeulen, K.; De Preter, V.; Hamer, H.M.; Van den Mooter, G.; De Vuyst, L.; Courtin, C.M.; et al. Systemic availability and metabolism of colonic-derived short-chain fatty acids in healthy subjects: A stable isotope study. J. Physiol. 2017, 595, 541–555. [Google Scholar] [CrossRef] [PubMed]
- Yin, Y.; Guo, Q.; Zhou, X.; Duan, Y.; Yang, Y.; Gong, S.; Han, M.; Liu, Y.; Yang, Z.; Chen, Q.; et al. Role of brain-gut-muscle axis in human health and energy homeostasis. Front. Nutr. 2022, 9, 947033. [Google Scholar] [CrossRef]
- Fu, J.; Zheng, Y.; Gao, Y.; Xu, W. Dietary Fiber Intake and Gut Microbiota in Human Health. Microorganisms 2022, 10, 2507. [Google Scholar] [CrossRef]


| Group A (n = 38) | Group B (n = 38) | p Value 1 | ||
|---|---|---|---|---|
| Age (years) | 36.0 ± 1.7 | 36.9 ± 1.6 | 0.6918 | |
| Sex | ||||
| Male | 16 (42.1%) | 15 (39.5%) | 0.8166 | |
| Female | 22 (57.9%) | 23 (60.5%) | 0.8166 | |
| Weight (kg) | 73.7 ± 2.1 | 71.0 ± 2.1 | 0.3543 | |
| Height (cm) | 169.8 ± 1.6 | 168.3 ± 1.6 | 0.5151 | |
| BMI (kg/m2) | 25.5 ± 0.6 | 25.0 ± 0.6 | 0.5135 | |
| Hip (cm) | 97.3 ± 1.8 | 95.9 ± 1.7 | 0.5990 | |
| Waist (cm) | 83.0 ± 0.1 | 82.1 ± 1.7 | 0.7189 | |
| GIQLI (score) | 91.2 ± 3.4 | 92.0 ± 3.0 | 0.8539 | |
| GSAS (score) | 13.1 ± 1.2 | 13.2 ± 1.2 | 0.9628 |
| T0 | T2 | ||||
|---|---|---|---|---|---|
| Phylum | p Value | FDR | Rel Abundance (%) | Rel Abundance (%) | LDA Score |
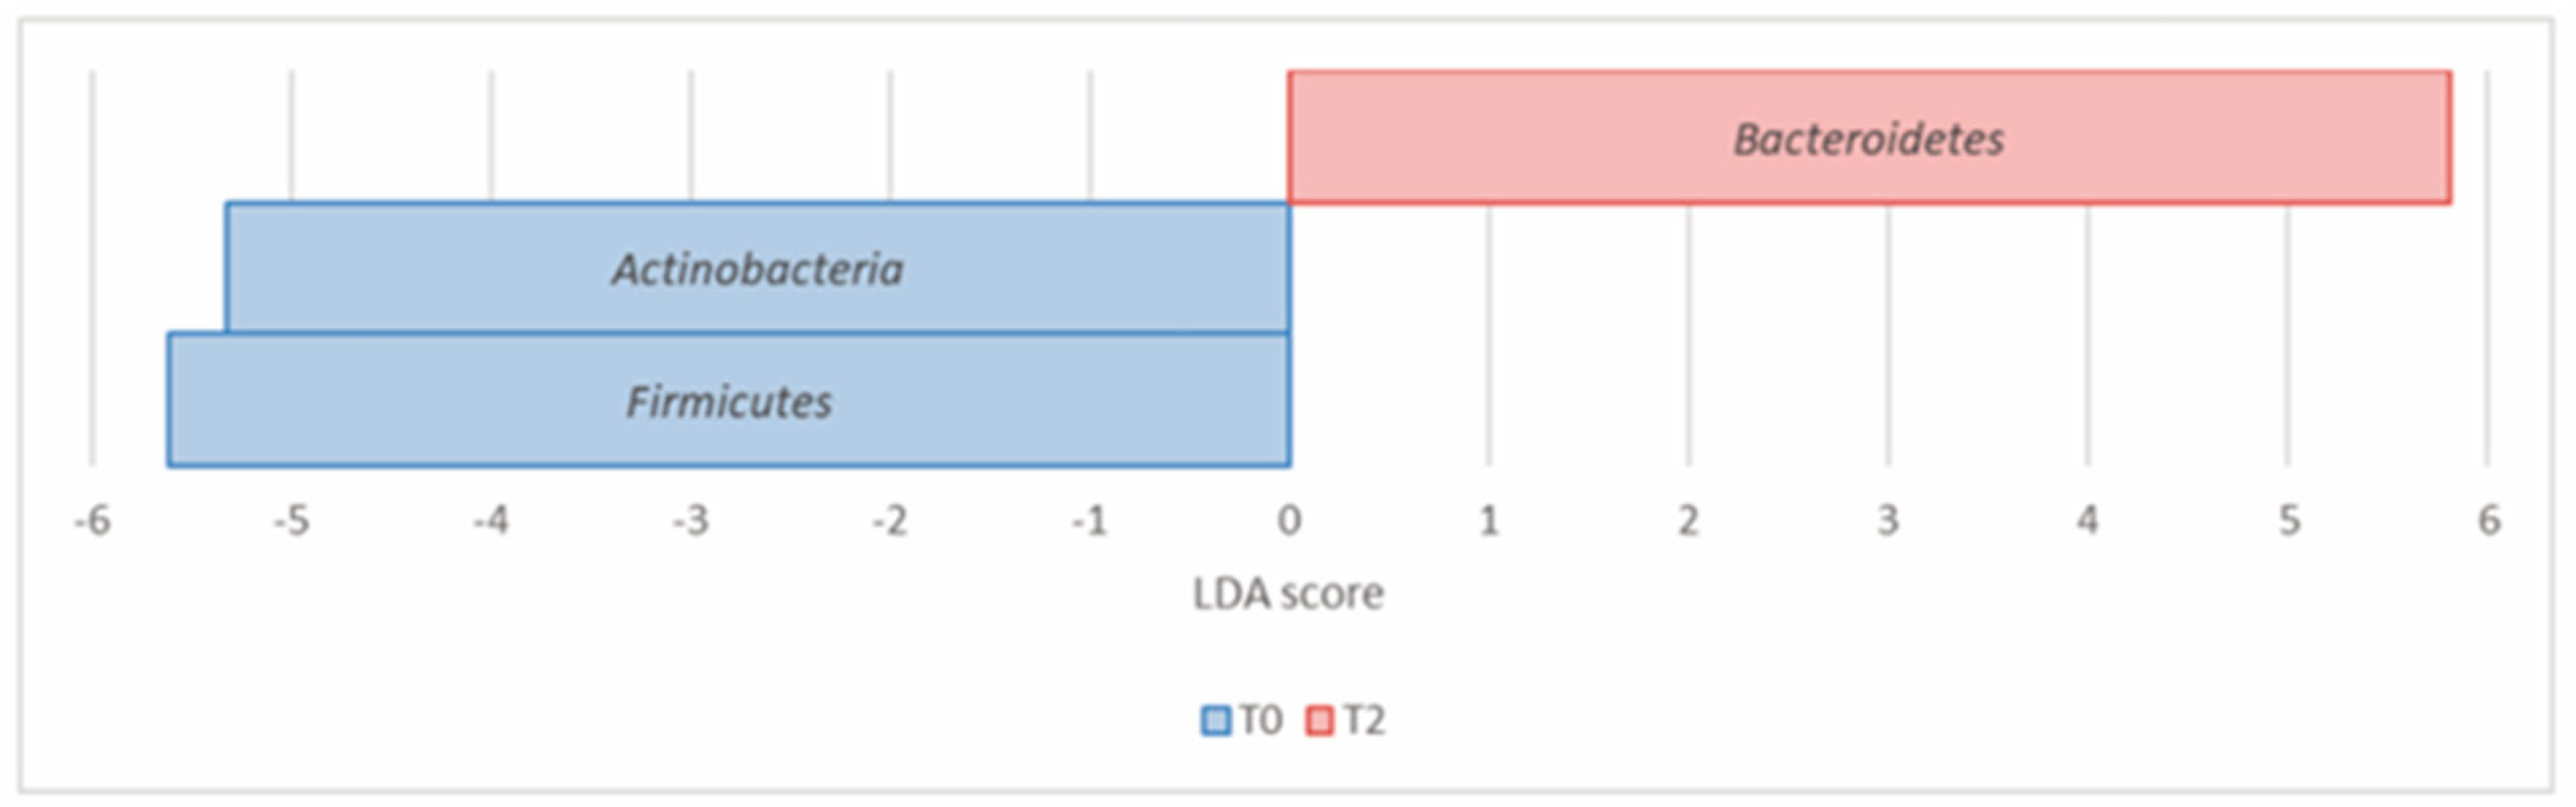
| Actinobacteria (Actinomycetota) | 7.07 × 10⁻⁴ | 1.77 × 10⁻³ | 8.49 | 5.98 | –5.32 |
| Bacteroidetes (Bacteroidota) | 6.07 × 10⁻⁴ | 1.77 × 10⁻³ | 21.51 | 31.48 | 5.81 |
| Firmicutes (Bacillota) | 1.09 × 10⁻² | 1.82 × 10⁻² | 55.85 | 49.10 | –5.61 |
| T0 | T2 | |||||
|---|---|---|---|---|---|---|
| Phylum | Genus | p Value | FDR | Rel Abundance (%) | Rel Abundance (%) | LDA Score |
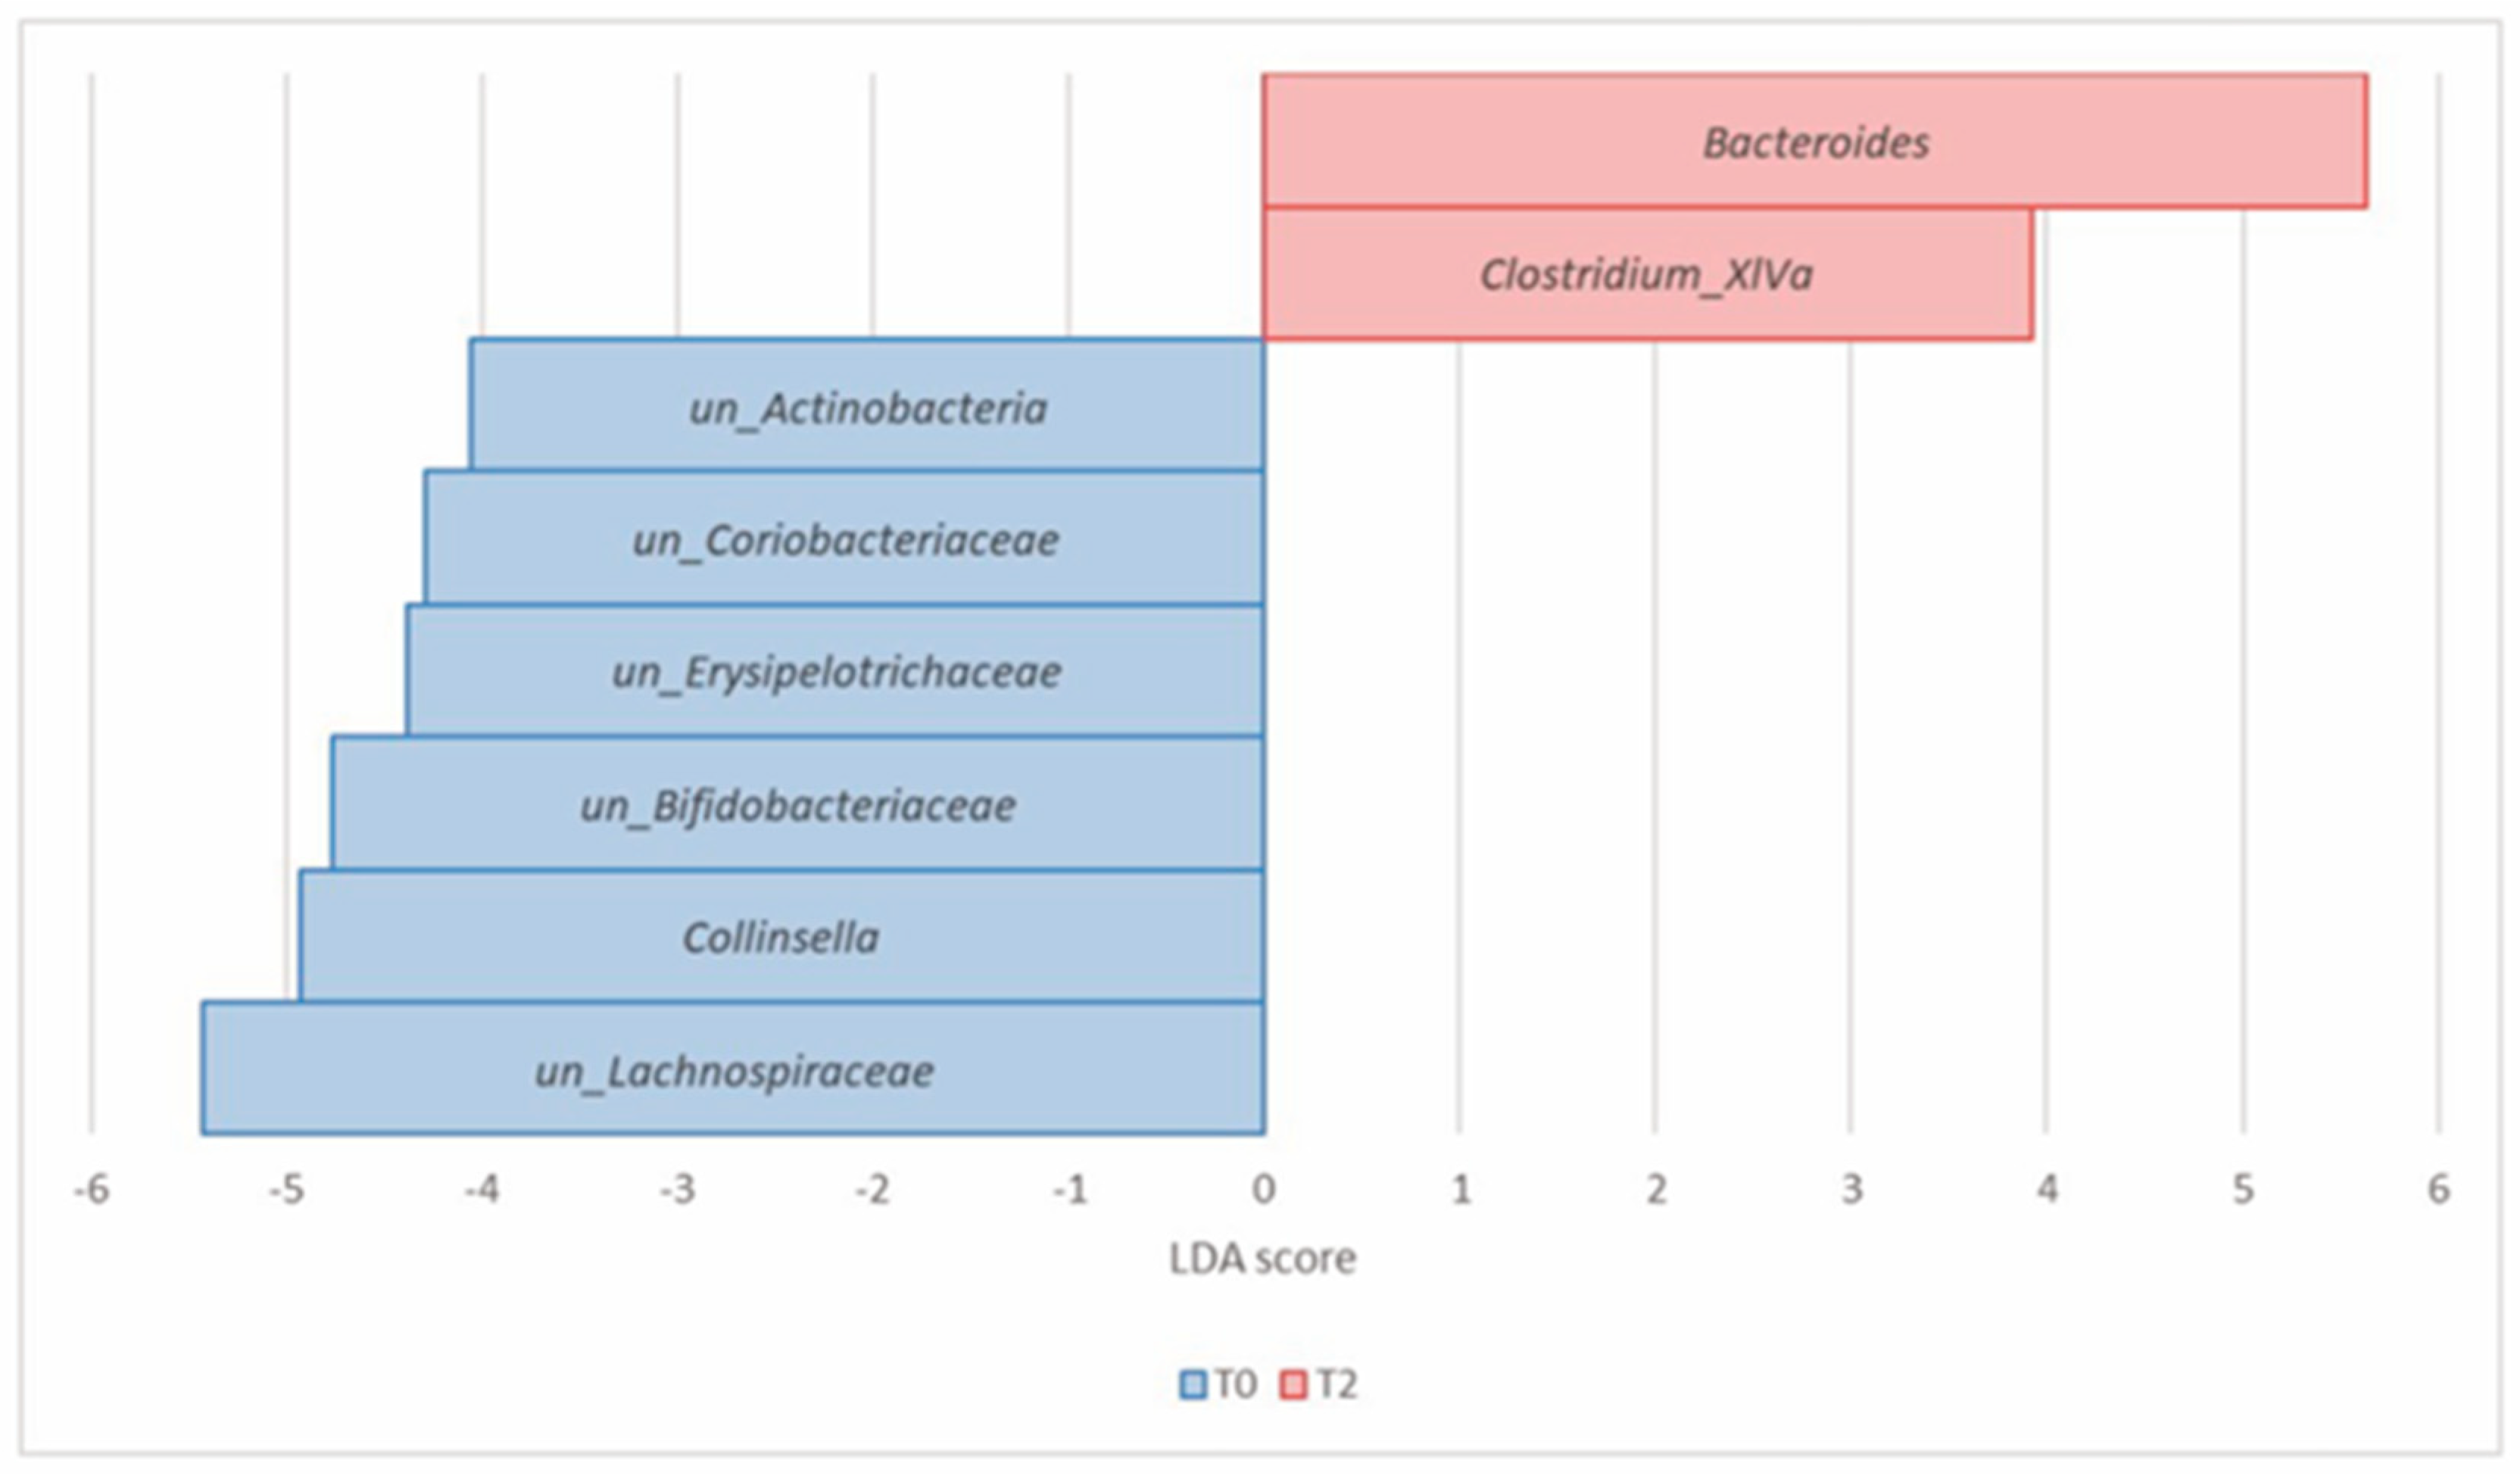
| Actinobacteria (Actinomycetota) | Collinsella | 8.23 × 10⁻⁵ | 1.57 × 10⁻³ | 2.25 | 0.66 | −4.93 |
| un_Actinobacteria | 1.02 × 10⁻⁴ | 1.57 × 10⁻³ | 0.41 | 0.23 | −4.06 | |
| un_Bifidobacteriaceae | 9.90 × 10⁻⁴ | 6.51 × 10⁻³ | 1.98 | 1.17 | −4.77 | |
| un_Coriobacteriaceae | 9.90 × 10⁻⁴ | 6.51 × 10⁻³ | 0.74 | 0.37 | −4.29 | |
| Bacteroidetes (Bacteroidota) | Bacteroides | 3.81 × 10⁻⁴ | 4.38 × 10⁻³ | 8.82 | 16.38 | 5.63 |
| Firmicutes (Bacillota) | Clostridium_XlVa | 9.34 × 10⁻⁶ | 4.30 × 10⁻⁴ | 0.04 | 0.25 | 3.93 |
| un_Lachnospiraceae | 4.82 × 10⁻⁴ | 4.43 × 10⁻³ | 17.27 | 11.90 | −5.43 | |
| un_Erysipelotrichaceae | 2.59 × 10⁻³ | 1.49 × 10⁻² | 0.67 | 0.25 | −4.38 |
| T0 | T2 | |||||
|---|---|---|---|---|---|---|
| Phylum | Species | p Value | FDR | Rel Abundance (%) | Rel Abundance (%) | LDA Score |
| Actinobacteria (Actinomycetota) | Coriobacterium_sp__CCUG_33917 | 1.60 × 10⁻⁵ | 7.92 × 10⁻⁴ | 1.24 | 0.34 | −4.69 |
| Coriobacterium_sp__CCUG_33918 | 2.05 × 10⁻⁵ | 7.92 × 10⁻⁴ | 0.26 | 0.07 | −4 | |
| Collinsella_aerofaciens | 4.23 × 10⁻⁵ | 1.23 × 10⁻³ | 0.44 | 0.13 | −4.22 | |
| un_Actinobacteria | 1.02 × 10⁻⁴ | 2.37 × 10⁻³ | 0.41 | 0.23 | −4.06 | |
| un_Bifidobacteriaceae | 9.90 × 10⁻⁴ | 1.37 × 10⁻² | 1.98 | 1.17 | −4.77 | |
| un_Bifidobacterium | 1.07 × 10⁻³ | 1.37 × 10⁻² | 0.75 | 0.41 | −4.38 | |
| un_Coriobacteriaceae | 9.90 × 10⁻⁴ | 1.37 × 10⁻² | 0.74 | 0.37 | −4.29 | |
| un_Collinsella | 2.35 × 10⁻³ | 2.73 × 10⁻² | 0.31 | 0.13 | −3.98 | |
| Firmicutes (Bacillota) | Clostridium_clostridioforme | 9.34 × 10⁻⁶ | 7.92 × 10⁻⁴ | 0.04 | 0.25 | 3.93 |
| un_Lachnospiraceae | 4.82 × 10⁻⁴ | 9.32 × 10⁻³ | 17.27 | 11.90 | −5.43 | |
| un_Erysipelotrichaceae | 2.59 × 10⁻³ | 2.73 × 10⁻² | 0.67 | 0.25 | −4.38 | |
| un_Blautia | 3.07 × 10⁻³ | 2.97 × 10⁻² | 1.82 | 1.18 | −4.64 |
| T0 | T2 | |||||
|---|---|---|---|---|---|---|
| Phylum | Genus | p Value | FDR | Rel Abundance (%) | Rel Abundance (%) | LDA Score |
| Actinobacteria (Actinomycetota) | un_Coriobacteriaceae | 6.34 × 10⁻⁵ | 1.52 × 10⁻³ | 0.66 | 0.30 | −4.26 |
| Collinsella | 6.63 × 10⁻⁵ | 1.52 × 10⁻³ | 1.87 | 0.49 | −4.92 | |
| Firmicutes (Bacillota) | un_Lachnospiraceae | 1.56 × 10⁻⁴ | 2.39 × 10⁻³ | 16.22 | 11.04 | −5.44 |
| T0 | T2 | |||||
|---|---|---|---|---|---|---|
| Phylum | Species | p Value | FDR | Rel Abundance (%) | Rel Abundance (%) | LDA Score |
| Actinobacteria (Actinomycetota) | Collinsella_aerofaciens | 1.13 × 10⁻⁵ | 9.01 × 10⁻⁴ | 0.37 | 0.08 | −4.24 |
| Coriobacterium_sp__CCUG_33917 | 1.65 × 10⁻⁵ | 9.01 × 10⁻⁴ | 1.05 | 0.23 | −4.69 | |
| Coriobacterium_sp__CCUG_33918 | 2.74 × 10⁻⁵ | 9.97 × 10⁻⁴ | 0.20 | 0.05 | −3.99 | |
| un_Coriobacteriaceae | 6.34 × 10⁻⁵ | 1.73 × 10⁻³ | 0.66 | 0.30 | −4.26 | |
| un_Collinsella | 2.66 × 10⁻³ | 3.65 × 10⁻² | 0.24 | 0.13 | −3.84 | |
| Firmicutes (Bacillota) | un_Lachnospiraceae | 1.56 × 10⁻⁴ | 3.40 × 10⁻³ | 16.22 | 11.04 | −5.44 |
| un_Butyricicoccus | 2.03 × 10⁻³ | 3.65 × 10⁻² | 0.22 | 0.15 | −3.64 | |
| un_Blautia | 2.68 × 10⁻³ | 3.65 × 10⁻² | 1.59 | 1.02 | −4.46 |
| T0 | T1 | T2 | ||||
|---|---|---|---|---|---|---|
| Group A | Group B | Group A | Group B | Group A | Group B | |
| GIQLI | ||||||
| Abdominal pain | 1.9 ± 0.2 | 2.4 ± 0.2 | 2.6 ± 0.2 * (+0.7; +36.8%) * | 2.6 ± 0.2 (+0.2; +8.3%) | 3.0 ± 0.2 *** (+1.1; +57.9%) * | 2.9 ± 0.2 (+0.4; +20.8%) |
| Abdominal fullness | 1.9 ± 0.2 | 2.3 ± 0.2 | 2.7 ± 0.2 ** (+0.8; +42.1%) *** | 2.5 ± 0.2 (+0.2; +8.7%) | 3.0 ± 0.2 *** (+1.1; +57.9%) * | 2.8 ± 0.2 (+0.5; +21.7%) |
| Belching | 2.4 ± 0.2 | 2.7± 0.2 | 2.7 ± 0.2 (+0.3; +12.5%) | 2.8 ± 0.2 (+0.1; +3.7%) | 3.1 ± 0.2 * (+0.7; +29.2%) * | 2.9 ± 0.2 (+0.2; +7.4%) |
| Abdominal noises | 2.2 ± 0.1 | 2.4 ± 0.2 | 2.9 ± 0.2 ** (+0.7; +31.8%) * | 2.7 ± 0.2 (+0.3; +12.5%) | 3.1 ± 0.2 *** (+0.9; +40.9%) * | 2.7 ± 0.2 (+0.3; +12.5%) |
| Coping with stress | 2.3 ± 0.1 | 2.1 ± 0.2 | 2.7 ± 0.1 (+0.4; +17.4%) | 2.3 ± 0.2 (+0.2; +9.5%) | 3.2 ± 0.1 *** (+0.9; +39.1%) * | 2.6 ± 0.1 (+0.5; +23.8%) |
| Fatigue | 1.5 ± 0.2 | 1.9 ± 0.2 | 2.2 ± 0.1 * (+0.6; +46.7%) | 2.3 ± 0.1 (+0.4; +21.0%) | 2.4 ± 0.2 *** (+0.9; +60.0%) * | 2.2 ± 0.2 (+0.3; +15.8%) |
| Dysphagia | 3.2 ± 0.2 | 3.5 ± 0.1 | 3.4 ± 0.2 (+0.3; +6.2%) | 3.6 ± 0.1 (+0.1; +2.9%) | 3.8 ± 0.1 ** (+0.6; +18.7%) ** | 3.6 ± 0.1 (+0.1; +2.9%) |
| GSAS | ||||||
| Pyrosis | 1.3 ± 0.2 | 0.8 ± 0.2 | 0.9 ± 0.1 (−0.4; −30.8%) | 0.7 ± 0.2 (−0.2; −12.5%) | 0.5 ± 0.1 *** (−0.8; −61.5%) ** | 0.5 ± 0.1 (−0.3; −37.5%) |
| Early satiety | 1.0 ± 0.2 | 0.9 ± 0.2 | 0.4 ± 0.1 ** (−0.6; −60.0%) * | 0.7 ± 0.2 (−0.2; −22.2%) | 0.3 ± 0.1 *** (−0.7; −70.0%) ** | 0.7 ± 0.2 (−0.2; −22.2%) |
Disclaimer/Publisher’s Note: The statements, opinions and data contained in all publications are solely those of the individual author(s) and contributor(s) and not of MDPI and/or the editor(s). MDPI and/or the editor(s) disclaim responsibility for any injury to people or property resulting from any ideas, methods, instructions or products referred to in the content. |
© 2024 by the authors. Licensee MDPI, Basel, Switzerland. This article is an open access article distributed under the terms and conditions of the Creative Commons Attribution (CC BY) license (https://creativecommons.org/licenses/by/4.0/).
Share and Cite
Mellai, M.; Allesina, M.; Edoardo, B.; Cascella, F.; Nobile, V.; Spina, A.; Amone, F.; Zaccaria, V.; Insolia, V.; Perri, A.; et al. A Randomized, Double-Blind, Placebo-Controlled Trial: Efficacy of Opuntia ficus-indica Prebiotic Supplementation in Subjects with Gut Dysbiosis. Nutrients 2024, 16, 586. https://doi.org/10.3390/nu16050586
Mellai M, Allesina M, Edoardo B, Cascella F, Nobile V, Spina A, Amone F, Zaccaria V, Insolia V, Perri A, et al. A Randomized, Double-Blind, Placebo-Controlled Trial: Efficacy of Opuntia ficus-indica Prebiotic Supplementation in Subjects with Gut Dysbiosis. Nutrients. 2024; 16(5):586. https://doi.org/10.3390/nu16050586
Chicago/Turabian StyleMellai, Marta, Marta Allesina, Benedetto Edoardo, Federica Cascella, Vincenzo Nobile, Amelia Spina, Fabio Amone, Vincenzo Zaccaria, Violetta Insolia, Anna Perri, and et al. 2024. "A Randomized, Double-Blind, Placebo-Controlled Trial: Efficacy of Opuntia ficus-indica Prebiotic Supplementation in Subjects with Gut Dysbiosis" Nutrients 16, no. 5: 586. https://doi.org/10.3390/nu16050586
APA StyleMellai, M., Allesina, M., Edoardo, B., Cascella, F., Nobile, V., Spina, A., Amone, F., Zaccaria, V., Insolia, V., Perri, A., Lofaro, D., & Puoci, F. (2024). A Randomized, Double-Blind, Placebo-Controlled Trial: Efficacy of Opuntia ficus-indica Prebiotic Supplementation in Subjects with Gut Dysbiosis. Nutrients, 16(5), 586. https://doi.org/10.3390/nu16050586