
Designing Front-of-Package Labels to Inform Consumers and Encourage Healthier Food Choices in Bangladesh: A Qualitative Study

 ,
,  , , and
Abstract
1. Introduction
2. Materials and Methods
2.1. Setting
2.2. Sample
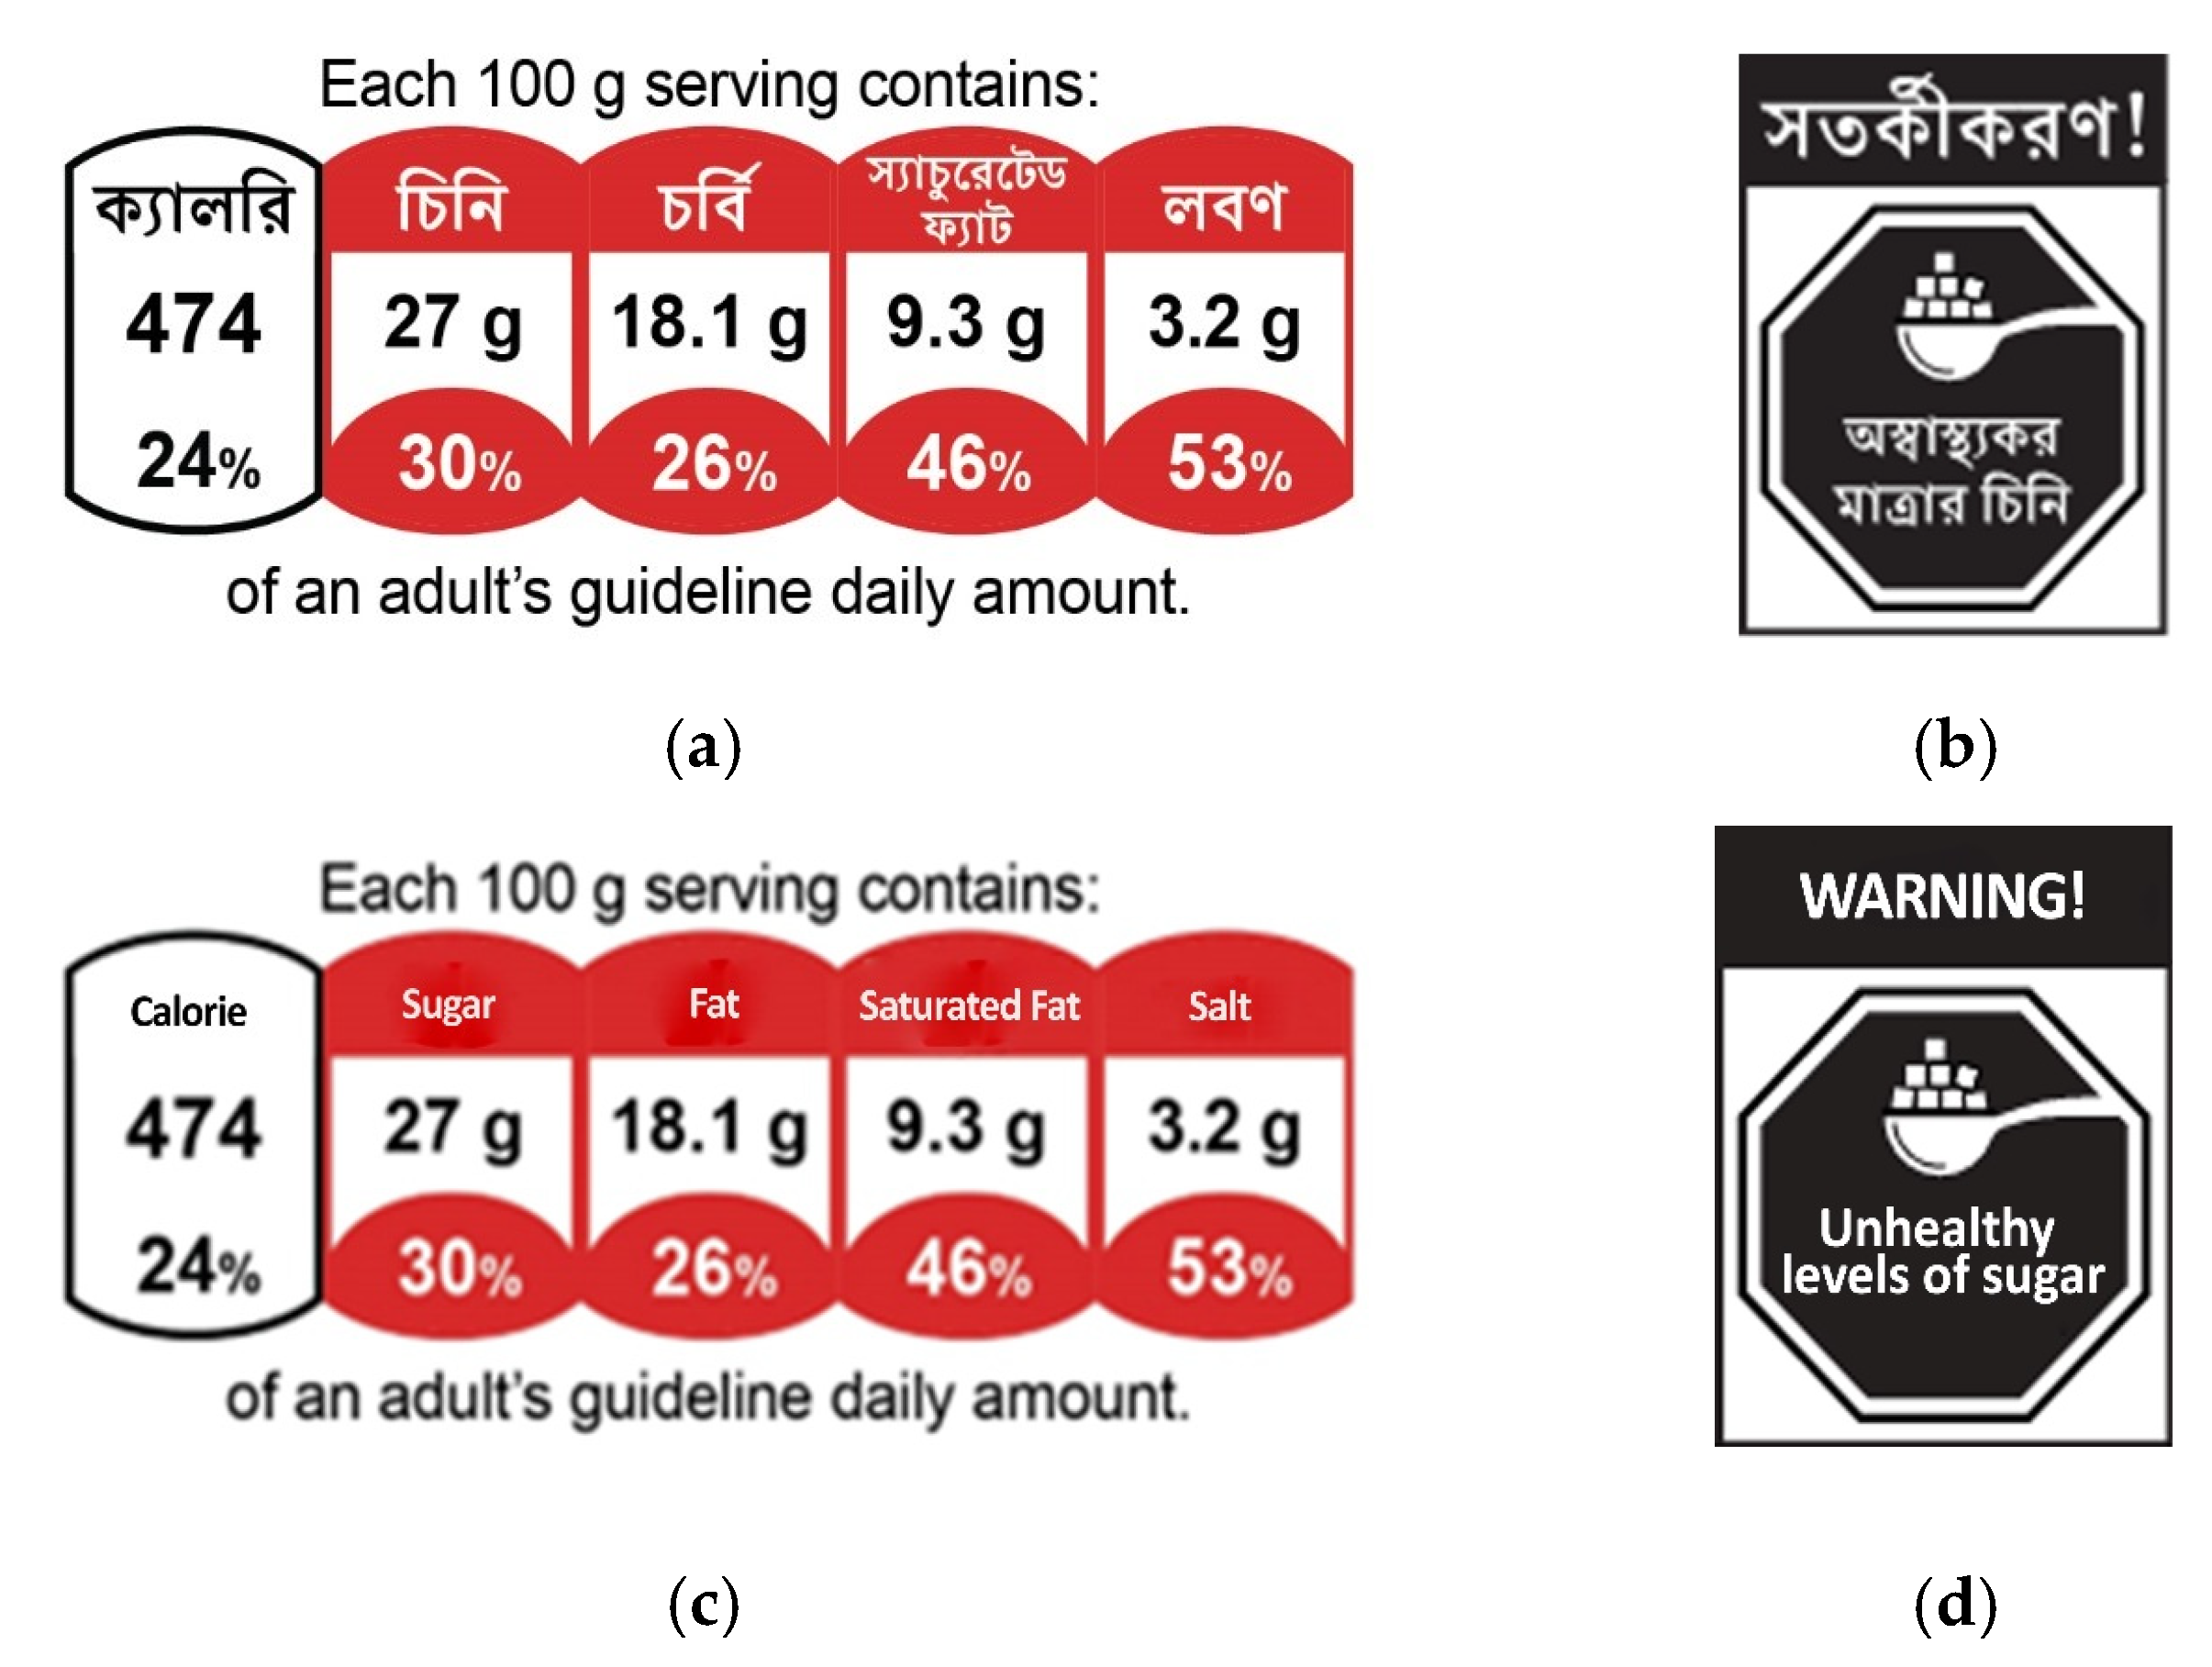
2.3. Label Design
2.4. Procedure
2.5. Positionality
2.6. Analysis
3. Results
3.1. Descriptive Results
3.2. Perceptions of Healthfulness, Unhealthfulness, and Nutrients of Concern
“If a food contains all the necessary elements for our body, we can consider it a nutritious food. For example, if a biscuit contains flour, sugar, salt, milk, and some liquid glucose in appropriate quantities, then that biscuit will also be healthy for us.”
“By healthy food, we mean packaged foods. Flies and mosquitoes sit, and dust and dirt fall on the unpackaged foods, but the packaged food is safe from these.”
3.3. FOPL Evaluation
“Everyone will understand [the warning label]. It can be understood just by looking at a glance. Only one color is used here. For traffic, we have to understand the three colors on the road. But here, it’s all in one color. My problem there (color-coded GDA) would be figuring out what red, yellow, or green means. But here, it’s black. It means, “It cannot be eaten”. It’s harmful to me. The white letters on black are clearly visible.”
“When we go to buy packaged food, the details are on the label. But I don’t read those. Because I know that they may be correct or not. Because I don’t trust labels.”
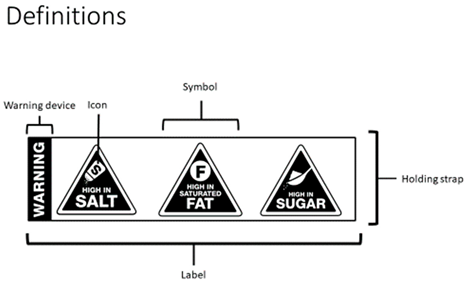
3.4. Warning Label Design Elements
4. Discussion
5. Conclusions
Author Contributions
Funding
Institutional Review Board Statement
Informed Consent Statement
Data Availability Statement
Acknowledgments
Conflicts of Interest
Appendix A. Warning Label Design Elements

Appendix B. Full Translated Discussion Guide
- Section 1. Discussion about the healthfulness of foods and drinks
“First, we are going to talk about what you think about some nutrients, like sugar, and some food and drink products.”
- General Discussion
- “First, let’s talk about food in general. When you think of a food that is healthy, what are some of its characteristics? What makes it healthy? When you think of a food that is unhealthy, what are some of its characteristics? What makes it unhealthy?”
- “Now, we’ll talk about sugar.
- a.
- When you think about foods that are high in sugar, what are some examples? When you think of drinks that are high in sugar, what are some examples? I’d like you to focus your answers on products that you would buy at a store vs those that you or someone in your household might prepare at home.
- b.
- Now let’s consider some specific (packaged) foods and drinks that are high in sugar, like (XYZ; show images of a couple of foods and a couple of drinks). Do you think it is good or bad for your health to eat these foods that are high in sugar? Why?
- c.
- What are some of the health effects of eating too much sugar?”
- “Now, let’s talk about sodium or salt.
- a.
- When you think about foods that are high in salt, what are some examples? When you think of drinks that are high in sugar, what are some examples? I’d like you to focus your answers on products that you would buy at a store vs those that you or someone in your household might prepare at home.
- b.
- Now let’s consider some specific (packaged) foods and drinks that are high in salt, like (XYZ; show images of a couple of foods and a couple of drinks). Do you think it is good or bad for your health to eat these foods that are high in salt? Why?
- c.
- What are some of the health effects of eating too much salt?”
- “Now, let’s talk about saturated fat.
- a.
- What is saturated fat? Where does it come from? (Answer: saturated fat is a type of fat that has a different structure than unsaturated fat. Saturated fat mainly comes from animal-source foods, whereas most unsaturated fat comes from plants).
- b.
- When you think about foods that are high in saturated fat, what are some examples? When you think of drinks that are high in saturated fat, what are some examples? I’d like you to focus your answers on products that you would buy at a store vs those that you or someone in your household might prepare at home.
- c.
- Now let’s consider some specific (packaged) foods and drinks that are high in saturated fat, like (XYZ; show images of a couple of foods and a couple of drinks). Do you think it is good or bad for your health to eat these foods that are high in saturated fat? Why?
- d.
- What are some of the health effects of eating too much-saturated fat?”
- Section 2. FOPL Testing
“Now, I’m going to show you all some images of food packages and their labels, and then ask you some questions about them.”
- Section 2A. Main Label Testing:
- [Repeat this section for both labels that will be tested]. Then, proceed to show the main image for testing Label #1 (e.g., the 4 products with Label #1). Keep it up for 10 s or so until everyone seems to have seen it clearly. Then turn off the image.]
- Visibility/Memorability
- “Were the labels easily visible? Did it grab your attention? How visible was it? Was it immediately visible or not? Did it catch your eye?”
- “Were the labels memorable? Why or why not?”
- “Can you recall the label for me now? What exactly did it look like? What do you recall of its shape, color? Was there any text in it? What did it say?” [Without leading their answers, probe respondents’ memory of its shape, color, text, icon, etc.]“Now, I’m going to show you the labels again and ask you more questions about them.” [You can highlight the specific labels you are talking about.]
- Comprehensibility
- “What did you understand from the labels?
- Is there anything you did not understand about the label or that confused you about it?
- What did the labels tell you about the food and drinks they were on? (probe for if they thought the product was healthy or unhealthy)
- Who do you think these labels are for?
- Did you believe what the label said?
- Is there anything about this label that is culturally inappropriate? Is there anything about it that is likely to be difficult to understand/interpret for Bangladeshi food shoppers?”
- Potential Effectiveness
- “If you were at the store and saw these labels on a food or drink package, would they change your attitude toward the product? How?
- If you saw this label on food or drink packages in a store, would it affect your decision to buy that product or not? How would it affect your decision to buy it?”
- Section 2B. Comparative Rating
- Show a slide that contains both label types (Warning + GDA).
“Now please look at both labels you have seen today. Does either label stand out for you? What about that label makes it stand out the most? Why do the other labels not stand out as much to you?
Which label do you think would most help you identify that food was unhealthy? Which label would most discourage you from buying unhealthy foods?”
- Section 3. Warning label elements
“Now, we are going to talk about some of the design elements of the warning label that you saw. We’d like to consider various elements of the label design, and I’d like your views on whether changing it would improve the effectiveness of the label or not. To start off, I’d like you to consider the ICONS or the pictures we’ve used in the label. I’ll show you the label you saw earlier and some alternatives.”
“The following are the elements of the front-of-pack warning label that will be tested. Please familiarize yourself with them so that you may guide the participants effectively.”
- “Let’s start with the icon of FAT. Of the options before you:
- Is there anything inappropriate or offensive about the alternatives proposed?
- Do the alterations improve your understanding of the label? That is, does it give you a more accurate understanding of what the label intends to say? How does it do so?
- Does the presence of an icon (compared to no icon) improve your understanding of the label? How does it do so?
- Of the options before you, which one do you think is more likely to be effective in grabbing people’s attention and deterring the purchase of unhealthy food? How does it do so?“Now, I’d like us to look at the SYMBOL/HOLDING SHAPE and COLORS we’ve used for the label. [Moderator, point to the outside shape to ensure that participants have understood exactly what was meant.] At the same time, I would like us to look at the symbol/holding shape in different colors. Here’s the original label together with an alternative symbol shape”. [SHOW SLIDE] and here are both symbols in different colors. [SHOW SLIDE] [Moderator to move to the three appropriate slides, in step with the discussion and questions below.]“Now, I’d like us to look at different food products with different symbols in different colors.” [SHOW SLIDE]. Here is another product with all of the symbols in different shapes and in red and black. [SHOW SLIDE].
- Do the alterations improve your understanding of the label? That is, does it give you a more accurate understanding of what the label intends to say? How does it do so?
- Does the presence of the (alternate shape) improve your understanding of the label? How does it do so?
- Does the presence of the (alternate color) improve your understanding of the label? How does it do so?
- Of the options before you, which one do you think is more likely to be effective in grabbing people’s attention and deterring the purchase of unhealthy food?“Now, I’d like us to look at the WARNING DEVICES on the label. [Moderator, ensure that the participants understand what is being referred to.] I’ll show you the initial label again, and an alternative to the original”. [SHOW SLIDE]“Here’s the initial label with the initial warning device. And now here are three alternatives; one with an additional exclamation mark, one without the warning text, and the last one in red as well.” [Moderator to move to the appropriate slides, in step with the discussion and questions.]
- Do the alterations improve your understanding of the label? That is, does it give you a more accurate understanding of what the label intends to say? How does it do so?
- Does the presence of the (alternate warning device) improve your understanding of the label? How does it do so?
- Of the options before you, which one do you think is more likely to be effective in grabbing people’s attention and deterring the purchase of unhealthy food? [Moderator, ensure that each participant’s response is solicited and noted by the research assistant.]“Now, I’d like us to look at the HOLDING STRAP we’ve used around the label. [Moderator, ensure that the participants have understood what is referred to.] I’ll show you the initial label again, and an alternative”. [SHOW SLIDE]
- [Moderator to move to the appropriate slides, in step with the discussion and questions below.]
- Here’s the initial label (white background). And now here is an alternative (black background).
- Do the alterations improve your understanding of the label? That is, does it give you a more accurate understanding of what the label intends to say? How does it do so?
- Does the presence of the (alternate holding strap) improve your understanding of the label? How does it do so?
- Of the options before you, which one do you think is more likely to be effective in grabbing people’s attention and deterring the purchase of unhealthy food? [Moderator, ensure that each participant’s response is solicited and noted by the research assistant.]
References
- Fahim, S.M.; Hossain, M.S.; Sen, S.; Das, S.; Hosssain, M.; Ahmed, T.; Rahman, S.M.M.; Rahman, M.K.; Alam, S. Nutrition and Food Security in Bangladesh: Achievements, Challenges, and Impact of the COVID-19 Pandemic. J. Infect. Dis. 2021, 224, S901–S909. [Google Scholar] [CrossRef]
- Hossain, S.; Chowdhury, P.B.; Biswas, R.K.; Hossain, M.A. Malnutrition status of children under 5 years in Bangladesh: A sociodemographic assessment. Child. Youth Serv. Rev. 2020, 117, 105291. [Google Scholar] [CrossRef]
- Nguyen, P.H.; Tauseef, S.; Khuong, L.Q.; Das Gupta, R.; Billah, S.M.; Menon, P.; Scott, S. Underweight, overweight or obesity, diabetes, and hypertension in Bangladesh, 2004 to 2018. PLoS ONE 2022, 17, e0275151. [Google Scholar] [CrossRef]
- Mostafa, I.; Hasan, M.; Das, S.; Khan, S.H.; Hossain, M.I.; Faruque, A.; Ahmed, T. Changing trends in nutritional status of adolescent females: A cross-sectional study from urban and rural Bangladesh. BMJ Open 2021, 11, e044339. [Google Scholar] [CrossRef]
- Biswas, T.; Garnett, S.P.; Pervin, S.; Rawal, L.B. The prevalence of underweight, overweight and obesity in Bangladeshi adults: Data from a national survey. PLoS ONE 2017, 12, e0177395. [Google Scholar] [CrossRef]
- Khan, S.H.; Talukder, S.H. Nutrition transition in B angladesh: Is the country ready for this double burden. Obes. Rev. 2013, 14, 126–133. [Google Scholar] [CrossRef]
- Islam, S.M.S.; Uddin, R.; Das, S.; Ahmed, S.I.; Zaman, S.B.; Alif, S.M.; Hossen, M.T.; Sarker, M.; Siopis, G.; Livingstone, K.M.; et al. The burden of diseases and risk factors in Bangladesh, 1990–2019: A systematic analysis for the Global Burden of Disease Study 2019. Lancet Glob. Health 2023, 11, e1931–e1942. [Google Scholar] [CrossRef]
- King, C.; Shaha, S.K.; Morrison, J.; Ahmed, N.; Kuddus, A.; Pires, M.; Nahar, T.; Hossin, R.; Haghparast-Bidgoli, H.; Khan, A.K.A.; et al. Changes in non-communicable diseases, diet and exercise in a rural Bangladesh setting before and after the first wave of COVID-19. PLoS Glob. Public Health 2022, 2, e0001110. [Google Scholar] [CrossRef]
- Barth-Jaeggi, T.; Speich, C.; Havugimana, C.; Bayisenge, F.; Kimenju, S.; Omondi, W.; Pasha, S.F.; Islam, S.; van Zutphen-Küffer, K.G.; van den Berg, S.; et al. Nutrition transition, double burden of malnutrition, and urbanization patterns in secondary cities of Bangladesh, Kenya and Rwanda. BMC Nutr. 2023, 9, 125. [Google Scholar] [CrossRef]
- Islam, M.R.; Rahman, S.M.; Rahman, M.M.; Pervin, J.; Rahman, A.; Ekström, E.-C. Gender and socio-economic stratification of ultra-processed and deep-fried food consumption among rural adolescents: A cross-sectional study from Bangladesh. PLoS ONE 2022, 17, e0272275. [Google Scholar] [CrossRef]
- Shamim, A.A.; Hossain, M.M.; Akter, F.; Urmy, N.J.; Hanif, A.A.M.; Hasan, M.; Khan, M.S.A.; Ullah, M.A.; Bulbul, M.M.I.; Mridha, M.K. Unhealthy Foods and Sugar-Sweetened Beverages Consumption Among Bangladeshi Adolescents and Their Sociodemographic Determinants: Findings From a Nationally Representative Cross-Sectional Study. Cureus 2023, 15, e41262. [Google Scholar] [CrossRef]
- Jannat, K.; Luby, S.P.; Unicomb, L.; Rahman, M.; Winch, P.J.; Hossain, M.I.; Stewart, C.P. Snack food consumption among Bangladeshi children, supplementary data from a large RCT. Matern. Child Nutr. 2020, 16, e12994. [Google Scholar] [CrossRef]
- Al Muktadir, M.H.; Islam, M.A.; Amin, M.N.; Ghosh, S.; Siddiqui, S.A.; Debnath, D.; Islam, M.M.; Ahmed, T.; Sultana, F. Nutrition transition—Pattern IV: Leads Bangladeshi youth to the increasing prevalence of overweight and obesity. Diabetes Metab. Syndr. Clin. Res. Rev. 2019, 13, 1943–1947. [Google Scholar] [CrossRef]
- Afroza, U.; Abrar, A.K.; Nowar, A.; Akhtar, J.; Mamun, M.A.A.; Sobhan, S.M.M.; Cobb, L.; Ide, N.; Choudhury, S.R. Salt Intake Estimation from Urine Samples in South Asian Population: Scoping Review. Nutrients 2023, 15, 4358. [Google Scholar] [CrossRef]
- Ahmed, A.U.; Bakhtiar, M.M.; Ali, M.; Ghostlaw, J.; Nguyen, P.H. Trends and Inequities in Food, Energy, Protein, Fat, and Carbohydrate Intakes in Rural Bangladesh. J. Nutr. 2022, 152, 2591–2603. [Google Scholar] [CrossRef]
- Christoph, M.J.; Larson, N.; Laska, M.N.; Neumark-Sztainer, D. Nutrition Facts Panels: Who Uses Them, What Do They Use, and How Does Use Relate to Dietary Intake? J. Acad. Nutr. Diet. 2018, 118, 217–228. [Google Scholar] [CrossRef]
- Kollannoor-Samuel, G.; Shebl, F.M.; Hawley, N.L.; Pérez-Escamilla, R. Nutrition facts panel use is associated with higher diet quality and lower glycated hemoglobin concentrations in US adults with undiagnosed prediabetes. Am. J. Clin. Nutr. 2016, 104, 1639–1646. [Google Scholar] [CrossRef]
- Ollberding, N.J.; Wolf, R.L.; Contento, I. Food label use and its relation to dietary intake among US adults. J. Am. Diet. Assoc. 2010, 110, 1233–1237. [Google Scholar] [CrossRef]
- Wilson, M.D.; Ramírez, A.S.; Arsenault, J.E.; Miller, L.M.S. Nutrition Label Use and Its Association with Dietary Quality Among Latinos: The Roles of Poverty and Acculturation. J. Nutr. Educ. Behav. 2018, 50, 876–887. [Google Scholar] [CrossRef]
- Malloy-Weir, L.; Cooper, M. Health literacy, literacy, numeracy and nutrition label understanding and use: A scoping review of the literature. J. Hum. Nutr. Diet. 2017, 30, 309–325. [Google Scholar] [CrossRef]
- Marietta, A.B.; Welshimer, K.J.; Anderson, S.L. Knowledge, attitudes, and behaviors of college students regarding the 1990 Nutrition Labeling Education Act food labels. J. Am. Diet. Assoc. 1999, 99, 445–449. [Google Scholar] [CrossRef]
- Al-Barqi, R.; Al-Salem, Y.; Mahrous, L.; Abat, E.; Al-Quraishi, R.; Benajiba, N. Understanding barriers towards the use of food labels among Saudi female college students. Malays. J. Nutr. 2020, 26, 19–30. [Google Scholar] [CrossRef]
- Auchincloss, A.H.; Young, C.; Davis, A.L.; Wasson, S.; Chilton, M.; Karamanian, V. Barriers and facilitators of consumer use of nutrition labels at sit-down restaurant chains. Public Health Nutr. 2013, 16, 2138–2145. [Google Scholar] [CrossRef]
- Hoteit, M.; Yazbeck, N.; Al-Jawaldeh, A.; Obeid, C.; Fattah, H.A.; Ghader, M.; Mohsen, H. Assessment of the knowledge, attitudes and practices of Lebanese shoppers towards food labeling: The first steps in the Nutri-score roadmap. F1000Research 2022, 11, 84. [Google Scholar] [CrossRef]
- Vemula, S.R.; Gavaravarapu, S.M.; Mendu, V.V.; Mathur, P.; Avula, L. Use of food label information by urban consumers in India—A study among supermarket shoppers. Public Health Nutr. 2014, 17, 2104–2114. [Google Scholar] [CrossRef]
- Croker, H.; Packer, J.; Russell, S.J.; Stansfield, C.; Viner, R.M. Front of pack nutritional labelling schemes: A systematic review and meta-analysis of recent evidence relating to objectively measured consumption and purchasing. J. Hum. Nutr. Diet. 2020, 33, 518–537. [Google Scholar] [CrossRef]
- Gupta, A.; Billich, N.; George, N.A.; Blake, M.R.; Huse, O.; Backholer, K.; Boelsen-Robinson, T.; Peeters, A. The effect of front-of-package labels or point-of-sale signage on consumer knowledge, attitudes and behavior regarding sugar-sweetened beverages: A systematic review. Nutr. Rev. 2021, 79, 1165–1181. [Google Scholar] [CrossRef]
- Sagaceta-Mejía, J.; Tolentino-Mayo, L.; Cruz-Casarrubias, C.; Nieto, C.; Barquera, S. Understanding of front of package nutrition labels: Guideline daily amount and warning labels in Mexicans with non-communicable diseases. PLoS ONE 2022, 17, e0269892. [Google Scholar] [CrossRef]
- Waxman, A. WHO global strategy on diet, physical activity and health. Food Nutr. Bull. 2004, 25, 292–302. [Google Scholar] [CrossRef]
- World Cancer Research Fund International. Curbing Global Sugar Consumption: Effective Food Policy Actions to Help Promote Healthy Diets & Tackle Obesity; World Cancer Research Fund International: London, UK, 2015. [Google Scholar]
- World Health Organization. Guiding Principles and Framework Manual for Front-Of-Pack Labelling for Promoting Healthy Diets; World Health Organization: Geneva, Switzerland, 2019. [Google Scholar]
- Cotter, T.; Taillie, L.S.; Murukutla, N.; Majija, L.; Kotov, A.; Hall, M.; Mullin, S.; Popkin, B. What’s in Our Food? A Guide to Introducing Effective Front-Of-Package Nutrient Labels; Vital Strategies: New York, NY, USA, 2020. [Google Scholar]
- Bopape, M.; Taillie, L.S.; Frank, T.; Murukutla, N.; Cotter, T.; Majija, L.; Swart, R. South African consumers’ perceptions of front-of-package warning labels on unhealthy foods and drinks. PLoS ONE 2021, 16, e0257626. [Google Scholar] [CrossRef]
- Bopape, M.; Taillie, L.S.; Swart, R. Perceived effect of warning label on parental food purchasing and drivers of food selection among South African parents–An exploratory study. Front. Public Health 2022, 10, 939937. [Google Scholar] [CrossRef]
- Malterud, K.; Siersma, V.D.; Guassora, A.D. Sample Size in Qualitative Interview Studies:Guided by Information Power. Qual. Health Res. 2016, 26, 1753–1760. [Google Scholar] [CrossRef]
- Valerio, M.A.; Rodriguez, N.; Winkler, P.; Lopez, J.; Dennison, M.; Liang, Y.; Turner, B.J. Comparing two sampling methods to engage hard-to-reach communities in research priority setting. BMC Med Res. Methodol. 2016, 16, 146. [Google Scholar] [CrossRef]
- Rayner, M.; Scarborough, P.; Lobstein, T. The UK Ofcom Nutrient Profiling Model: Defining ‘Healthy’ and ‘Unhealthy’ Foods and Drinks for TV Advertising to Children. 2009. Available online: https://www.ndph.ox.ac.uk/food-ncd/files/about/uk-ofcom-nutrient-profile-model.pdf (accessed on 27 September 2024).
- Department of Health and Social Care. Guide to Creating a Front of Pack (FoP) Nutrition Label for Pre-Packaged Products Sold Through Retail Outlets; United Kingdom Department of Health & Social Care: London, UK, 2016. [Google Scholar]
- Shaheen, N.; Shamim, A.A.; Choudhury, S.R.; Sarwar, S.; Ashraf, M.M.; Bahar, N.; Al Mamun, M.A.; Sobhan, S.M.M.; Abedin, M.J.; Karim, M.R.; et al. Commonly consumed processed packaged foods in Bangladesh are unhealthy and their nutrient contents are not in conformity with the label declaration. Food Sci. Nutr. 2023, 12, 481–493. [Google Scholar] [CrossRef]
- Taillie, L.S.; Hall, M.G.; Popkin, B.M.; Ng, S.W.; Murukutla, N. Experimental Studies of Front-of-Package Nutrient Warning Labels on Sugar-Sweetened Beverages and Ultra-Processed Foods: A Scoping Review. Nutrients 2020, 12, 569. [Google Scholar] [CrossRef]
- Roberto, C.; Ng, S.W.; Ganderats Fuentes, M.; Hammond, D.; Barquera, S.; Jauregui de la Mota, A.; Taillie, L.S. The influence of front-of-package nutrition labeling on consumer behavior and product reformulation. Annu. Rev. Nutr. Press 2021, 41, 529–550. [Google Scholar] [CrossRef]
- Cabrera, M.; Machín, L.; Arrúa, A.; Antúnez, L.; Curutchet, M.R.; Giménez, A.; Ares, G. Nutrition warnings as front-of-pack labels: Influence of design features on healthfulness perception and attentional capture. Public Health Nutr. 2017, 20, 3360–3371. [Google Scholar] [CrossRef]
- Tong, A.; Sainsbury, P.; Craig, J. Consolidated criteria for reporting qualitative research (COREQ): A 32-item checklist for interviews and focus groups. Int. J. Qual. Health Care 2007, 19, 349–357. [Google Scholar] [CrossRef]
- Grummon, A.H.; Brewer, N.T. Health Warnings and Beverage Purchase Behavior: Mediators of Impact. Ann. Behav. Med. 2020, 54, 691–702. [Google Scholar] [CrossRef]
- Ikonen, I.; Sotgiu, F.; Aydinli, A.; Verlegh, P.W. Consumer effects of front-of-package nutrition labeling: An interdisciplinary meta-analysis. J. Acad. Mark. Sci. 2020, 48, 360–383. [Google Scholar] [CrossRef]
- Ide, N.; LoGerfo, J.P.; Karmacharya, B. Barriers and facilitators of diabetes services in Nepal: A qualitative evaluation. Health Policy Plan. 2018, 33, 474–482. [Google Scholar] [CrossRef]
- Downs, S.M.; Glass, S.; Linn, K.K.; Fanzo, J. The interface between consumers and their food environment in Myanmar: An exploratory mixed-methods study. Public Health Nutr. 2019, 22, 1075–1088. [Google Scholar] [CrossRef]
- Wertheim-Heck, S.C.O.; Vellema, S.; Spaargaren, G. Food safety and urban food markets in Vietnam: The need for flexible and customized retail modernization policies. Food Policy 2015, 54, 95–106. [Google Scholar] [CrossRef]
- Pham, T.-T.-H.; Turner, S. ‘If I want safe food I have to grow it myself’: Patterns and motivations of urban agriculture in a small city in Vietnam’s northern borderlands. Land Use Policy 2020, 96, 104681. [Google Scholar] [CrossRef]
- Uruchima, J.; Renehan, C.; Castro, N.; Cevallos, W.; Levy, K.; Eisenberg, J.N.; Lee, G.O. A Qualitative Study of Food Choice in Urban Coastal Esmeraldas, Ecuador. Curr. Dev. Nutr. 2023, 7, 100093. [Google Scholar] [CrossRef] [PubMed]
- Blum, L.S.; Mellisa, A.; Kurnia Sari, E.; Novitasari Yusadiredja, I.; van Liere, M.; Shulman, S.; Izwardy, D.; Menon, R.; Tumilowicz, A. In-depth assessment of snacking behaviour in unmarried adolescent girls 16–19 years of age living in urban centres of Java, Indonesia. Matern. Child Nutr. 2019, 15, e12833. [Google Scholar] [CrossRef] [PubMed]
- Bastami, F.; Zamani-Alavijeh, F.; Mostafavi, F. Factors behind healthy snack consumption at school among high-school students: A qualitative study. BMC Public Health 2019, 19, 1342. [Google Scholar] [CrossRef]
- Trübswasser, U.; Baye, K.; Holdsworth, M.; Loeffen, M.; Feskens, E.J.M.; Talsma, E.F. Assessing factors influencing adolescents’ dietary behaviours in urban Ethiopia using participatory photography. Public Health Nutr. 2021, 24, 3615–3623. [Google Scholar] [CrossRef]
- Behrens, J.H.; Barcellos, M.N.; Frewer, L.J.; Nunes, T.P.; Franco, B.D.G.M.; Destro, M.T.; Landgraf, M. Consumer purchase habits and views on food safety: A Brazilian study. Food Control 2010, 21, 963–969. [Google Scholar] [CrossRef]
- Stanton, J.V. Changing Consumer Preferences in Emerging Markets: Food Market Challenges in Central Mexico. J. Food Prod. Mark. 2019, 25, 378–403. [Google Scholar] [CrossRef]
- Scapin, T.; Fernandes, A.C.; Curioni, C.C.; Pettigrew, S.; Neal, B.; Coyle, D.H.; Rodrigues, V.M.; Bernardo, G.L.; Uggioni, P.L.; Proença, R.P.C. Influence of sugar label formats on consumer understanding and amount of sugar in food choices: A systematic review and meta-analyses. Nutr. Rev. 2020, 79, 788–801. [Google Scholar] [CrossRef]
- Hock, K.; Acton, R.B.; Jáuregui, A.; Vanderlee, L.; White, C.M.; Hammond, D. Experimental study of front-of-package nutrition labels’ efficacy on perceived healthfulness of sugar-sweetened beverages among youth in six countries. Prev. Med. Rep. 2021, 24, 101577. [Google Scholar] [CrossRef]
- Vargas-Meza, J.; Jáuregui, A.; Contreras-Manzano, A.; Nieto, C.; Barquera, S. Acceptability and understanding of front-of-pack nutritional labels: An experimental study in Mexican consumers. BMC Public Health 2019, 19, 1751. [Google Scholar] [CrossRef]
- Deliza, R.; de Alcantara, M.; Pereira, R.; Ares, G. How do different warning signs compare with the guideline daily amount and traffic-light system? Food Qual. Prefer. 2020, 80, 103821. [Google Scholar] [CrossRef]
- Neal, B.; Crino, M.; Dunford, E.; Gao, A.; Greenland, R.; Li, N.; Ngai, J.; Ni Mhurchu, C.; Pettigrew, S.; Sacks, G.; et al. Effects of Different Types of Front-of-Pack Labelling Information on the Healthiness of Food Purchases-A Randomised Controlled Trial. Nutrients 2017, 9, 1284. [Google Scholar] [CrossRef]
- Jáuregui, A.; Vargas-Meza, J.; Nieto, C.; Contreras-Manzano, A.; Alejandro, N.Z.; Tolentino-Mayo, L.; Hall, M.G.; Barquera, S. Impact of front-of-pack nutrition labels on consumer purchasing intentions: A randomized experiment in low- and middle-income Mexican adults. BMC Public Health 2020, 20, 463. [Google Scholar] [CrossRef]
- Campos-Nonato, I.; Cervantes-Armenta, M.A.; Pacheco-Miranda, S.; Quezada-Sánchez, A.D.; Contreras-Manzano, A.; Barquera, S.; Vargas-Meza, J. Perception and Understanding of Guideline Daily Amount and Warning Labeling among Mexican Adults during the Law Modification Period. Nutrients 2022, 14, 3403. [Google Scholar] [CrossRef]
- Acton, R.B.; Vanderlee, L.; Roberto, C.A.; Hammond, D. Consumer perceptions of specific design characteristics for front-of-package nutrition labels. Health Educ. Res. 2018, 33, 167–174. [Google Scholar] [CrossRef]
- Guttman, N.; Peleg, H. Public preferences for an attribution to government or to medical research versus unattributed messages in cigarette warning labels in Israel. Health Commun. 2003, 15, 1–25. [Google Scholar] [CrossRef]
- Bansal-Travers, M.; Hammond, D.; Smith, P.; Cummings, K.M. The impact of cigarette pack design, descriptors, and warning labels on risk perception in the U.S. Am. J. Prev. Med. 2011, 40, 674–682. [Google Scholar] [CrossRef]
- Falbe, J.; Montuclard, A.; Engelman, A.; Adler, S.; Roesler, A. Developing sugar-sweetened beverage warning labels for young adults. Public Health Nutr. 2021, 24, 4765–4775. [Google Scholar] [CrossRef] [PubMed]


| N | % | |
|---|---|---|
| Gender | ||
| Man | 46 | 60.5 |
| Woman | 30 | 39.5 |
| Location | ||
| Urban—Dhaka | 16 | 21.1 |
| Urban—Sylhet | 15 | 19.7 |
| Urban—Jamalpur | 7 | 9.2 |
| Rural—Dhaka | 8 | 10.5 |
| Rural—Jamalpur | 9 | 11.8 |
| Rural—Kishoreganj | 14 | 18.4 |
| Rural—Rangpur | 7 | 9.2 |
| Age group | ||
| 18–34 | 62 | 81.6 |
| 35–50 | 14 | 18.4 |
| Highest level of education | ||
| No formal education | 3 | 3.9 |
| Completed primary school | 20 | 26.3 |
| Completed secondary school | 15 | 19.7 |
| Completed higher secondary | 13 | 17.1 |
| Completed college/university | 25 | 32.9 |
| Has children under 16 y | ||
| Yes | 53 | 69.7 |
| Income (taka) | ||
| Urban, mean ± SD (min-max) | 31,842 ± 21,378 (9000–100,000) | |
| Rural, mean ± SD (min-max) | 18,763 ± 7401 (10,000–45,000) | |
| How often do you purchase packaged food and drinks? | ||
| Never or rarely | 11 | 14.5 |
| A few times a week | 32 | 42.1 |
| Once a day | 23 | 30.3 |
| More than once a day | 10 | 13.2 |
| Section | Theme | Sub-Themes |
|---|---|---|
| Perceptions of healthfulness | Perceptions of healthy foods | Ingredients |
| Nutrients | ||
| Level of processing | ||
| Naturalness | ||
| Food safety, cleanliness, and hygiene | ||
| Preparation | ||
| Perceptions of unhealthy foods | Ingredients | |
| Nutrients | ||
| Level of processing | ||
| Naturalness | ||
| Food safety, cleanliness, and hygiene | ||
| Preparation | ||
| Addictiveness | ||
| Perceptions of sugar, sodium, and saturated fat | Top sources of sugar, sodium, and saturated fat | |
| Health effects of excess consumption | ||
| Misconceptions | ||
| FOPL reactions | Visibility and memorability | Visibility and attention-grabbing |
| Memorability | ||
| Comprehension | Ability to understand the purpose of the label | |
| Meaning of the label | ||
| Other label reactions | Believability | |
| Cultural appropriateness | ||
| Target population of the label | ||
| Perceived effectiveness | Potential effect on product attitudes | |
| Potential effect on intentions to purchase | ||
| Perceived benefits and harms | ||
| FOPL comparison | FOPL comparison | Selection of which FOPL was perceived as most effective |
| Alternative design comparison | Label or design preference | Attractiveness and memorability |
| Cultural appropriateness | ||
| Informational/understandability | ||
| Perceived effect | ||
| Overall preference |
Disclaimer/Publisher’s Note: The statements, opinions and data contained in all publications are solely those of the individual author(s) and contributor(s) and not of MDPI and/or the editor(s). MDPI and/or the editor(s) disclaim responsibility for any injury to people or property resulting from any ideas, methods, instructions or products referred to in the content. |
© 2024 by the authors. Licensee MDPI, Basel, Switzerland. This article is an open access article distributed under the terms and conditions of the Creative Commons Attribution (CC BY) license (https://creativecommons.org/licenses/by/4.0/).
Share and Cite
Taillie, L.S.; Abrar, A.K.; Afroza, U.; Akhtar, J.; Noe, V.; Ide, N.; Abdel-Gawad, N.; Choudhury, S.R. Designing Front-of-Package Labels to Inform Consumers and Encourage Healthier Food Choices in Bangladesh: A Qualitative Study. Nutrients 2024, 16, 3989. https://doi.org/10.3390/nu16233989
Taillie LS, Abrar AK, Afroza U, Akhtar J, Noe V, Ide N, Abdel-Gawad N, Choudhury SR. Designing Front-of-Package Labels to Inform Consumers and Encourage Healthier Food Choices in Bangladesh: A Qualitative Study. Nutrients. 2024; 16(23):3989. https://doi.org/10.3390/nu16233989
Chicago/Turabian StyleTaillie, Lindsey Smith, Ahmad Khairul Abrar, Ummay Afroza, Jubaida Akhtar, Violet Noe, Nicole Ide, Nora Abdel-Gawad, and Sohel Reza Choudhury. 2024. "Designing Front-of-Package Labels to Inform Consumers and Encourage Healthier Food Choices in Bangladesh: A Qualitative Study" Nutrients 16, no. 23: 3989. https://doi.org/10.3390/nu16233989
APA StyleTaillie, L. S., Abrar, A. K., Afroza, U., Akhtar, J., Noe, V., Ide, N., Abdel-Gawad, N., & Choudhury, S. R. (2024). Designing Front-of-Package Labels to Inform Consumers and Encourage Healthier Food Choices in Bangladesh: A Qualitative Study. Nutrients, 16(23), 3989. https://doi.org/10.3390/nu16233989