
Waist-to-Height Ratio Cut-Off Points for Central Obesity in Individuals with Overweight Across Different Ethnic Groups in NHANES 2011–2018


Abstract
1. Introduction
2. Materials and Methods
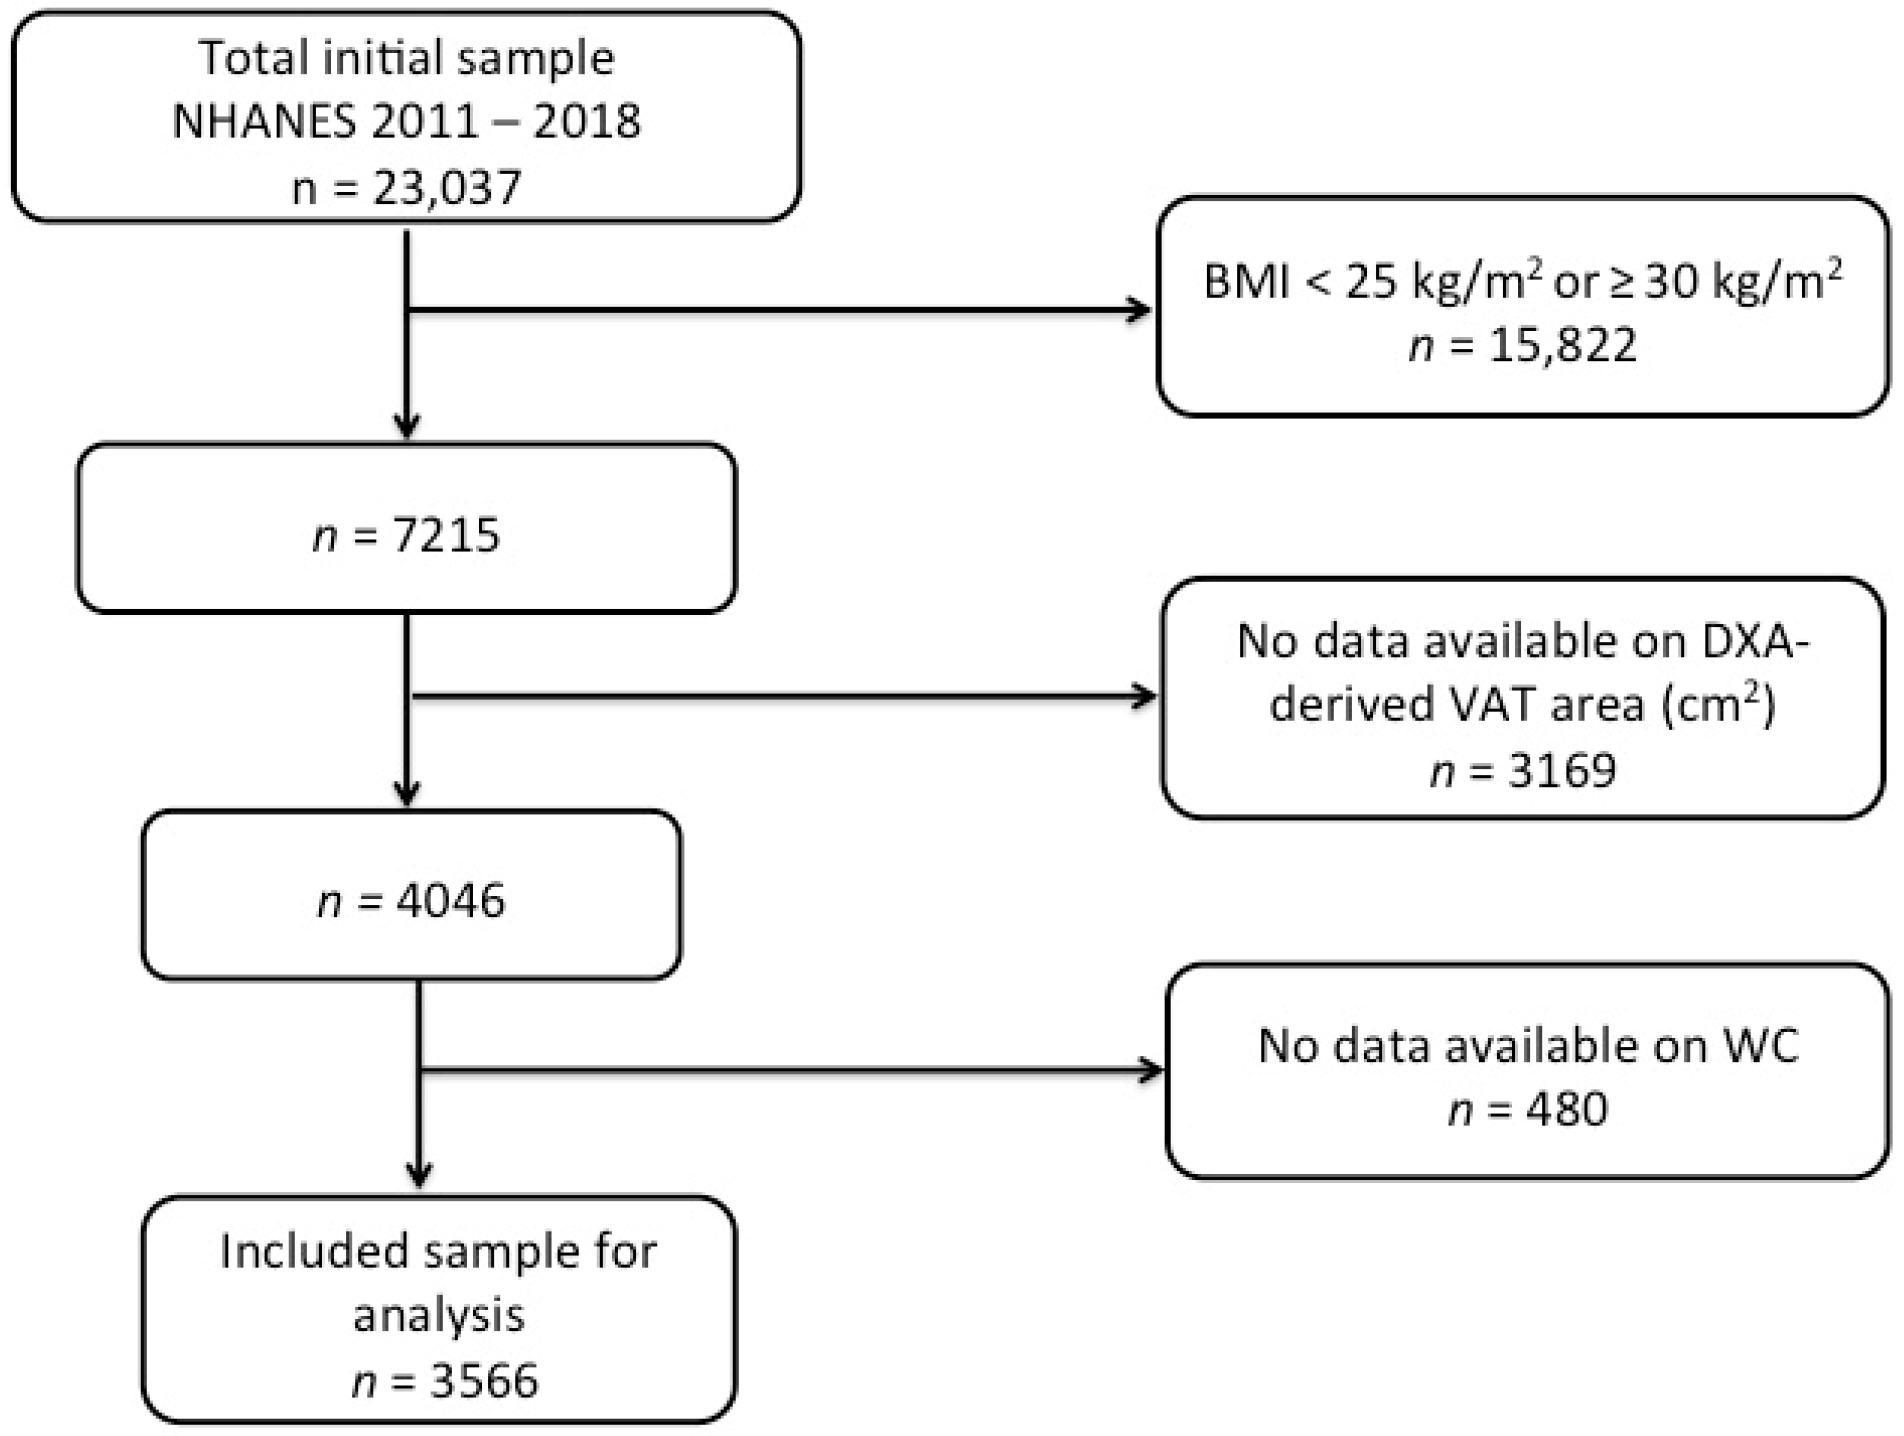
2.1. Participants and the Design of the Study
2.2. Data Collection
2.2.1. Anthropometric and Demographic Data and Body Composition Assessment
2.2.2. Statistical Analysis
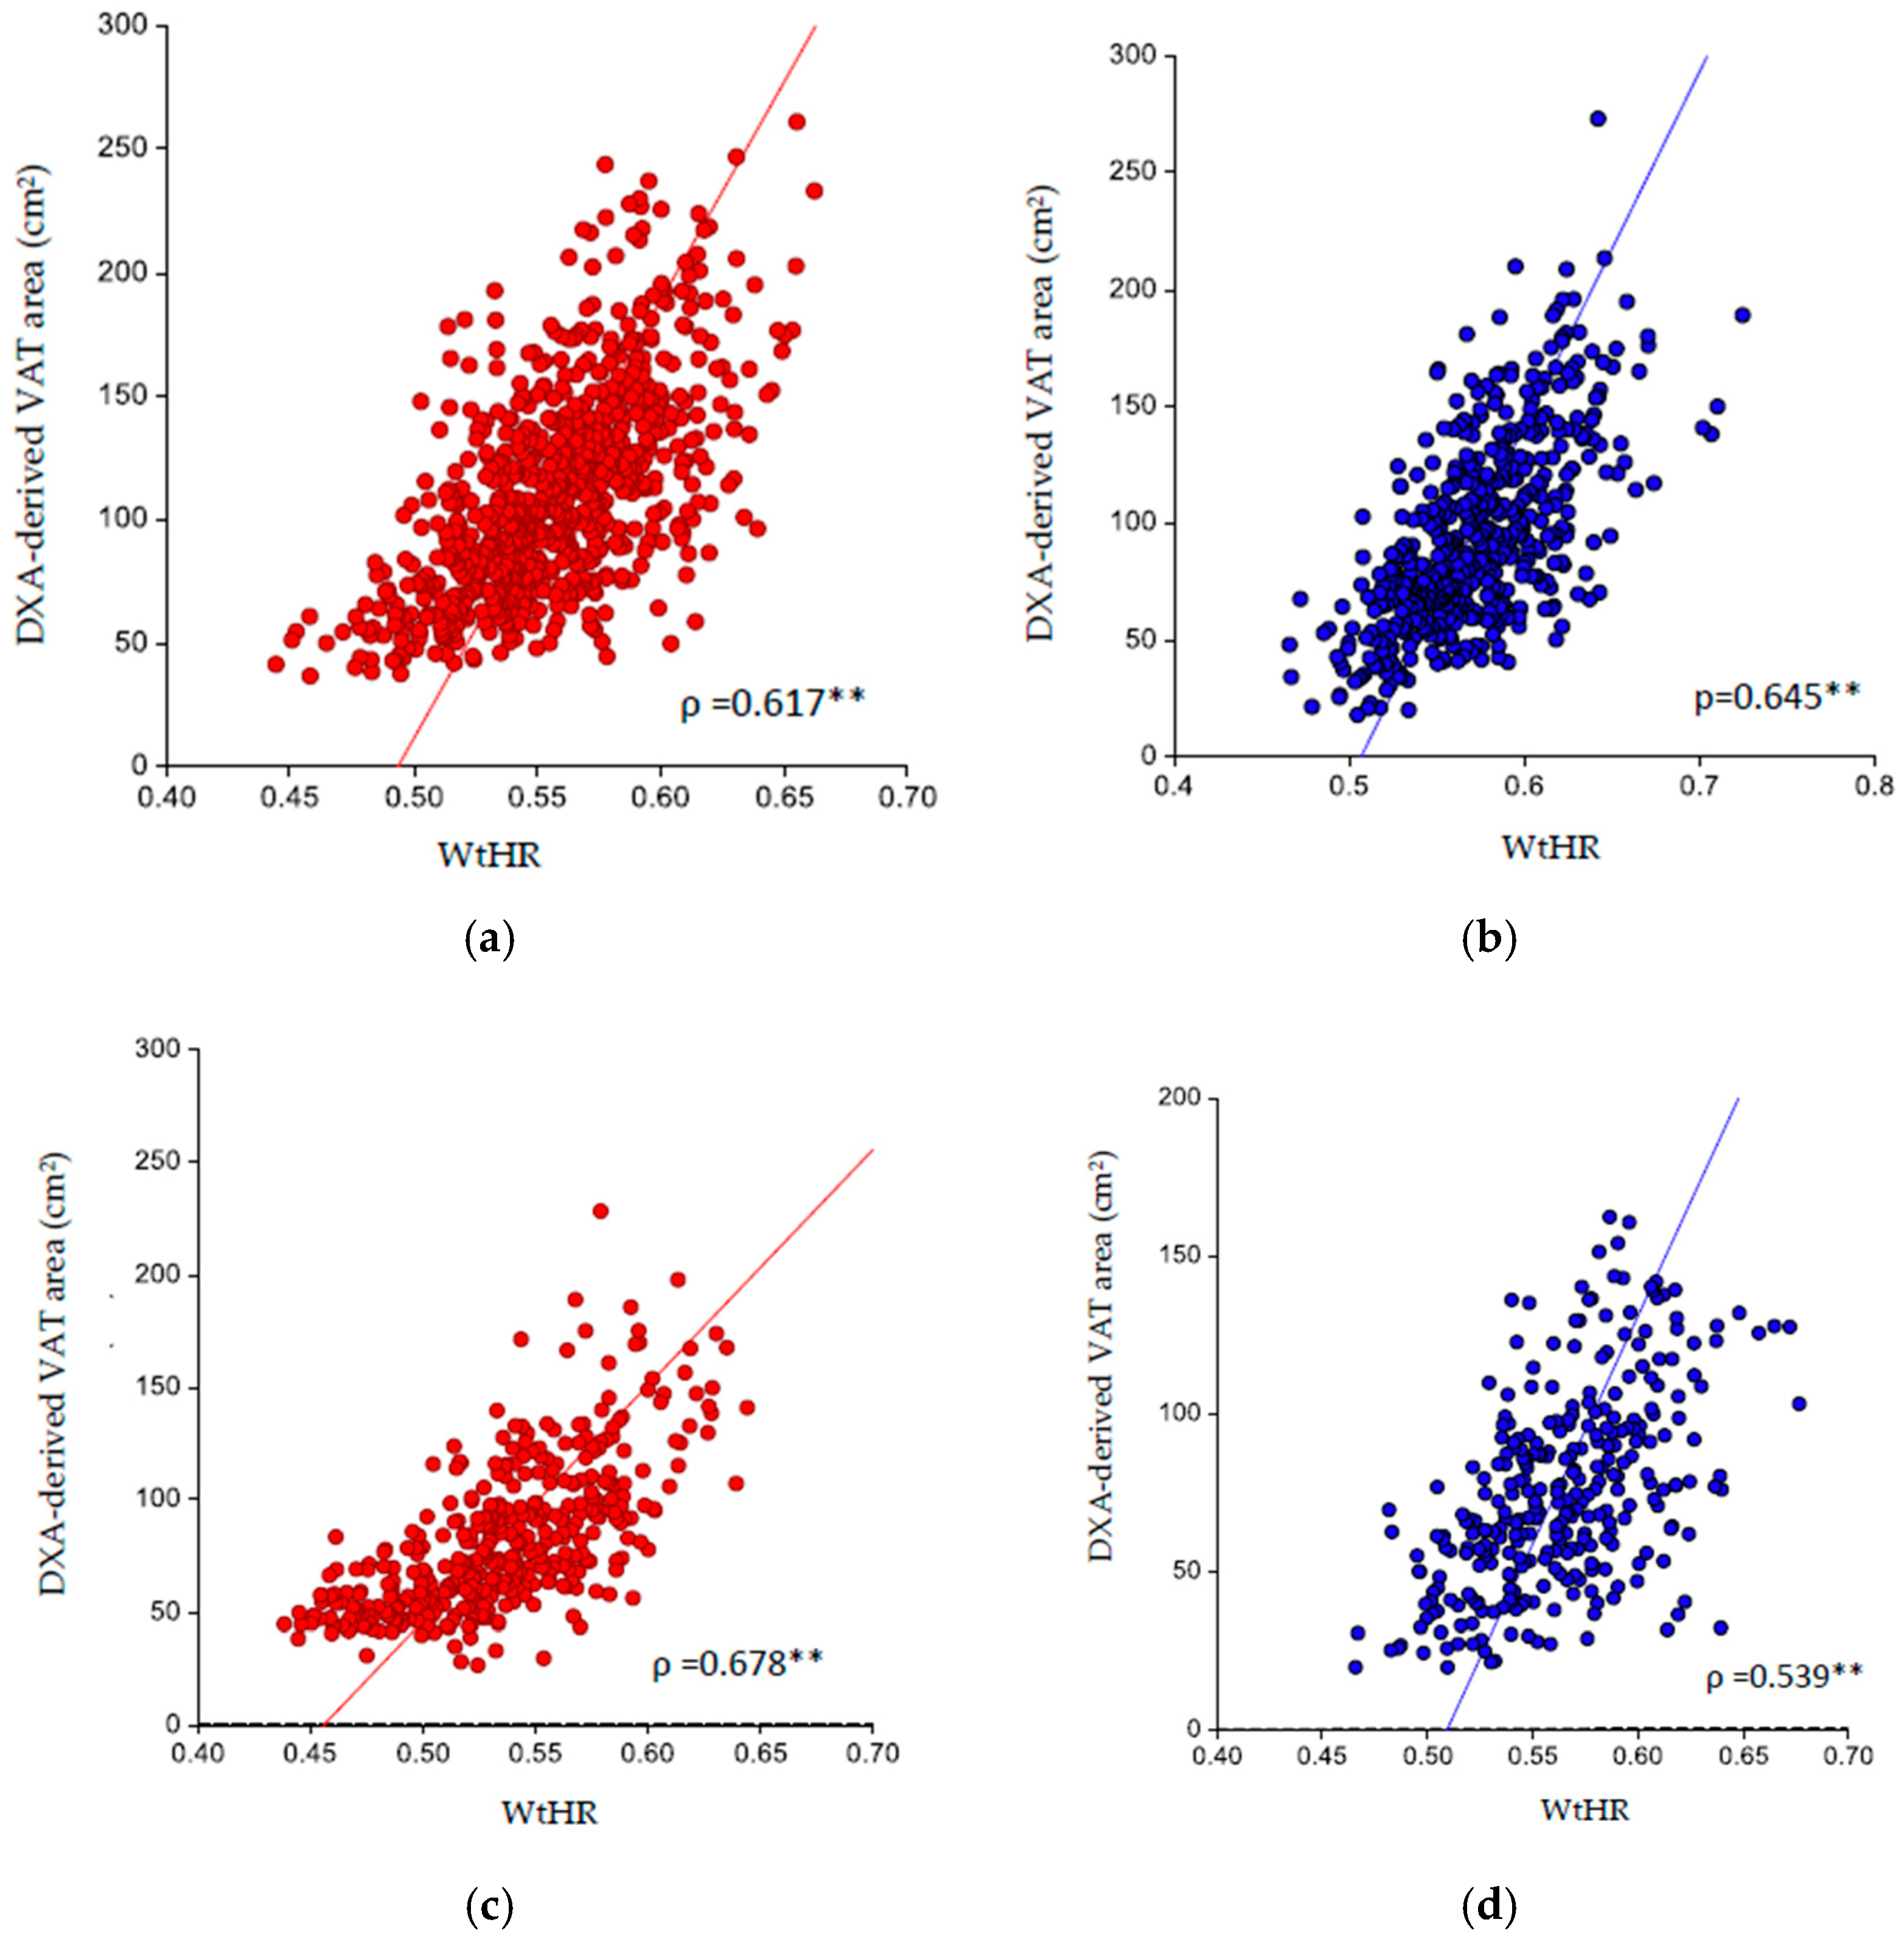
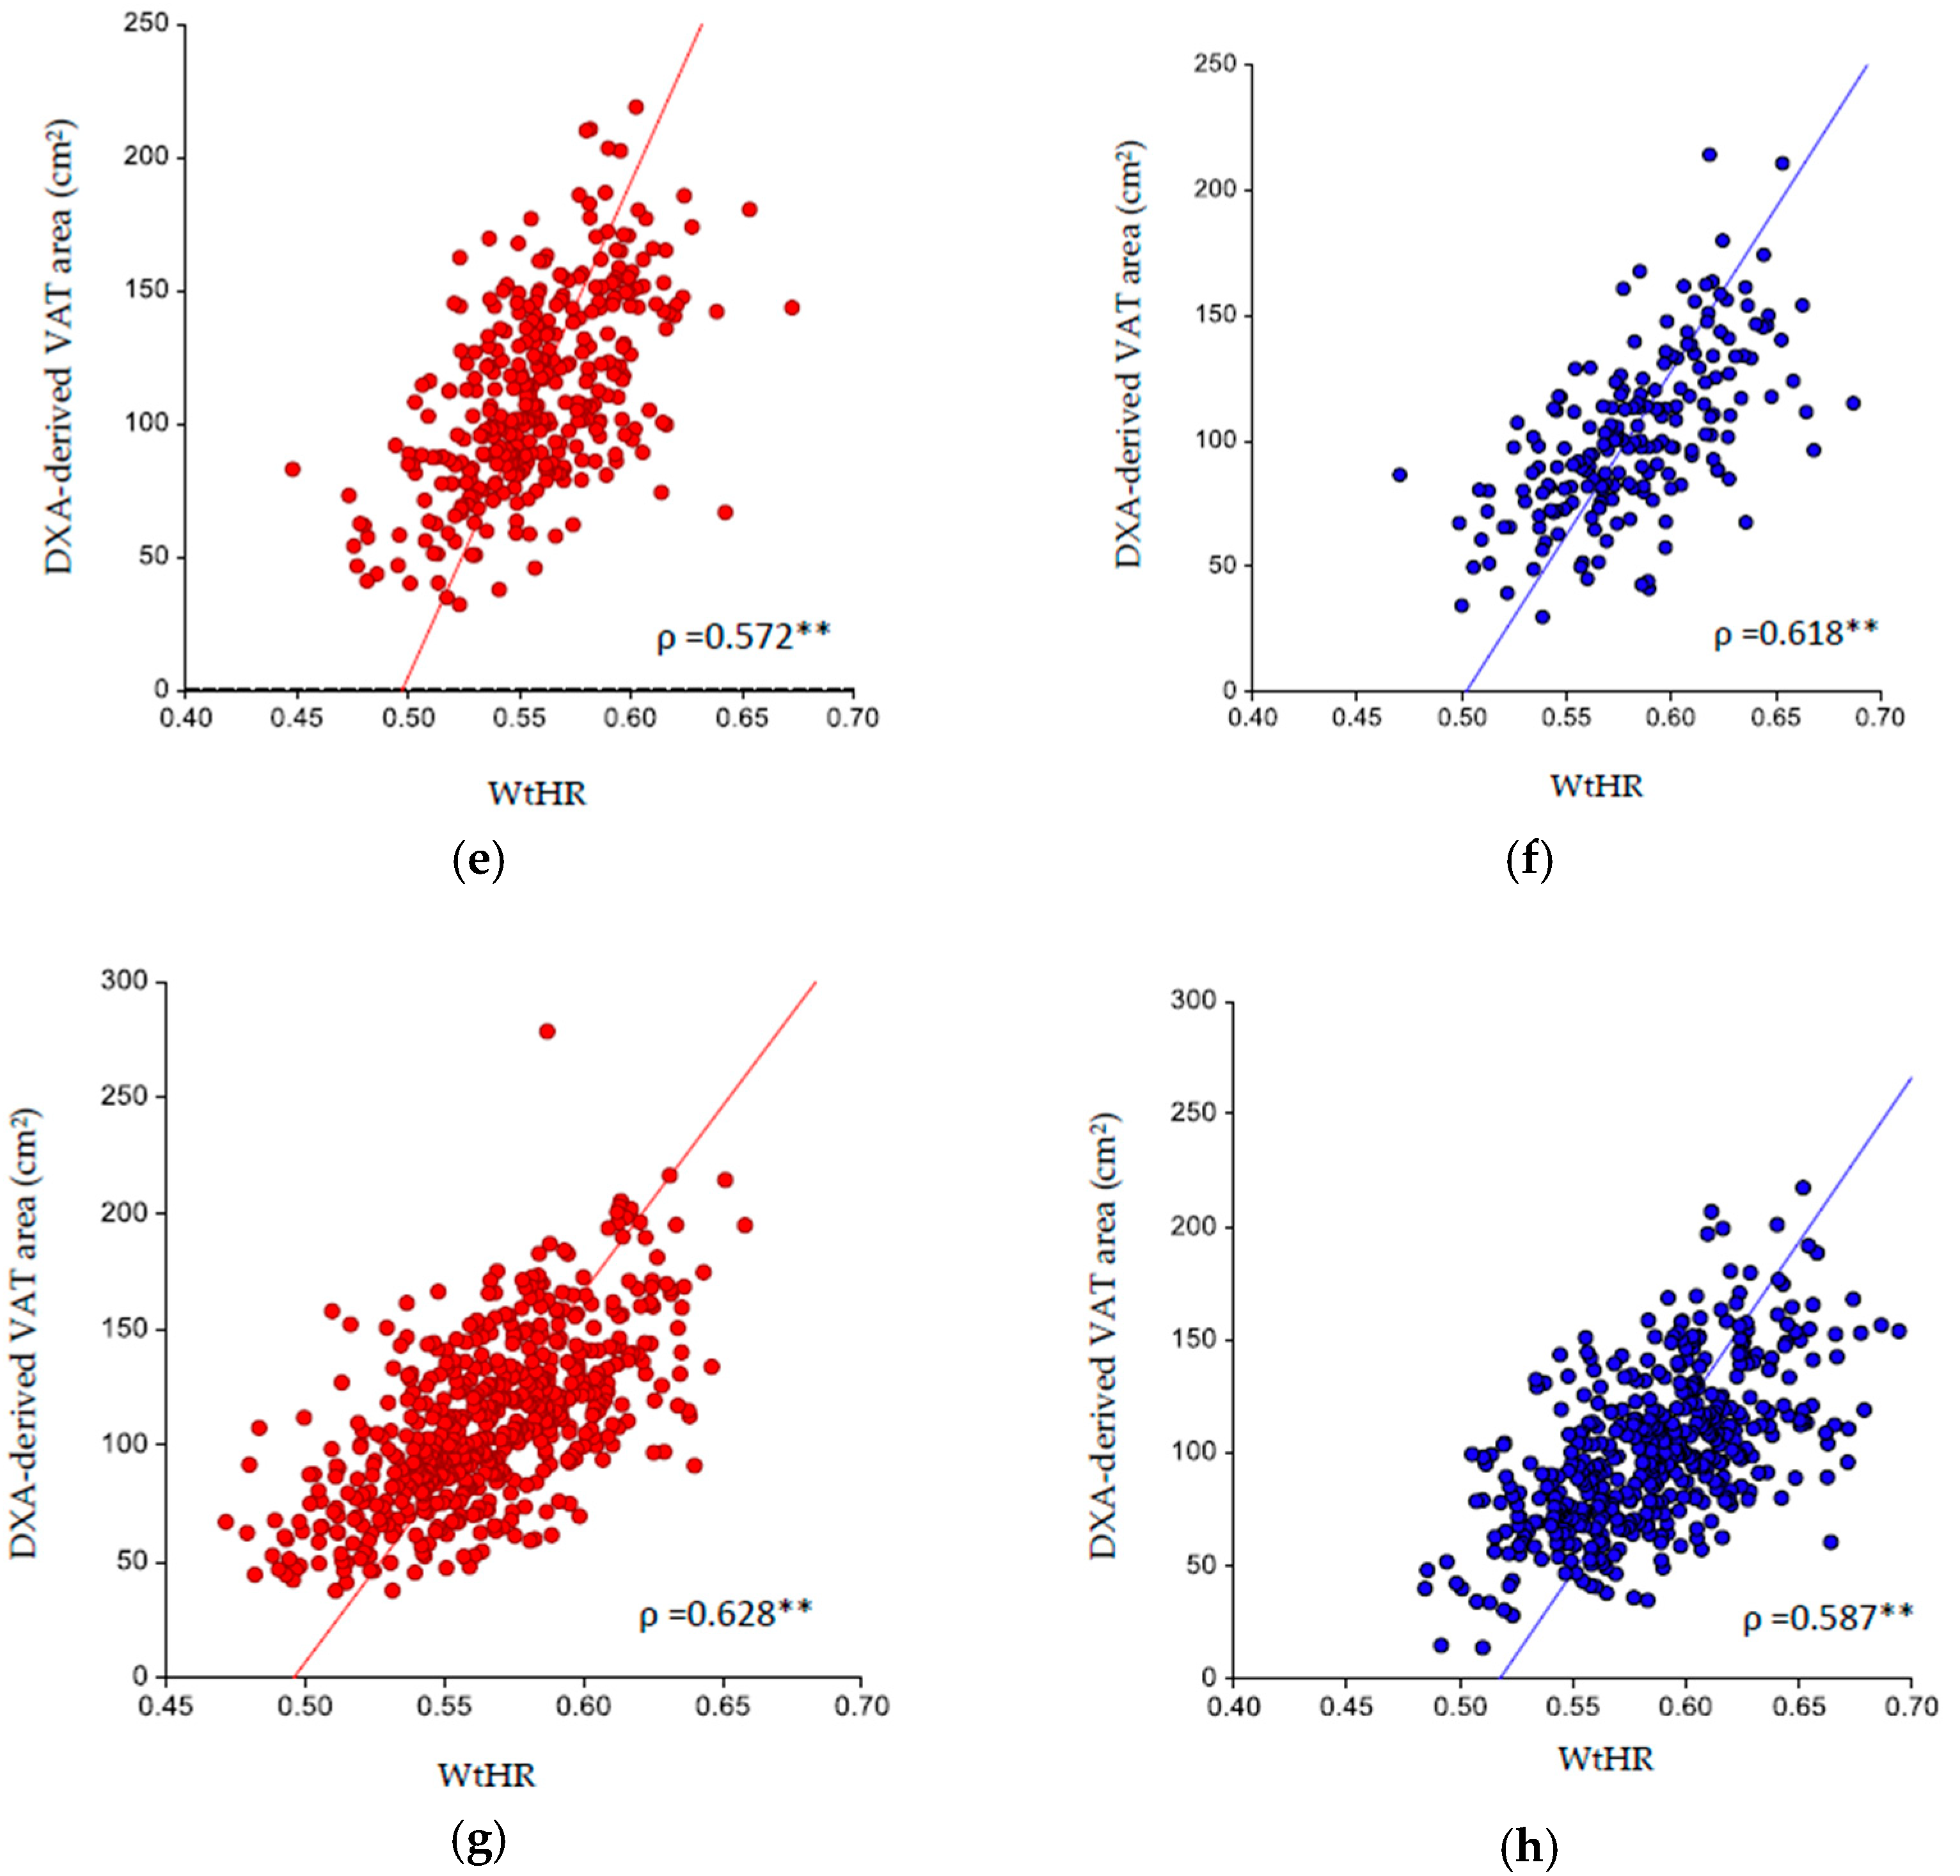
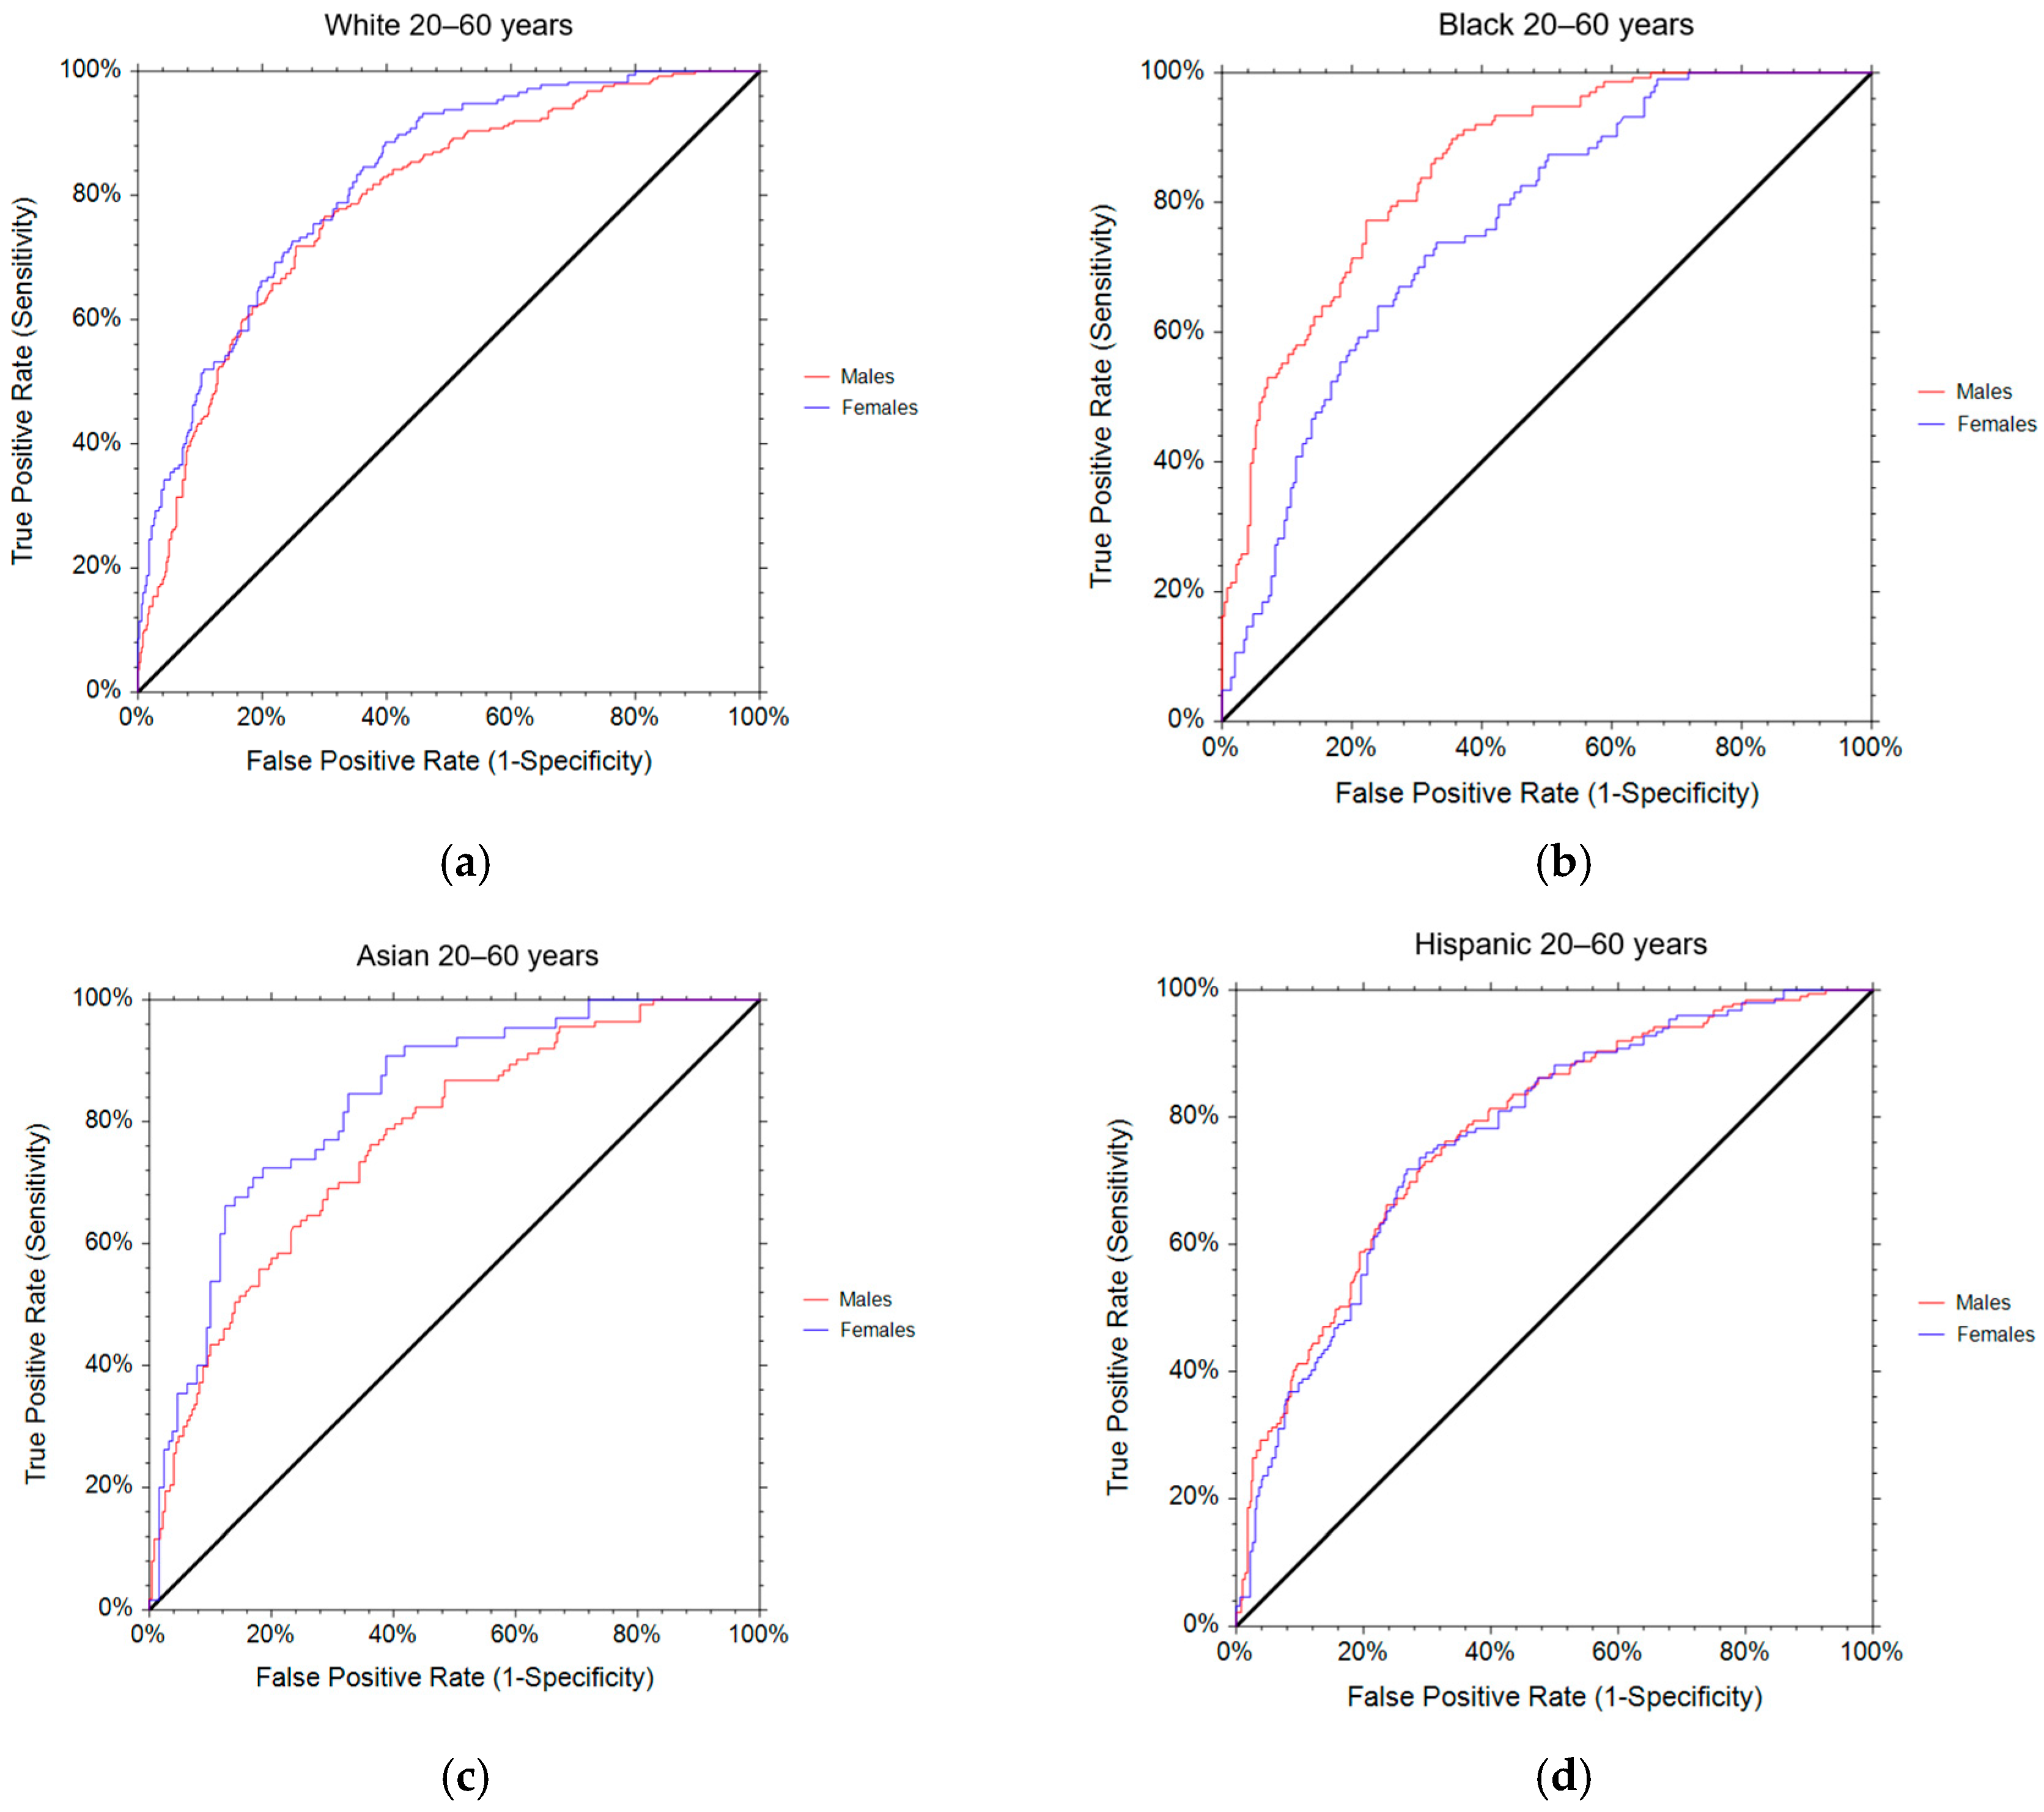
3. Results
4. Discussion
4.1. Findings and Comparison with the Previous Literature
4.2. Clinical Implications
4.3. Strengths and Limitations
4.4. New Directions for Future Research
5. Conclusions
Author Contributions
Funding
Institutional Review Board Statement
Informed Consent Statement
Data Availability Statement
Conflicts of Interest
References
- Reilly, J.J.; El-Hamdouchi, A.; Diouf, A.; Monyeki, A.; Somda, S.A. Determining the worldwide prevalence of obesity. Lancet 2018, 391, 1773–1774. [Google Scholar] [CrossRef] [PubMed]
- Pi-Sunyer, X. The medical risks of obesity. Postgrad. Med. 2009, 121, 21–33. [Google Scholar] [CrossRef] [PubMed]
- Sarwer, D.B.; Polonsky, H.M. The Psychosocial Burden of Obesity. Endocrinol. Metab. Clin. 2016, 45, 677–688. [Google Scholar] [CrossRef] [PubMed]
- El Ghoch, M.; Calugi, S.; Dalle Grave, R. The Effects of Low-Carbohydrate Diets on Psychosocial Outcomes in Obesity/Overweight: A Systematic Review of Randomized, Controlled Studies. Nutrients 2016, 8, 402. [Google Scholar] [CrossRef] [PubMed]
- Abdelaal, M.; le Roux, C.W.; Docherty, N.G. Morbidity and mortality associated with obesity. Ann. Transl. Med. 2017, 5, 161. [Google Scholar] [CrossRef]
- Lin, X.; Li, H. Obesity: Epidemiology, Pathophysiology, and Therapeutics. Front. Endocrinol. 2021, 12, 706978. [Google Scholar] [CrossRef]
- Wadden, T.A.; Tronieri, J.S.; Butryn, M.L. Lifestyle modification approaches for the treatment of obesity in adults. Am. Psychol. 2020, 75, 235–251. [Google Scholar] [CrossRef]
- Toplak, H.; Woodward, E.; Yumuk, V.; Oppert, J.M.; Halford, J.C.; Fruhbeck, G. 2014 EASO Position Statement on the Use of Anti-Obesity Drugs. Obes. Facts 2015, 8, 166–174. [Google Scholar] [CrossRef]
- Fried, M.; Yumuk, V.; Oppert, J.M.; Scopinaro, N.; Torres, A.J.; Weiner, R.; Yashkov, Y.; Fruhbeck, G. European Association for the Study of O, International Federation for the Surgery of Obesity-European C. Interdisciplinary European Guidelines on metabolic and bariatric surgery. Obes. Facts 2013, 6, 449–468. [Google Scholar] [CrossRef]
- Di Renzo, L.; Itani, L.; Gualtieri, P.; Pellegrini, M.; El Ghoch, M.; De Lorenzo, A. New BMI Cut-Off Points for Obesity in Middle-Aged and Older Adults in Clinical Nutrition Settings in Italy: A Cross-Sectional Study. Nutrients 2022, 14, 4848. [Google Scholar] [CrossRef]
- Weir, C.B.; Jan, A. BMI Classification Percentile and Cut off Points. In StatPearls; StatPearls: Treasure Island, FL, USA, 2020. [Google Scholar]
- World Health Organization. Obesity: Preventing and Managing the Global Epidemic; World Health Organization: Geneva, Switzerland, 1998. [Google Scholar]
- Pray, R.; Riskin, S. The History and Faults of the Body Mass Index and Where to Look Next: A Literature Review. Cureus 2023, 15, e48230. [Google Scholar] [CrossRef] [PubMed]
- Garn, S.M.; Leonard, W.R.; Hawthorne, V.M. Three limitations of the body mass index. Am. J. Clin. Nutr. 1986, 44, 996–997. [Google Scholar] [CrossRef] [PubMed]
- Nuttall, F. Body Mass Index: Obesity, BMI, and Health: A Critical Review. Nutr. Today 2015, 50, 117–128. [Google Scholar] [CrossRef] [PubMed]
- WHO Expert Consultation. Appropriate body-mass index for Asian populations and its implications for policy and intervention strategies. Lancet 2004, 363, 157–163. [Google Scholar] [CrossRef]
- Wu, Y.; Li, D.; Vermund, S.H. Advantages and Limitations of the Body Mass Index (BMI) to Assess Adult Obesity. Int. J. Environ. Res. Public. Health 2024, 21, 757. [Google Scholar] [CrossRef]
- Pasco, J.A.; Holloway, K.L.; Dobbins, A.G.; Kotowicz, M.A.; Williams, L.J.; Brennan, S.L. Body mass index and measures of body fat for defining obesity and underweight: A cross-sectional, population-based study. BMC Obes. 2014, 1, 9. [Google Scholar] [CrossRef]
- Shuster, A.; Patlas, M.; Pinthus, J.H.; Mourtzakis, M. The clinical importance of visceral adiposity: A critical review of methods for visceral adipose tissue analysis. Br. J. Radiol. 2012, 85, 1–10. [Google Scholar] [CrossRef]
- Sam, S. Differential Effect of Subcutaneous Abdominal and Visceral Adipose Tissue on Cardiometabolic Risk. Horm. Mol. Biol. Clin. Investig. 2018, 33, 438–448. [Google Scholar] [CrossRef]
- Neeland, I.J.; Ayers, C.R.; Rohatgi, A.K.; Turer, A.T.; Berry, J.D.; Das, S.R.; Vega, G.L.; Khera, A.; McGuire, D.K.; Grundy, S.M.; et al. Associations of visceral and abdominal subcutaneous adipose tissue with markers of cardiac and metabolic risk in obese adults. Obesity 2013, 21, E439–E447. [Google Scholar] [CrossRef]
- Fox, C.S.; Massaro, J.M.; Hoffmann, U.; Pou, K.M.; Maurovich-Horvat, P.; Liu, C.Y.; Vasan, R.S.; Murabito, J.M.; Meigs, J.B.; Cupples, L.A.; et al. Abdominal visceral and subcutaneous adipose tissue compartments: Association with metabolic risk factors in the Framingham Heart Study. Circulation 2007, 116, 39–48. [Google Scholar] [CrossRef]
- Nicklas, B.J.; Penninx, B.W.; Ryan, A.S.; Berman, D.M.; Lynch, N.A.; Dennis, K.E. Visceral adipose tissue cutoffs associated with metabolic risk factors for coronary heart disease in women. Diabetes Care 2003, 26, 1413–1420. [Google Scholar] [CrossRef] [PubMed]
- Poirier, P.; Despres, J.P. Waist circumference, visceral obesity, and cardiovascular risk. J. Cardiopulm. Rehabil. 2003, 23, 161–169. [Google Scholar] [CrossRef] [PubMed]
- Da Rosa, S.E.; Costa, A.C.; Fortes, M.S.R.; Marson, R.A.; Neves, E.B.; Rodrigues, L.C.; Ferreira, P.F.; Filho, J.F. Cut-Off Points of Visceral Adipose Tissue Associated with Metabolic Syndrome in Military Men. Healthcare 2021, 9, 886. [Google Scholar] [CrossRef] [PubMed]
- Ofenheimer, A.; Breyer-Kohansal, R.; Hartl, S.; Burghuber, O.C.; Krach, F.; Schrott, A.; Wouters, E.F.M.; Franssen, F.M.E.; Breyer, M.K. Reference values of body composition parameters and visceral adipose tissue (VAT) by DXA in adults aged 18–81 years-results from the LEAD cohort. Eur. J. Clin. Nutr. 2020, 74, 1181–1191. [Google Scholar] [CrossRef]
- Gómez-Ambrosi j González-Crespo, I.; Catalán, V.; Rodríguez, A.; Moncada, R.; Valentí, V.; Romero, S.; Beatriz Ramírez, B.; Silva, C.; Gil, M.J.; Salvador, J.; et al. Clinical usefulness of abdominal bioimpedance (ViScan) in the determination of visceral fat and its application in the diagnosis and management of obesity and its comorbidities. Clin. Nutr. 2018, 37, 580–589. [Google Scholar] [CrossRef]
- Seimon, R.V.; Wild-Taylor, A.L.; Gibson, A.A.; Harper, C.; McClintock, S.; Fernando, H.A.; Hsu, M.S.H.; Luz, F.Q.D.; Keating, S.E.; Johnson, N.A.; et al. Less Waste on Waist Measurements: Determination of Optimal Waist Circumference Measurement Site to Predict Visceral Adipose Tissue in Postmenopausal Women with Obesity. Nutrients 2018, 10, 239. [Google Scholar] [CrossRef]
- Swainson, M.G.; Batterham, A.M.; Tsakirides, C.; Rutherford, Z.H.; Hind, K. Prediction of whole-body fat percentage and visceral adipose tissue mass from five anthropometric variables. PLoS ONE 2017, 12, e0177175. [Google Scholar] [CrossRef]
- So, R.; Matsuo, T.; Saotome, K.; Tanaka, K. Equation to estimate visceral adipose tissue volume based on anthropometry for workplace health checkup in Japanese abdominally obese men. Ind. Health 2017, 55, 416–422. [Google Scholar] [CrossRef]
- Busetto, L.; Dicker, D.; Frühbeck, G.; Halford, J.C.G.; Sbraccia, P.; Yumuk, V.; Goossens, G.H. A new framework for the diagnosis, staging and management of obesity in adults. Nat. Med. 2024, 30, 2395–2399. [Google Scholar] [CrossRef]
- Nevill, A.M.; Leahy, G.D.; Mayhew, J.; Sandercock, G.R.H.; Myers, T.; Duncan, M.J. At risk’ waist-to-height ratio cut-off points recently adopted by NICE and US Department of Defense will unfairly penalize shorter adults. What is the solution? Obes. Res. Clin. Pract. 2023, 17, 1–8. [Google Scholar] [CrossRef]
- Ahluwalia, N.; Dwyer, J.; Terry, A.; Moshfegh, A.; Johnson, C. Update on NHANES Dietary Data: Focus on Collection, Release, Analytical Considerations, and Uses to Inform Public Policy. Adv. Nutr. 2016, 7, 121–134. [Google Scholar] [CrossRef] [PubMed]
- Johnson, C.L.; Paulose-Ram, R.; Ogden, C.L.; Carroll, M.D.; Kruszon-Moran, D.; Sylvia, M.; Dohrmann, S.M.; Curtin, L.R. National Health and Nutrition Examination Survey: Analytic Guidelines, 1999–2010; Vital Health Stat; National Center for Health Statistics: Hyattsville, MD, USA, 2013; Volume 161, pp. 1–24. [Google Scholar]
- Bilić-Zulle, L. Comparison of methods: Passing and Bablok regression. Biochem. Med. 2011, 21, 49–52. [Google Scholar] [CrossRef] [PubMed]
- Mandrekar, J.N. Receiver operating characteristic curve in diagnostic test assessment. J. Thorac. Oncol. 2010, 5, 1315–1316. [Google Scholar] [CrossRef] [PubMed]
- NCSS 12 Statistical Software; NCSS, LLC: Kaysville, UT, USA. 2018. Available online: https://www.ncss.com/software/ncss/ (accessed on 25 September 2024).
- Hintze, J. PASS 11; NCSS, LLC: Kaysville, UT, USA, 2011; Available online: www.ncss.com (accessed on 25 September 2024).
- Van Ravenzwaaij, D.; Ioannidis, J.P.A. True and false positive rates for different criteria of evaluating statistical evidence from clinical trials. BMC Med. Res. Methodol. 2019, 19, 218. [Google Scholar] [CrossRef]
- Gibson, S.; Ashwell, M. A simple cut-off for waist-to-height ratio (0·5) can act as an indicator for cardiometabolic risk: Recent data from adults in the Health Survey for England. Br. J. Nutr. 2020, 123, 681–690. [Google Scholar] [CrossRef]
- ELMabchour, A.; Delisle, H.; Vilgrain, C.; Larco, P.; Sodjinou, R.; Batal, M. Specific cut-off points for waist circumference and waist-to-height ratio as predictors of cardiometabolic risk in Black subjects: A cross-sectional study in Benin and Haiti. Diabetes Metab. Syndr. Obes. 2015, 8, 513–523. [Google Scholar] [CrossRef]
- Savva, S.C.; Lamnisos, D.; Kafatos, A.G. Predicting cardiometabolic risk: Waist-to-height ratio or BMI. A meta-analysis. Diabetes Metab. Syndr. Obes. 2013, 6, 403–419. [Google Scholar] [CrossRef]
- Roriz, A.K.; Passos, L.C.; de Oliveira, C.C.; Eickemberg, M.; Moreira, P.A. Evaluation of the accuracy of anthropometric clinical indicators of visceral fat in adults and elderly. PLoS ONE 2014, 9, e103499. [Google Scholar] [CrossRef]
- Bleeker, S.E.; Moll, H.A.; Steyerberg, E.W.; Donders, A.R.T.; Derksen-Lubsen, G.; Grobbee, D.E.; Moons, K.G.M. External validation is necessary in prediction research: A clinical example. J. Clin. Epidemiol. 2003, 56, 826–832. [Google Scholar] [CrossRef]
- Ashby-Thompson, M.; Heshka, S.; Rizkalla, B.; Zurlo, R.; Lemos, T.; Janumala, I.; Goodpaster, B.; DeLany, J.; Courcoulas, A.; Strain, G.; et al. Validity of dual-energy X-ray absorptiometry for estimation of visceral adipose tissue and visceral adipose tissue change after surgery-induced weight loss in women with severe obesity. Obesity 2022, 30, 1057–1065. [Google Scholar] [CrossRef]
- Kali, A.; Gusmanov, A.; Aripov, M.; Chan, M.Y. Proposing new body mass index and waist circumference cut-offs based oncardiometabolic risks for a Central Asia population: A feasibility study. Front. Endocrinol. 2022, 13, 963352. [Google Scholar] [CrossRef] [PubMed]
- Wang, X.; Cheng, Z. Cross-Sectional Studies: Strengths, Weaknesses, and Recommendations. Chest 2020, 158, 65–71. [Google Scholar] [CrossRef] [PubMed]
- Abildgaard, J.; Ploug, T.; Al-Saoudi, E.; Wagner, T.; Thomsen, C.; Ewertsen, C.; Bzorek, M.B.; Pedersen, B.K.; Pedersen, A.T.; Lindegaard, B. Changes in abdominal subcutaneous adipose tissue phenotype following menopause is associated with increased visceral fat mass. Sci. Rep. 2021, 11, 14750. [Google Scholar] [CrossRef] [PubMed]
- Caruana, E.J.; Roman, M.; Hernández-Sánchez, J.; Solli, P. Longitudinal studies. J. Thorac. Dis. 2015, 7, 537–540. [Google Scholar]

| Ethnicity | |||||
|---|---|---|---|---|---|
| Total (n = 3566) | White (n = 1285) | Black (n = 722) | Asian (n = 536) | Hispanic (n = 1023) | |
| Age | 40.6 (11.1) | 40.1 (11.2) | 40.5 (11.5) | 42.0 (10.6) | 40.1 (11.1) |
| Sex | |||||
| Males | 2077 (58.2) | 760 (59.1) | 410 (56.8) | 342 (63.8) | 565 (55.2) |
| Females | 1489 (41.8) | 525 (40.9) | 312 (43.2) | 194 (36.2) | 458 (44.8) |
| BMI (kg/m2) | 27.4 (1.4) | 27.4 (1.4) | 27.4 (1.4) | 27.2 (1.4) | 27.6 (1.4) |
| Weight (kg) | 78.2 (10.1) | 81.3 (9.8) | 80.2 (9.3) | 74.6 (9.3) | 74.9 (9.6) |
| Height (cm) | 166.7 (10.1 | 168.9 (9.9) | 168.9 (9.6) | 163.2 (9.4) | 163.1 (9.5) |
| WC (cm) | 94.9 (6.8) | 96.7 (6.9) | 93.3 (7.0) | 93.7 (6.2) | 94.4 (6.4) |
| WtHR | 0.56 (0.04) | 0.56 (0.04) | 0.55 (0.04) | 0.57 (0.04) | 0.58 (0.04) |
| <0.5 | 200 (5.6) | 61 (4.7) | 102 (14.1) | 14 (2.6) | 23 (2.2) |
| ≥0.5 | 3366 (94.4) | 1224 (95.3) | 620 (85.9) | 522 (97.4) | 1000 (97.8) |
| DXA-derived VAT area (cm2) | 100.5 (38.8) | 104.6 (41.9) | 79.4 (32.4) | 108.0 (34.9) | 106.2 (35.7) |
| Ethnicity | |||||
|---|---|---|---|---|---|
| Total (n = 2077) | White (n = 760) | Black (n = 410) | Asian (n = 342) | Hispanic (n = 565) | |
| Age | 40.6 (11.1) | 40.8 (11.1) | 40.2 (11.5) | 41.5 (10.6) | 40.2 (11.1) |
| BMI (kg/m2) | 27.4 (1.4) | 27.4 (1.4) | 27.3 (1.4) | 27.1 (1.3) | 27.7 (1.4) |
| Weight (kg) | 83.4 (8.4) | 86.5 (8.0) | 85.3 (7.7) | 79.2 (7.5) | 80.5 (7.9) |
| Height (cm) | 174.2 (7.7) | 177.4 (6.8) | 176.6 (6.8) | 170.7 (7.1) | 170.4 (7.3) |
| WC (cm) | 96.6 (6.6) | 98.7 (6.4) | 94.4 (7.5) | 95.2 (5.8) | 96.5 (6.0) |
| WtHR | 0.56 (0.04) | 0.56 (0.04) | 0.53 (0.04) | 0.56 (0.03) | 0.57 (0.03) |
| <0.5 | 165 (7.9) | 47 (6.2) | 88 (21.5) | 12 (3.5) | 18 (3.2) |
| ≥0.5 | 1912 (92.1) | 713 (93.8) | 322 (78.5) | 330 (96.5) | 547 (96.8) |
| DXA-derived VAT area (cm2) | 105.4 (39.3) | 111.2 (41.8) | 82.4 (33.2) | 111.3 (35.6) | 110.7 (36.1) |
| Females | Ethnicity | ||||
|---|---|---|---|---|---|
| Total (n = 1489) | White (n = 525) | Black (n = 312) | Asian (n = 194) | Hispanic (n = 458) | |
| Age | 40.7 (11.2) | 40.4 (11.3) | 40.9 (11.6) | 42.9 (10.6) | 40.0 (11.0) |
| BMI (kg/m2) | 27.4 (1.4) | 27.3 (1.4) | 27.6 (1.4) | 27.2 (1.4) | 27.6 (1.4) |
| Weight (kg) | 71.0 (7.3) | 73.7 (6.9) | 73.6 (6.6) | 66.6 (6.1) | 68.0 (6.5) |
| Height (cm) | 160.7 (7.3) | 164.1 (6.4) | 163.3 (6.5) | 156.4 (5.9) | 157.0 (6.5) |
| WC (cm) | 92.5 (6.4) | 93.8 (6.7) | 91.9 (6.2) | 91.1 (6.1) | 91.9 (6.1) |
| WtHR | 0.58 (0.04) | 0.57 (0.04) | 0.56 (0.04) | 0.58 (0.04) | 0.59 (0.04) |
| <0.5 | 35 (2.4) | 14 (2.7) | 14 (4.5) | 2 (1.0) | 5 (1.1) |
| ≥0.5 | 1454 (97.6) | 511 (97.3) | 298 (95.5) | 192 (99.0) | 453 (98.9) |
| DXA-derived VAT area (cm2) | 93.6 (37.0) | 95.0 (40.1) | 75.5 (31.1) | 102.3 (32.8) | 100.8 (34.5) |
| n | AUC | 95%CI | p Value | Cut-Off | Sensitivity | Specificity | |
|---|---|---|---|---|---|---|---|
| Males | |||||||
| White | 760 | 0.7920 | 0.7563–0.8230 | <0.0001 | 0.57 | 0.7183 | 0.7461 |
| Black | 410 | 0.8550 | 0.8145–0.8872 | <0.0001 | 0.55 | 0.7353 | 0.7774 |
| Asian | 342 | 0.7695 | 0.7125–0.8165 | <0.0001 | 0.56 | 0.7257 | 0.6550 |
| Hispanic | 565 | 0.7785 | 0.7356–0.8151 | <0.0001 | 0.57 | 0.7302 | 0.7048 |
| Females | |||||||
| White | 525 | 0.8241 | 0.7850–0.8566 | <0.0001 | 0.58 | 0.7257 | 0.7514 |
| Black | 312 | 0.7632 | 0.7046–0.8114 | <0.0001 | 0.57 | 0.7184 | 0.6890 |
| Asian | 194 | 0.8342 | 0.7660–0.8839 | <0.0001 | 0.59 | 0.7385 | 0.7364 |
| Hispanic | 458 | 0.7710 | 0.7228–0.8118 | <0.0001 | 0.59 | 0.7434 | 0.702 |
| Total Sample | WtHR ≥ 0.5 | New Cut-Off Point ≥ C§ | Δ % Detected | |||||||
|---|---|---|---|---|---|---|---|---|---|---|
| DXA-Derived VAT (cm2) | Total Classified ≥ 0.5 | Proportion Correctly Diagnosed (TP) | Proportion Incorrectly Diagnosed (FP) | Total Classified ≥ C§ | Proportion Correctly Diagnosed (TP) | Proportion Incorrectly Diagnosed (FP) | ||||
| 3rd Tertile | 1st and 2nd Tertiles | |||||||||
| n (%) | n (%) | n (%) | ||||||||
| Males | ||||||||||
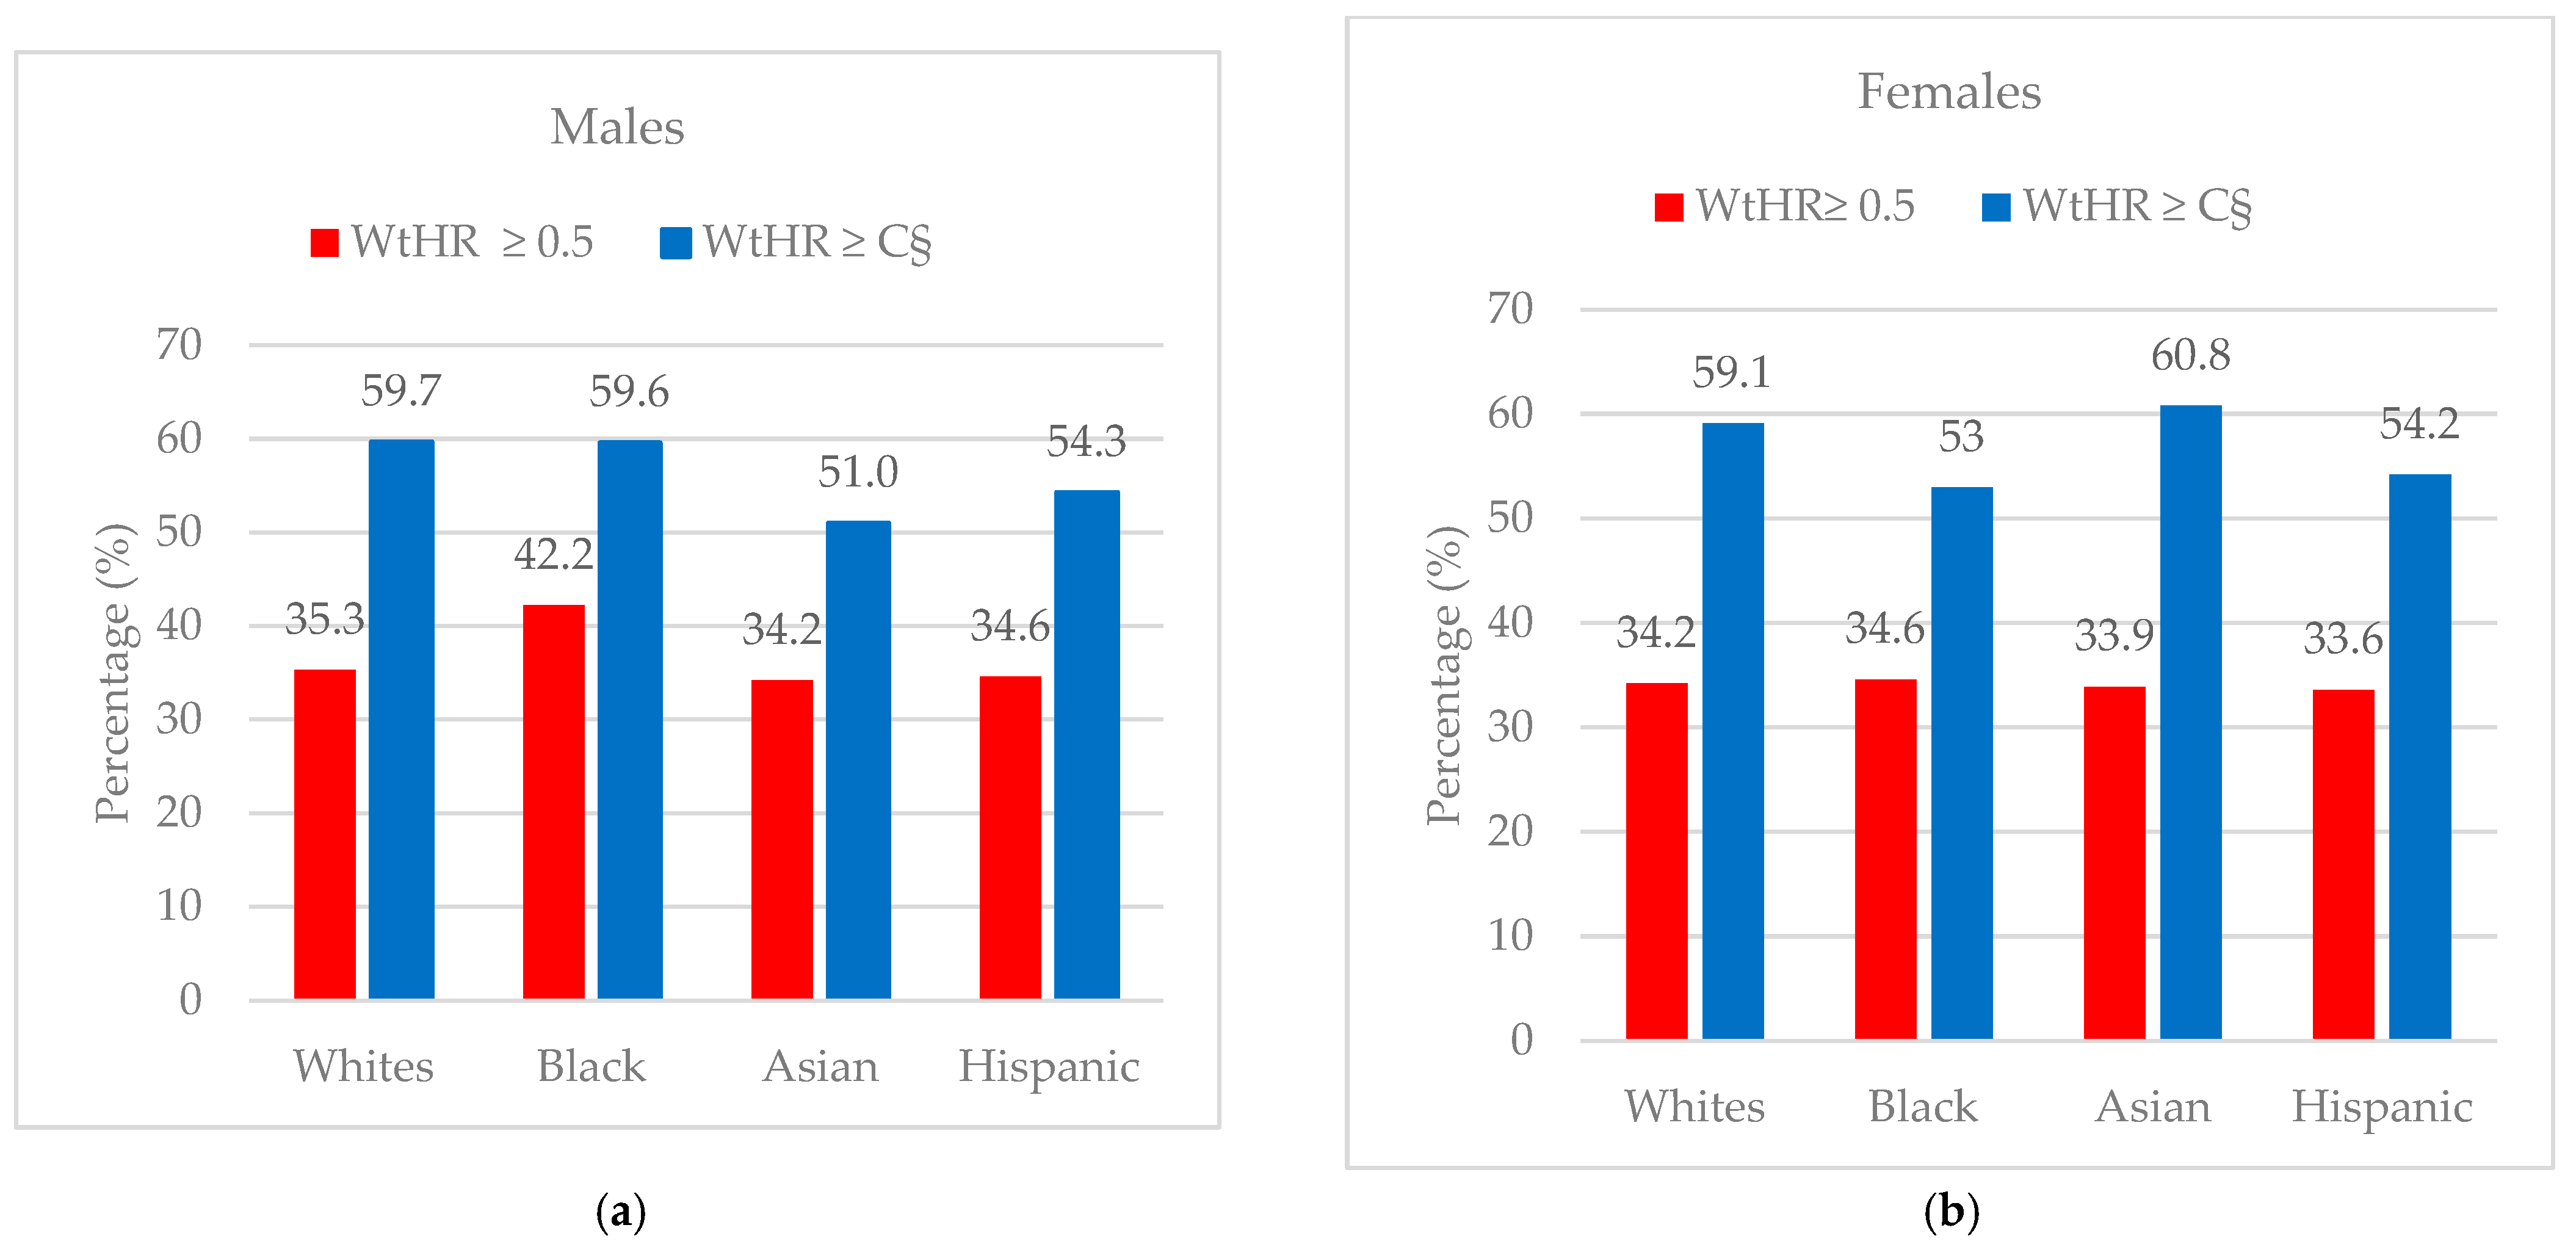
| White | 760 (100) | 252 (33.2) | 508 (66.8) | 713 (100) | 252 (35.3) | 461 (64.7) | 273 (100) | 163 (59.7) | 110 (40.3) | +24.4 |
| Black | 410 (100) | 136 (33.2) | 274 (66.8) | 322 (100) | 186 (57.8) | 136 (42.2) | 183 (100) | 109 (59.6) | 74 (27.0) | +17.4 |
| Asian | 342 (100) | 113 (33.0) | 229 (66.9) | 330 (100) | 113 (34.2) | 217 (65.8) | 155 (100) | 79 (51.0) | 76 (49.0) | +16.8 |
| Hispanic | 565 (100) | 189 (33.5) | 376 (66.5) | 547 (100) | 189 (34.6) | 358 (65.4) | 254 (100) | 138 (54.3) | 116 (45.7) | +19.7 |
| Females | ||||||||||
| White | 525 (100) | 175 (33.3) | 350 (66.7) | 511 (100) | 175 (34.2) | 336 (65.8) | 215 (100) | 127 (59.1) | 88 (40.9) | +18.2 |
| Black | 312 (100) | 103 (33.0) | 195 (62.5) | 298 (100) | 103 (34.6) | 195 (65.5) | 132 (100) | 70 (53.0) | 62 (47.0) | +18.4 |
| Asian | 194 (100) | 65 (33.5) | 129 (66.5) | 192 (100) | 65 (33.9) | 127 (66.1) | 79 (100) | 48 (60.8) | 31 (39.2) | +26.9 |
| Hispanic | 458 (100) | 152 (33.2) | 306 (66.8) | 453 (100) | 152 (33.6) | 301 (98.4) | 212 (100) | 115 (54.2) | 97 (45.8) | +20.6 |
Disclaimer/Publisher’s Note: The statements, opinions and data contained in all publications are solely those of the individual author(s) and contributor(s) and not of MDPI and/or the editor(s). MDPI and/or the editor(s) disclaim responsibility for any injury to people or property resulting from any ideas, methods, instructions or products referred to in the content. |
© 2024 by the authors. Licensee MDPI, Basel, Switzerland. This article is an open access article distributed under the terms and conditions of the Creative Commons Attribution (CC BY) license (https://creativecommons.org/licenses/by/4.0/).
Share and Cite
Itani, L.; El Ghoch, M. Waist-to-Height Ratio Cut-Off Points for Central Obesity in Individuals with Overweight Across Different Ethnic Groups in NHANES 2011–2018. Nutrients 2024, 16, 3838. https://doi.org/10.3390/nu16223838
Itani L, El Ghoch M. Waist-to-Height Ratio Cut-Off Points for Central Obesity in Individuals with Overweight Across Different Ethnic Groups in NHANES 2011–2018. Nutrients. 2024; 16(22):3838. https://doi.org/10.3390/nu16223838
Chicago/Turabian StyleItani, Leila, and Marwan El Ghoch. 2024. "Waist-to-Height Ratio Cut-Off Points for Central Obesity in Individuals with Overweight Across Different Ethnic Groups in NHANES 2011–2018" Nutrients 16, no. 22: 3838. https://doi.org/10.3390/nu16223838
APA StyleItani, L., & El Ghoch, M. (2024). Waist-to-Height Ratio Cut-Off Points for Central Obesity in Individuals with Overweight Across Different Ethnic Groups in NHANES 2011–2018. Nutrients, 16(22), 3838. https://doi.org/10.3390/nu16223838