

Vitamin D Deficiency: Insights and Perspectives from a Five-Year Retrospective Analysis of Children from Northeastern Romania


 ,
,  ,
,  , , and
Abstract
1. Introduction
2. Materials and Methods
3. Results
4. Discussion
5. Conclusions
Author Contributions
Funding
Institutional Review Board Statement
Informed Consent Statement
Data Availability Statement
Conflicts of Interest
References
- Glisson, F.; Bate, G.; Regemorter, A. De Rachitide; Pre-1801 Imprint Collection (Library of Congress); Typis T. Roycrof: London, UK, 1660. [Google Scholar]
- Chesney, R.W. Theobald palm and his remarkable observation: How the sunshine vitamin came to be recognized. Nutrients 2012, 4, 42–51. [Google Scholar] [CrossRef] [PubMed]
- Jones, G. 100 years of vitamin D: Historical aspects of vitamin D. Endocr. Connect. 2022, 11, e210594. [Google Scholar] [CrossRef] [PubMed]
- Bikle, D.D. Vitamin D metabolism, mechanism of action, and clinical applications. Chem. Biol. 2014, 21, 319–329. [Google Scholar] [CrossRef]
- Rebelos, E.; Tentolouris, N.; Jude, E. The Role of Vitamin D in Health and Disease: A Narrative Review on the Mechanisms Linking Vitamin D with Disease and the Effects of Supplementation. Drugs 2023, 83, 665–685. [Google Scholar] [CrossRef] [PubMed]
- Corsello, A.; Spolidoro, G.C.I.; Milani, G.P.; Agostoni, C. Vitamin D in pediatric age: Current evidence, recommendations, and misunderstandings. Front. Med. 2023, 10, 1107855. [Google Scholar] [CrossRef]
- Cominacini, M.; Fumaneri, A.; Ballerini, L.; Braggio, M.; Valenti, M.T.; Dalle Carbonare, L. Unraveling the Connection: Visceral Adipose Tissue and Vitamin D Levels in Obesity. Nutrients 2023, 15, 4259. [Google Scholar] [CrossRef]
- Tobias, D.K.; Luttmann-Gibson, H.; Mora, S.; Danik, J.; Bubes, V.; Copeland, T.; LeBoff, M.S.; Cook, N.R.; Lee, I.M.; Buring, J.E.; et al. Association of Body Weight with Response to Vitamin D Supplementation and Metabolism. JAMA Netw. Open 2023, 6, e2250681. [Google Scholar] [CrossRef]
- Chirita-Emandi, A.; Socolov, D.; Haivas, C.; Calapiș, A.; Gheorghiu, C.; Puiu, M. Vitamin D Status: A Different Story in the Very Young versus the Very Old Romanian Patients. PLoS ONE 2015, 10, e0128010. [Google Scholar] [CrossRef]
- Badiu Tișa, I.; Cozma-Petruț, A.; Samașca, G.; Miere, D.; Filip, L.; Banc, R.; Mîrza, O.; Iancu, M. Vitamin D Status among 2–18-Year-Old Romanian Pediatric Patients: A Single-Center Study. Nutrients 2024, 16, 2266. [Google Scholar] [CrossRef]
- Cui, A.; Zhang, T.; Xiao, P.; Fan, Z.; Wang, H.; Zhuang, Y. Global and regional prevalence of vitamin D deficiency in population-based studies from 2000 to 2022: A pooled analysis of 7.9 million participants. Front. Nutr. 2023, 10, 1070808. [Google Scholar] [CrossRef]
- Lips, P.; de Jongh, R.T.; van Schoor, N.M. Trends in Vitamin D Status Around the World. JBMR Plus 2021, 5, e10585. [Google Scholar] [CrossRef] [PubMed]
- Lips, P.; Cashman, K.D.; Lamberg-Allardt, C.; Bischoff-Ferrari, H.A.; Obermayer-Pietsch, B.; Bianchi, M.L.; Stepan, J.; El-Hajj Fuleihan, G.; Bouillon, R. Current vitamin D status in European and Middle East countries and strategies to prevent vitamin D deficiency: A position statement of the European Calcified Tissue Society. Eur. J. Endocrinol. 2019, 180, P23–P54. [Google Scholar] [CrossRef] [PubMed]
- Roth, D.E.; Abrams, S.A.; Aloia, J.; Bergeron, G.; Bourassa, M.W.; Brown, K.H.; Calvo, M.S.; Cashman, K.D.; Combs, G.; De-Regil, L.M. Global prevalence and disease burden of vitamin D deficiency: A roadmap for action in low- and middle-income countries. Ann. N. Y. Acad. Sci. 2018, 1430, 44–79. [Google Scholar] [CrossRef] [PubMed]
- Spiro, A.; Buttriss, J.L. Vitamin D: An overview of vitamin D status and intake in Europe. Nutr. Bull. 2014, 39, 322–350. [Google Scholar] [CrossRef]
- Levine, M.A. Diagnosis and Management of Vitamin D Dependent Rickets. Front. Pediatr. 2020, 8, 315. [Google Scholar] [CrossRef]
- Ross, A.C.; Manson, J.E.; Abrams, S.A.; Aloia, J.F.; Brannon, P.M.; Clinton, S.K.; Durazo-Arvizu, R.A.; Gallagher, J.C.; Gallo, R.L.; Jones, G.; et al. The 2011 report on dietary reference intakes for calcium and vitamin D from the Institute of Medicine: What clinicians need to know. J. Clin. Endocrinol. Metab. 2011, 96, 53–58. [Google Scholar] [CrossRef]
- Holick, M.F.; Binkley, N.C.; Bischoff-Ferrari, H.A.; Gordon, C.M.; Hanley, D.A.; Heaney, R.P.; Murad, M.H.; Weaver, C.M.; Endocrine Society. Evaluation, treatment, and prevention of vitamin D deficiency: An Endocrine Society clinical practice guideline. J. Clin. Endocrinol. Metab. 2011, 96, 1911–1930. [Google Scholar] [CrossRef] [PubMed]
- Jukic, A.M.Z.; Hoofnagle, A.N.; Lutsey, P.L. Measurement of Vitamin D for Epidemiologic and Clinical Research: Shining Light on a Complex Decision. Am. J. Epidemiol. 2018, 187, 879–890. [Google Scholar] [CrossRef]
- Niculescu, D.A.; Capatina, C.A.M.; Dusceac, R.; Caragheorgheopol, A.; Ghemigian, A.; Poiana, C. Seasonal variation of serum vitamin D levels in Romania. Arch. Osteoporos. 2017, 12, 113. [Google Scholar] [CrossRef]
- Zhang, Y.; Zhou, L.; Ren, Y.; Zhang, H.; Qiu, W.; Wang, H. Assessment of serum vitamin D levels in children aged 0-17 years old in a Chinese population: A comprehensive study. Sci. Rep. 2024, 14, 12562. [Google Scholar] [CrossRef]
- Mansbach, J.M.; Ginde, A.A.; Camargo, C.A., Jr. Serum 25-hydroxyvitamin D levels among US children aged 1 to 11 years: Do children need more vitamin D? Pediatrics 2009, 124, 1404–1410. [Google Scholar] [CrossRef] [PubMed]
- Van de Walle, L.; Vandenplas, Y.; Toelen, J.; Raaijmakers, A. Vitamin D Status in Belgian Children: A Regional Study. Nutrients 2024, 16, 657. [Google Scholar] [CrossRef]
- Giustina, A.; Bouillon, R.; Dawson-Hughes, B.; Ebeling, P.R.; Lazaretti-Castro, M.; Lips, P.; Marcocci, C.; Bilezikian, J.P. Vitamin D in the older population: A consensus statement. Endocrine 2023, 79, 31–44. [Google Scholar] [CrossRef] [PubMed]
- Raymond-Lezman, J.R.; Riskin, S.I. Benefits and Risks of Sun Exposure to Maintain Adequate Vitamin D Levels. Cureus 2023, 15, e38578. [Google Scholar] [CrossRef]
- Smith, T.J.; Tripkovic, L.; Lanham-New, S.A.; Hart, K.H. Vitamin D in adolescence: Evidence-based dietary requirements and implications for public health policy. Proc. Nutr. Soc. 2018, 77, 292–301. [Google Scholar] [CrossRef]
- Al-Ajlan, B.Y.; Freije, A.; Allehdan, S.; Perna, S. Prevalence and Risk Factors for Vitamin D Deficiency in Children and Adolescents in the Kingdom of Bahrain. Nutrients 2023, 15, 494. [Google Scholar] [CrossRef]
- Durá-Travé, T.; Gallinas-Victoriano, F.; Chueca-Guindulain, M.J.; Berrade-Zubiri, S. Prevalence of hypovitaminosis D and associated factors in obese Spanish children. Nutr. Diabetes 2017, 7, e248. [Google Scholar] [CrossRef] [PubMed]
- Fiamenghi, V.I.; Mello, E.D. Vitamin D deficiency in children and adolescents with obesity: A meta-analysis. J. Pediatr. 2021, 97, 273–279. [Google Scholar] [CrossRef]
- de Azevedo, F.R.; Caramelli, B. Hypovitaminosis D and Obesity—Coincidence or Consequence? Eur. Endocrinol. 2013, 9, 128–131. [Google Scholar] [CrossRef]
- Migliaccio, S.; Di Nisio, A.; Mele, C.; Scappaticcio, L.; Savastano, S.; Colao, A.; Obesity Programs of Nutrition, Education, Research and Assessment (OPERA) Group. Obesity and hypovitaminosis D: Causality or casualty? Int. J. Obes. Suppl. 2019, 9, 20–31. [Google Scholar] [CrossRef]
- Drincic, A.T.; Armas, L.A.; Van Diest, E.E.; Heaney, R.P. Volumetric dilution, rather than sequestration best explains the low vitamin D status of obesity. Obesity 2012, 20, 1444–1448. [Google Scholar] [CrossRef] [PubMed]
- Yanoff, L.B.; Parikh, S.J.; Spitalnik, A.; Denkinger, B.; Sebring, N.G.; Slaughter, P.; McHugh, T.; Remaley, A.T.; Yanovski, J.A. The prevalence of hypovitaminosis D and secondary hyperparathyroidism in obese Black Americans. Clin. Endocrinol. 2006, 64, 523–529. [Google Scholar] [CrossRef] [PubMed]
- Wamberg, L.; Christiansen, T.; Paulsen, S.K.; Fisker, S.; Rask, P.; Rejnmark, L.; Richelsen, B.; Pedersen, S.B. Expression of vitamin D-metabolizing enzymes in human adipose tissue—The effect of obesity and diet-induced weight loss. Int. J. Obes. 2013, 37, 651–657. [Google Scholar] [CrossRef] [PubMed]
- Zakharova, I.; Klimov, L.; Kuryaninova, V.; Nikitina, I.; Malyavskaya, S.; Dolbnya, S.; Kasyanova, A.; Atanesyan, R.; Stoyan, M.; Todieva, A.; et al. Vitamin D Insufficiency in Overweight and Obese Children and Adolescents. Front. Endocrinol. 2019, 10, 103. [Google Scholar] [CrossRef] [PubMed]
- Bennour, I.; Haroun, N.; Sicard, F.; Mounien, L.; Landrier, J.F. Vitamin D and Obesity/Adiposity—A Brief Overview of Recent Studies. Nutrients 2022, 14, 2049. [Google Scholar] [CrossRef]
- Giannini, S.; Giusti, A.; Minisola, S.; Napoli, N.; Passeri, G.; Rossini, M.; Sinigaglia, L. The Immunologic Profile of Vitamin D and Its Role in Different Immune-Mediated Diseases: An Expert Opinion. Nutrients 2022, 14, 473. [Google Scholar] [CrossRef]
- Álvarez-Mercado, A.I.; Mesa, M.D.; Gil, Á. Vitamin D: Role in chronic and acute diseases. Encycl. Hum. Nutr. 2023, 535, 544. [Google Scholar] [CrossRef]
- Weydert, J.A. Vitamin D in Children’s Health. Children 2014, 1, 208–226. [Google Scholar] [CrossRef]
- Bouillon, R.; Manousaki, D.; Rosen, C.; Trajanoska, K.; Rivadeneira, F.; Richards, J.B. The health effects of vitamin D supplementation: Evidence from human studies. Nat. Rev. Endocrinol. 2022, 18, 96–110. [Google Scholar] [CrossRef]
- Dominguez, L.J.; Farruggia, M.; Veronese, N.; Barbagallo, M. Vitamin D Sources, Metabolism, and Deficiency: Available Compounds and Guidelines for Its Treatment. Metabolites 2021, 11, 255. [Google Scholar] [CrossRef]
- Nagaria, T.D.; Shinde, R.K.; Shukla, S.; Acharya, S.; Acharya, N.; Jogdand, S.D. The Sunlight-Vitamin D Connection: Implications for Patient Outcomes in the Surgical Intensive Care Unit. Cureus 2023, 15, e46819. [Google Scholar] [CrossRef] [PubMed]
- Balachandar, R.; Pullakhandam, R.; Kulkarni, B.; Sachdev, H.S. Relative Efficacy of Vitamin D2 and Vitamin D3 in Improving Vitamin D Status: Systematic Review and Meta-Analysis. Nutrients 2021, 13, 3328. [Google Scholar] [CrossRef] [PubMed]
- Wagner, C.L.; Greer, F.R.; American Academy of Pediatrics Section on Breastfeeding; American Academy of Pediatrics Committee on Nutrition. Prevention of rickets and vitamin D deficiency in infants, children, and adolescents. Pediatrics 2008, 122, 1142–1152. [Google Scholar] [CrossRef] [PubMed]
- Irvine, J.; Ward, L.M. Preventing symptomatic vitamin D deficiency and rickets among Indigenous infants and children in Canada. Paediatr. Child Health 2022, 27, 127–128. [Google Scholar] [CrossRef] [PubMed]
- Heaney, R.P.; Davies, K.M.; Chen, T.C.; Holick, M.F.; Barger-Lux, M.J. Human serum 25 hydroxycholecalciferol response to extended oral dosing with cholecalciferol. Am. J. Clin. Nutr. 2003, 77, 204–210. [Google Scholar] [CrossRef]
- Gallo, S.; Comeau, K.; Vanstone, C.; Agellon, S.; Sharma, A.; Jones, G.; L’Abbé, M.; Khamessan, A.; Rodd, C.; Weiler, H. Effect of different dosages of oral vitamin D supplementation on vitamin D status in healthy, breastfed infants: A randomized trial. JAMA 2013, 309, 1785–1792. [Google Scholar] [CrossRef]
- Cannell, J.J.; Vieth, R.; Willett, W.; Zasloff, M.; Hathcock, J.N.; White, J.H.; Tanumihardjo, S.A.; Larson-Meyer, D.E.; Bischoff-Ferrari, H.A.; Lamberg-Allardt, C.J.; et al. Cod liver oil, vitamin A toxicity, frequent respiratory infections, and the vitamin D deficiency epidemic. Ann. Otol. Rhinol. Laryngol. 2008, 117, 864–870. [Google Scholar] [CrossRef]


| Groups | All | Males | Females | |||||
|---|---|---|---|---|---|---|---|---|
| n | Mean (ng/mL) (SD) | n | Mean (ng/mL) (SD) | n | Mean (ng/mL) (SD) | |||
| Age | ||||||||
| All ages (years old) | 744 * | 27.38 (18.39) | 348 | 27.85 (18.03) | 396 | 26.97 (18.70) | ||
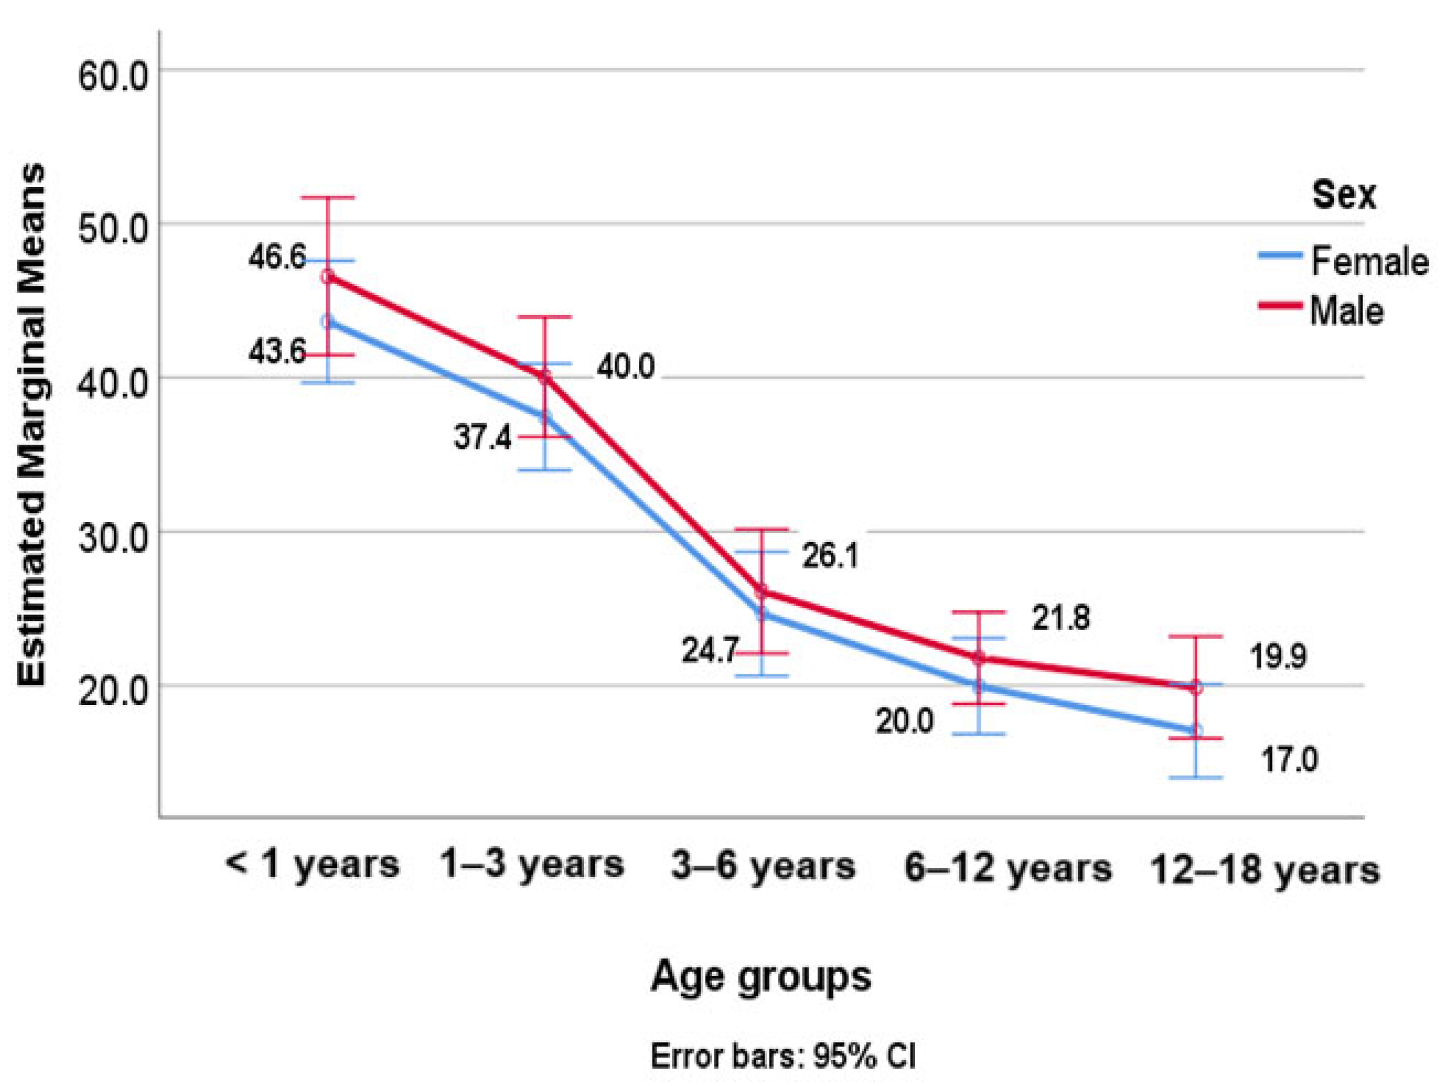
| <1 | 96 | 44.73 (23.55) | 36 | 46.58 (21.58) | 60 | 43.62 (24.77) | ||
| 1–3 | 141 | 38.59 (22.02) | 62 | 40.04 (21.92) | 79 | 37.45 (22.18) | ||
| 3–6 | 116 | 25.39 (13.43) | 58 | 26.12 (16.15) | 58 | 24.66 (10.10) | ||
| 6–12 | 203 | 20.91 (10.68) | 106 | 21.79 (10.94) | 97 | 19.96 (10.36) | ||
| 12–18 | 188 | 18.34 (9.21) | 86 | 19.88 (9.95) | 102 | 17.05 (8.36) | ||
| Season | ||||||||
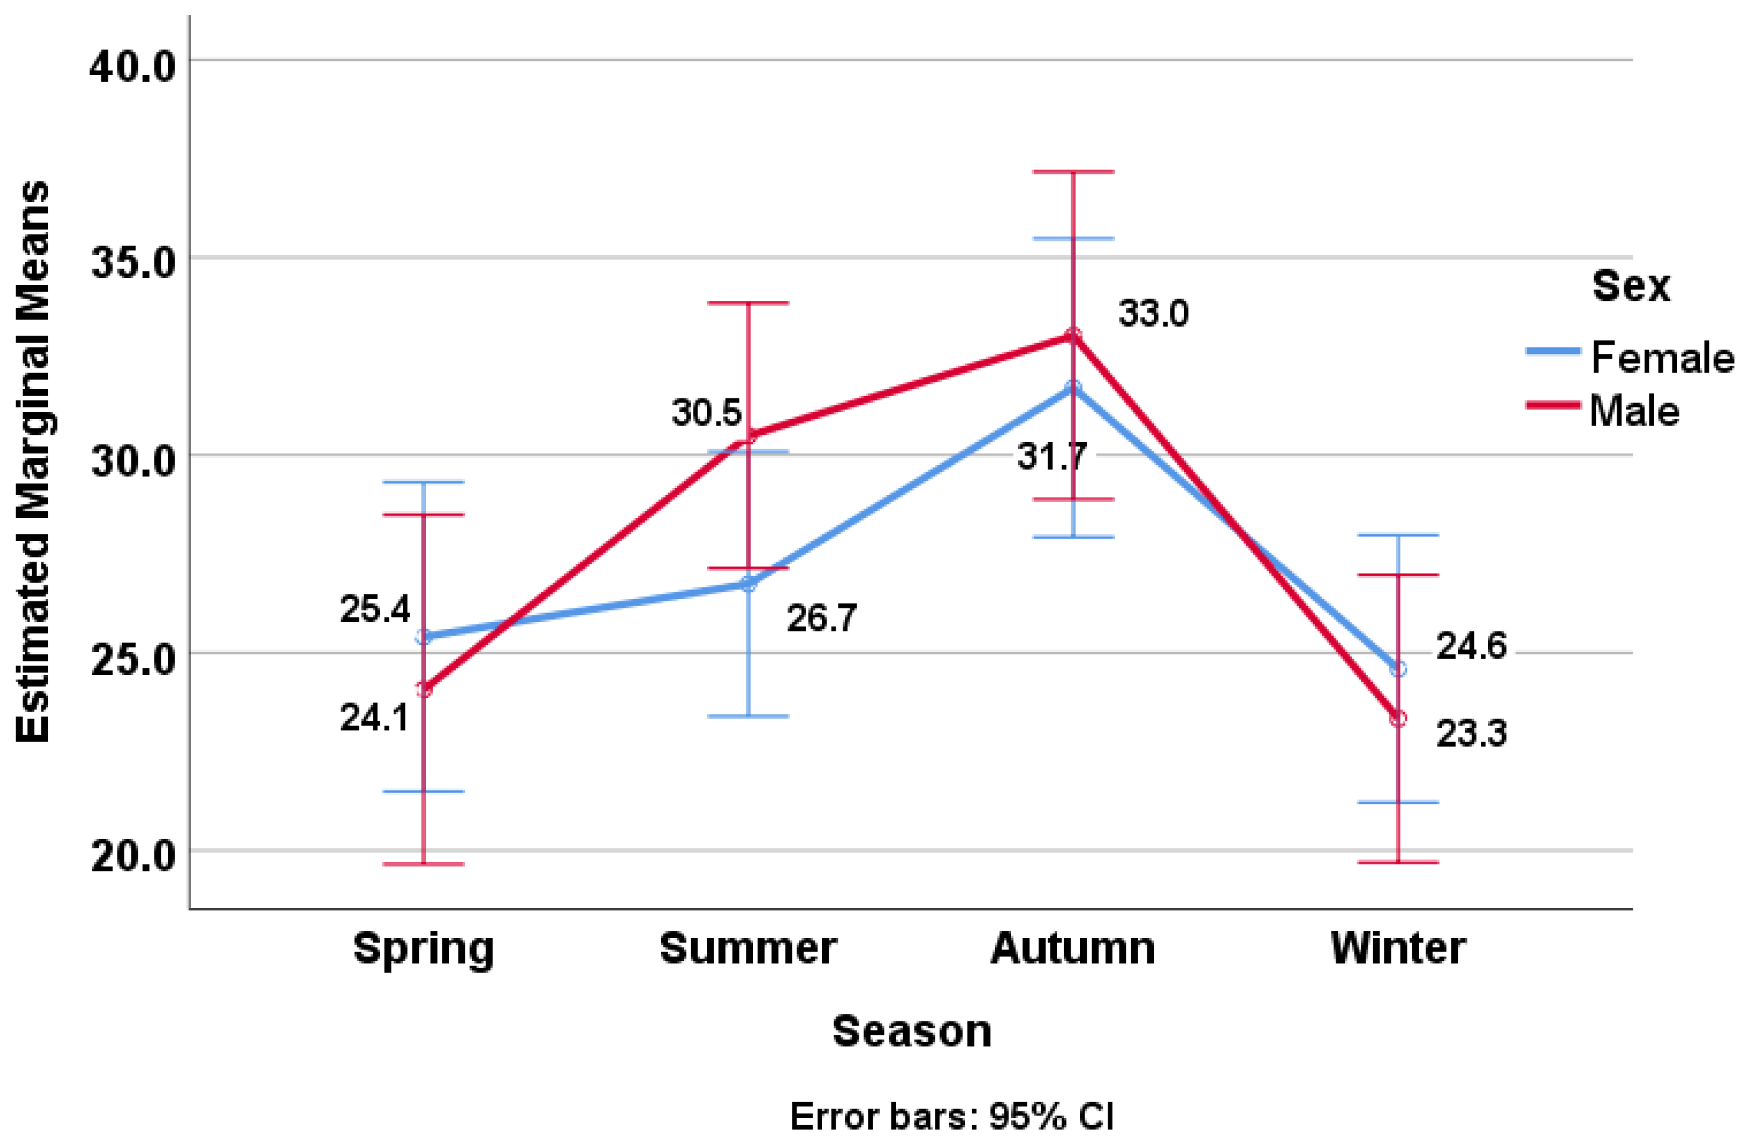
| Spring | 148 | 24.82 (18.18) | 65 | 24.07 (15.81) | 83 | 25.40 (19.91) | ||
| Summer | 226 | 28.62 (16.76) | 113 | 30.49 (17.52) | 113 | 26.74 (15.82) | ||
| Autumn | 163 | 32.30 (20.28) | 74 | 33.02 (21.89) | 89 | 31.70 (18.93) | ||
| Winter | 207 | 24.01 (17.79) | 96 | 23.33 (15.15) | 111 | 24.59 (19.84) | ||
| Weight | ||||||||
| Obese | 120 | 19.54 (11.24) | 65 | 21.64 (13.51) | 55 | 17.06 (7.11) | ||
| Normal weight | 624 | 28.89 (19.10) | 283 | 29.28 (18.65) | 341 | 28.57 (19.49) | ||
| Characteristics | Severe Deficiency n = 77 (%) | Deficiency n = 221 (%) | Insufficiency n = 194 (%) | Sufficiency n = 245 (%) | p-Value * | |
|---|---|---|---|---|---|---|
| Gender | Boy | 35 (10.14%) | 89 (25.79%) | 102 (29.56%) | 119 (34.49%) | 0.082 |
| Girl | 42 (10.71%) | 132 (33.67%) | 92 (23.46%) | 126 (32.14%) | ||
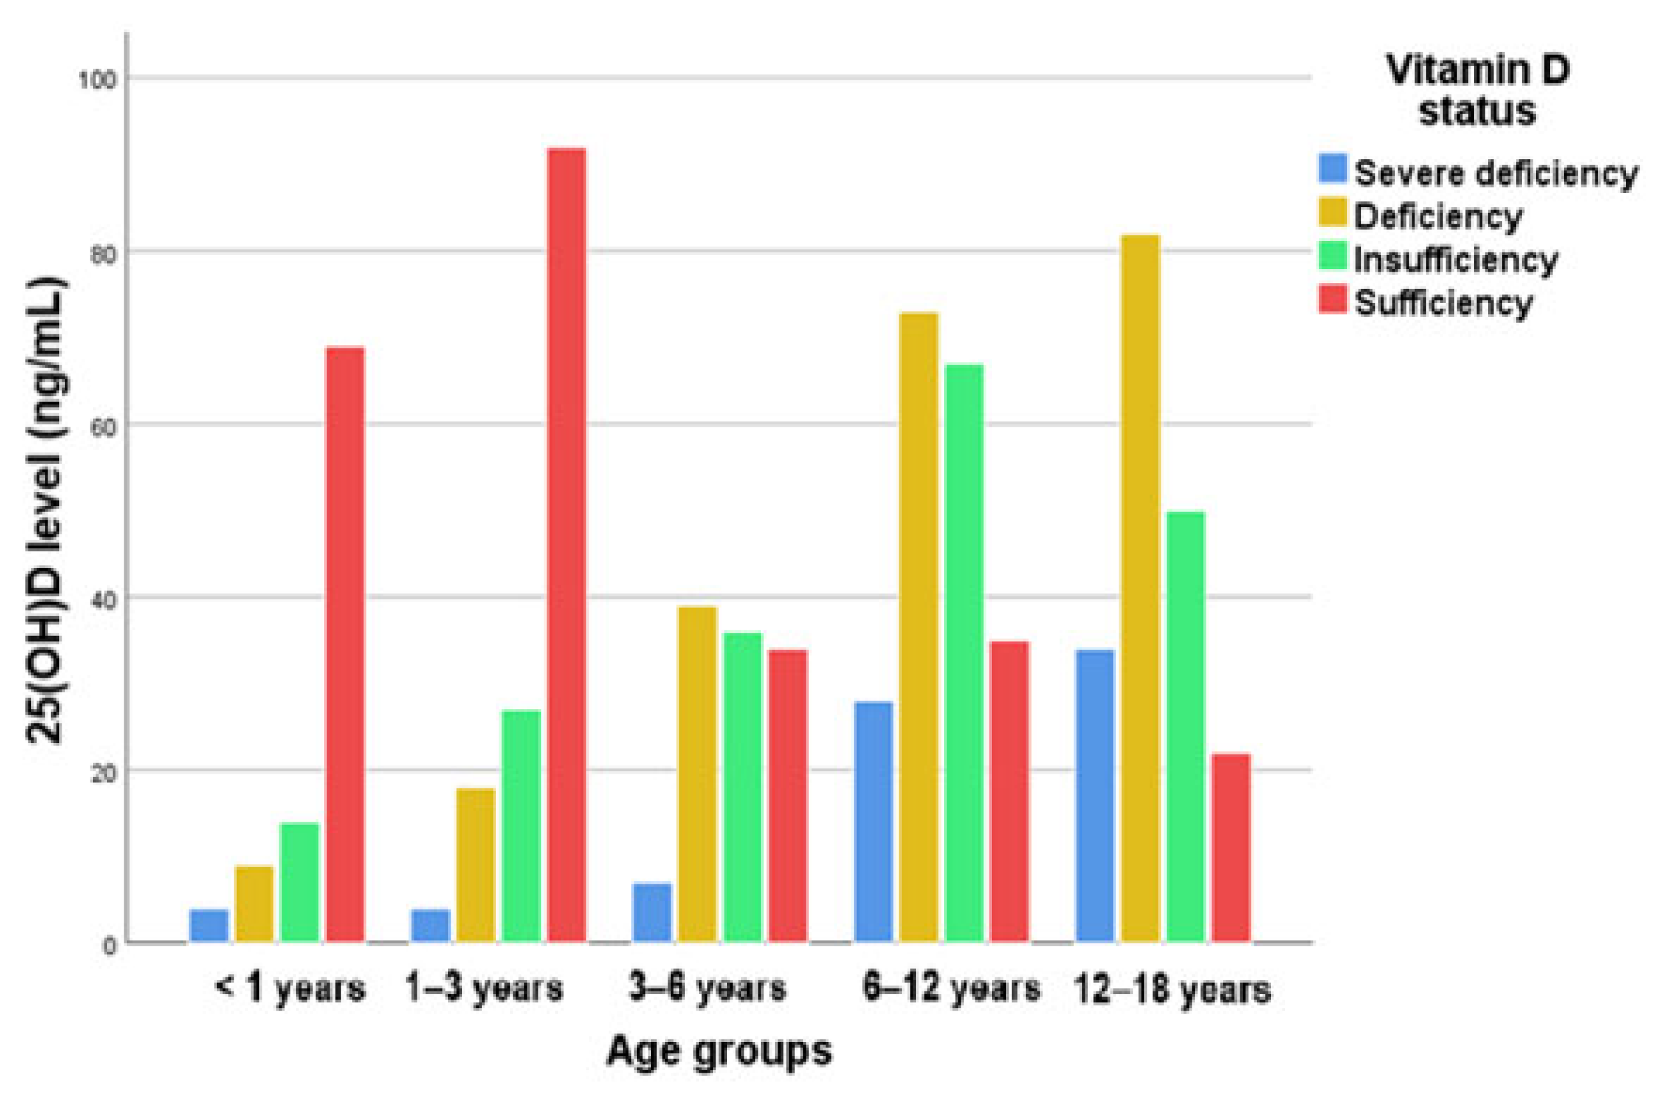
| Age (years old) | <1 | 4 (4.25%) | 9 (9.57%) | 14 (14.89%) | 67 (71.27%) | <0.001 |
| 1–3 | 4 (2.75%) | 19 (13.10%) | 30 (20.68%) | 92 (63.44%) | ||
| 3–6 | 7 (6.03%) | 39 (33.62%) | 38 (32.75%) | 32 (27.58%) | ||
| 6–12 | 27 (13.43%) | 72 (35.82%) | 66 (32.83%) | 36 (17.91%) | ||
| 12–18 | 35 (18.22%) | 84 (43.75%) | 51 (26.56%) | 22 (11.45%) | ||
| Season | Spring | 20 (13.51%) | 60 (40.54%) | 27 (18.24%) | 41 (27.7%) | <0.001 |
| Summer | 22 (9.77%) | 46 (20.44%) | 70 (31.11%) | 87 (38.66%) | ||
| Autumn | 9 (5.66%) | 34 (21.38%) | 48 (30.18%) | 68 (42.76%) | ||
| Winter | 26 (12.68%) | 81 (39.51%) | 49 (23.9%) | 49 (23.9%) | ||
| Nutritional status | Obese | 16 (13.33%) | 55 (45.33%) | 33 (27.5%) | 16 (13.33%) | <0.001 |
| Underweight | 19 (6.35%) | 67 (22.4%) | 83 (27.75%) | 130 (43.47%) | <0.001 | |
| Age Groups | Obesity | Mean | Std. Deviation | N |
|---|---|---|---|---|
| <1 year | No | 44.383 | 23.5553 | 92 |
| Yes | 52.725 | 25.4751 | 4 | |
| Total | 44.730 | 23.5541 | 96 | |
| 1–3 years | No | 38.559 | 22.0976 | 140 |
| Yes | 42.700 | - | 1 | |
| Total | 38.589 | 22.0213 | 141 | |
| 3–6 years | No | 25.772 | 13.6512 | 108 |
| Yes | 20.200 | 9.0850 | 8 | |
| Total | 25.388 | 13.4323 | 116 | |
| 6–12 years | No | 21.466 | 11.2017 | 146 |
| Yes | 19.495 | 9.1567 | 57 | |
| Total | 20.912 | 10.6819 | 203 | |
| 12–18 years | No | 19.063 | 9.8218 | 138 |
| Yes | 19.495 | 9.1567 | 57 | |
| Total | 18.344 | 9.2068 | 188 | |
| Total | No | 28.894 | 19.1015 | 624 |
| Yes | 19.536 | 11.2413 | 120 | |
| Total | 27.384 | 18.3858 | 744 |
| Age Groups | Severe Deficiency | Deficiency | Insufficiency | Sufficiency | Total | |
|---|---|---|---|---|---|---|
| <1 year | Number of children | 4 | 9 | 14 | 69 | 96 |
| Expected | 9.935 | 28.516 | 25.032 | 32.516 | 96 | |
| Standardized residuals | −2.131 | −4.671 | −2.748 | 8.431 | ||
| 1–3 years | Number of children | 4 | 18 | 27 | 92 | 141 |
| Expected | 14.593 | 41.883 | 36.766 | 47.758 | 141 | |
| Standardized residuals | −3.253 | −4.889 | −2.081 | 8.745 | ||
| 3–6 years | Number of children | 7 | 39 | 36 | 34 | 11 |
| Expected | 12.005 | 34.457 | 30.247 | 39.290 | 116 | |
| Standardized residuals | −1.661 | 1.005 | 1.324 | −1.130 | ||
| 6–12 years | Number of children | 28 | 73 | 67 | 35 | 203 |
| Expected | 21.009 | 60.300 | 52.933 | 68.758 | 203 | |
| Standardized residuals | 1.889 | 2.288 | 2.637 | −5.871 | ||
| 12–18 years | Number of children | 34 | 82 | 50 | 22 | 188 |
| Expected | 19.457 | 55.844 | 49.022 | 63.677 | 188 | |
| Standardized residuals | 4.028 | 4.829 | 0.188 | −7.430 |
Disclaimer/Publisher’s Note: The statements, opinions and data contained in all publications are solely those of the individual author(s) and contributor(s) and not of MDPI and/or the editor(s). MDPI and/or the editor(s) disclaim responsibility for any injury to people or property resulting from any ideas, methods, instructions or products referred to in the content. |
© 2024 by the authors. Licensee MDPI, Basel, Switzerland. This article is an open access article distributed under the terms and conditions of the Creative Commons Attribution (CC BY) license (https://creativecommons.org/licenses/by/4.0/).
Share and Cite
Ghiga, G.; Țarcă, E.; Țarcă, V.; Spoială, E.L.; Păduraru, G.; Gimiga, N.; Boca, L.O.; Iftinchi, O.; Donos, M.A.; Manole, L.M.; et al. Vitamin D Deficiency: Insights and Perspectives from a Five-Year Retrospective Analysis of Children from Northeastern Romania. Nutrients 2024, 16, 3808. https://doi.org/10.3390/nu16223808
Ghiga G, Țarcă E, Țarcă V, Spoială EL, Păduraru G, Gimiga N, Boca LO, Iftinchi O, Donos MA, Manole LM, et al. Vitamin D Deficiency: Insights and Perspectives from a Five-Year Retrospective Analysis of Children from Northeastern Romania. Nutrients. 2024; 16(22):3808. https://doi.org/10.3390/nu16223808
Chicago/Turabian StyleGhiga, Gabriela, Elena Țarcă, Viorel Țarcă, Elena Lia Spoială, Gabriela Păduraru, Nicoleta Gimiga, Laura Otilia Boca, Otilia Iftinchi, Mădălina Andreea Donos, Lorena Mihaela Manole, and et al. 2024. "Vitamin D Deficiency: Insights and Perspectives from a Five-Year Retrospective Analysis of Children from Northeastern Romania" Nutrients 16, no. 22: 3808. https://doi.org/10.3390/nu16223808
APA StyleGhiga, G., Țarcă, E., Țarcă, V., Spoială, E. L., Păduraru, G., Gimiga, N., Boca, L. O., Iftinchi, O., Donos, M. A., Manole, L. M., & Trandafir, L. M. (2024). Vitamin D Deficiency: Insights and Perspectives from a Five-Year Retrospective Analysis of Children from Northeastern Romania. Nutrients, 16(22), 3808. https://doi.org/10.3390/nu16223808