
Oral Antacid Use Is Negatively Associated with Serum Prealbumin Levels in Japanese Individuals Undergoing Health Checkups

 ,
, 

Abstract
1. Introduction
2. Materials and Methods
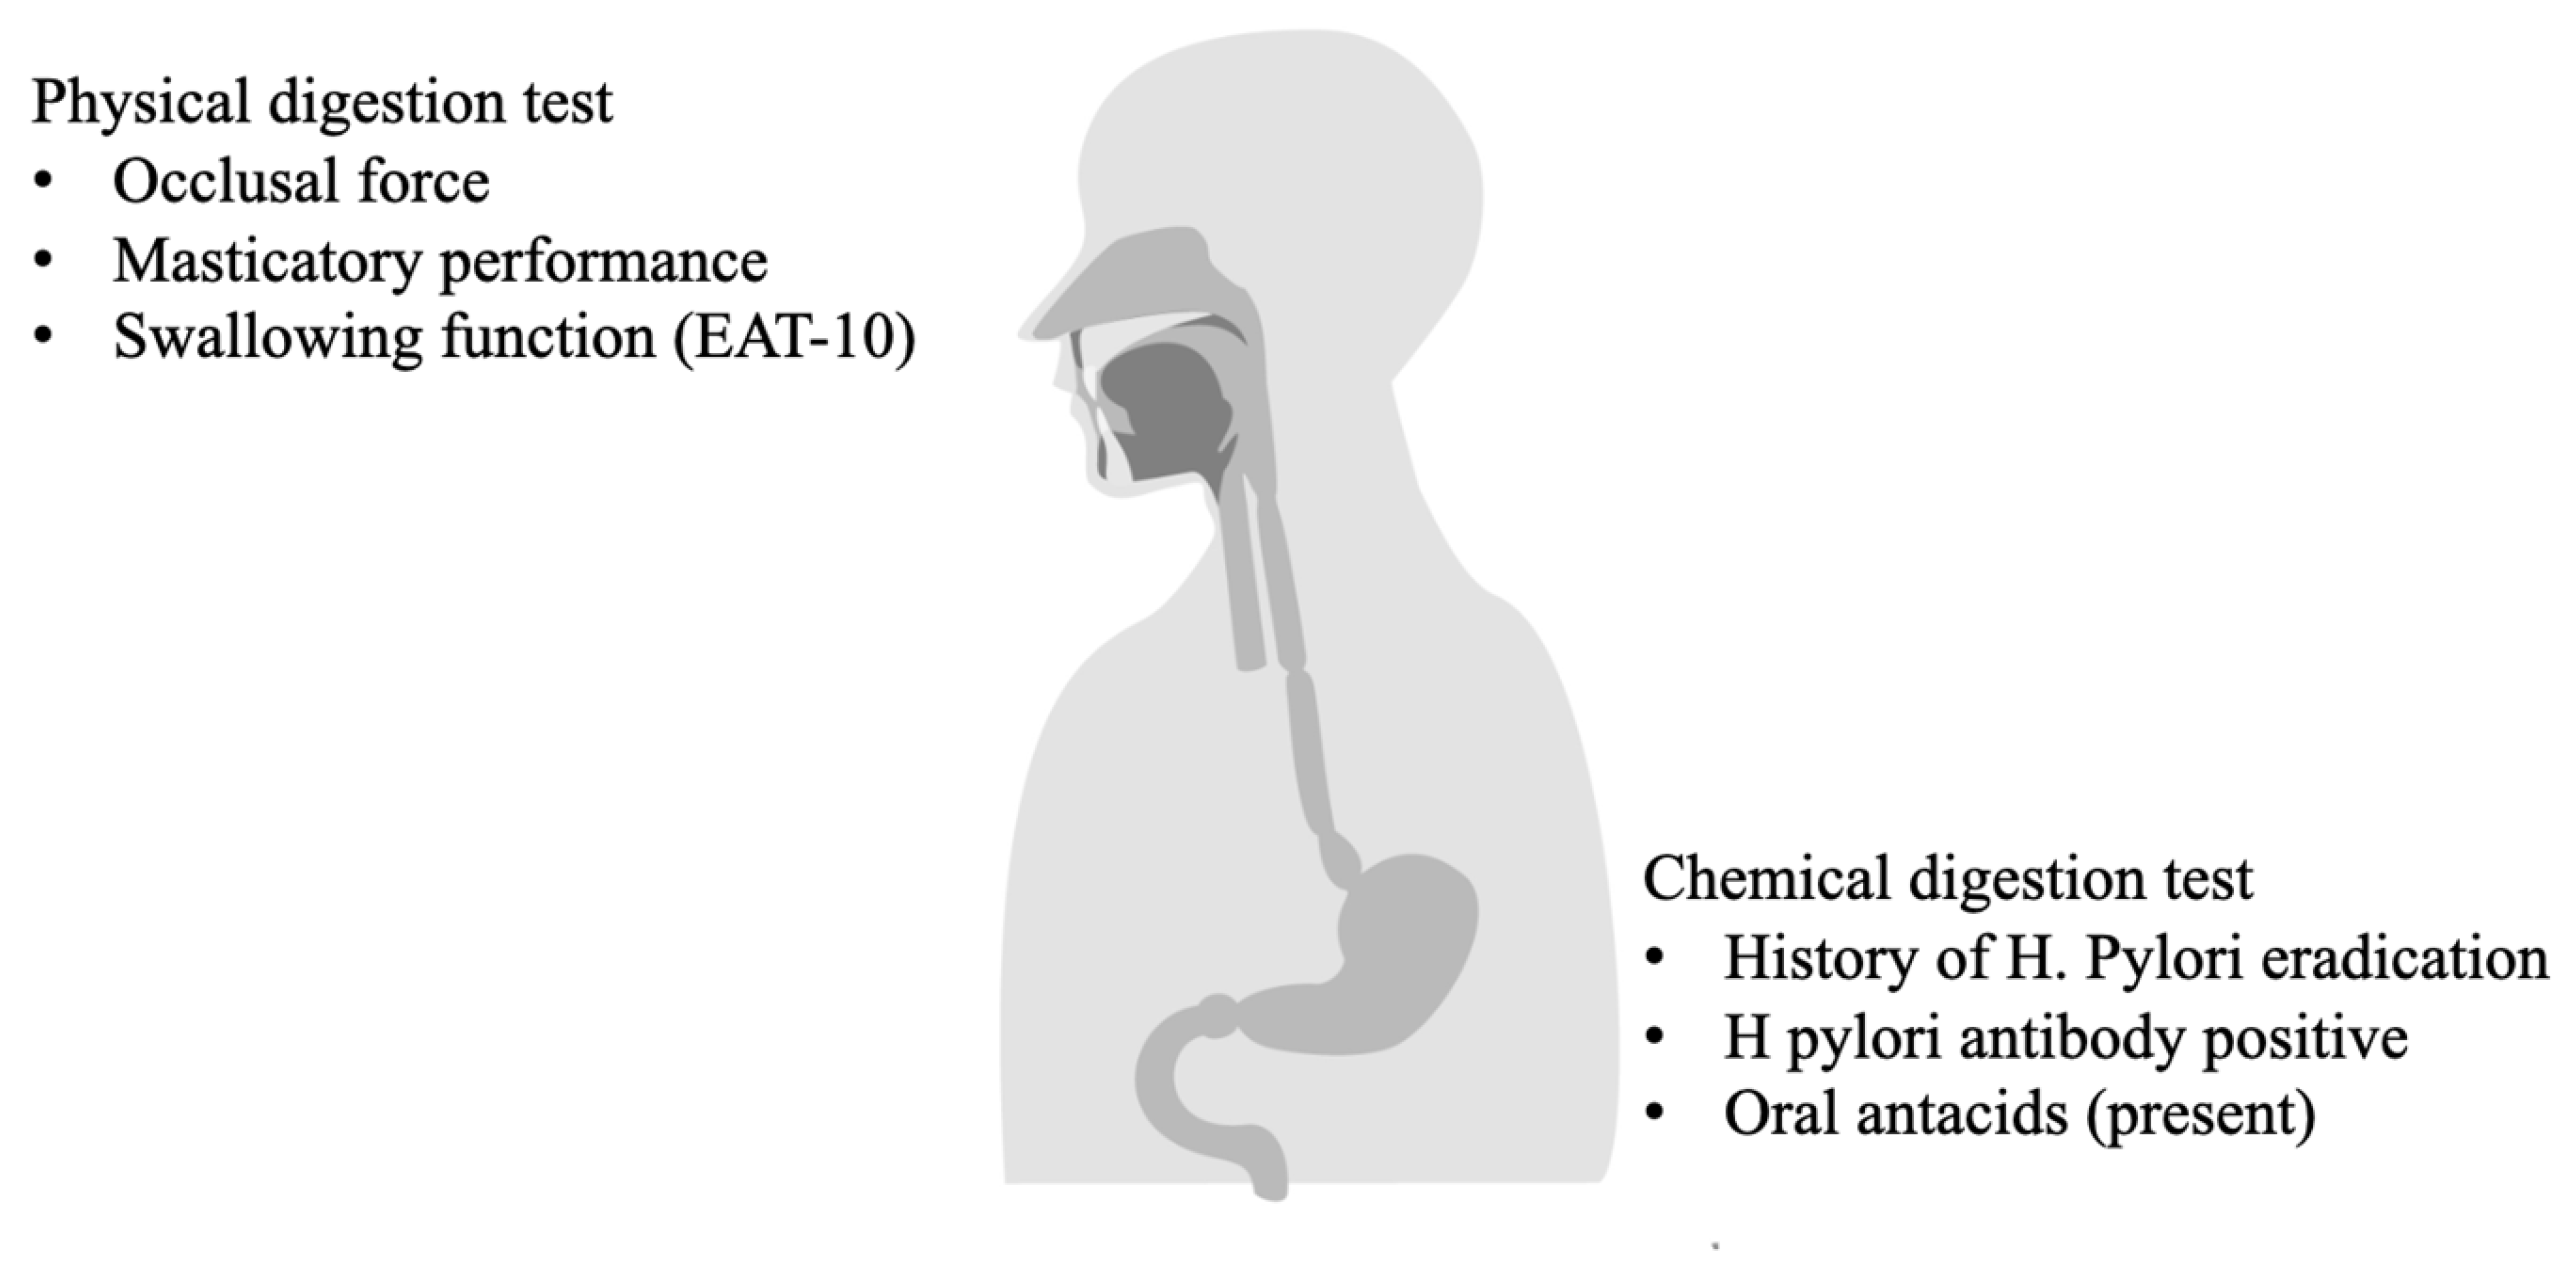
2.1. Study Design and Participants
2.2. Food Frequency Questionnaire on Food Groups
2.3. Physical Examination
2.4. Chewing and Swallowing Functions
2.4.1. Occlusal Force
2.4.2. Chewing Function
2.4.3. Swallowing Function (EAT-10)
2.4.4. History of HP Eradication, Positive Titers of HP Antibodies, and Use of Oral Antacids and Metformin
2.5. Statistical Analysis
3. Results
3.1. Background of the Study Sample
3.2. Food Intake and Nutritional Deficiency of the Subjects
3.3. Multivariate Linear Analysis: Physical Digestion
3.4. Multivariate Linear Analysis: Chemical Digestion
4. Discussion
5. Conclusions
Author Contributions
Funding
Institutional Review Board Statement
Informed Consent Statement
Data Availability Statement
Acknowledgments
Conflicts of Interest
References
- Available online: https://www.mhlw.go.jp/content/10900000/001296359.pdf (accessed on 11 September 2024).
- Nigatu, Y.D.; Gebreyesus, S.H.; Allard, J.P.; Endris, B.S. The effect of malnutrition at admission on length of hospital stay among adult patients in developing country: A prospective cohort study. Clin. Nutr. ESPEN 2020, 41, 217–224. [Google Scholar] [CrossRef] [PubMed]
- Saunders, J.; Smith, T. Malnutrition: Causes and consequences. Clin. Med. 2010, 10, 624–627. [Google Scholar] [CrossRef] [PubMed]
- Sabyasachi, C.; Mavani, A.; Bhatttacharyya, J. Chapter 1—Chemistry and mechanism of the diseases caused by digestive disorders. In Nutrition and Functional Foods in Boosting Digestion, Metabolism and Immune Health; Debasis, B., Sunny, E.O., Eds.; Academic Press: London, UK, 2022; pp. 3–14. [Google Scholar]
- Kikutani, T.; Yoshida, M.; Enoki, H.; Yamashita, Y.; Akifusa, S.; Shimazaki, Y.; Hirano, H.; Tamura, F. Relationship between nutrition status and dental occlusion in community-dwelling frail elderly people. Geriatr. Gerontol. Int. 2013, 13, 50–54. [Google Scholar] [CrossRef] [PubMed]
- Özsürekci, C.; Kara, M.; Güngör, A.E.; Ayçiçek, G.; Çalışkan, H.; Doğu, B.B.; Cankurtaran, M.; Halil, M.G. Relationship between chewing ability and malnutrition, sarcopenia, and frailty in older adults. Nutr. Clin. Pract. 2022, 37, 1409–1417. [Google Scholar] [CrossRef] [PubMed]
- Winter, T.A. The effects of undernutrition and refeeding on metabolism and digestive function. Curr. Opin. Clin. Nutr. Metab. Care 2006, 9, 596–602. [Google Scholar] [CrossRef] [PubMed]
- Keller, U. Nutritional Laboratory Markers in Malnutrition. J. Clin. Med. 2019, 8, 775. [Google Scholar] [CrossRef] [PubMed]
- Jiang, Y.; Yang, Z.; Wu, Q.; Cao, J.; Qiu, T. The association between albumin and C-reactive protein in older adults. Medicine 2023, 102, e34726. [Google Scholar] [CrossRef] [PubMed]
- Al Amin, A.S.M.; Gupta, V. Vitamin B12 (Cobalamin); StatPearls Publishing: Treasure Island, FL, USA, 2024. Available online: https://www.ncbi.nlm.nih.gov/books/NBK559132/ (accessed on 11 September 2024).
- Ankar, A.; Kumar, A. Vitamin B12 Deficiency; StatPearls Publishing: Treasure Island, FL, USA, 2024. Available online: https://www.ncbi.nlm.nih.gov/books/NBK441923/ (accessed on 11 September 2024).
- Stover, P.J. Physiology of folate and vitamin B12 in health and disease. Nutr. Rev. 2004, 62 Pt 2, S3–S12; discussion S13. [Google Scholar] [CrossRef] [PubMed]
- Atiq, A.; Shah, D.; Sharma, S.; Meena, R.K.; Kapoor, S.; Gupta, P. Prevalence and Predictors of Vitamin B12 Deficiency in Children with Severe Acute Malnutrition, and its Association with Development. Indian J. Pediatr. 2023, 16, 1–7. [Google Scholar] [CrossRef] [PubMed]
- Takahashi, K. Food Frequency Questionnaire Based on Food Groups for Estimating Individual Nutrient Intake. Jpn. J. Nutr. Diet. 2003, 61, 161–169. [Google Scholar] [CrossRef]
- Maruyama, S.; Morita, I.; Nakagaki, H. Survey on the food intake in community-dwelling elderly women. J. Integr. Study Diet. Habits 2007, 17, 348. [Google Scholar] [CrossRef]
- Su, J.-N.; Pan, Y.-H.; Dorj, O.; Lin, J.C.-Y.; Salamanca, E.; Chen, I.-W.; Wu, Y.-F.; Chang, W.-J. Association between oral health status and occlusal bite force in young adults. J. Dent. Sci. 2024, 19, 1182–1189. [Google Scholar] [CrossRef] [PubMed]
- Aiyar, A.; Shimada, A.; Svensson, P. Assessment of masticatory efficiency based on glucose concentration in orthodontic patients: A methodological study. J. Oral Rehabil. 2022, 49, 954–960. [Google Scholar] [CrossRef] [PubMed]
- Inomata, C.; Ikebe, K.; Kagawa, R.; Okubo, H.; Sasaki, S.; Okada, T.; Takeshita, H.; Tada, S.; Matsuda, K.-I.; Kurushima, Y.; et al. Significance of occlusal force for dietary fibre and vitamin intakes in independently living 70-year-old Japanese: From SONIC Study. J. Dent. 2014, 42, 556–564. [Google Scholar] [CrossRef] [PubMed]
- Ahmed, A.; Clarke, J.O. Proton Pump Inhibitors (PPI); StatPearls Publishing: Treasure Island, FL, USA, 2024. Available online: https://www.ncbi.nlm.nih.gov/books/NBK557385/ (accessed on 11 September 2024).
- Lam, J.R.; Schneider, J.L.; Zhao, W.; Corley, D.A. Proton pump inhibitor and histamine 2 receptor antagonist use and vitamin B12 deficiency. JAMA 2013, 310, 2435–2442. [Google Scholar] [CrossRef] [PubMed]
- Lombardo, M.; Amoah, I.; Feraco, A.; Guseva, E.; Gorini, S.; Camajani, E.; Armani, A.; Padua, E.; Caprio, M. Gender Differences in Taste and Food Habits: Implications for Personalized Nutrition. Biol. Life Sci. Forum 2023, 29, 1. [Google Scholar] [CrossRef]
- Iizuka, K.; Yanagi, K.; Deguchi, K.; Ushiroda, C.; Yamamoto-Wada, R.; Kobae, K.; Yamada, Y.; Naruse, H. Sex and Age Differences in the Effects of Food Frequency on Metabolic Parameters in Japanese Adults. Nutrients 2024, 16, 2931. [Google Scholar] [CrossRef] [PubMed]
- Iizuka, K.; Sato, H.; Kobae, K.; Yanagi, K.; Yamada, Y.; Ushiroda, C.; Hirano, K.; Ichimaru, S.; Seino, Y.; Ito, A.; et al. Young Japanese Underweight Women with “Cinderella Weight” Are Prone to Malnutrition, including Vitamin Deficiencies. Nutrients 2023, 15, 2216. [Google Scholar] [CrossRef] [PubMed]
- Cabrerizo, S.; Cuadras, D.; Gomez-Busto, F.; Artaza-Artabe, I.; Marín-Ciancas, F.; Malafarina, V. Serum albumin and health in older people: Review and meta analysis. Maturitas 2015, 81, 17–27. [Google Scholar] [CrossRef] [PubMed]

| Total (n = 92) | |
|---|---|
| Sex (%Male) | 72% (n = 67) |
| Age (yo) | 62.2 (14.3) |
| Age (≧65 yo) | 48% (n = 44) |
| BMI | 23.9 (3.2) |
| Under weight (<18.5) | 4% (n = 4) |
| Normal weight | 61% (n = 56) |
| Obese weight (≧25) | 35% (n = 32) |
| Occlusal force (N) | 993.6 (533.7) |
| Lower Occlusal force (<500 N) | 19.4% (n = 18) |
| Masticatory performance (mg/dL) | 200.9 (64.5) |
| Lower masticatory performance (<100 mg/dL) | 3.2% (n = 3) |
| Swallowing function (EAT-10) | 0.17 (1.17) |
| EAT-10 ≧ 3 | 3.2% (n = 3) |
| History of H. pylori eradication | 24% (n = 22) |
| H pylori antibody positive (≧10 U/mL) | 23% (n = 21) |
| Oral antacids (present) | 16% (n = 15) |
| Metformin (present) | 7.6% (n = 7) |
| Total cholesterol (mg/dL) | 205.5 (34.1) |
| HDL cholesterol (mg/dL) | 56.8 (17.5) |
| Triglyceride (mg/dL) | 127.4 (81.5) |
| HbA1c (%) | 5.94 (0.74) |
| eGFR (mL/min/1.73 m2) | 71.3 (18.1) |
| CRP (mg/dL) | 0.2 (0.72) |
| CRP ≧ 1.0 mg/dL | 4% (n = 4) |
| TSH (μIU/mL) | 1.89 ± 1.36 |
| FT4 (ng/dL) | 1.35 ± 0.27 |
| FT3 (pg/mL) | 3.18 ± 0.43 |
| Total (n = 92) | |
|---|---|
| Energy intake (kcal) | 1776.4 (346.8) |
| Fat intake (g) | 61.8 (15.8) |
| Carbohydrate intake (g) | 202.4 (51.3) |
| Protein intake (g) | 66.9 (15.3) |
| Albumin (g/dL) | 4.28 (0.29) |
| Lower albumin (<4 g/dL) | 14% (n = 13) |
| Serum prealbumin (mg/dL) | 28.9 (5.7) |
| Lower prealbumin (<22 mg/dL) | 11% (n = 10) |
| Vitamin B12 intake (μg) | 6.3 (3.0) |
| Lower vitamin B12 intake (<2.4 μg) | 5.4% (n = 5) |
| serum vitamin B12 (pg/mL) | 333.2 (139.1) |
| Vitamin B12 deficiency | 14% (n = 13) |
| Dependent Variable: | Prealbumin | |||||
|---|---|---|---|---|---|---|
| Model 1 | Model 2 | Model 3 | ||||
| β (95%CI) | p | β (95%CI) | p | β (95%CI) | p | |
| Occlusal force (N) | 0 (−0.002, 0.002) | 0.88 | ||||
| Masticatory performance (mg/dL) | 0.01 (−0.01, 0.03) | 0.15 | ||||
| EAT-10 | 0.17 (−0.76, 1.11) | 0.72 | ||||
| Protein intake (g) | 0.10 (0.02, 0.17) | 0.01 | 0.10 (0.03, 0.17) | 0.007 | 0.10 (0.03, 0.17) | 0.008 |
| Sex (female) | −4.01 (−6.61, −1.41) | 0.003 | −3.91 (−6.48, −1.34) | 0.003 | −4.00 (−6.59, −1.40) | 0.003 |
| Age (yo) | −0.04 (−0.12, 0.04) | 0.29 | −0.036 (−0.11, 0.04) | 0.35 | −0.04 (−0.12, 0.03) | 0.26 |
| BMI | −0.05 (−0.39, 0.29) | 0.77 | −0.10 (−0.44, 0.25) | 0.57 | −0.06 (−0.40, 0.29) | 0.74 |
| CRP (mg/dL) | −1.75 (−3.26, −0.24) | 0.02 | −1.68 (−3.17, −0.19) | 0.03 | −1.77 (−3.23, −0.26) | 0.02 |
| Dependent Variable: | Albumin | |||||
| Model 1 | Model 2 | Model 3 | ||||
| β (95%CI) | p | β (95%CI) | p | β (95%CI) | p | |
| Occlusal force (N) | −0.00003 (0, 0) | 0.56 | ||||
| Masticatory performance (mg/dL) | −0.001 (−0.002, 0) | 0.02 | ||||
| EAT-10 | 0.02 (−0.03, 0.07) | 0.45 | ||||
| Protein intake (g) | 0 (−0.005, 0.004) | 0.81 | −0.001 (−0.005, 0.003) | 0.67 | −0.001 (−0.005, 0.004) | 0.81 |
| Sex (female) | 0.10 (−0.04, 0.25) | 0.16 | 0.10 (−0.05, 0.24) | 0.18 | 0.11 (−0.04, 0.25) | 0.15 |
| Age (yo) | 0.001 (−0.004, 0.005) | 0.73 | 0 (−0.004, 0.005) | 0.89 | 0.001 (−0.004, 0.005) | 0.76 |
| BMI | −0.00006 (−0.02, 0.02) | 0.99 | 0.004 (−0.02, 0.02) | 0.69 | −0.002 (−0.021, 0.017) | 0.84 |
| CRP (mg/dL) | −0.11 (−0.20, −0.03) | 0.01 | −0.12 (−0.20, −0.04) | 0.006 | −0.11 (−0.20, −0.03) | 0.01 |
| Dependent Variable: | Vitamin B12 | |||||
| Model 1 | Model 2 | Model 3 | ||||
| β (95%CI) | p | β (95%CI) | p | β (95%CI) | p | |
| Occlusal force (N) | −0.02 (−0.07, 0.03) | 0.5 | ||||
| Masticatory performance | −0.02 (−0.42, 0.39) | 0.92 | ||||
| EAT-10 | −1.5 (−23.8, 20.7) | 0.9 | ||||
| Vitamin B12 intake (μg) | 12.3 (3.4, 21.2) | 0.007 | 12.7 (3.9, 21.5) | 0.005 | 12.6 (3.8, 21.5) | 0.006 |
| Sex (female) | 86.2 (25.8, 146.5) | 0.006 | 87.4 (27.0, 147.9) | 0.005 | 87.5 (27.1, 147.9) | 0.005 |
| Age (yo) | 3.2 (1.4, 5.1) | <0.001 | 3.3 (1.4, 5.2) | <0.001 | 3.3 (1.4, 5.2) | <0.001 |
| BMI | −2.0 (−10.1, 6.2) | 0.63 | −2.1 (−10.5, 6.2) | 0.61 | −2.1 (−10.4, 6.1) | 0.61 |
| CRP (mg/dL) | 10.9 (−24.6, 46.4) | 0.54 | 11.9 (−23.7, 47.6) | 0.51 | 12.1 (−23.4, 47.6) | 0.5 |
| Dependent Variable: | Prealbumin | |||||
|---|---|---|---|---|---|---|
| Model 1 | Model 2 | Model 3 | ||||
| β (95%CI) | p | β (95%CI) | p | β (95%CI) | p | |
| Pylori eradication | 2.0 (−0.5, 4.5) | 0.12 | ||||
| H. pylori Ab | −0.12 (−0.13, 0.08) | 0.65 | ||||
| Oral antacids | −3.3 (−6.5, −0.1) | 0.04 | ||||
| Protein Intake (g) | 0.1 (0.03, 0.2) | 0.006 | 0.1 (0.02, 0.2) | 0.01 | 0.10 (0.03, 0.17) | 0.007 |
| Sex (female) | −4.0 (−6.5, −1.4) | 0.003 | −4.0 (−6.6, −1.4) | 0.003 | −4.1 (−6.6, −1.5) | 0.002 |
| Age (yo) | −0.05 (−0.12, 0.03) | 0.24 | −0.04 (−0.1, 0.04) | 0.28 | −0.01 (−0.09, 0.07) | 0.8 |
| BMI (kg/m2) | −0.1 (−0.40, 0.24) | 0.56 | −0.04 (−0.4, 0.3) | 0.82 | −0.01 (−0.34, 0.33) | 0.97 |
| CRP (mg/dL) | −1.6 (−3.1, −0.1) | 0.034 | −1.8 (−3.3, −0.3) | 0.02 | −1.4 (−2.9, 0.1) | 0.06 |
| Dependent Variable: | Albumin | |||||
| Model 1 | Model 2 | Model 3 | ||||
| β (95%CI) | p | β (95%CI) | p | β (95%CI) | p | |
| Pylori eradication | −0.007 (−0.15, 0.14) | 0.93 | ||||
| H. pylori Ab (+) | 0.002 (−0.004, 0.0089) | 0.55 | ||||
| Oral antacids | −0.14 (−0.32, 0.04) | 0.13 | ||||
| Protein Intake (g) | −0.001 (−0.005, 0.003) | 0.74 | −0.001 (−0.005, 0.004) | 0.8 | −0.001 (−0.005, 0.003) | 0.74 |
| Sex (female) | 0.11 (−0.04, 0.25) | 0.16 | 0.11 (−0.04, 0.25) | 0.16 | 0.10 (−0.04, 0.25) | 0.16 |
| Age (yo) | 0.001 (−0.003, 0.005) | 0.68 | 0.001 (−0.003, 0.005) | 0.7 | 0.002 (−0.002, 0.007) | 0.34 |
| BMI (kg/m2) | −0.001 (−0.02, 0.02) | 0.95 | −0.001 (−0.021, 0.018) | 0.88 | 0.001 (−0.02, 0.02) | 0.93 |
| CRP (mg/dL) | −0.11 (−0.20, −0.03) | 0.01 | −0.11 (−0.19, −0.02) | 0.01 | −0.10 (−0.18, −0.01) | 0.03 |
| Dependent Variable: | Vitamin B12 | |||||
| Model 1 | Model 2 | Model 3 | ||||
| β (95%CI) | p | β (95%CI) | p | β (95%CI) | p | |
| Pylori eradication | −48.3 (−107.8, 11.2) | 0.11 | ||||
| H. pylori Ab (+) | −1.2 (−3.6,1.2) | 0.33 | ||||
| Oral antacids | 22.6 (−54.4, 99.6) | 0.56 | ||||
| Vitamin B12 intake (μg) | 12.7 (4.0, 21.3) | 0.005 | 12.2 (3.4,21.0) | 0.007 | 12.8 (4.0, 21.6) | 0.005 |
| Sex (female) | 87.8 (28.3, 147.3) | 0.004 | 87.7 (27.7,147.8) | 0.005 | 88.0 (27.8, 148.3) | 0.005 |
| Age (yo) | 3.4 (1.5, 5.2) | <0.001 | 3.3 (1.5, 5.2) | <0.001 | 3.1 (1.0, 5.1) | 0.003 |
| BMI (kg/m2) | −0.8 (−9.0, 7.4) | 0.84 | −1.8 (−9.9,6.3) | 0.66 | −2.5 (−10.7, 5.7) | 0.55 |
| CRP (mg/dL) | 9.0 (−26.1, 44.2) | 0.61 | 10.8 (−24.6,46.1) | 0.55 | 9.7 (−26.5, 45.9) | 0.6 |
Disclaimer/Publisher’s Note: The statements, opinions and data contained in all publications are solely those of the individual author(s) and contributor(s) and not of MDPI and/or the editor(s). MDPI and/or the editor(s) disclaim responsibility for any injury to people or property resulting from any ideas, methods, instructions or products referred to in the content. |
© 2024 by the authors. Licensee MDPI, Basel, Switzerland. This article is an open access article distributed under the terms and conditions of the Creative Commons Attribution (CC BY) license (https://creativecommons.org/licenses/by/4.0/).
Share and Cite
Ushiroda, C.; Deguchi, K.; Yamamoto-Wada, R.; Tanaka, H.; Ono, C.; Yoshida, M.; Sarai, M.; Miyahara, R.; Sasaki, H.; Iizuka, K. Oral Antacid Use Is Negatively Associated with Serum Prealbumin Levels in Japanese Individuals Undergoing Health Checkups. Nutrients 2024, 16, 3715. https://doi.org/10.3390/nu16213715
Ushiroda C, Deguchi K, Yamamoto-Wada R, Tanaka H, Ono C, Yoshida M, Sarai M, Miyahara R, Sasaki H, Iizuka K. Oral Antacid Use Is Negatively Associated with Serum Prealbumin Levels in Japanese Individuals Undergoing Health Checkups. Nutrients. 2024; 16(21):3715. https://doi.org/10.3390/nu16213715
Chicago/Turabian StyleUshiroda, Chihiro, Kanako Deguchi, Risako Yamamoto-Wada, Hiroko Tanaka, Chisato Ono, Mitsuyoshi Yoshida, Masayoshi Sarai, Ryoji Miyahara, Hitomi Sasaki, and Katsumi Iizuka. 2024. "Oral Antacid Use Is Negatively Associated with Serum Prealbumin Levels in Japanese Individuals Undergoing Health Checkups" Nutrients 16, no. 21: 3715. https://doi.org/10.3390/nu16213715
APA StyleUshiroda, C., Deguchi, K., Yamamoto-Wada, R., Tanaka, H., Ono, C., Yoshida, M., Sarai, M., Miyahara, R., Sasaki, H., & Iizuka, K. (2024). Oral Antacid Use Is Negatively Associated with Serum Prealbumin Levels in Japanese Individuals Undergoing Health Checkups. Nutrients, 16(21), 3715. https://doi.org/10.3390/nu16213715