Article

Self-Initiated Dietary Adjustments Alter Microbiota Abundances: Implications for Perceived Health

by
Anouk Willems
1,2,†,
Martina Sura-de Jong
1,†,
Eline Klaassens
3,
Bartholomeus van den Bogert
3,4,
André van Beek
5 and
Gertjan van Dijk
2,*
1
Applied Research Centre Food & Dairy, Van Hall Larenstein University of Applied Sciences, 8934 CJ Leeuwarden, The Netherlands
2
Groningen Institute for Evolutionary Life Sciences—Neurobiology, University of Groningen, 9474 AG Groningen, The Netherlands
3
Product Development Department, BaseClear B.V., 2333 BE Leiden, The Netherlands
4
MyMicroZoo, 2333 BE Leiden, The Netherlands
5
Department of Endocrinology, University Medical Center Groningen, Postbus 30001, 9700 RB Groningen, The Netherlands
*
Author to whom correspondence should be addressed.
These authors contributed equally to this work.
Nutrients 2024, 16(20), 3544; https://doi.org/10.3390/nu16203544
Submission received: 28 August 2024 / Revised: 1 October 2024 / Accepted: 10 October 2024 / Published: 18 October 2024
(This article belongs to the Section Prebiotics and Probiotics)

Abstract

:
Background/Objectives: Personalized and self-initiated dietary adjustments have been shown to alleviate mental and somatic complaints. Here, we investigated the potential role of gut microbiome alterations underlying these effects. Methods: For this purpose, participants (n = 185) underwent a four-week self-initiated dietary intervention and filled out weekly questionnaires on their dietary intake, somatic and mental symptoms, and physical activity. Results: Overall, the participants lost weight, had alleviated mental and somatic complaints, reduced their total caloric and percentual carbohydrate intake, and ate less processed, party-type, and traditional Dutch food items, but ate more Pescatarian type food items, while keeping their fiber intake unaltered. Baseline and endpoint gut microbiota analyses using 16S rRNA gene sequencing revealed an overall increase in Gemmiger formicilis and reductions in Peptostreptococcaceae and Ruminococcus bromii over the four-week dietary intervention. While these bacterial alterations were considered to be beneficial for the host, they were not individually correlated with alterations in, or endpoint levels of, somatic and/or mental complaints. Instead, individual increases in Ruminococcus bicirculans (a well-known utilizer of plant cell wall polysaccharides) were strongly correlated with reductions in mental complaints, even though overall R. bicirculans remained unaltered over the course of the four-week self-initiated dierary intervention. Conclusions: Our results suggest that overall altered versus individually correlated microbiota abundances and their relations with host health characteristics over the course of a self-chosen dietary intervention may represent different levels of regulation, which remain to be further untangled.

1. Introduction

The relation between the gut microbiota and the host has become a field of intense research. Interactions between the microbiota and the host are manifold, and compositional shifts in pathogenic and health-promoting commensal microbes have been implicated in a multitude of metabolic and non-communicable diseases (NCDs) [1,2,3,4]. As for specific microbes, several taxonomic markers have also been proposed to be related to health. For instance, an increased Firmicutes to Bacteroidetes ratio, which are the most prominent phyla in the gut, is often related to the incidence of obesity [5], although this relation has also been debated [6,7]. The Shannon diversity index, a frequently used measure of alpha diversity, has been found to be positively correlated with human health in epidemiological studies, and has also been shown to be reduced in individuals with obesity [8]. Methods that influence the gut microbiota composition may be a useful avenue for the treatment and prevention of these diseases [9]. Indeed, the gut microbiota composition has been recognized as a predictive biomarker for the success of body weight loss, which is an important risk factor for the development of NCDs [10]. As such, the manipulation of dietary intake has been suggested as one of the greatest and rapid modulators of the gut microbiota composition [11,12,13]. Although the consequences of various dietary patterns on human health are well known [14,15], there appear, however, large differences in how individuals respond to various diets [12,16]. Likewise, the composition of each individual’s gut microbiota appears to be quite unique too [17,18], and dietary intervention studies often show very heterogeneous and complex patterns of microbiota changes on a group level [19]. This calls for studies taking into account the individual differences in dietary intake at baseline and during and after interventions, and the correlated changes in markers for NCD risk, as well as correlated changes in the gut microbiota composition.
We have recently reported that a freely chosen and self-initiated dietary intervention leading to a spectrum of dietary patterns (and related macronutrient changes) is capable of alleviating NCD risk markers, such as mental and somatic symptoms [20,21], and reducing BMI and body weight [22]. In the current study, we aim to investigate whether and how the gut microbiota composition could be related to any of the changes in the aforementioned parameters of our study. For this purpose, the fecal microbiota composition was determined in a subset of individuals from our prior study, before and at the end of the freely chosen and self-initiated dietary change, and its relation with health outcomes was examined. Rather than focusing on the putative effects of specific diets on certain health outcomes, our study contributes to the rising research topic of precision nutrition tailored towards individuals as a means for treatment, reductions in preclinical symptoms, and the prevention of NCD’s [20,21,23,24,25,26,27].

2. Materials and Methods

2.1. Study Design

The study design and methods have previously been published and are briefly described here [22]. This study was a four-week dietary intervention in men and women aged ≥18 years, who were recruited from the general Dutch population using online advertisements (www.etenvoordewetenschap.nl, accessed on 27 August 2024), media (radio and newspaper) interviews, press releases, and informative presentations. The inclusion criteria were the willingness to change habitual dietary patterns, to complete the consent form, and to provide fecal samples. No exclusion criteria were applied. Participants were recruited between October 2018 and January 2020. Informed consent was obtained from all participants.
The participants were asked to commit to a freely chosen self-imposed dietary regime that they thought would promote their health and that they could maintain for a period of at least four weeks. Some examples of dietary patterns were offered to the participants. The changes could range from the adoption of an entirely new dietary pattern to the removal or addition of single food items. The results presented in this article were obtained from a subset of participants from our previous study [22], from whom we collected fecal samples at baseline and immediately after four weeks of intervention, in order to determine (changes in) their fecal microbiota composition.
This trial is registered by the medical ethical committee of the University Medical Centre Groningen in the Netherlands with number 2018/384 and was exempted from ethical approval.

2.2. Questionnaires

As previously described, demographic data, including age and sex, diagnosed disease, and medication use were obtained at baseline [22]. The participants filled out online questionnaires at baseline and weekly from the start of the intervention on their mental and somatic symptoms, dietary intake, and physical activity. Self-reported measures of body weight and waist circumference were gathered at the same time points. Mental symptoms were measured with the Depression, Anxiety, Stress Scales (DASS) [28,29]. Somatic symptoms were measured with the Patient Health Questionnaire (PHQ-15) [30]. Dietary intake was assessed with a food frequency questionnaire (FFQ), which measured the intake of 23 different food categories in portions per day or per week [22]. Physical activity was assessed with the Physical Activity Scale 2 (PAS-2), which measured physical activity in metabolic activity of task (Met) scores per 24 h [31].

2.3. Dietary Intake

Principal component analysis (PCA, varimax rotation) was used to determine the dietary patterns of the individuals included in the present study [22,32]. Dietary intakes obtained from the FFQ in portions per week from all 23 categories, both at baseline and at four weeks, were entered into the PCA. Components were retained based on the eigenvalue (>1), the inflection point of the scree plot, and interpretability. A food category was considered to contribute to a dietary pattern if the factor loading was <−0.2 or >0.2. Dietary pattern scores were calculated by summing the intakes of the contributing food categories weighted by their factor loadings. Higher dietary pattern scores represent higher intakes of positively associated food items and lower intakes of negatively associated food items. The patterns were labeled according to the food categories that were positively related to that dietary pattern. Dietary macronutrient composition (total caloric intake, carbohydrate, protein, fat, saturated fat, and fiber intake) was estimated based on the FFQ validation [22].

2.4. Analysis of Faecal Samples

Fecal sample analysis was performed by MyMicroZooTM. The participants were provided with a sampling kit and the instructions for taking a fecal sample at home at baseline and after four weeks. The DNA was isolated using the ZymoBIOMICS 96 MagBead DNA Kit (Zymo Research, Irvine, CA, USA). The gDNA served as a template for the PCR amplification of part of 16S rRNA genes and subsequent analysis by next-generation sequencing using Illumina MiSeq. In short, amplicons of the V3-V4 regions of the 16S rRNA genes were generated by PCR with the primers 341F (5′-CCTACGGGNGGCWGCAG-3′) and 785R (5′-GACTACHVGGGTATCTAATCC-3), which generated a ~630 bp amplicon [33] complemented by standard Illumina adapters. The thermocycler (ThermoFisher) program used was the following: 30 s at 98 °C degrees, followed by 25 cycles of 10 s at 98 °C, 30 s at 55 °C, 30 s at 72 °C, then 5 min at 72 °C, and holding at 4 °C. Unique Index Primers were attached to the amplicons in each sample with a second PCR cycle with the following program: 30 s at 98 °C degrees, followed by 6 cycles of 10 s at 98 °C, 30 s at 55 °C, 30 s at 72 °C, then 5 min at 72 °C, and holding at 4 °C. The PCR products were purified using Agencourt© AMPure® XP (Becker Coulter) and the DNA concentration was measured by fluorometric analysis (dsDNA HS kit, Quant-it, Invitrogen). Subsequently, PCR amplicons were equimolarly pooled, followed by sequencing on an Illumina MiSeq with the paired-end 300 cycles protocol and indexing. FASTQ read sequence files were generated using bcl2fastq version 2.20 (Illumina). The initial quality assessment was based on data passing the Illumina Chastity filtering. Subsequently, reads containing PhiX control signals were removed using an inhouse filtering protocol. In addition, reads containing (partial) adapters were clipped (up to a minimum read length of 50 bp). The second quality assessment was based on the remaining reads using the FASTQC quality control tool version 0.11.8.
The Illumina paired reads were merged into single reads (so-called pseudoreads) through sequence overlap, after the removal of the forward and reverse primers. Data were analyzed and demultiplexed based on sample-specific barcodes. Chimeric pseudoreads were removed using USEARCH 9.240 and the remaining reads were aligned to the RDP 16S rRNA gene database 11.5. Based on the alignment scores of the pseudoreads, the taxonomic depth of the lineage was based on the identity threshold of the rank; species, 99%, genus, 97%, family, 95%, order, 90%, class, 85%, and phylum, 80%.

2.5. Statistical Analysis

Differences in somatic and mental symptoms, physical activity, body weight, BMI, waist circumference, and dietary pattern scores between baseline and after week 4 were assessed with paired t-tests. The Shannon entropy of counts, a metric of microbiota α-diversity, was calculated using USEARCH 9.2 with operational taxonomic unit (OTU) clustering with a sequencing identity threshold of 97%, after subsampling from the entire set to account for different sampling depths. Bacterial species, genera, families, and phyla were used for analysis if the number of reads was 0.1% of the total amount of reads and if they were present in at least 10 samples. The Bray–Curtis dissimilarity metric was calculated with the genera selected with the aforementioned criteria. Single species, genera, families, and phyla were selected for analysis when the relative abundance across all samples was >1%. Associations between Bray–Curtis dissimilarities and dietary intake or other outcomes were tested using PERMANOVA with 1000 permutations.
Linear modeling was used to examine the correlation between dietary intake, dietary pattern scores or macronutrient composition, somatic and mental symptoms, body weight, and the gut microbiota. This was performed in three different ways. Firstly, changes in dietary intake or health outcomes were modeled against changes in the gut microbiota composition. Secondly dietary intake or health outcomes after four weeks of dietary intervention were modeled against the final gut microbiota composition. Lastly, final dietary intake was modeled against changes in the gut microbiota, and the final gut microbiota were modeled against changes in complaints. Previously, it was shown in the present study that endpoint variations in dietary intake were better correlated with health outcomes than changes in dietary intake [34]. Models were adjusted for baseline symptom scores, sex, age, changes in BMI, and changes in physical activity when applicable. Only participants with values for all confounding factors were included.
All statistical tests were 2-sided and significance was assumed when p ≤ 0.05. Benjamini–Hochberg correction was used for multiple testing. All statistical analysis was performed in R (version 4.0.3).

3. Results

3.1. Participants and Baseline Values

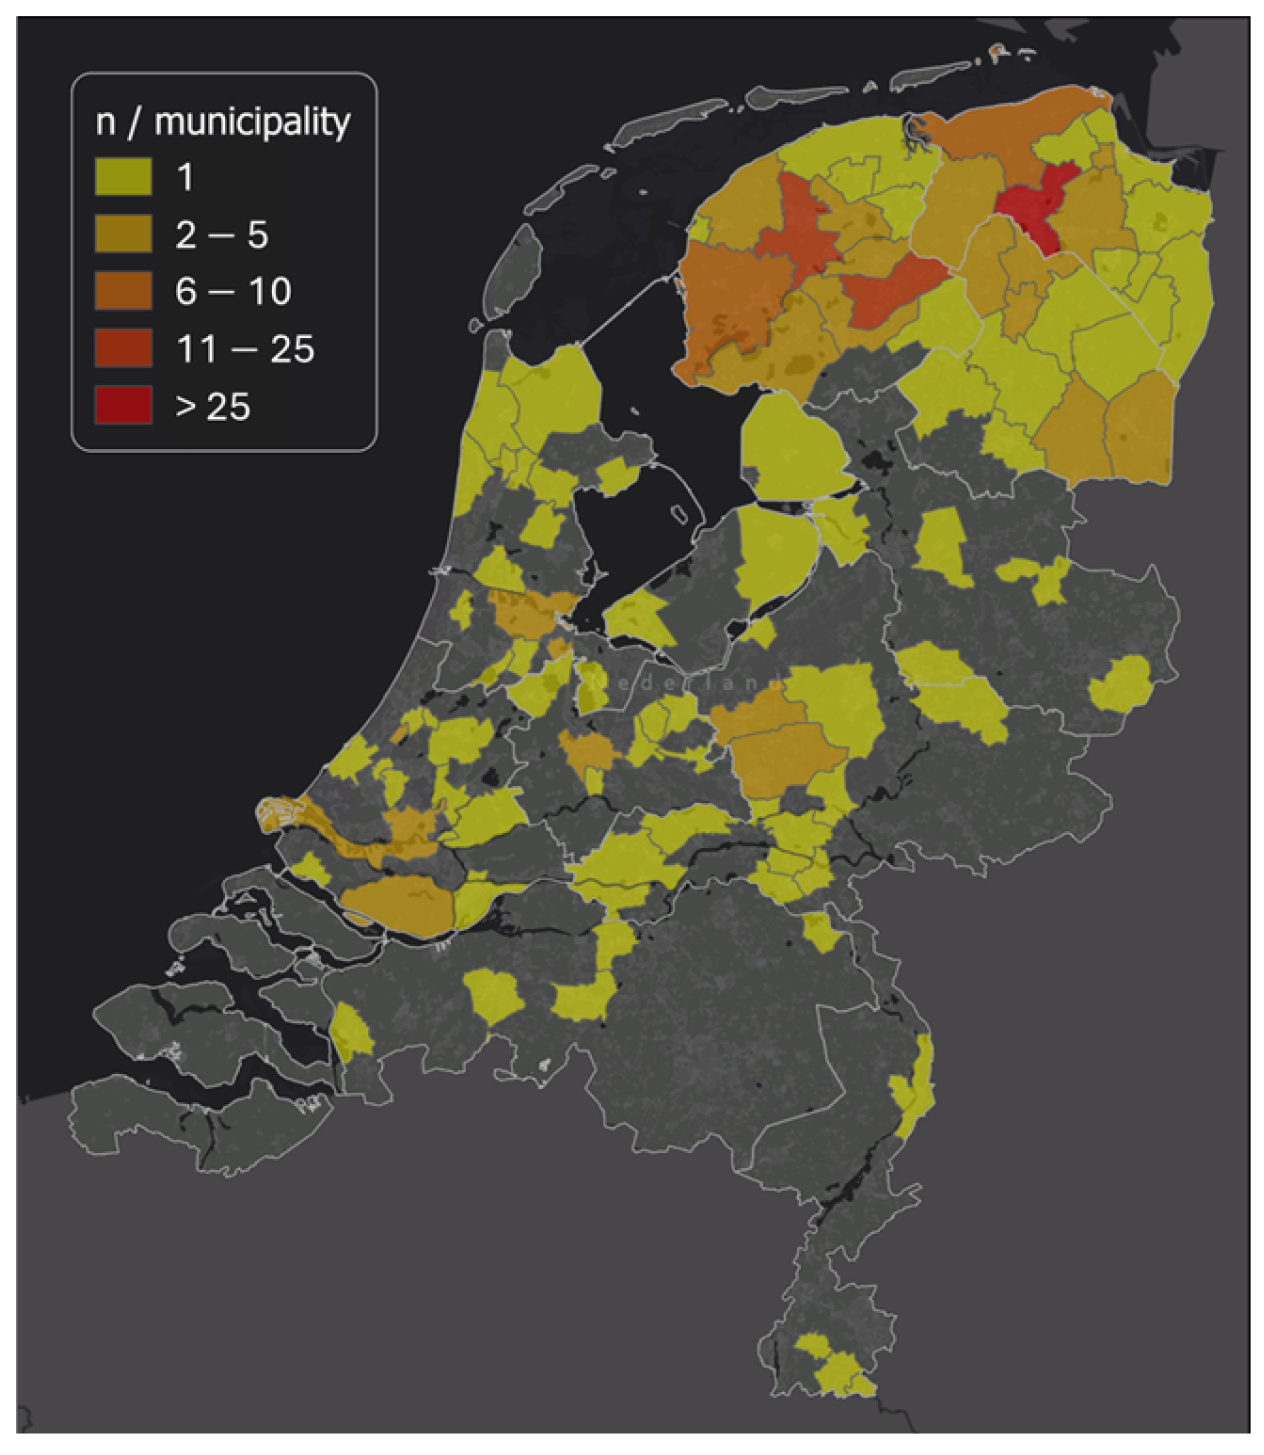
Over the course of the study, there was a dropout rate of 53%, which was equally divided over sex, age, education level, BMI, and baseline mental and somatic symptoms. Completers (n = 185) filled out questionnaires at baseline and at week 4, and also handed in stool samples both at baseline and at four weeks (Figure 1). A few participants missed the week 4 questionnaire submission timeslot (i.e., because of closure of the website www.etenvoordewetenschap.nl, accessed on 27 August 2024). Upon verification of these participants’ continued adherence in week 4, week 3 questionnaire data were used instead. Completers were, on average, 49.1 ± 14.9 years old, 80.5% were female, and 70.3% had completed higher education (Table 1). In total, 72% of the participants lived in the north of the Netherlands (province Friesland, 34%, Groningen, 29%, and Drenthe, 9%) (Figure 2). The baseline mental symptom score was 14.7 ± 13.9 and baseline somatic symptom score was 7.5 ± 4.8.

3.2. Dietary Intake and Health Outcomes

The principal component analysis revealed five dietary patterns, which, in total, explained 42.0% (11.5%, 9.5%, 8.7%, 6.4%, and 5.8%, respectively) of the variance in dietary intake (Table 2). Positive loadings of food groups indicate that a food item is highly associated with the corresponding dietary pattern, while negative loadings indicate that there is an inverse correlation. The first dietary pattern, labeled “Processed foods”, was high in snacks, candy, cookies, sugar sweetened beverages, refined grain products, wine, pasta, rice, and potatoes and low in fruit. The second pattern, labeled “Animal source foods”, was high in fresh meat, eggs, fresh fish, processed meat products, and processed fish products and low in fruit, wholegrain products, pasta, rice, potatoes, and vegetarian meat replacements. The third pattern, labeled “Pescatarian”, was high in vegetables, nuts, water, fruit, processed fish products, vegetarian meat replacements, pasta, rice, potatoes, fresh fish, and candy, and was low in refined grain products and sugar sweetened beverages. The fourth pattern, labeled “Traditional Dutch”, was high in wholegrain products, dairy, tea, processed meat products, pasta, rice and potatoes, and low in gluten-free bread replacements. The last dietary pattern, labeled “Party”, had high intakes of coffee, alcohol, processed fish products, and wine, and low intakes of vegetables, tea, sugar sweetened beverages, and water.
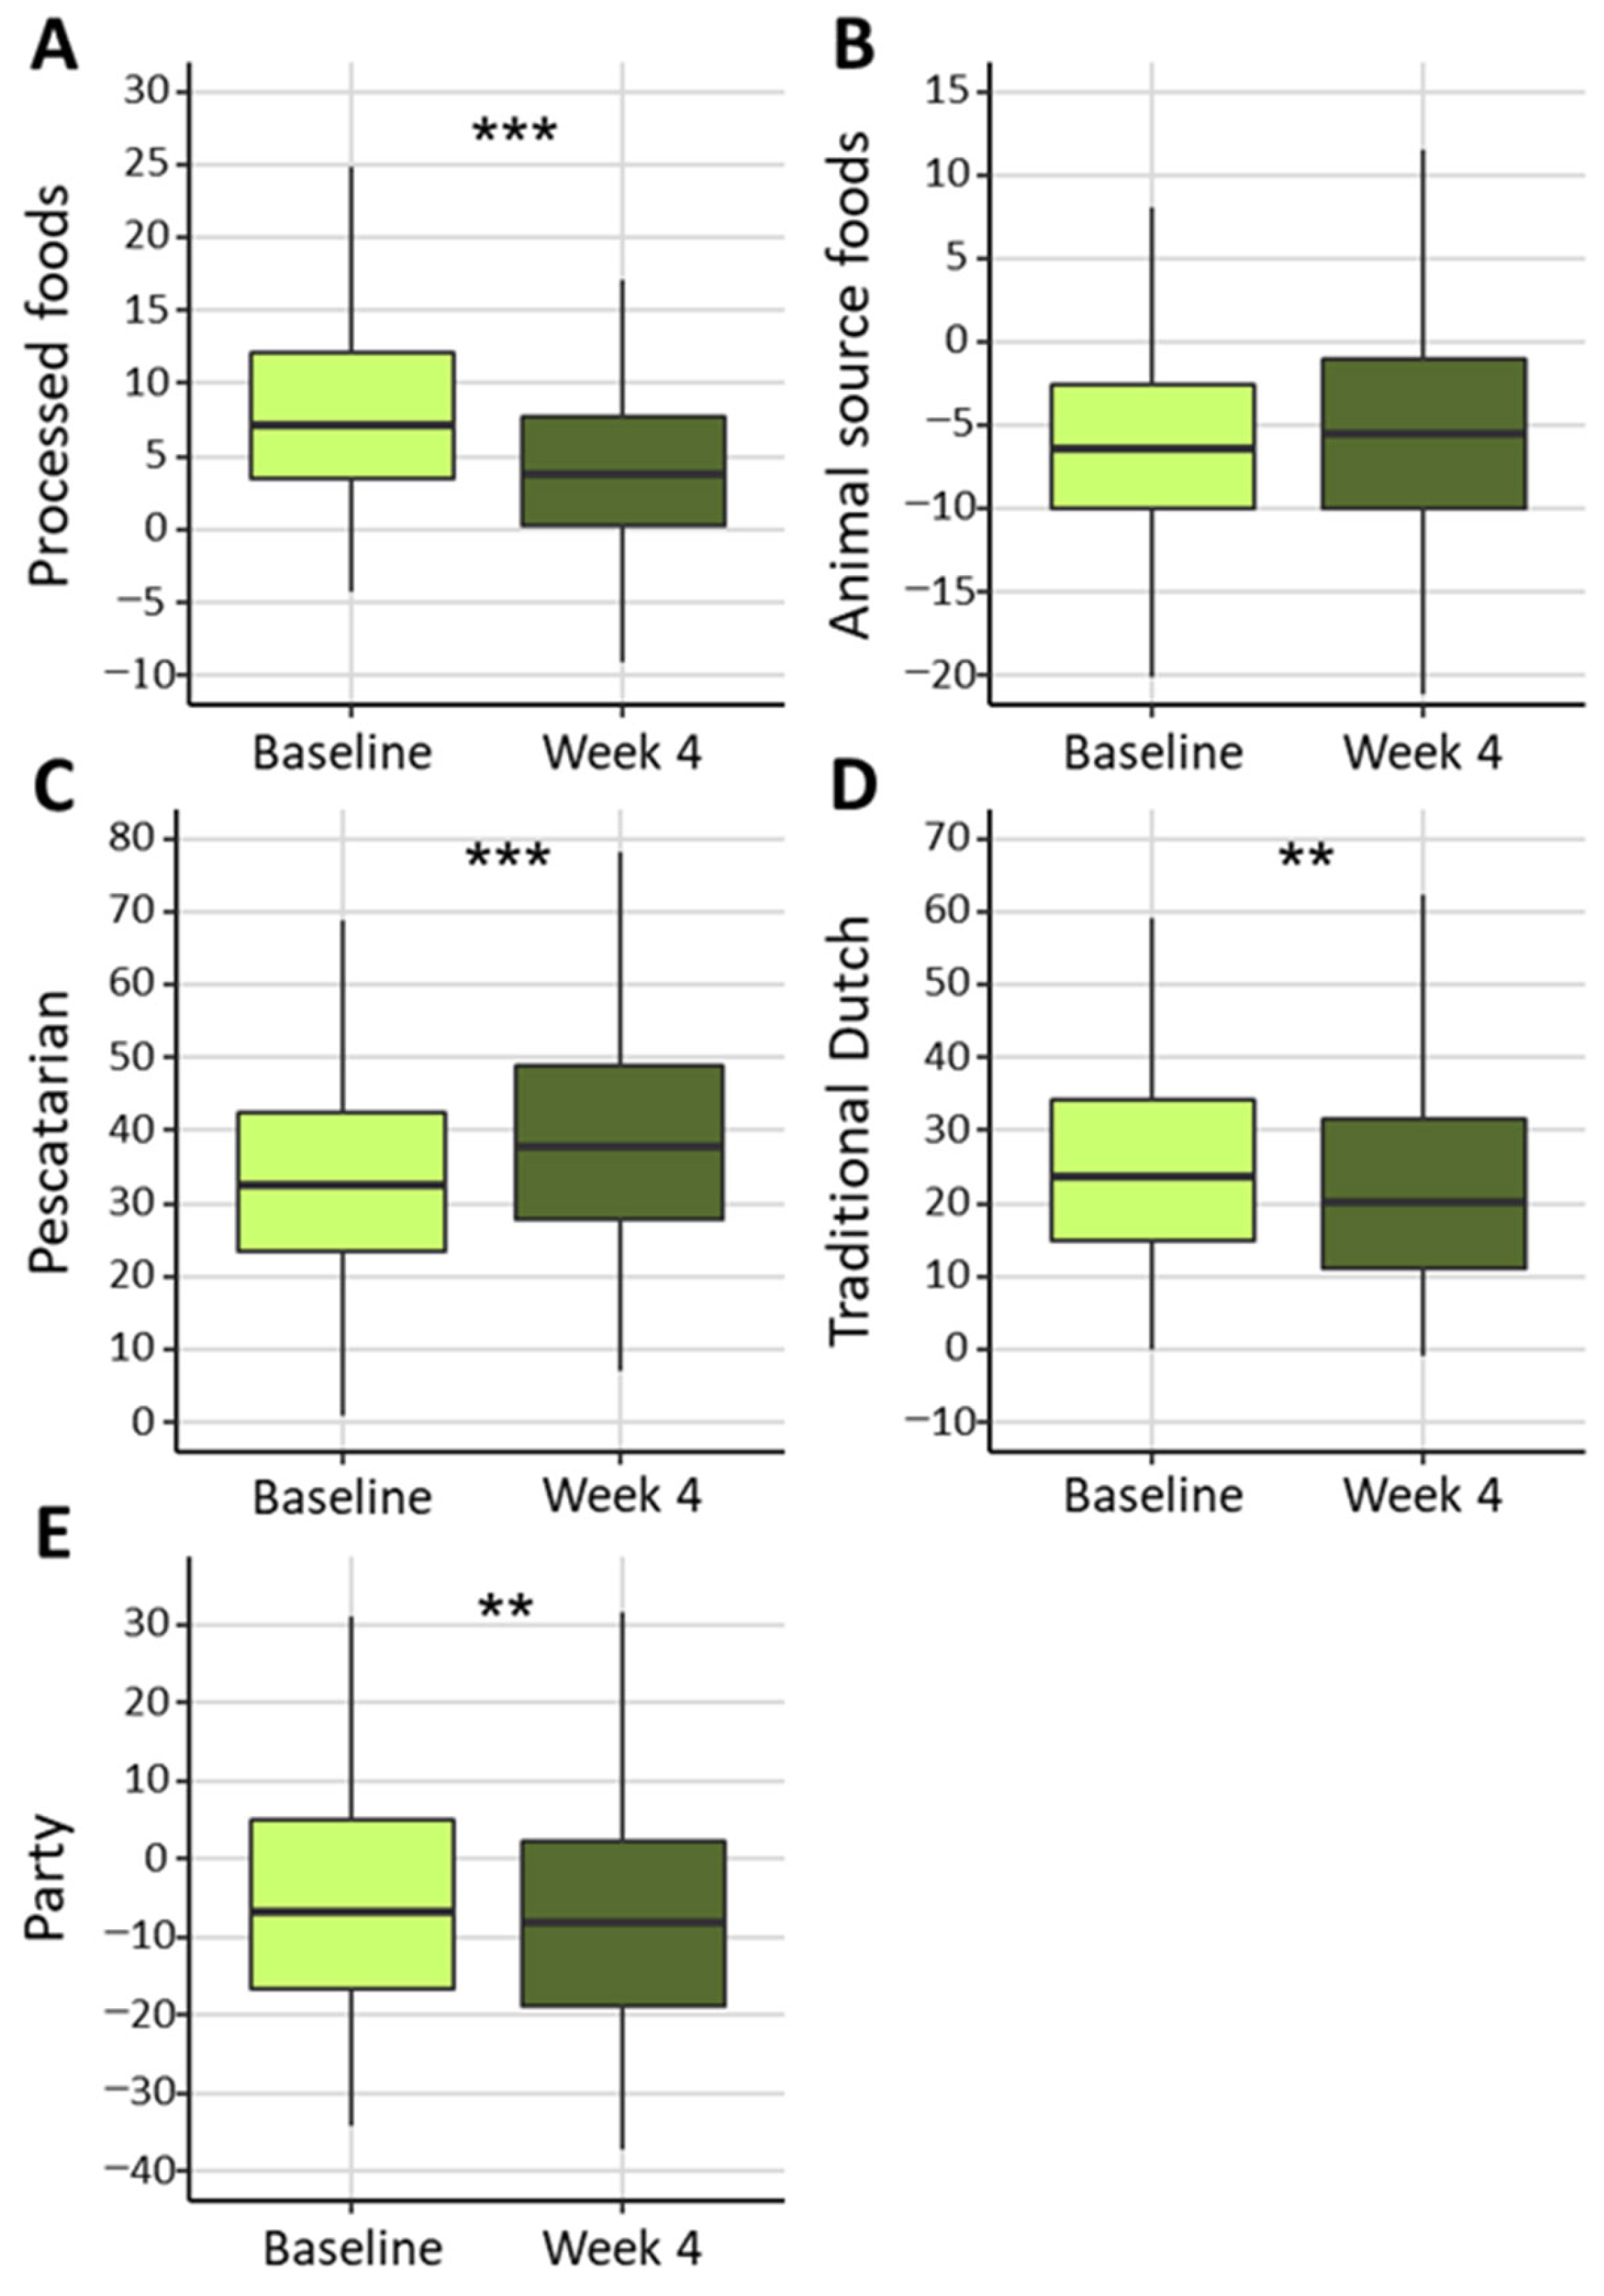
Intake of the Processed foods, Traditional Dutch, and Party patterns was significantly decreased at week 4. Intake of the Pescatarian pattern was significantly increased at week 4, whereas intake of the Animal source foods pattern did not significantly change (Figure 3). Overall, there was a significant reduction in caloric intake and the energy percentage gained from carbohydrates, whereas there was a significant increase in the energy percentage gained from fat. There were decreases in the absolute intake of carbohydrates, fat, and protein (Table 3). The absolute intake of fiber, however, was unaltered at four weeks.
Next to the changes in dietary patterns and macronutrient intake, there were significant changes in health outcomes after four weeks of dietary intervention. A significant reduction in the number of mental and somatic symptoms was observed, as well as significant reductions in body weight, BMI, and waist circumference. Physical activity did not change (Table 4).

3.3. Gut Microbiota Composition

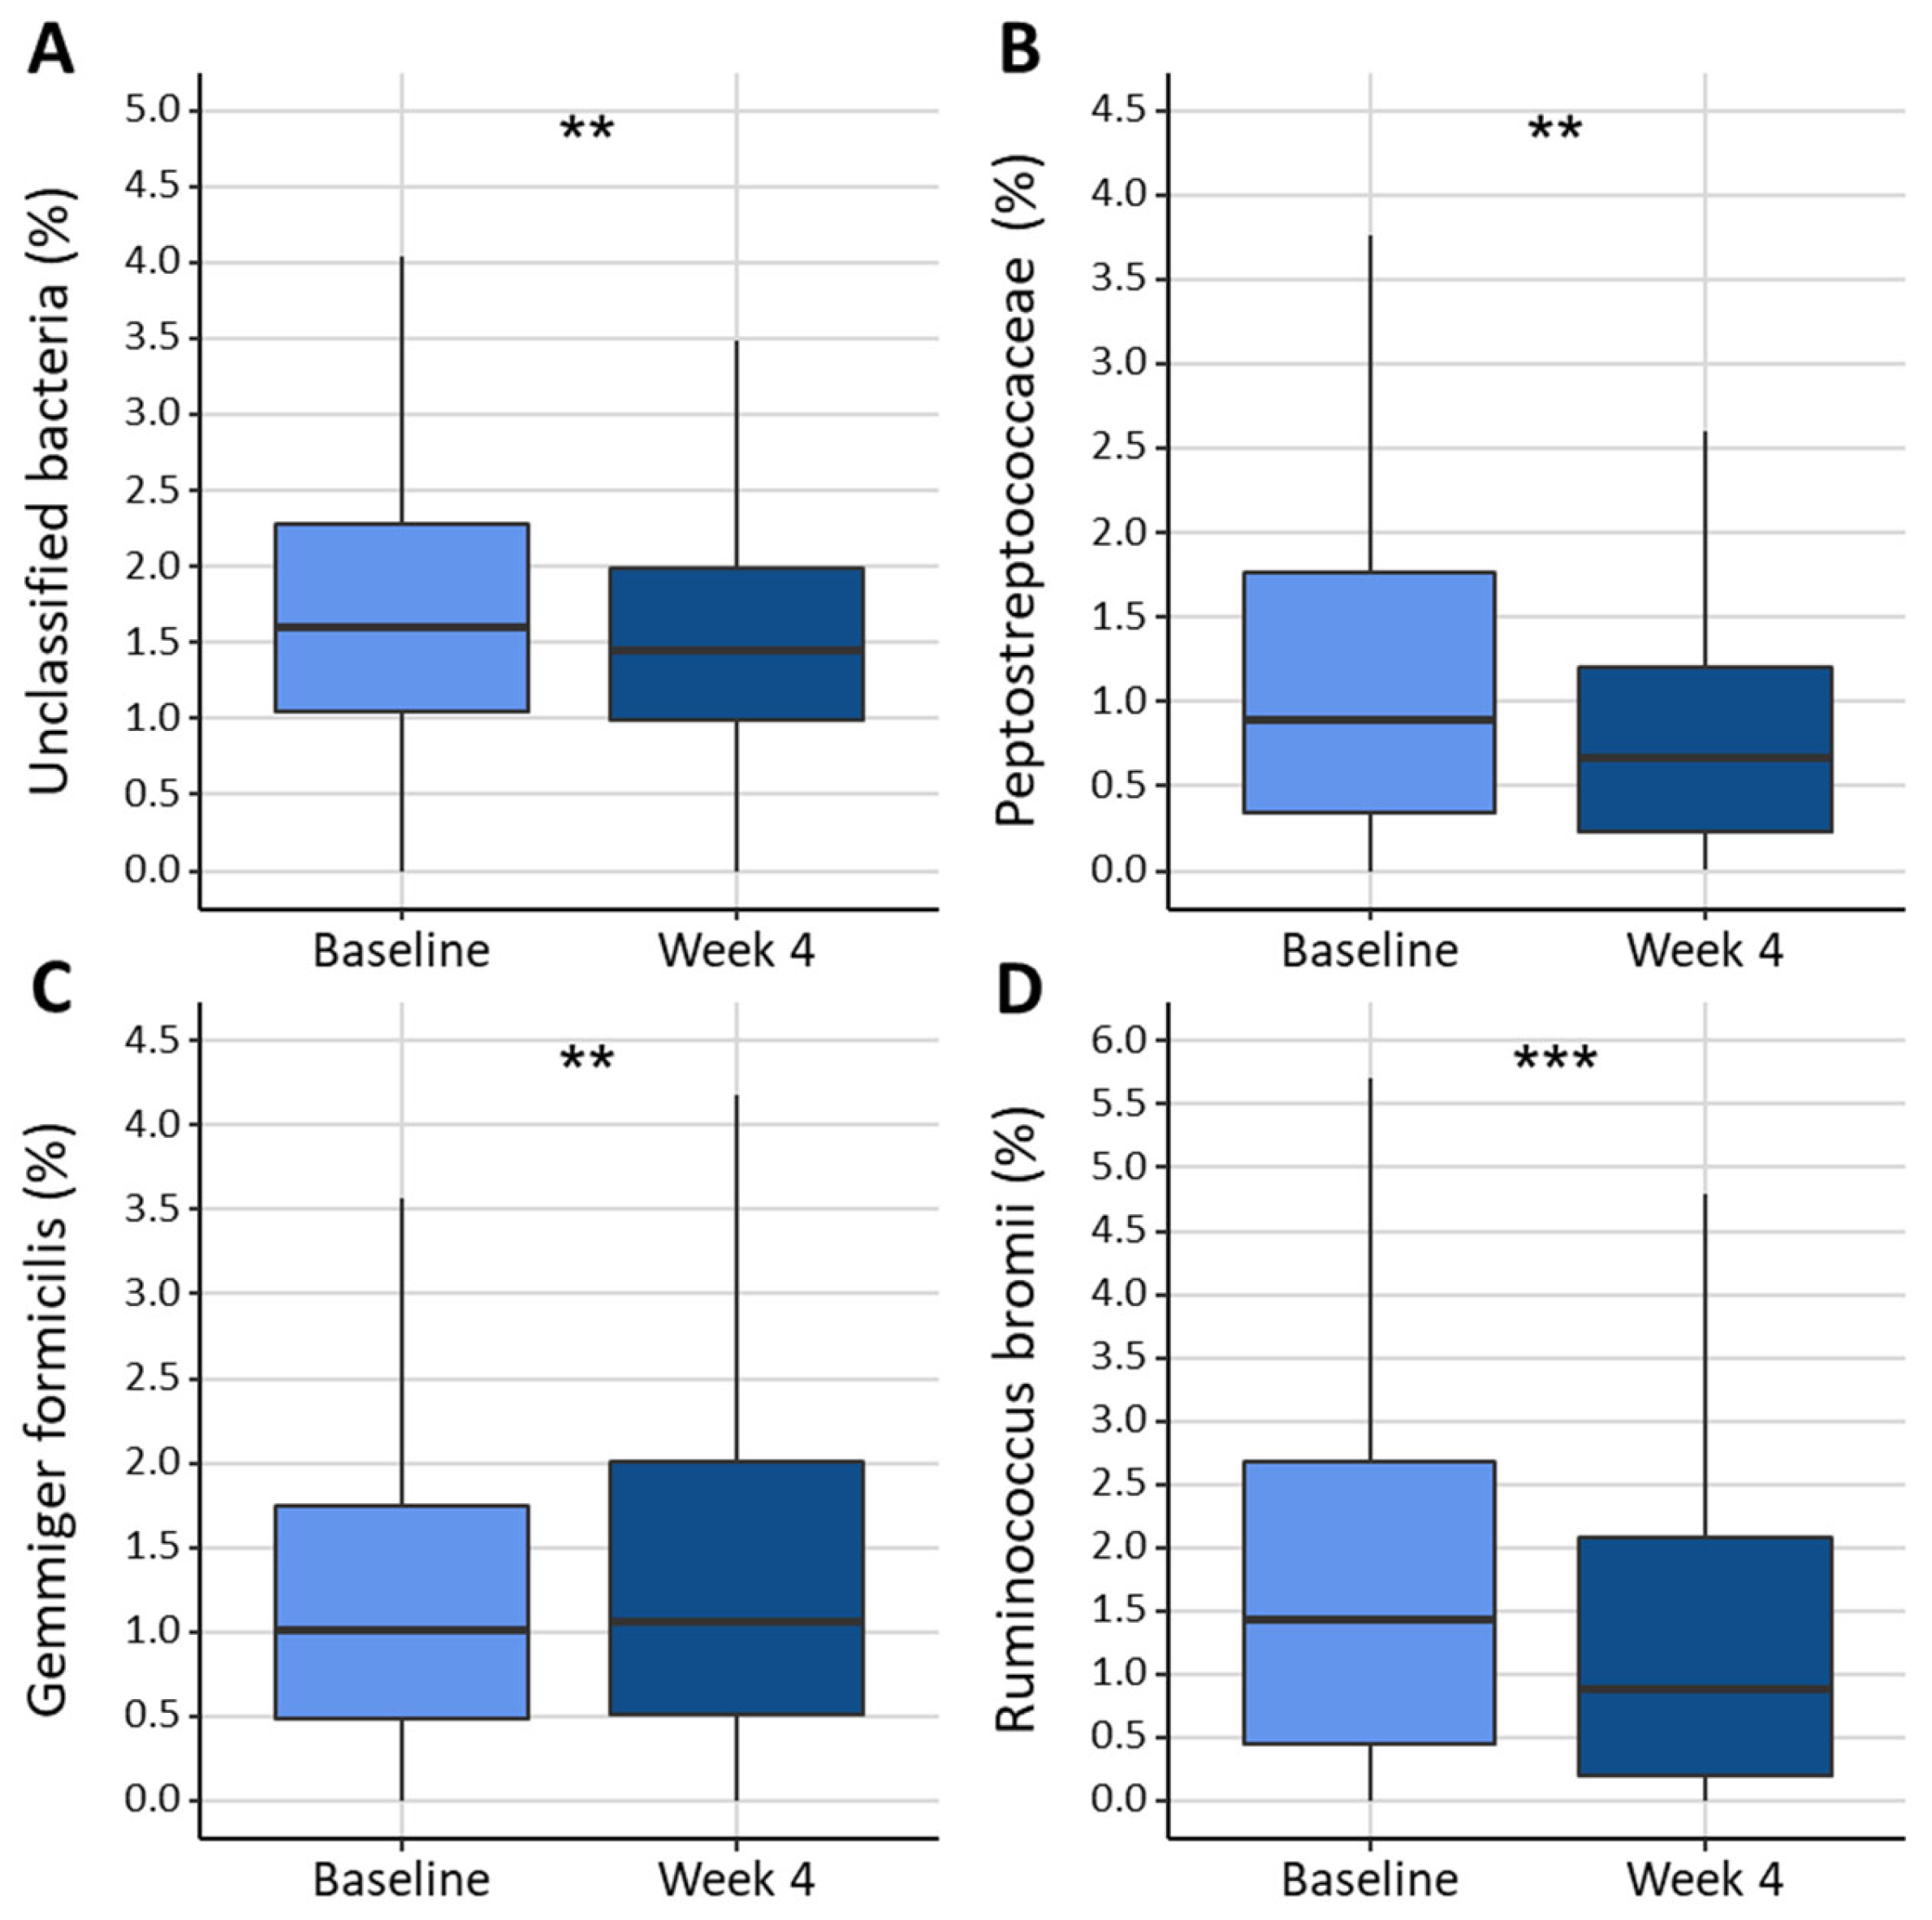
Based on their >1% bacterial abundance in the samples, we selected 6 phyla, 20 families, 29 genera, and 27 species (Supplemental Table S1). Significant changes in relative abundance were found for Gemmiger formicilis and Ruminococcus bromii (both within the family of Oscillospiraceae) after four weeks of dietary interventions, with an increase in the former and a decrease in the latter. On the family level, the relative abundance of Peptostreptococcaceae decreased, and on the phylum level, unclassified bacteria reduced significantly (Figure 4). There were no significant changes in the Shannon diversity index and Firmicutes/Bacteroidetes ratio.

3.4. Relation Between Dietary Intake and Gut Microbiota

Firstly, changes (i.e., from baseline to the end of the study) in the Shannon index were positively correlated with changes in the energy intake of fat (B = 0.065, Adj. r2 = 0.24, p = 0.04). However, there were no correlations between changes in individual bacteria and changes in dietary pattern scores or macronutrient intake.
Secondly, correlation analyses between the final gut microbiota composition and final dietary intakes were performed (see Table 5 below).
Blautia obeum abundance was positively correlated with the intake of Animal source foods and the percentual energy intake of fat and saturated fat, while it was negatively correlated with the percentual energy intake of carbohydrates. Ruminococcus bromii abundance was negatively correlated with the intake of Animal source foods and the percentual energy intake of fat and saturated fat. It was also positively correlated with the percentual and absolute energy intake of carbohydrates and fiber intake. Gracilibacter thermotolerans and Flintibacter butyricus abundances were positively correlated with the intake of Pescatarian foods, whereas Bifidobacterium adolescentis abundance was negatively correlated with Pescatarian intake. Akkermansia muciniphila was positively correlated with the percentual energy intake of saturated fat. Most of these results on the species level were also detected on the genus, family, and phylum levels, but could be traced back to these single bacterial species and are, therefore, not shown. On the genus level, Prevotella and Roseburia were negatively correlated with the percentual energy intake of saturated fat. On the family level, Bacteroidaceae and Erysipelotrichaceae were positively correlated with the percentual energy intake of fat and saturated fat intake. Lastly, Clostridiaceae was also positively correlated with the percentual energy intake of saturated fat (Table 5).
Bray–Curtis dissimilarity on the genus level was calculated for all samples at week 4. PERMANOVA analyses were performed to quantify the variance in the samples explained by dietary intake, symptoms, and body weight. At week 4, beta diversity was related to caloric intake (p < 0.01), the absolute intake of carbohydrates (p = 0.03), fats (p < 0.001), and proteins (p < 0.01), and BMI (p = 0.02). No relations were found with dietary patterns. Finally, also no correlations were found between the Firmicutes/Bacteroidetes ratio and dietary intake.

3.5. Relation of Health Outcomes and Gut Microbiota

Several intervention-induced changes in health parameters were found to be related to changes in the gut microbiota parameters. Firstly, a reduction in BMI was correlated with an increased abundance of the family Erysipelotrichaceae, however, this association was not very strong (B = −0.069, Adj. r2 = 0.10, p < 0.01). On the genus level, a reduction in waist circumference was correlated with a reduction in Oscillibacter (B = 0.625, Adj. r2 = 0.16, p < 0.01). No relations were found between changes in somatic symptoms and changes in the gut microbiota parameters. Much stronger correlations were found between changes in mental health outcomes and the gut microbiota parameters. In particular, a reduction in total mental symptoms was strongly correlated with an increase in Ruminococcus bicirculans abundance (B = −0.659, Adj. r2 = 0.64, p < 0.001). A reduction in stress symptoms was also correlated with a reduction in Barnesiella intestinihominis abundance (B = 0.111, Adj. r2 = 0.75, p < 0.001), but this correlation was no longer significant after correcting for dietary pattern scores (p = 0.10).
Also, the relation between endpoint health outcomes and the gut microbiota composition after four weeks of dietary intervention was investigated. BMI at four weeks was positively correlated with the species E. hallii and the genera Clostridium and Coprococcus, and negatively correlated with the families Clostridiaceae, Erysipelotrichaceae, Lachnospiraceae, and Peptostreptococcaceae. Waist circumference was positively correlated with the species E. hallii and Eubacterium rectale, the genera Coprococcus, and unclassified Lachnospiraceae, and negatively correlated with the genus Clostridium and the family Clostridiaceae. Lastly, there was a positive correlation between stress symptoms and the genus Prevotella (Table 6).

4. Discussion

Previously, we found that a self-initiated and freely chosen four-week dietary intervention adopted by ~280 completing participants led to reduced mental and somatic health complaints, as well as a reduction in body weight. A reduction in relative carbohydrate intake, reduced total energy intake, reduced intake of “Processed foods”, and increased intake of “Wheel of five” foods appeared to be key in these effects [22]. The current study was performed in a subset (n = 185) of those individuals who additionally provided fecal samples at baseline and at the end of the intervention, allowing us to potentially relate gut microbiota characteristics to dietary intake and the observed health benefits of the self-implemented and freely chosen diet. An important prerequisite for the current study was the ability to largely reconfirm the general health benefits in this smaller subset, again showing relative reductions in carbohydrate and total energy intake and a reduced intake from “Processed Foods” items to be related to reduced health complaints and reductions in body weight and BMI. The gut microbiota analysis in the current study showed that the four-week dietary intervention caused changes in the relative abundance of Eubacteriales bacteria, namely an increase in the Gemmiger formicilis species and reductions in the Ruminococcus bromii species and Peptostreptococcaceae family. These effects were not associated with changes in the Shannon diversity index or Firmicutes/Bacteroidetes ratio, indicating no major shifts and/or abundances/dysbiotic properties as a consequence of the dietary changes.
The Eubacteriales order belongs to the class of Clostridia and consists of species that are usually considered as normal commensal bacteria contributing to gut homeostasis. In particular, Ruminococcaceae (to which the Gemmiger and Ruminococcus species also belong) consists of bacteria that are able to digest the complex carbohydrates found in high-fiber foods [35,36], and some of which produce short-chain fatty acids (SCFAs) that are beneficial for gut health and beyond [37]. While R. bromii has received a lot of attention lately as one of the exponents of this class, its abundance decreased over the four-week intervention in the present study—probably as a result of the reduced carbohydrate intake—while the abundance of G. formicilis increased. G. formicilis is atypical in the sense that it has been related to type 2 diabetes mellitus [38], but there is actually also support for the fact that its abundance is increased in metabolically healthy obese versus metabolically non-healthy obese individuals [39]. In this light, it is very interesting that the G. formicilis abundance was reported to be lowered in individuals with irritable bowel disease (IBD; i.e., according to a meta-analysis including nine different IBD populations [40]), however, the precise causal mechanism and implications of this remain to be established. The reduction in Peptostreptococcaceae abundance is in line with publications linking its high abundance with an unhealthy dietary intake [41] and poor quality of life [42], although contrasting findings have also been mentioned [43]. Indeed, the general somatic and mental complaints of participants in the present study decreased, while the intake of “Processed foods” also decreased. Besides the latter, the intake of fat and protein also increased, as well as an increase in the intake from the “Pescatarian” food group. It may be hypothesized that these changes were somehow related to the changes observed in G. formicilis and Peptostreptococcaceae, either directly or via effects mediated by the host. In fact, lately, more studies have shown a positive impact of fat intake on the gut microbiota [44]. Although we did not observe related changes in fat or protein intake with the aforementioned bacteria, we did observe that the change in the Shannon index was positively correlated with the change in fat intake. Dietary fat includes, amongst others, mono- and polyunsaturated fats, as well as saturated fat, which all could have varied beneficial or deleterious effects on the gut microbiota composition too [45,46]. One of the bacteria that was positively correlated with the intake of saturated fat at the end of the dietary intervention was Akkermansia muciniphila. A. muciniphila has recently gained interest as probiotic for its beneficial effects on body weight, fat mass, and hip circumference [47,48]. Negative correlations between A. muciniphila abundance and overweight [49], obesity [50,51], untreated T2D [52], and hypertension have been reported [47,53,54].
Besides the overall shifts in Eubacterial abundances over the course of the intervention and the change in the Shannon index being positively correlated with the change in fat intake over the course of the four-week intervention study, we did not observe other changes in bacterial abundance that were related to changes in dietary intake, nor did we observe correlations between the baseline measurements of bacterial abundance/diversity and dietary intake patterns. Apparently, the variation between participants was too high to yield distinct relations before the start of the intervention. Analysis of the endpoint characteristics of the participants, however, did yield several relations. Our explanation for this phenomenon is that the variation between individuals became smaller over the course of the interventions (e.g., due to less snacking and lower intake of processed foods), despite the fact that the dietary interventions of participants were self-chosen. Indeed, at the end of study, we found several correlations between diet and bacterial abundance. For example, the above-discussed R. bromii abundance at the end of study was, as expected, correlated with endpoint carbohydrate and fiber intake. Blautia obeum (phylum Firmicutes and class Clostridia), reported for its ability to regulate host health and alleviate metabolic syndrome (MetS) [55], was negatively correlated with carbohydrate intake and was positively correlated with fat intake and the intake of the Animal source foods pattern. In our previous meta-analysis focusing on low-carbohydrate and low-fat diets and markers of MetS, we reported that lower carbohydrate and increased fat and protein intake were related to a decrease in markers of MetS [34]. It may be speculated that a higher intake of fat (not only from animal food) and lower intake of carbohydrates, each seen in the current study, may increase B. obeum and potentially also reduce the risk for developing NCDs.
Finally, we also investigated the relations between bacterial abundance and (subjective) somatic and mental health characteristics. First of all, the magnitude by which the BMI was reduced over the course of the intervention was significantly correlated with the extent to which the abundance of Erysipelotrichaceae was increased. An increased abundance of Erysipelotrichaceae has frequently been mentioned as pro-inflammatory and seems to be associated with obesity and lipid metabolism [56]. However, the same inverse correlation that we found in our study between BMI and Erysipelotrichaceae abundance was shown on a low-dose probiotic intervention, possibly indicating that the bacteria act synergistically with probiotics to lower body mass and BMI [57]. Furthermore, reductions in total mental symptoms were correlated strongly with an increase in Ruminococcus bicirculans abundance, a well-known utilizer of plant cell wall polysaccharides (including beta-glucans), but unlike R. bromii, they are unable to degrade resistant starches [35,58]. Reductions in stress symptoms were also correlated with a reduction in Barnesiella intestinihominis abundance, but this correlation was no longer significant after correcting for dietary pattern scores.
At the end of the study, Eubacterium rectale (phylum Firmicutes and class Clostridia, an SCFA producer [59]) and Eubacterium hallii were positively correlated with the endpoint BMI and waist circumference. In obese individuals, a reduction in carbohydrate intake has been shown to cause a reduction in E. rectale [60], and increased E. rectale abundance has previously been linked to a higher intake of (ultra-)processed foods [61,62]. This complements our findings with regard to the relation between reductions in body weight and intake of processed foods and carbohydrates [22]. A higher Prevotella abundance was found to be correlated with higher stress scores, which is interesting, since Prevotella is associated with a higher fiber and vegetable intake [11], which, in general, are related to a better mental health [63].
This study has some limitations. Especially for their effects on the gut microbiota, microbiota-accessible carbohydrates in food items are of importance [64]. A more specified analysis of dietary intake and macronutrient content would be of interest, and in particular, information on simple sugars versus carbohydrates and the type of fat intake would provide further insights into the specific relations between the gut microbiota and diet composition. Secondly, we were not able to perform a functional analysis of the gut microbiota, but this would have given further insights into the functional changes occurring in the gut, which may be more related to the health outcomes we observed. We used 16S data for analyses, which are less reliable on the species than on the genus level. However, many of the correlations we found on the species level were also present on higher levels, but could be traced back to that single species, indicating that the correlations found were reliable. Lastly, a potential limitation of this study refers to the credibility of self-reported anthropometric measures (including body weight and waist circumference). We tried to optimize this as much as possible by carefully explaining to the participants at the beginning of the study the importance of the reliability of their data, and how they should collect and report them in a standardized and equitable manner, no matter the outcome. Thus, although mistakes can never fully be ruled out in this or any other study, we are confident that the vast majority of our data are credible and that our conclusions are justified.

5. Conclusions

We conclude that a self-initiated four-week dietary intervention improved mental and somatic health and induced changes in the gut microbiota composition, with an increased fat intake and reduced carbohydrate and “Processed foods” intake probably being the most prominent steering components. A number of individual bacterial taxa were correlated with macronutrient intake, dietary patterns, BMI, and mental health, with the most profound contribution being that of the Eubacteriales family to the microbiota–gut–brain axis. An intriguing issue, however, is fact that the most prominently “overall” changed bacterial species, i.e., Gemmiger formicilis, Ruminococcus bromii, and Peptostreptococcaceae (with the abundance of the former increasing and the latter two decreasing over the four-week dietary intervention) were, except for Ruminococcus bromii, neither linearly related to specific diet intake parameters nor to specific somatic and mental health indices. At the moment, we do not know the relevance of these overall changes in light of the various bacterial species, classes, etc., that were observed to be linearly related to dietary parameters and/or health parameters, particularly at the end of the four-week intervention, but did not stand out to be generally altered. The exponent observation of the latter was the increase in R. bicirculans being strongly individually correlated with reductions in mental complaints. These results may be interpreted to indicate that overall changed—versus individually correlated—alterations in microbiota abundances and their relations with host health characteristics represent different levels of regulation, which remain to be further untangled.

Supplementary Materials

The following supporting information can be downloaded at: https://www.mdpi.com/article/10.3390/nu16203544/s1, Table S1: Selected species for beta diversity calculation with their corresponding genus, family and phylum. Highlighted species, genera, families, and phyla were selected for in-depth analysis.

Author Contributions

Conceptualization, A.W., M.S.-d.J. and G.v.D.; formal analysis, A.W.; funding acquisition, G.v.D.; methodology, A.W. and M.S.-d.J.; project administration, A.W. and M.S.-d.J.; resources, E.K. and B.v.d.B.; supervision, M.S.-d.J., A.v.B. and G.v.D.; visualization, A.W.; writing—original draft, A.W. and M.S.-d.J.; writing—review and editing, E.K., B.v.d.B., A.v.B. and G.v.D. All authors have read and agreed to the published version of the manuscript.

Funding

This project was funded by Centre of Expertise Food, aXtion, MyMicroZoo and Hessing Supervers (grant number 7901750034).

Institutional Review Board Statement

Ethical review and approval were waived for this study due to not falling under the Dutch law of medical research. This trial is registered by the medical ethical committee of the University Medical Centre Groningen in the Netherlands with number 2018/384, approval date 24 August 2018.

Informed Consent Statement

Informed consent was obtained from all subjects involved in the study.

Data Availability Statement

The data presented in this study are available on request from the corresponding author due to privacy restrictions.

Acknowledgments

The authors would like to thank Esther Nederhof for her contribution to the design and execution of the project. They would also like to thank Ronald de Jong from Altenburg & Wymenga, Netherlands, who helped us creating the map for Figure 2, and Amber Smit for the work on the validation of the food frequency questionnaire.

Conflicts of Interest

Author Bartholomeus van den Bogert was employed by MyMicroZoo. The funders had no role in the design of the study; in the collection, analyses, or interpretation of data; in the writing of the manuscript; or in the decision to publish the results.

References

  1. Spichak, S.; Bastiaanssen, T.F.S.; Berding, K.; Vlckova, K.; Clarke, G.; Dinan, T.G.; Cryan, J.F. Mining Microbes for Mental Health: Determining the Role of Microbial Metabolic Pathways in Human Brain Health and Disease. Neurosci. Biobehav. Rev. 2021, 125, 698–761. [Google Scholar] [CrossRef] [PubMed]
  2. Farup, P.G.; Valeur, J. Faecal Microbial Markers and Psychobiological Disorders in Subjects with Morbid Obesity. A Cross-Sectional Study. Behav. Sci. 2018, 8, 89. [Google Scholar] [CrossRef] [PubMed]
  3. Jovel, J.; Patterson, J.; Wang, W.; Hotte, N.; O’Keefe, S.; Mitchel, T.; Perry, T.; Kao, D.; Mason, A.L.; Madsen, K.L.; et al. Characterization of the Gut Microbiome Using 16S or Shotgun Metagenomics. Front. Microbiol. 2016, 7, 459. [Google Scholar] [CrossRef] [PubMed]
  4. Wilkins, L.J.; Monga, M.; Miller, A.W. Defining Dysbiosis for a Cluster of Chronic Diseases. Sci. Rep. 2019, 9, 12918. [Google Scholar] [CrossRef]
  5. Ley, R.E.; Turnbaugh, P.J.; Klein, S.; Gordon, J.I. Human Gut Microbes Associated with Obesity. Nature 2006, 444, 1022–1023. [Google Scholar] [CrossRef]
  6. Walters, W.A.; Xu, Z.; Knight, R. Meta-Analyses of Human Gut Microbes Associated with Obesity and IBD. FEBS Lett. 2014, 588, 4223–4233. [Google Scholar] [CrossRef]
  7. Debelius, J.; Song, S.J.; Vazquez-Baeza, Y.; Xu, Z.Z.; Gonzalez, A.; Knight, R. Tiny Microbes, Enormous Impacts: What Matters in Gut Microbiome Studies? Genome Biol. 2016, 17, 217. [Google Scholar] [CrossRef]
  8. Power, S.E.; O’Toole, P.W.; Stanton, C.; Ross, R.P.; Fitzgerald, G.F. Intestinal Microbiota, Diet and Health. Br. J. Nutr. 2014, 111, 387–402. [Google Scholar] [CrossRef]
  9. World Health Organization. Global Health Estimates 2020: Disease Burden by Cause, Age, Sex, by Country and by Region, 2000–2019; World Health Organization: Geneva, Switzerland, 2020. [Google Scholar]
  10. Hernández-Calderón, P.; Wiedemann, L.; Benítez-Páez, A. The Microbiota Composition Drives Personalized Nutrition: Gut Microbes as Predictive Biomarkers for the Success of Weight Loss Diets. Front. Nutr. 2022, 9, 1006747. [Google Scholar] [CrossRef]
  11. De Filippo, C.; Cavalieri, D.; Di Paola, M.; Ramazzotti, M.; Poullet, J.B.; Massart, S.; Collini, S.; Pieraccini, G.; Lionetti, P. Impact of Diet in Shaping Gut Microbiota Revealed by a Comparative Study in Children from Europe and Rural Africa. Proc. Natl. Acad. Sci. USA 2010, 107, 14691–14696. [Google Scholar] [CrossRef]
  12. David, L.A.; Maurice, C.F.; Carmody, R.N.; Gootenberg, D.B.; Button, J.E.; Wolfe, B.E.; Ling, A.V.; Devlin, A.S.; Varma, Y.; Fischbach, M.A.; et al. Diet Rapidly and Reproducibly Alters the Human Gut Microbiome. Nature 2014, 505, 559–563. [Google Scholar] [CrossRef]
  13. Leeming, E.R.; Johnson, A.J.; Spector, T.D.; Le Roy, C.I. Effect of Diet on the Gut Microbiota: Rethinking Intervention Duration. Nutrients 2019, 11, 2862. [Google Scholar] [CrossRef] [PubMed]
  14. Hall, K.D.; Ayuketah, A.; Brychta, R.; Cai, H.; Cassimatis, T.; Chen, K.Y.; Chung, S.T.; Costa, E.; Courville, A.; Darcey, V.; et al. Ultra-Processed Diets Cause Excess Calorie Intake and Weight Gain: An Inpatient Randomized Controlled Trial of Ad Libitum Food Intake. Cell Metab. 2019, 30, 67–77.e3. [Google Scholar] [CrossRef] [PubMed]
  15. Redondo-Useros, N.; Nova, E.; González-Zancada, N.; Díaz, L.E.; Gómez-Martínez, S.; Marcos, A. Microbiota and Lifestyle: A Special Focus on Diet. Nutrients 2020, 12, 1776. [Google Scholar] [CrossRef]
  16. Wu, G.D.; Chen, J.; Hoffmann, C.; Bittinger, K.; Chen, Y.-Y.; Keilbaugh, S.A.; Bewtra, M.; Knights, D.; Walters, W.A.; Knight, R.; et al. Linking Long-Term Dietary Patterns with Gut Microbial Enterotypes. Science 2011, 334, 105–108. [Google Scholar] [CrossRef]
  17. Chen, L.; Zhernakova, D.V.; Kurilshikov, A.; Andreu-Sánchez, S.; Wang, D.; Augustijn, H.E.; Vich Vila, A.; Weersma, R.K.; Medema, M.H.; Netea, M.G.; et al. Influence of the Microbiome, Diet and Genetics on Inter-Individual Variation in the Human Plasma Metabolome. Nat. Med. 2022, 28, 2333–2343. [Google Scholar] [CrossRef]
  18. Turnbaugh, P.J.; Hamady, M.; Yatsunenko, T.; Cantarel, B.L.; Duncan, A.; Ley, R.E.; Sogin, M.L.; Jones, W.J.; Roe, B.A.; Affourtit, J.P.; et al. A Core Gut Microbiome in Obese and Lean Twins. Nature 2009, 457, 480–484. [Google Scholar] [CrossRef]
  19. Califf, K.; Gonzalez, A.; Knight, R.; Caporaso, J.G. The Human Microbiome: Getting Personal. Microbe 2014, 9, 410–415. [Google Scholar]
  20. Baumert, J.; Meisinger, C.; Lukaschek, K.; Emeny, R.T.; Rückert, I.M.; Kruse, J.; Ladwig, K.H. A Pattern of Unspecific Somatic Symptoms as Long-Term Premonitory Signs of Type 2 Diabetes: Findings from the Population-Based MONICA/KORA Cohort Study, 1984–2009. BMC Endocr. Disord. 2014, 14, 87. [Google Scholar] [CrossRef]
  21. Appels, A.; Mulder, P. Excess Fatigue as a Precursor of Myocardial Infarction. Eur. Heart J. 1988, 9, 758–764. [Google Scholar] [CrossRef]
  22. Willems, A.E.M.; Sura-de Jong, M.; van Beek, A.P.; van Dijk, G. Self-Initiated Dietary Changes Reduce General Somatic and Mental Symptoms in a Relatively Healthy Dutch Population. Prev. Med. Rep. 2022, 30, 102004. [Google Scholar] [CrossRef] [PubMed]
  23. National Collaborating Centre for Mental Health (UK). Depression: The Treatment and Management of Depression in Adults (Updated Edition); British Psychological Society: Leicester, UK, 2010. [Google Scholar]
  24. Bekhuis, E.; Boschloo, L.; Rosmalen, J.G.M.; de Boer, M.K.; Schoevers, R.A. The Impact of Somatic Symptoms on the Course of Major Depressive Disorder. J. Affect. Disord. 2016, 205, 112–118. [Google Scholar] [CrossRef] [PubMed]
  25. Angermann, C.E.; Ertl, G. Depression, Anxiety, and Cognitive Impairment. Curr. Heart Fail. Rep. 2018, 15, 398–410. [Google Scholar] [CrossRef] [PubMed]
  26. Kaul, K.; Tarr, J.M.; Ahmad, S.I.; Kohner, E.M.; Chibber, R. Introduction to Diabetes Mellitus. In Advances in Experimental Medicine and Biology; Springer: New York, NY, USA, 2013; pp. 1–11. [Google Scholar]
  27. Creed, F.H.; Davies, I.; Jackson, J.; Littlewood, A.; Chew-Graham, C.; Tomenson, B.; Macfarlane, G.; Barsky, A.; Katon, W.; McBeth, J. The Epidemiology of Multiple Somatic Symptoms. J. Psychosom. Res. 2012, 72, 311–317. [Google Scholar] [CrossRef] [PubMed]
  28. Lovibond, P.F.; Lovibond, S.H. The Structure of Negative Emotional States: Comparison of the Depression Anxiety Stress Scales (DASS) with the Beck Depression and Anxiety Inventories. Behav. Res. Ther. 1995, 33, 335–343. [Google Scholar] [CrossRef]
  29. de Beurs, E.; VanDyck, R.; Marquenie, L.A.; Lange, A.; Blonk, R.W.B.; de Beurs, E.; van Dyck, R.; Marquenie, L.A.; Lange, A.; Blonk, R.W.B. De DASS: Een Vragenlijst Voor Het Meten van Depressie, Angst En Stress. Gedragstherapie 2001, 34, 35–53. [Google Scholar]
  30. Kroenke, K.; Spitzer, R.L.; Williams, J.B.W. The PHQ-15: Validity of a New Measure for Evaluating the Severity of Somatic Symptoms. Psychosom. Med. 2002, 64, 258–266. [Google Scholar] [CrossRef]
  31. Andersen, L.G.; Aadahl, M.; Groenvold, M.; Jørgensen, T. Construct Validity of a Revised Physical Activity Scale and Testing by Cognitive Interviewing. Scand. J. Public Health 2010, 38, 707–714. [Google Scholar] [CrossRef]
  32. Dekker, L.H.; Rijnks, R.H.; Strijker, D.; Navis, G.J. A Spatial Analysis of Dietary Patterns in a Large Representative Population in the North of The Netherlands—The Lifelines Cohort Study. Int. J. Behav. Nutr. Phys. Act. 2017, 14, 166. [Google Scholar] [CrossRef]
  33. Klindworth, A.; Pruesse, E.; Schweer, T.; Peplies, J.; Quast, C.; Horn, M.; Glöckner, F.O. Evaluation of General 16S Ribosomal RNA Gene PCR Primers for Classical and Next-Generation Sequencing-Based Diversity Studies. Nucleic Acids Res. 2013, 41, e1. [Google Scholar] [CrossRef]
  34. Willems, A.E.M.; Sura–de Jong, M.; van Beek, A.P.; Nederhof, E.; van Dijk, G. Effects of Macronutrient Intake in Obesity: A Meta-Analysis of Low-Carbohydrate and Low-Fat Diets on Markers of the Metabolic Syndrome. Nutr. Rev. 2020, 79, 429–444. [Google Scholar] [CrossRef] [PubMed]
  35. Ze, X.; Duncan, S.H.; Louis, P.; Flint, H.J. Ruminococcus Bromii Is a Keystone Species for the Degradation of Resistant Starch in the Human Colon. ISME J. 2012, 6, 1535–1543. [Google Scholar] [CrossRef] [PubMed]
  36. Hughes, R.L.; Horn, W.H.; Finnegan, P.; Newman, J.W.; Marco, M.L.; Keim, N.L.; Kable, M.E. Resistant Starch Type 2 from Wheat Reduces Postprandial Glycemic Response with Concurrent Alterations in Gut Microbiota Composition. Nutrients 2021, 13, 645. [Google Scholar] [CrossRef] [PubMed]
  37. Blaak, E.E.; Canfora, E.E.; Theis, S.; Frost, G.; Groen, A.K.; Mithieux, G.; Nauta, A.; Scott, K.; Stahl, B.; van Harsselaar, J.; et al. Short Chain Fatty Acids in Human Gut and Metabolic Health. Benef. Microbes 2020, 11, 411–455. [Google Scholar] [CrossRef]
  38. Dong, Y.; Wang, P.; Yang, X.; Chen, M.; Li, J. Potential of Gut Microbiota for Lipopolysaccharide Biosynthesis in European Women with Type 2 Diabetes Based on Metagenome. Front. Cell Dev. Biol. 2022, 10, 1027413. [Google Scholar] [CrossRef]
  39. Yuan, X.; Chen, R.; McCormick, K.L.; Zhang, Y.; Lin, X.; Yang, X. The Role of the Gut Microbiota on the Metabolic Status of Obese Children. Microb. Cell Fact. 2021, 20, 53. [Google Scholar] [CrossRef]
  40. Ning, L.; Zhou, Y.-L.; Sun, H.; Zhang, Y.; Shen, C.; Wang, Z.; Xuan, B.; Zhao, Y.; Ma, Y.; Yan, Y.; et al. Microbiome and Metabolome Features in Inflammatory Bowel Disease via Multi-Omics Integration Analyses across Cohorts. Nat. Commun. 2023, 14, 7135. [Google Scholar] [CrossRef]
  41. Backer Mortensen, T. Ultra-Processed Foods and the Intestinal Bacterial Flora? Kompass Nutr. Diet. 2022, 2, 29–30. [Google Scholar] [CrossRef]
  42. de Cuevillas, B.; Riezu-Boj, J.I.; Abete, I.; Zulet, M.A.; Galarregui, C.; Gonzalez-Navarro, C.J.; Milagro, F.I.; Martínez, J.A.; Navas-Carretero, S. Possible Metabolic Interplay between Quality of Life and Fecal Microbiota in a Presenior Population: Preliminary Results. Nutrition 2022, 103–104, 111841. [Google Scholar] [CrossRef]
  43. Golloso-Gubat, M.J.; Ducarmon, Q.R.; Tan, R.C.A.; Zwittink, R.D.; Kuijper, E.J.; Nacis, J.S.; Santos, N.L.C. Gut Microbiota and Dietary Intake of Normal-Weight and Overweight Filipino Children. Microorganisms 2020, 8, 1015. [Google Scholar] [CrossRef]
  44. Paoli, A.; Mancin, L.; Bianco, A.; Thomas, E.; Mota, J.F.; Piccini, F. Ketogenic Diet and Microbiota: Friends or Enemies? Genes 2019, 10, 534. [Google Scholar] [CrossRef] [PubMed]
  45. Wang, Y.; Fan, D.; Zhang, Y.; Wang, J.; Dong, L.; Hu, Y.; Wang, S. Long-Term Exposure to Advanced Lipid Peroxidation End Products Impairs Cognitive Function through Microbiota-Gut-Brain Axis. Food Chem. 2024, 461, 140864. [Google Scholar] [CrossRef] [PubMed]
  46. Jian, C.; Luukkonen, P.; Sädevirta, S.; Yki-Järvinen, H.; Salonen, A. Impact of Short-Term Overfeeding of Saturated or Unsaturated Fat or Sugars on the Gut Microbiota in Relation to Liver Fat in Obese and Overweight Adults. Clin. Nutr. 2021, 40, 207–216. [Google Scholar] [CrossRef] [PubMed]
  47. Depommier, C.; Everard, A.; Druart, C.; Plovier, H.; Van Hul, M.; Vieira-Silva, S.; Falony, G.; Raes, J.; Maiter, D.; Delzenne, N.M.; et al. Supplementation with Akkermansia Muciniphila in Overweight and Obese Human Volunteers: A Proof-of-Concept Exploratory Study. Nat. Med. 2019, 25, 1096–1103. [Google Scholar] [CrossRef]
  48. Cani, P.D.; de Vos, W.M. Next-Generation Beneficial Microbes: The Case of Akkermansia Muciniphila. Front. Microbiol. 2017, 8, 1765. [Google Scholar] [CrossRef]
  49. Liu, R.; Hong, J.; Xu, X.; Feng, Q.; Zhang, D.; Gu, Y.; Shi, J.; Zhao, S.; Liu, W.; Wang, X.; et al. Gut Microbiome and Serum Metabolome Alterations in Obesity and after Weight-Loss Intervention. Nat. Med. 2017, 23, 859–868. [Google Scholar] [CrossRef]
  50. Dao, M.C.; Everard, A.; Aron-Wisnewsky, J.; Sokolovska, N.; Prifti, E.; Verger, E.O.; Kayser, B.D.; Levenez, F.; Chilloux, J.; Hoyles, L.; et al. Akkermansia Muciniphila and Improved Metabolic Health during a Dietary Intervention in Obesity: Relationship with Gut Microbiome Richness and Ecology. Gut 2016, 65, 426–436. [Google Scholar] [CrossRef]
  51. Brahe, L.K.; Le Chatelier, E.; Prifti, E.; Pons, N.; Kennedy, S.; Hansen, T.; Pedersen, O.; Astrup, A.; Ehrlich, S.D.; Larsen, L.H. Specific Gut Microbiota Features and Metabolic Markers in Postmenopausal Women with Obesity. Nutr. Diabetes 2015, 5, e159. [Google Scholar] [CrossRef]
  52. Zhang, X.; Shen, D.; Fang, Z.; Jie, Z.; Qiu, X.; Zhang, C.; Chen, Y.; Ji, L. Human Gut Microbiota Changes Reveal the Progression of Glucose Intolerance. PLoS ONE 2013, 8, e71108. [Google Scholar] [CrossRef]
  53. Yassour, M.; Lim, M.Y.; Yun, H.S.; Tickle, T.L.; Sung, J.; Song, Y.-M.; Lee, K.; Franzosa, E.A.; Morgan, X.C.; Gevers, D.; et al. Sub-Clinical Detection of Gut Microbial Biomarkers of Obesity and Type 2 Diabetes. Genome Med. 2016, 8, 17. [Google Scholar] [CrossRef]
  54. Li, J.; Zhao, F.; Wang, Y.; Chen, J.; Tao, J.; Tian, G.; Wu, S.; Liu, W.; Cui, Q.; Geng, B.; et al. Gut Microbiota Dysbiosis Contributes to the Development of Hypertension. Microbiome 2017, 5, 14. [Google Scholar] [CrossRef] [PubMed]
  55. Liu, X.; Mao, B.; Gu, J.; Wu, J.; Cui, S.; Wang, G.; Zhao, J.; Zhang, H.; Chen, W. Blautia—A New Functional Genus with Potential Probiotic Properties? Gut Microbes 2021, 13, 1875796. [Google Scholar] [CrossRef] [PubMed]
  56. Holzhausen, E.A.; Malecki, K.C.; Sethi, A.K.; Gangnon, R.; Cadmus-Bertram, L.; Deblois, C.L.; Suen, G.; Safdar, N.; Peppard, P.E. Assessing the Relationship between Physical Activity and the Gut Microbiome in a Large, Population-Based Sample of Wisconsin Adults. PLoS ONE 2022, 17, e0276684. [Google Scholar] [CrossRef] [PubMed]
  57. Kaczmarczyk, M.; Szulińska, M.; Łoniewski, I.; Kręgielska-Narożna, M.; Skonieczna-Żydecka, K.; Kosciolek, T.; Bezshapkin, V.; Bogdański, P. Treatment With Multi-Species Probiotics Changes the Functions, Not the Composition of Gut Microbiota in Postmenopausal Women With Obesity: A Randomized, Double-Blind, Placebo-Controlled Study. Front. Cell. Infect. Microbiol. 2022, 12. [Google Scholar] [CrossRef]
  58. Wegmann, U.; Louis, P.; Goesmann, A.; Henrissat, B.; Duncan, S.H.; Flint, H.J. Complete Genome of a New Firmicutes Species Belonging to the Dominant Human Colonic Microbiota (‘Ruminococcus bicirculans’) Reveals Two Chromosomes and a Selective Capacity to Utilize Plant Glucans. Environ. Microbiol. 2014, 16, 2879–2890. [Google Scholar] [CrossRef]
  59. Averina, O.V.; Zorkina, Y.A.; Yunes, R.A.; Kovtun, A.S.; Ushakova, V.M.; Morozova, A.Y.; Kostyuk, G.P.; Danilenko, V.N.; Chekhonin, V.P. Bacterial Metabolites of Human Gut Microbiota Correlating with Depression. Int. J. Mol. Sci. 2020, 21, 9234. [Google Scholar] [CrossRef]
  60. Duncan, S.H.; Belenguer, A.; Holtrop, G.; Johnstone, A.M.; Flint, H.J.; Lobley, G.E. Reduced Dietary Intake of Carbohydrates by Obese Subjects Results in Decreased Concentrations of Butyrate and Butyrate-Producing Bacteria in Feces. Appl. Environ. Microbiol. 2007, 73, 1073–1078. [Google Scholar] [CrossRef]
  61. Scott, K.P.; Gratz, S.W.; Sheridan, P.O.; Flint, H.J.; Duncan, S.H. The Influence of Diet on the Gut Microbiota. Pharmacol. Res. 2013, 69, 52–60. [Google Scholar] [CrossRef]
  62. Flint, H.J.; Scott, K.P.; Duncan, S.H.; Louis, P.; Forano, E. Microbial Degradation of Complex Carbohydrates in the Gut. Gut Microbes 2012, 3, 289–306. [Google Scholar] [CrossRef]
  63. Choi, J.-Y.; Park, S.-J.; Lee, H.-J. Healthy and Unhealthy Dietary Patterns of Depressive Symptoms in Middle-Aged Women. Nutrients 2024, 16, 776. [Google Scholar] [CrossRef]
  64. Daïen, C.I.; Pinget, G.V.; Tan, J.K.; Macia, L. Detrimental Impact of Microbiota-Accessible Carbohydrate-Deprived Diet on Gut and Immune Homeostasis: An Overview. Front. Immunol. 2017, 8, 548. [Google Scholar] [CrossRef]
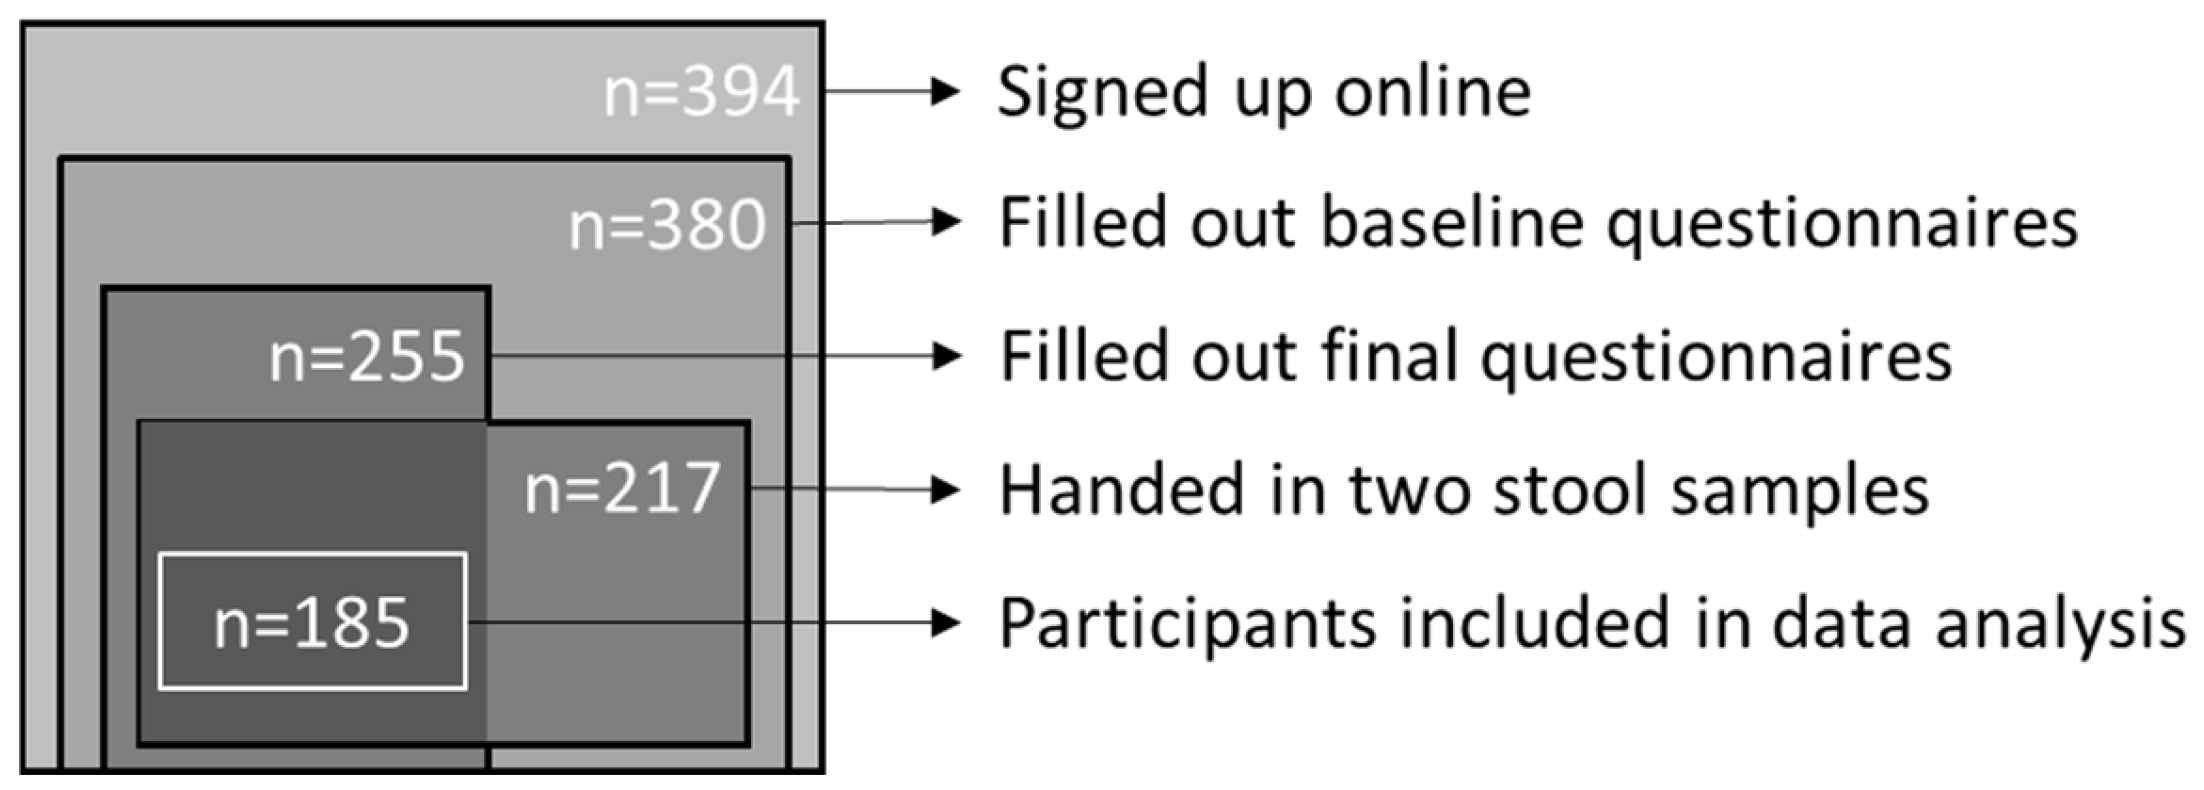
Figure 1. Flowchart visualizing the recruitment of participants.
Nutrients 16 03544 g001
Figure 2. Geographical distribution of Dutch participants based on municipality.
Nutrients 16 03544 g002
Figure 3. Dietary pattern scores at baseline and week 4 for (A) Processed foods, (B) Animal source foods, (C) Pescetarian, (D) Traditional Dutch, and (E) Party. ** p < 0.01 and *** p < 0.001.
Nutrients 16 03544 g003
Figure 4. Bacterial abundance of (A) Unclassified bacteria (%), (B) Peptostreptococcaceae (%), (C) Gemmiger formicilis (%), and (D) Rumminococcus bromii (%). at baseline and at week 4, ** p < 0.01 and *** p < 0.001.
Nutrients 16 03544 g004
Table 1. Baseline demographic, behavioral, and clinical characteristics of study participants.
Mean (SD)
Age (y)49.1 (14.9)
Gender, female (%)80.5
High education (%)70.3
Smokers, current (%)4.3
Diagnosed with depression (%)7.0
High/moderate scores depression (%)8.1
High/moderate scores anxiety (%)10.8
High/moderate scores stress (%)2.2
Probiotic use in the last 6 months (%)9.7
Antibiotic use in the last 6 months (%)21.1
High blood pressure diagnosis (%)8.1
Diabetes Type 2 diagnosis (%)2.7
High cholesterol diagnosis (%)7.6
Table 2. Dietary patterns identified by means of PCA and the factor loadings per food category.
Factor Loadings of Food Categories in Identified Dietary Patterns
Processed FoodsAnimal Source FoodsPescatarianTraditional DutchParty
Snacks0.754Fresh meat0.672Vegetables0.698Wholegrain
products
0.694Coffee0.732
Candy0.697Eggs0.565Nuts0.696Dairy0.545Alcohol0.551
Cookies0.648Fresh fish0.543Water0.490Tea0.523Processed fish
products
0.341
Sugar sweetened
beverages
0.474Processed meat
products
0.412Fruit0.432Processed meat
products
0.407Wine0.336
Refined grain
products
0.426Processed fish
products
0.363Processed fish
products
0.373Pasta, rice, and
potatoes
0.320Vegetables−0.219
Wine0.239Fruit−0.303Vegetarian meat
replacements
0.294Gluten-free bread
replacements
−0.471Tea−0.229
Pasta, rice, and
potatoes
0.210Wholegrain products−0.303Pasta, rice and
potatoes
0.240 Sugar sweetened beverages−0.242
Fruit−0.201Pasta, rice, and
potatoes
−0.326Fresh fish0.237 Water−0.407
Vegetarian meat
replacements
−0.549Candy0.210
Refined grain
products
−0.273
Sugar sweetened
beverages
−0.288
Table 3. Dietary macronutrient composition at baseline and at week 4.
BaselineWeek 4p a
Caloric intake (kcal)1798.3 (259.4)1733.3 (266.8)<0.001
Carbohydrate intake (en%)41.4 (3.6)40.4 (3.5)<0.001
Fat intake (en%)35.7 (1.6)36.0 (1.9)0.015
Protein intake (en%)17.0 (1.6)17.1 (1.5)0.096
Saturated fat intake (en%)12.5 (0.8)12.5 (0.9)0.375
Fiber intake (g)21.8 (2.9)21.6 (3.3)0.378
Carbohydrate intake (g)185.9 (29.9)174.9 (30.2)<0.001
Fat intake (g)76.8 (16.7)74.7 (16.3)<0.001
Protein intake (g)71.3 (9.8)69.2 (9.8)<0.001
en% = energy percentage, a Difference between baseline and week 4.
Table 4. Outcomes at baseline and at week 4.
nBaselinenWeek 4p a
Weight (kg)17574.2 (14.0)17473.7 (14.1)<0.001
BMI (kg/m2)17524.5 (4.3)17224.3 (4.3)<0.001
Waist circumference (cm)17489.3 (12.9)17888.7 (13.3)<0.001
DASS score18514.7 (13.9)1856.6 (8.7)<0.001
Depression score1855.2 (5.2)1852.3 (3.0)<0.001
Anxiety score1854.1 (4.5)1852.1 (3.1)<0.001
Stress score1855.2 (5.0)1852.2 (3.2)<0.001
PHQ-15 score1857.5 (4.8)1854.8 (3.9)<0.001
Activity pas-2 (METs/24 h)18041.0 (5.2)17740.9 (4.8)0.791
Shannon index1855.2 (0.7)1855.2 (0.7)0.422
Firmicutes/Bacteroidetes ratio1853.3 (1.7)1854.6 (15.8)0.251
a Difference between baseline and after week 4.
Table 5. Correlations of final gut microbiota abundance and final dietary intake.
BSEAdj. r2p
Species
Blautia obeum
Animal source foods0.0350.0120.040.004
Carbohydrate intake (en%)−0.0920.0280.050.001
Fat intake (en%)0.1450.0520.040.005
Saturated fat intake (en%)0.0300.1070.040.006
Ruminococcus bromii
Animal source foods−0.0670.0180.06<0.001
Carbohydrate intake (en%)0.1590.0440.06<0.001
Fat intake (en%)−0.2800.0790.060.001
Saturated fat intake (en%)−0.4760.1660.030.005
Fiber intake0.1810.0440.08<0.001
Carbohydrate intake (g)0.0210.0060.06<0.001
Bifidobacterium adolescentis
Pescatarian−0.0580.0170.050.001
Gracilibacter thermotolerans
Pescatarian0.0390.0130.070.003
Flintibacter butyricus
Pescatarian0.0210.0060.050.001
Akkermansia muciniphila
Saturated fat intake (en%)0.5910.1960.060.003
Genus
Prevotella
Saturated fat intake (en%)−1.2780.4080.070.002
Roseburia
Saturated fat intake (en%)−0.4780.1470.060.001
Family
Bacteroidaceae
Fat intake (en%)0.7090.2680.120.009
Saturated fat intake (en%)1.5140.5540.130.007
Erysipelotrichaceae
Fat intake (en%)0.2880.0960.100.003
Saturated fat intake (en%)0.6740.1980.11<0.001
Clostridiaceae
Saturated fat intake (en%)0.5830.2340.150.014
en% = energy percentage, B = Unstandardized beta, SE = standard error, and Adj. r2 = adjusted r2.
Table 6. Correlations between final health outcomes and final gut microbiota composition.
BSEAdj. r2p
Species
BMI
Eubacterium hallii1.4700.3360.14<0.001
Waist circumference
Eubacterium hallii3.1171.0380.190.003
Eubacterium rectale1.6030.4800.200.001
Genus
Stress symptoms
Prevotella0.1760.0510.12<0.001
BMI
Clostridium−0.5320.1140.15<0.001
Coprococcus0.6250.1680.11<0.001
Waist circumference
Clostridium−1.1820.3530.200.001
Coprococcus1.7430.5060.20<0.001
Unclassified Lachnospiraceae1.6300.4800.20<0.001
Family
BMI
Clostridiaceae−0.5420.1110.16<0.001
Erysipelotrichaceae−0.4650.1380.10<0.001
Lachnospiraceae0.1030.0360.080.005
Peptostreptococcaceae−0.5220.1430.11<0.001
Waist circumference
Clostridiaceae−1.2660.3430.21<0.001
B = Unstandardized beta, SE = standard error, and Adj. r2 = adjusted r2.
Disclaimer/Publisher’s Note: The statements, opinions and data contained in all publications are solely those of the individual author(s) and contributor(s) and not of MDPI and/or the editor(s). MDPI and/or the editor(s) disclaim responsibility for any injury to people or property resulting from any ideas, methods, instructions or products referred to in the content.