
Validation of Indirect Calorimetry in Children Undergoing Single-Limb Non-Invasive Ventilation: A Proof of Concept, Cross-Over Study

 , ,
, ,  , , ,
, , ,
Abstract
1. Introduction
2. Materials and Methods
2.1. Patients’ Enrollment
2.2. Measurements
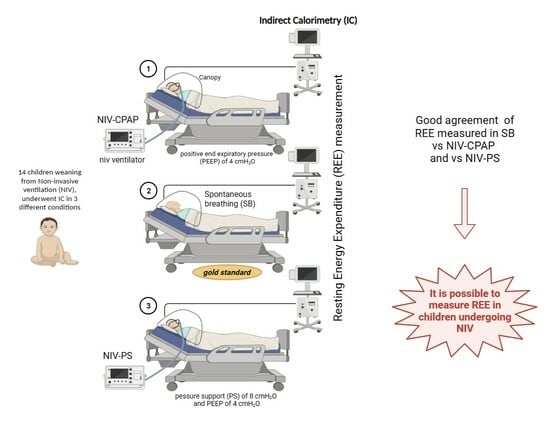
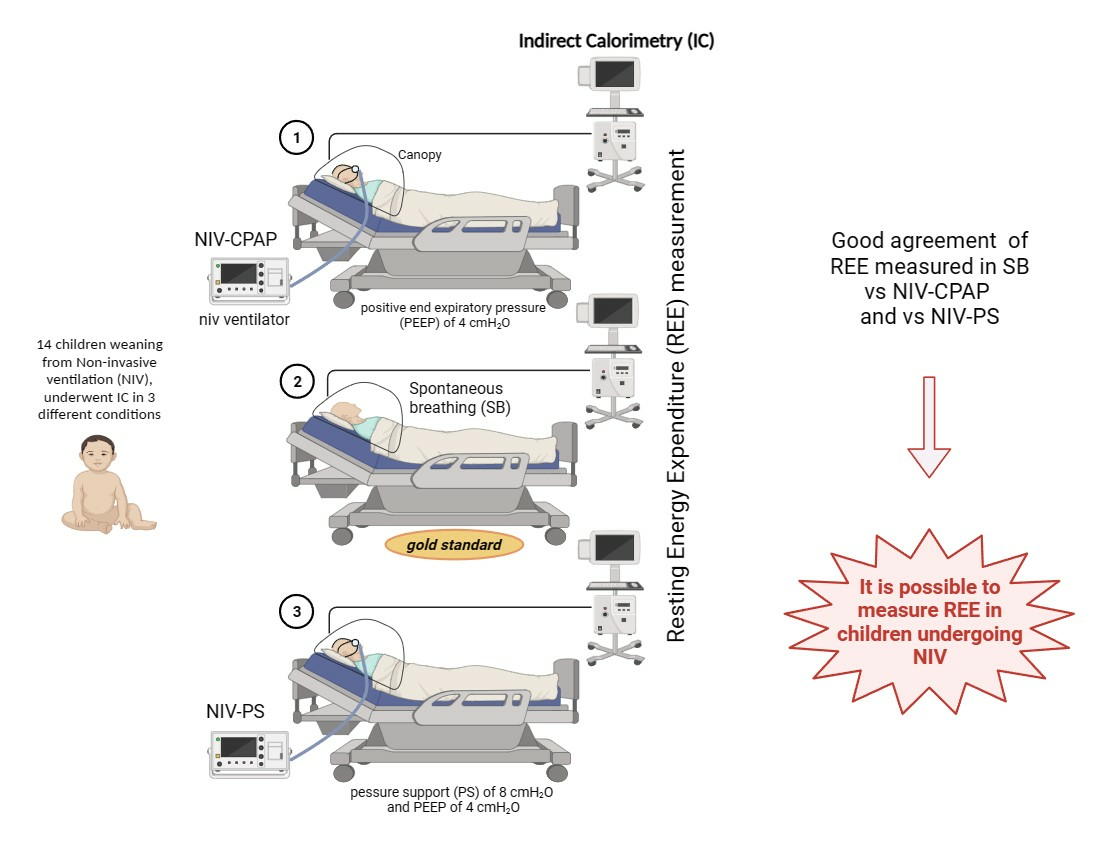
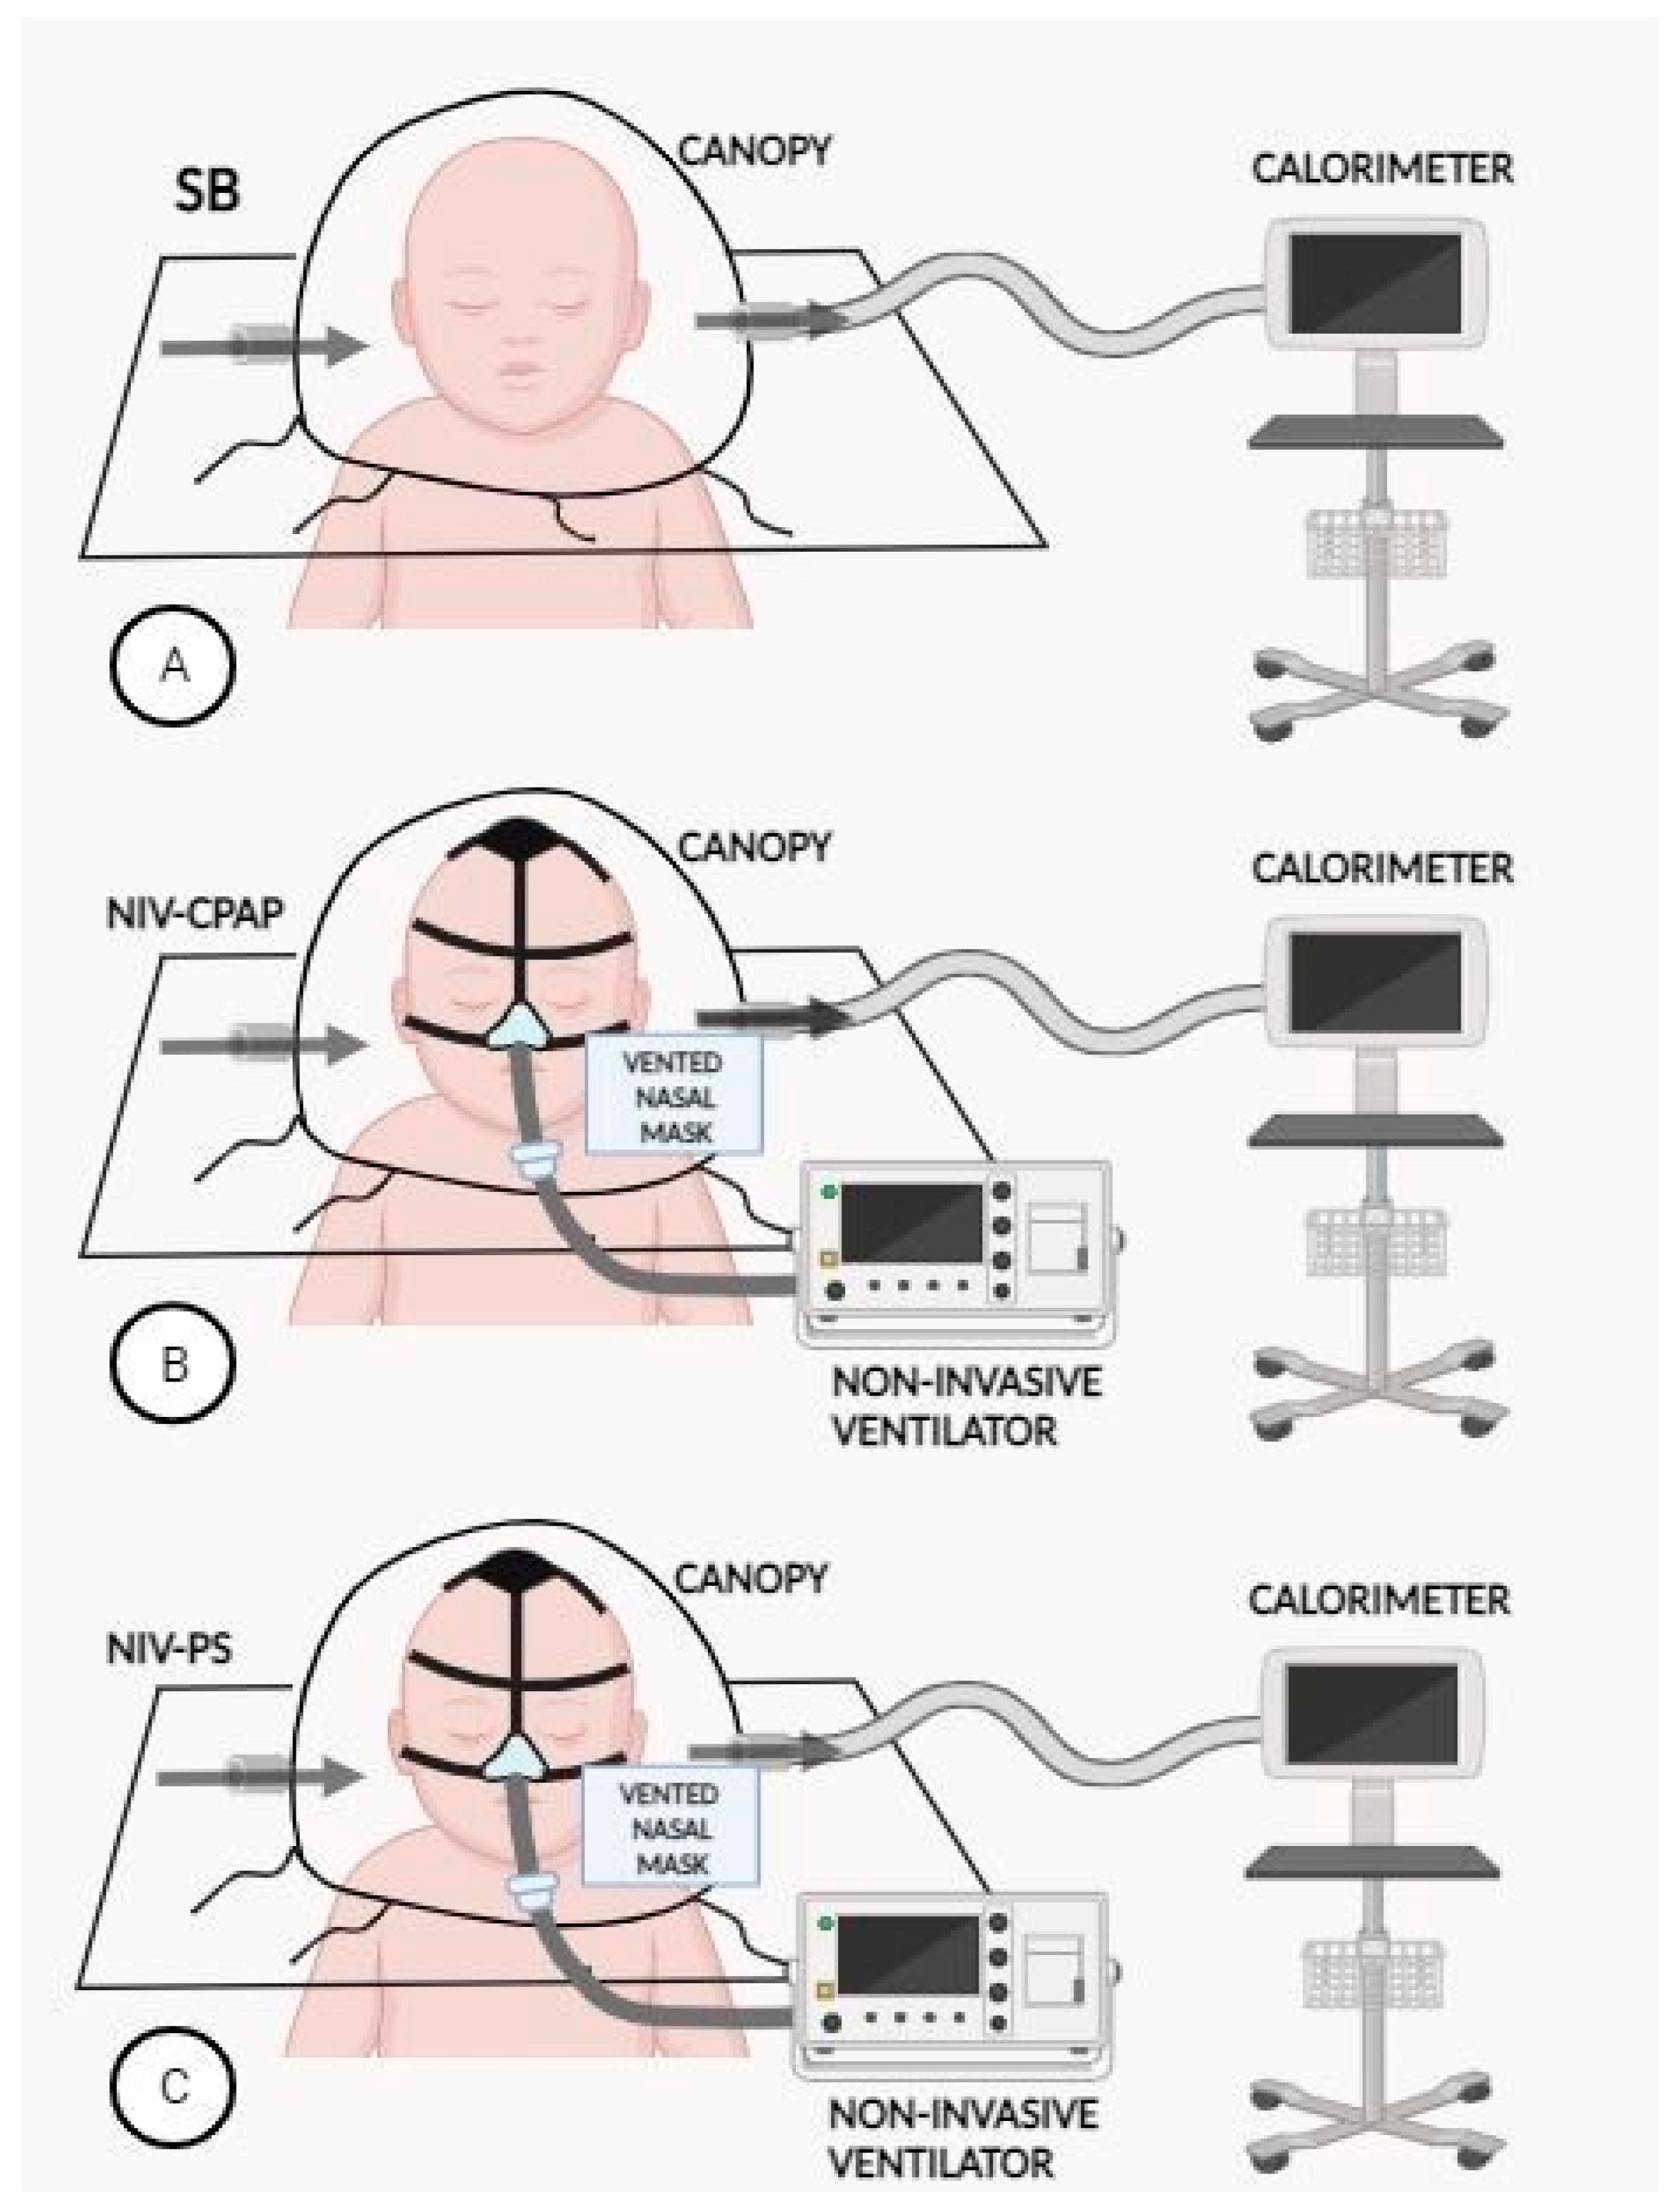
- Spontaneously breathing (gold standard).
- NIV-CPAP with a positive end expiratory pressure (PEEP) of 4 cmH2O: CPAP is applied via NIV, but no respiratory support is performed.
- NIV-PS with a pressure support (PS) of 8 cmH2O and a PEEP of 4 cmH2O: CPAP is applied via NIV with an additional inspiratory pressure support (PS).
2.3. Randomization
2.4. Statistical Analysis
2.5. Data Analysis
3. Results
4. Discussion
5. Conclusions
Author Contributions
Funding
Institutional Review Board Statement
Informed Consent Statement
Data Availability Statement
Acknowledgments
Conflicts of Interest
References
- De Cosmi, V.; Milani, G.P.; Mazzocchi, A.; D’Oria, V.; Silano, M.; Calderini, E.; Agostoni, C. The metabolic response to stress and infection in critically ill children: The opportunity of an individualized approach. Nutrients 2017, 9, 1032. [Google Scholar] [CrossRef]
- Mehta, N.M.; Skillman, H.E.; Irving, S.Y.; Coss-Bu, J.A.; Vermilyea, S.; Farrington, E.A.; McKeever, L.; Hall, A.M.; Goday, P.S.; Braunschweig, C. Guidelines for the provision and assessment of nutrition support therapy in the pediatric critically ill patient: Society of critical care medicine and American society for parenteral and enteral nutrition. Pediatr. Crit. Care Med. 2017, 18, 675–715. [Google Scholar] [CrossRef] [PubMed]
- Oshima, T.; Berger, M.M.; De Waele, E.; Guttormsen, A.B.; Heidegger, C.P.; Hiesmayr, M.; Singer, P.; Wernerman, J.; Pichard, C. Indirect calorimetry in nutritional therapy. A position paper by the ICALIC study group. Clin. Nutr. 2017, 36, 651–662. [Google Scholar] [CrossRef] [PubMed]
- van Puffelen, E.; Hulst, J.M.; Vanhorebeek, I.; Dulfer, K.; Van den Berghe, G.; Joosten, K.F.M.; Verbruggen, S.C.A.T. Effect of late versus early initiation of parenteral nutrition on weight deterioration during PICU stay: Secondary analysis of the PEPaNIC randomised controlled trial. Clin. Nutr. 2020, 39, 104–109. [Google Scholar] [CrossRef]
- Srinivasan, V.; Hasbani, N.R.; Mehta, N.M.; Irving, S.Y.; Kandil, S.B.; Allen, H.C.; Typpo, K.V.; Cvijanovich, N.Z.; Faustino, E.V.S.; Wypij, D.; et al. Heart and Lung Failure-Pediatric Insulin Titration (HALF-PINT) Study Investigators. Early Enteral Nutrition Is Associated with Improved Clinical Outcomes in Critically Ill Children: A Secondary Analysis of Nutrition Support in the Heart and Lung Failure-Pediatric Insulin Titration Trial. Pediatr. Crit. Care Med. 2020, 21, 213–221. [Google Scholar]
- Ventura, J.C.; Hauschild, D.B.; Barbosa, E.; Bresolin, N.L.; Kawai, K.; Mehta, N.M.; Moreno, Y.M.F. Undernutrition at PICU Admission Is Predictor of 60-Day Mortality and PICU Length of Stay in Critically Ill Children. J. Acad. Nutr. Diet. 2020, 120, 219–229. [Google Scholar] [CrossRef]
- Albadi, M.S.; Bookari, K. Is Undernutrition Associated with Deterioration of Outcomes in the Pediatric Intensive Care Unit (PICU): Systematic and Meta-Analysis Review. Front. Pediatr. 2022, 10, 769401. [Google Scholar] [CrossRef] [PubMed]
- Joosten, K.; Embleton, N.; Yan, W.; Senterre, T. ESPGHAN/ESPEN/ESPR/CSPEN working group on pediatric parenteral nutrition. ESPGHAN/ESPEN/ESPR/CSPEN guidelines on pediatric parenteral nutrition: Energy. Clin. Nutr. 2018, 37, 2309–2314. [Google Scholar] [CrossRef] [PubMed]
- Briassoulis, P.; Ilia, S.; Briassouli, E.; Briassoulis, G. External Validation with Accuracy Confounders of VCO2-Derived Predicted Energy Expenditure Compared to Resting Energy Expenditure Measured by Indirect Calorimetry in Mechanically Ventilated Children. Nutrients 2022, 14, 4211. [Google Scholar] [CrossRef]
- Ismail, J.; Bansal, A.; Jayashree, M.; Nallasamy, K.; Attri, S.V. Energy Balance in Critically Ill Children with Severe Sepsis Using Indirect Calorimetry: A Prospective Cohort Study. J. Pediatr. Gastroenterol. Nutr. 2019, 68, 868–873. [Google Scholar] [CrossRef]
- Sion-Sarid, R.; Cohen, J.; Houri, Z.; Singer, P. Indirect calorimetry: A guide for optimizing nutritional support in the critically ill child. Nutrition 2013, 29, 1094–1099. [Google Scholar] [CrossRef]
- Spolidoro, G.C.I.; D’Oria, V.; De Cosmi, V.; Milani, G.P.; Mazzocchi, A.; Akhondi-Asl, A.; Mehta, N.M.; Agostoni, C.; Calderini, E.; Grossi, E. Artificial Neural Network Algorithms to Predict Resting Energy Expenditure in Critically Ill Children. Nutrients 2021, 13, 3797. [Google Scholar] [CrossRef]
- Frankenfield, D.C.; Ashcraft, C.M. Estimating energy needs in nutrition support patients. J. Parenter. Enter. Nutr. 2011, 35, 563–570. [Google Scholar] [CrossRef] [PubMed]
- Guttormsen, A.B.; Pichard, C. Determining energy requirements in the ICU. Curr. Opin. Clin. Nutr. Metab. Care 2014, 17, 171–176. [Google Scholar] [CrossRef] [PubMed]
- Tilden, S.J.; Watkins, S.; Tong, T.K.; Jeevanandam, M. Measured energy expenditure in pediatric intensive care patients. Am. J. Dis. Child. 1989, 143, 490–492. [Google Scholar] [CrossRef]
- Haugen, H.A.; Chan, L.N.; Li, F. Indirect calorimetry: A practical guide for clinicians. Nutr. Clin. Pract. 2007, 22, 377–388. [Google Scholar] [CrossRef] [PubMed]
- Matarese, L.E. Indirect calorimetry: Technical aspects. J. Am. Diet. Assoc. 1997, 97, 154–160. [Google Scholar] [CrossRef]
- Mortamet, G.; Amaddeo, A.; Essouri, S.; Renolleau, S.; Emeriaud, G.; Fauroux, B. Interfaces for noninvasive ventilation in the acute setting in children. Paediatr. Respir. Rev. 2017, 23, 84–88. [Google Scholar] [CrossRef]
- Berlinski, A.; Velasco, J. Albuterol Delivery Efficiency in a Pediatric Model of Noninvasive Ventilation With a Single-Limb Circuit. Respir. Care 2019, 64, 1366–1370. [Google Scholar] [CrossRef]
- Sirala, W.; Noponem, T.; Olkkola, K.T.; Vuori, A.; Koivisto, M.; Hurme, S.; Aantaa, R. Validation of indirect calorimetry for measurement of energy expenditure in healthy volunteers undergoing pressure controlled non invasive ventilation support. J. Clin. Monit. Comput. 2012, 26, 37–43. [Google Scholar] [CrossRef]
- Georges, M.; Morélot-Panziniet, C.; Similowski, T.; Gonzalez-Bermejo, J. Noninvasive ventilation reduces energy expenditure in amyotrophic lateral sclerosis. BMC Pulm. Med. 2014, 14, 17. [Google Scholar] [CrossRef]
- Van DijK, M.; Peters, J.W.B.; Van Deventer, P.; Tibboel, D. The COMFORT Behavior Scale: A tool for assessing pain and sedation in infants. Am. J. Nurs. 2005, 105, 33–36. [Google Scholar] [CrossRef] [PubMed]
- Smallwood, C.D.; Mehta, N.M. Accuracy of gas exchange monitoring during noninvasive ventilation: An in vitro metabolic simulation. J. Parenter. Enteral Nutr. 2014, 38, 86–91. [Google Scholar] [CrossRef] [PubMed]
- Barle, H.; Söderberg, P.; Haegerstrand, C.; Markström, A. Bi-level positive airway pressure ventilation reduces the oxygen cost of breathing in long-standing post-polio patients on invasive home mechanical ventilation. Acta Anaesthesiol. Scand. 2005, 49, 197–202. [Google Scholar] [CrossRef] [PubMed]
- Azzari, C.; Baraldi, E.; Bonanni, P.; Bozzola, E.; Coscia, A.; Lanari, M.; Manzoni, P.; Mazzone, T.; Sandri, F.; Lisi Checcucci, G.; et al. Epidemiology and prevention of respiratory syncytial virus infections in children in Italy. Ital. J. Pediatr. 2021, 47, 198. [Google Scholar] [CrossRef] [PubMed]


| SB | NIV-CPAP | NIV-PS | |||||||
|---|---|---|---|---|---|---|---|---|---|
| HR (bt/min) | RR (bts/min) | SpO2 (%) | HR (bt/min) | RR (bts/min) | SpO2 (%) | HR (bt/min) | RR (bts/min) | SpO2 (%) | |
| n | 13 | 13 | 13 | 13 | 13 | 12 | 14 | 14 | 14 |
| 1 QT | 101.0 | 31.00 | 93.00 | 99.50 | 27.00 | 92.25 | 89.25 | 27.75 | 95.00 |
| Median | 140.0 | 40.00 | 93.00 | 130.0 | 36.00 | 94.00 | 118.0 | 36.00 | 95.00 |
| 3 QT | 171.5 | 56.00 | 96.00 | 160.0 | 62.00 | 95.75 | 150.3 | 59.50 | 98.00 |
| Mean | 138.1 | 43.00 | 94.15 | 129.2 | 43.38 | 94.17 | 123.2 | 43.07 | 95.71 |
| SD | 35.50 | 15.89 | 2.911 | 33.18 | 18.48 | 3.040 | 34.05 | 22.39 | 3.173 |
| SB vs. CPAP | p-Value | SB vs. PS | p-Value |
|---|---|---|---|
| HR (bt/min) | 0.02 | HR (bts/min) | 0.004 |
| RR (bts/min) | 1.0 | RR (bts/min) | 0.432 |
| SpO2 (%) | 0.90 | SpO2 (%) | 0.2445 |
| COMFORT-B | 0.82 | COMFORT-B | 0.24 |
| SB * | CPAP * | Paired t-Test | Bland–Altman Analysis | |||
|---|---|---|---|---|---|---|
| n | 12 | 12 | p-Value | BIAS | Lower LoA | Upper LoA |
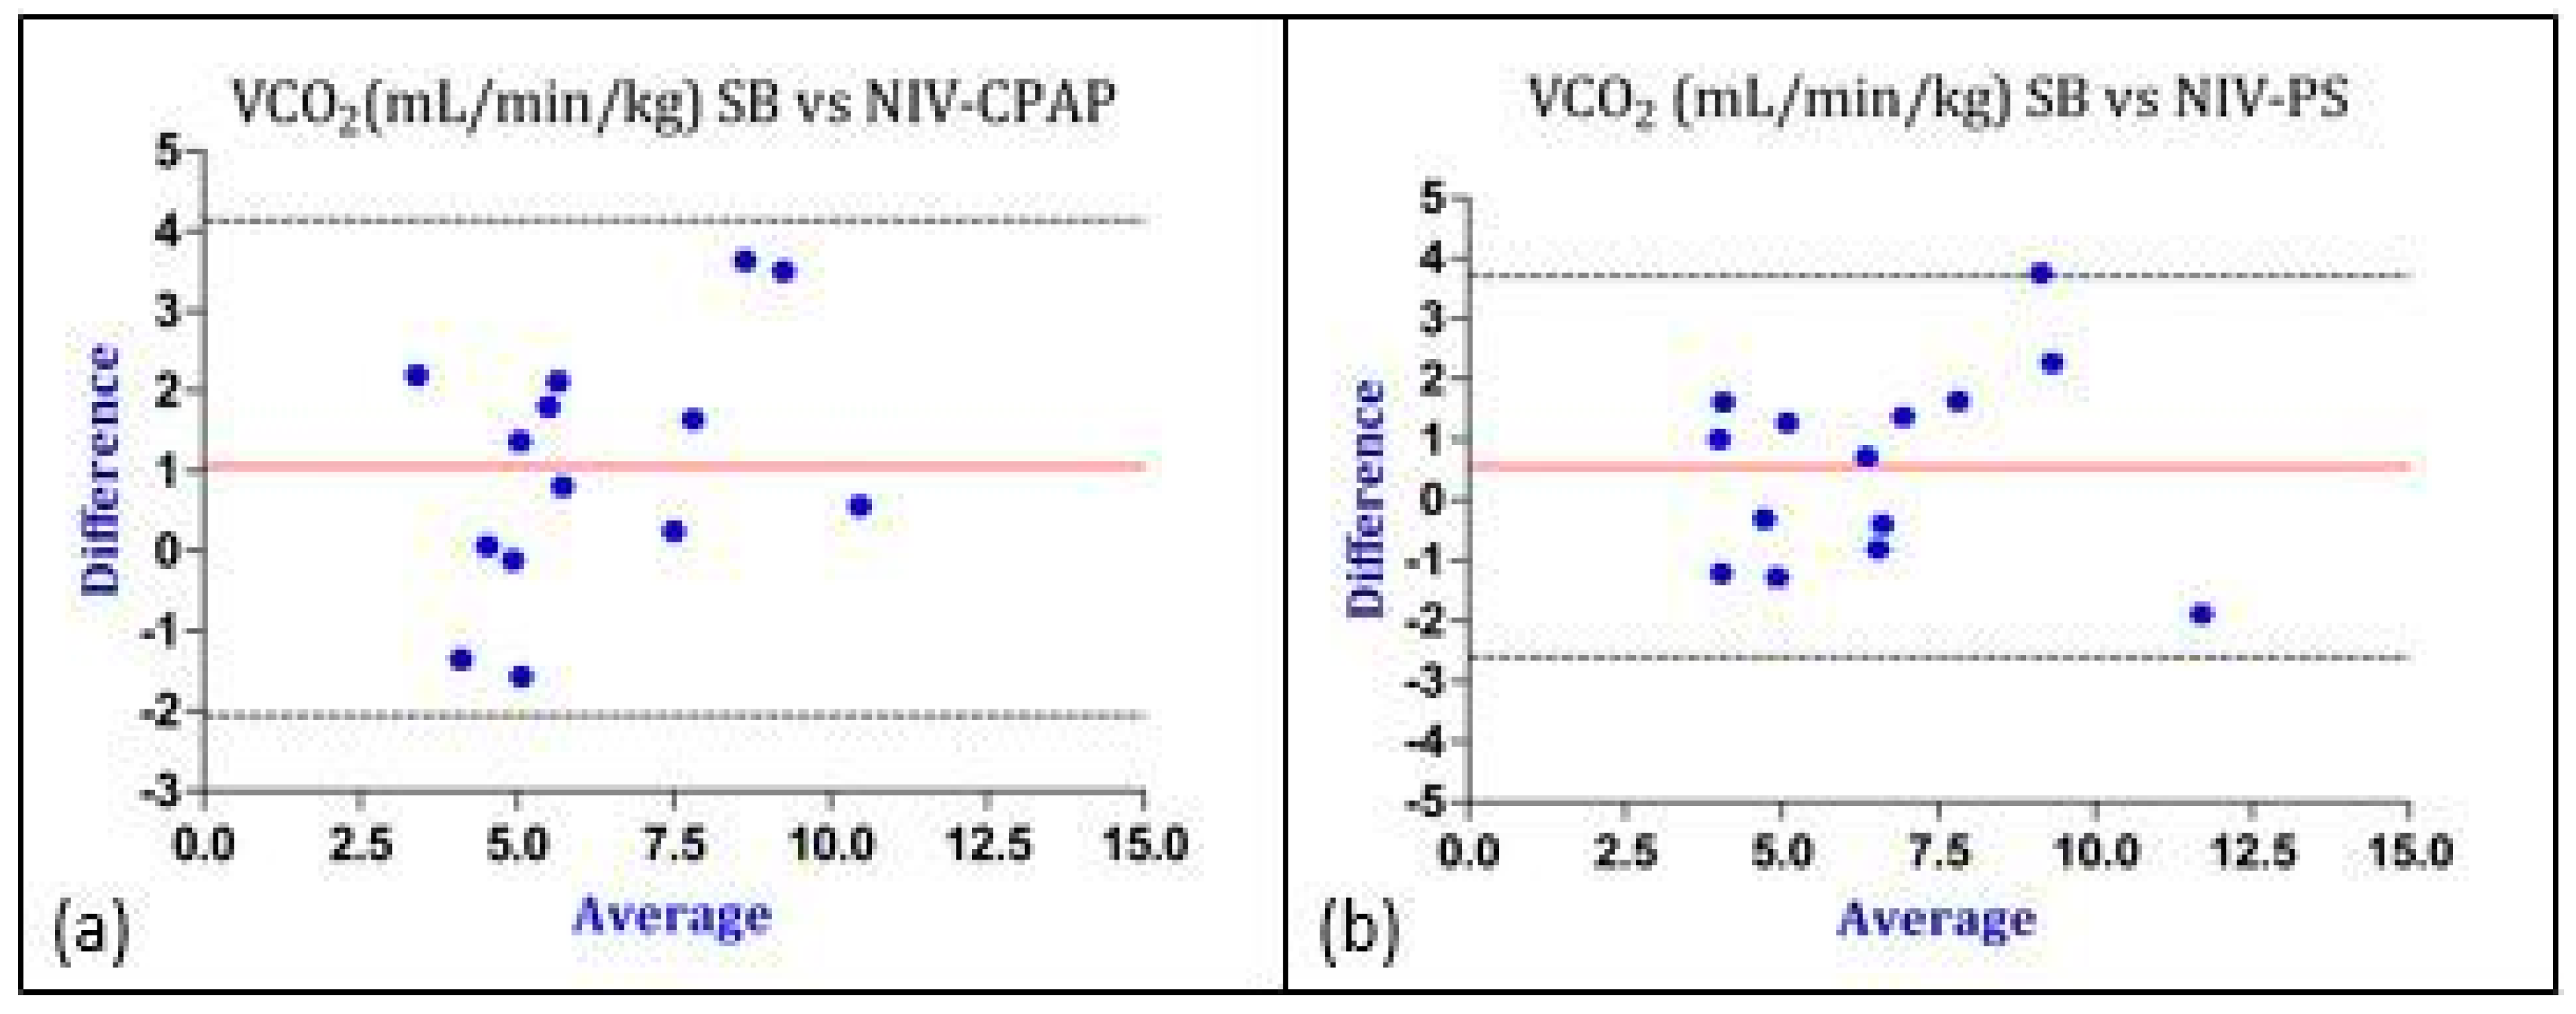
| VCO2 [mL/min/kg] | 6.8 ± 2.5 | 5.8 ± 1.9 | 0.03 | 1.06 | −2.02 | +4.14 |
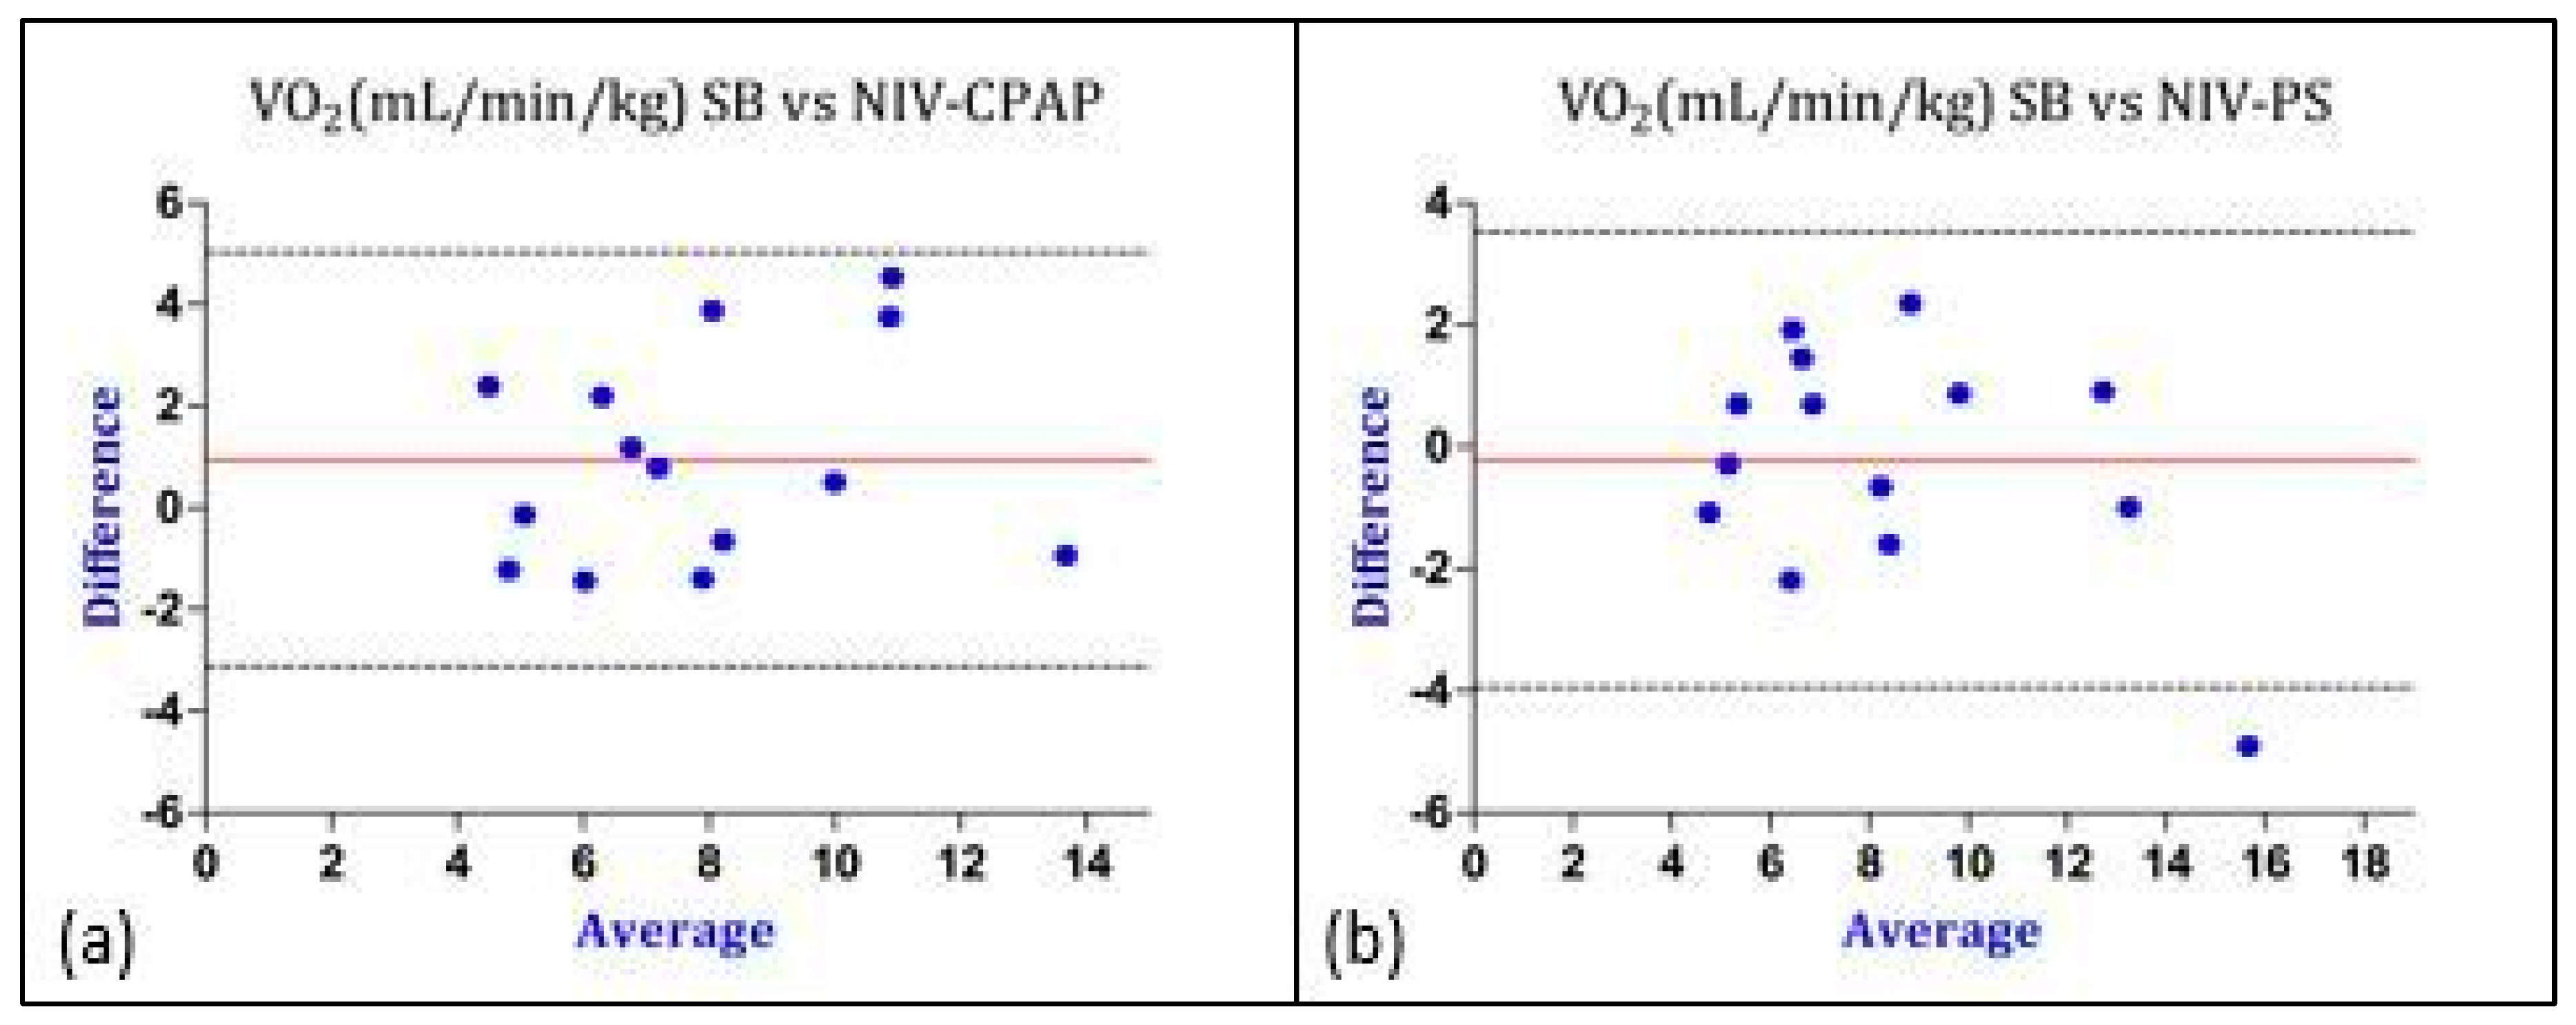
| VO2 [mL/min/kg] | 8.4 ± 3.1 | 7.4 ± 2.7 | 0.11 | 0.96 | −3.12 | +5.04 |
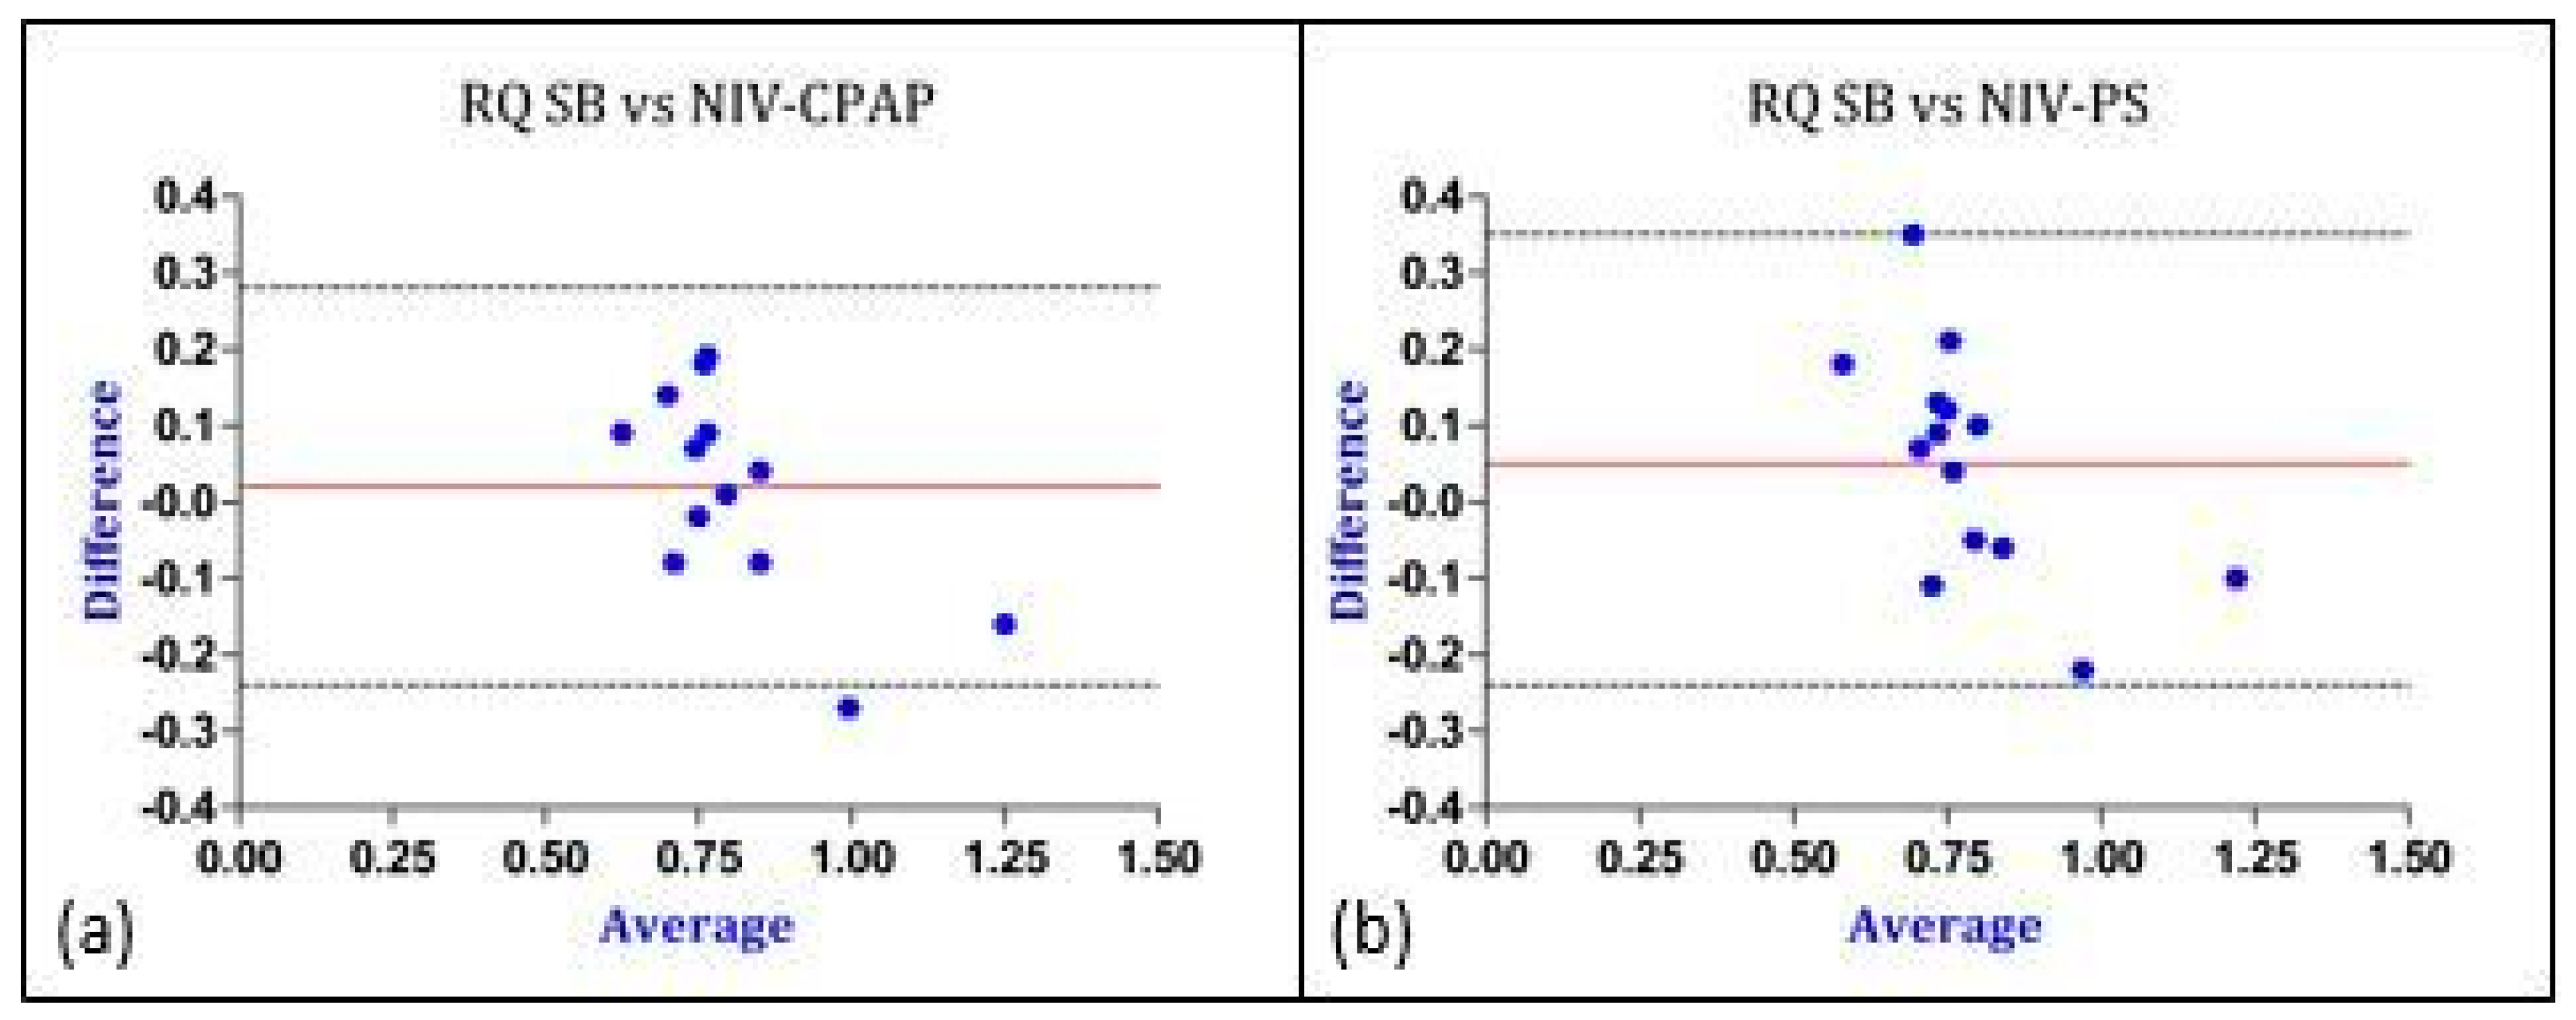
| RQ | 0.82 ± 0.1 | 0.80 ± 0.2 | 0.6 | 0.02 | −0.24 | +0.28 |
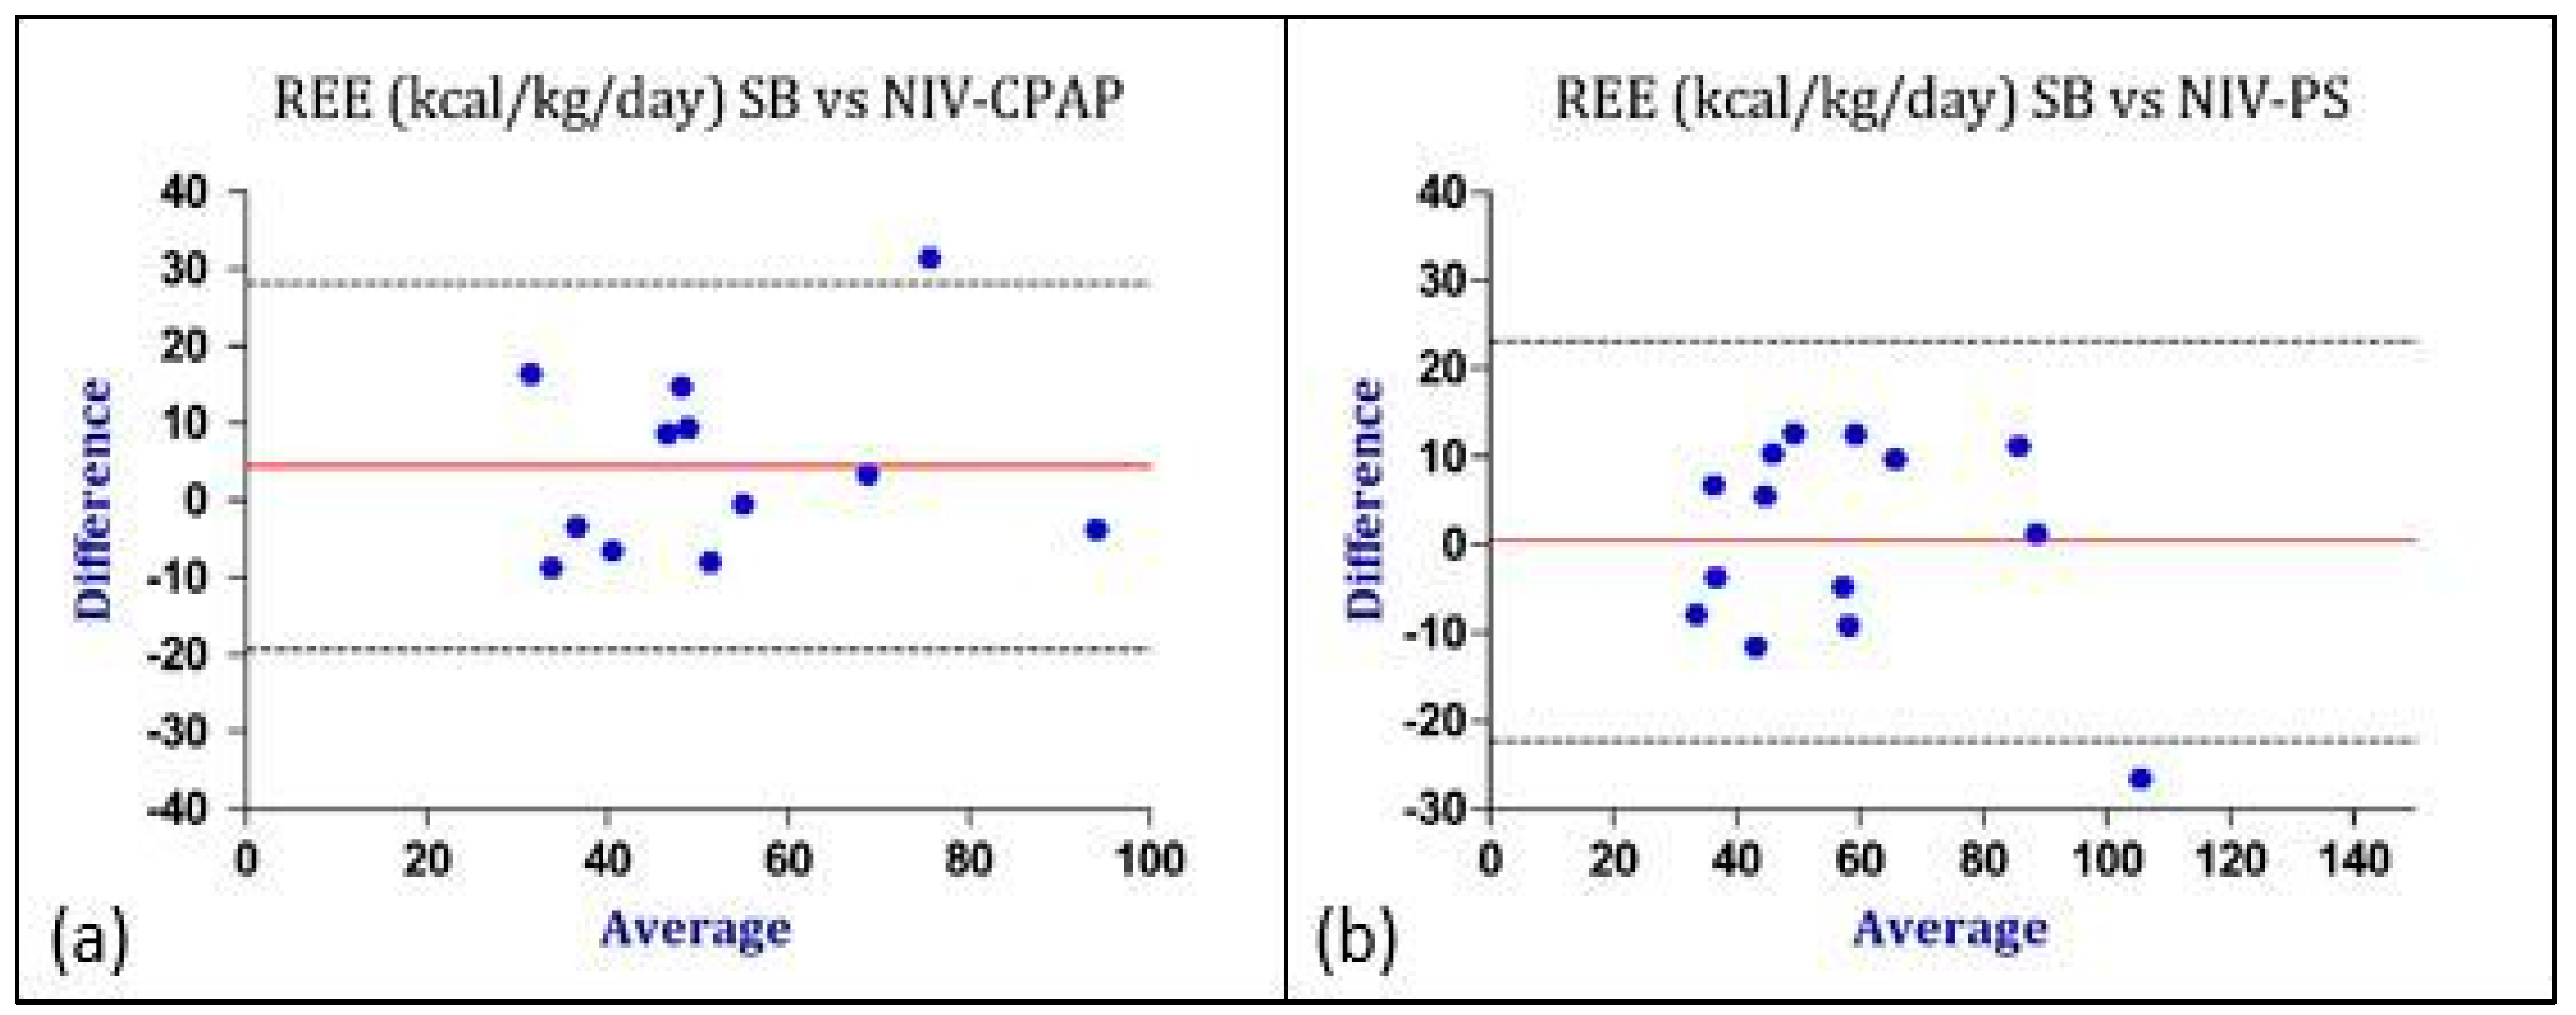
| REE [kcal/kg/day] | 58.04 ± 21.1 | 50.4 ± 18.5 | 0.23 | 4.41 | −19.4 | +28.23 |
| SB * | PS * | Paired t-Test | Bland–Altman Analysis | |||
|---|---|---|---|---|---|---|
| n | 14 | 14 | p-Value | BIAS | Lower LoA | Upper LoA |
| VCO2 [mL/min/kg] | 6.8 ± 2.5 | 6.2 ± 2.3 | 0.2 | 0.55 | −2.56 | +3.67 |
| VO2 [mL/min/kg] | 8.4 ± 3.1 | 8.6 ± 3.8 | 0.7 | −0.2 | −3.94 | +3.54 |
| RQ | 0.82 ± 0.1 | 0.76 ± 0.2 | 0.2 | 0.05 | −0.24 | +0.35 |
| REE [kcal/kg/day] | 58.04 ± 21.1 | 57.7 ± 23.9 | 0.9 | 0.4 | −22.23 | +23.07 |
Disclaimer/Publisher’s Note: The statements, opinions and data contained in all publications are solely those of the individual author(s) and contributor(s) and not of MDPI and/or the editor(s). MDPI and/or the editor(s) disclaim responsibility for any injury to people or property resulting from any ideas, methods, instructions or products referred to in the content. |
© 2024 by the authors. Licensee MDPI, Basel, Switzerland. This article is an open access article distributed under the terms and conditions of the Creative Commons Attribution (CC BY) license (https://creativecommons.org/licenses/by/4.0/).
Share and Cite
D’Oria, V.; Spolidoro, G.C.I.; Agostoni, C.V.; Montani, C.; Ughi, L.; Villa, C.; Marchesi, T.; Babini, G.; Scalia Catenacci, S.; Donà, G.; et al. Validation of Indirect Calorimetry in Children Undergoing Single-Limb Non-Invasive Ventilation: A Proof of Concept, Cross-Over Study. Nutrients 2024, 16, 230. https://doi.org/10.3390/nu16020230
D’Oria V, Spolidoro GCI, Agostoni CV, Montani C, Ughi L, Villa C, Marchesi T, Babini G, Scalia Catenacci S, Donà G, et al. Validation of Indirect Calorimetry in Children Undergoing Single-Limb Non-Invasive Ventilation: A Proof of Concept, Cross-Over Study. Nutrients. 2024; 16(2):230. https://doi.org/10.3390/nu16020230
Chicago/Turabian StyleD’Oria, Veronica, Giulia Carla Immacolata Spolidoro, Carlo Virginio Agostoni, Cinzia Montani, Ludovica Ughi, Cristina Villa, Tiziana Marchesi, Giovanni Babini, Stefano Scalia Catenacci, Giada Donà, and et al. 2024. "Validation of Indirect Calorimetry in Children Undergoing Single-Limb Non-Invasive Ventilation: A Proof of Concept, Cross-Over Study" Nutrients 16, no. 2: 230. https://doi.org/10.3390/nu16020230
APA StyleD’Oria, V., Spolidoro, G. C. I., Agostoni, C. V., Montani, C., Ughi, L., Villa, C., Marchesi, T., Babini, G., Scalia Catenacci, S., Donà, G., Guerrini, M., Chidini, G., Calderini, E., & Langer, T. (2024). Validation of Indirect Calorimetry in Children Undergoing Single-Limb Non-Invasive Ventilation: A Proof of Concept, Cross-Over Study. Nutrients, 16(2), 230. https://doi.org/10.3390/nu16020230