Abstract
Heyndrickxia coagulans (formerly Bacillus coagulans) has been increasingly utilized as an immunomodulatory probiotics. Oral administration of H. coagulans HOM5301 significantly boosted both innate and adaptive immunity in mice, particularly by increasing the phagocytic capacity of monocytes/macrophages. Lipoteichoic acid (LTA), a major microbe-associated molecular pattern (MAMP) in Gram-positive bacteria, exhibits differential immunomodulatory effects due to its structural heterogeneity. We extracted, purified, and characterized LTA from H. coagulans HOM5301. The results showed that HOM5301 LTA consists of a glycerophosphate backbone. Its molecular weight is in the range of 10–16 kDa. HOM5301 LTA induced greater productions of nitric oxide, TNFα, and IL-6 in RAW 264.7 macrophages compared to Staphylococcus aureus LTA. Comparative transcriptome and proteome analyses identified the differentially expressed genes and proteins triggered by HOM5301 LTA. KEGG analyses revealed that HOM5301 LTA transcriptionally and translationally activated macrophages through two immune-related pathways: cytokine–cytokine receptor interaction and phagosome formation. Protein–protein interaction network analysis indicated that the pro-inflammatory response elicited by HOM5301 LTA was TLR2-dependent, possibly requiring the coreceptor CD14, and is mediated via the MAPK and NF-kappaB pathways. Our results demonstrate that LTA is an important MAMP of H. coagulans HOM5301 that boosts immune responses, suggesting that HOM5301 LTA may be a promising immunoadjuvant.
1. Introduction
Heyndrickxia coagulans (formerly classified as Bacillus coagulans), an endospore-forming and lactic acid-producing bacterium, is considered an ideal probiotic [1]. Several strains of H. coagulans have been demonstrated to improve host health by modulating immune homeostasis [2,3,4]. Spores, cell components, including peptidoglycans, teichoic acids (TAs), flagella, and metabolites, such as exopolysaccharides and proteins, serve as microbe-associated molecular patterns (MAMPs) that interact with pattern-recognition receptors (PPRs) expressed on immune cells, such as monocytes, dendritic cells, and natural killer (NK) cells [5,6]. The interaction between an MAMP and a PPR can lead to either pro-inflammatory or anti-inflammatory responses in the host by regulating the expression of chemokines, cytokines, and other signaling molecules [7].
Lipoteichoic acid (LTA), a major and unique component of the cell wall of Gram-positive bacteria, is a macro-amphiphile characterized by a hydrophilic backbone, typically composed of a 1,3-phosphodiester-linked polymer of glycerol–phosphate or ribitol–phosphate, variously substituted with D-alanine or hexose. The lipophilic region generally consists of a glycolipid, often a diglucosyl-diacylglycerol [8]. LTA is considered an analogue of lipopolysaccharide (LPS) of Gram-negative bacteria due to its similar pathophysiological properties [9]. However, accumulating evidence indicates that LTA interacts with Toll-like receptor 2 (TLR2) and initiates innate immune responses, in contrast to LPS, which is recognized by TLR4 [10,11]. Notably, the immunomodulatory properties of LTA are genus-, species-, and strain-specific. For instance, the LTAs of three Apilactobacillus strains showed significantly higher IgA-inducing activity compared to Lactiplantibacillus plantarum JCM1149T and Lacticaseibacillus rhamnosus GG in murine Peyer’s patch cells [12]. LTAs derived from Lactiplantibacillus plantarum A3, Limosilactobacillus reuteri DMSZ 8533, and Lactobacillus acidophilus CICC 6074 exhibited distinct anti-inflammatory activities in LPS-stimulated macrophages [13]. Kim et al. evaluated the effects of LTAs isolated from Lactiplantibacillus plantarum (LpLTA) and Staphylococcus aureus (SaLTA) on chemokine (C–C motif) ligand 2 (CCL2) production in THP-1 cells. LpLTA significantly inhibited SaLTA-mediated CCL2 production via the TLR2 pathway [10]. Variations in the molecular structures of LTAs, such as the type and degree of substitution and the length of the backbone, result in diverse immunostimulatory activities [14].
In a previous study, we demonstrated that daily administration of H. coagulans HOM5301 for one month significantly enhanced both non-specific and specific immunity in mice, particularly the phagocytic capacity of monocytes/macrophages [15]. We hypothesized that LTA is a key molecule through which H. coagulans HOM5301 enhances immunity. This study investigated the immunomodulatory properties and potential molecular mechanisms of action of LTA derived from H. coagulans HOM5301 in macrophages. To this end, we examined the effects of LTA on the activation and pro-inflammatory functions of RAW 264.7 cells. Comparative transcriptome and proteome analyses were conducted to identify differentially expressed genes (DEGs) and proteins induced by LTA. Several immune-related pathways enriched by LTA were identified. We hope that our findings provide valuable insights for future studies on the immunomodulatory properties of H. coagulans and its LTA.
2. Materials and Methods
2.1. Materials and Chemicals
H. coagulans HOM5301 were deposited in the China General Microbiological Culture Collection Center (CGMCC; No. 20383) and cultured with De Man, Rogosa, and Sharpe media (MRS; Oxiod, Hants, UK) in a shaker at 200 rpm. The RAW 264.7 macrophages were purchased from the Cell Bank of the Chinese Academy of Sciences, and cultured in Dulbecco’s Modified Eagle’s Medium (DMEM; Thermo Fisher Scientific, Waltham, MA, USA) with 10% fetal bovine serum (FBS) and 1% streptomycin–penicillin solution. LPS (Cat. No. L2880) derived from Escherichia coli 055:B5 and SaLTA (Cat. No. L2515) were purchased from Sigma-Aldrich (Merck, Germany). MTS reagent, 3-(4,5-dimethylthiazol-2-yl)-5-(3-carboxymethoxyphenyl)-2-(4-sulfophenyl)-2H-tetrazolium, was purchased from Promega (Madison, WI, USA). The detection kit for nitric oxide (NO) was obtained from Nanjing Jiancheng Bioengineering Institute (Jiangsu, China). The Enzyme-linked immunosorbent assay (ELISA) kits for tumor necrosis factor α (TNFα), interleukin-6 (IL-6), and interleukin-10 (IL-10) were purchased from RayBiotech (Norcross, GA, USA).
2.2. Preparation of LTA
Extraction and purification of LTA were performed as described by Balaguer et al. [16], with some modifications. Overnight, H. coagulans HOM5301 cell cultures were centrifuged (6000× g, 20 min) and washed three times with 0.1 M Tris-HCl buffer. The bacterial pellet was resuspended in 0.1 M ammonium acetate buffer (pH 4.7) and mixed with an equal volume of n-butanol. The solution was incubated in a shaker at 37 °C and 200 rpm for 1 h, and then centrifuged at 12,000× g for 15 min. The aqueous phase containing LTA was retrieved and loaded onto a hydrophobic interaction chromatography column (octyl agarose gel CL-4B) that was pre-equilibrated with 0.1 M ammonium acetate buffer (pH 4.7). Subsequently, the column was eluted with 15% and 35% n-propanol solutions. Fractions containing LTA were identified using a phosphate-content-determination assay, using ammonium molybdate [17]. The phosphate-positive fractions eluted with 35% n-propanol were dialyzed at 4 °C for 72 h and freeze-dried for further use.
2.3. Characterization of LTA
The homogeneity of LTA was analyzed using high-performance liquid chromatography (HPLC) combined with a refractive index detector (RID) and a size-exclusion chromatography (SEC) column (BioCore SEC300, NanoChrom, Suzhou, China), according to the method described by Liu et al. [18]. The relative molecular weight was determined using matrix-assisted laser desorption ionization time-of-flight (MALDI-TOF) mass spectrometry (Bruker Ultraflextreme, Bremen, Germany). Two mass ranges (0–10,000 m/z and 10,000–100,000 m/z) were detected [16]. Fourier-transform infrared (FT-IR) spectroscopy and nuclear magnetic resonance (NMR) spectrometry were employed to identify the structure of LTA, as previously described [19,20]. Briefly, the transmission FT-IR spectra of LTA were collected 4000–400 cm−1 using a FT-IR spectrometer (Nicolet 6700, Thermo Fisher Scientific, Waltham, MA, USA), using the KBr pressed-disk method. 1H NMR spectra in D2O solvent were recorded using a Bruker AV-600 NMR spectrometer (Rheinstetten, Germany). SaLTA was used as a control.
2.4. Macrophage Proliferation Assay
Cell viability was determined using the MTS assay [21]. RAW 264.7 cells were seeded at 5.0 × 10⁵ cells/mL in 96-well plates with DMEM, supplemented with 10% FBS (v/v) and 1% penicillin–streptomycin solution, and incubated at 37 °C with 5% CO2 for 4 h. Then the spent culture medium was replaced with an increasing concentration of LTA (6.25, 12.5, 25, 50, 100, and 200 μg/mL) dissolved in fresh DMEM and incubated for another 24 h. After treatment, 20 μL of MTS reagent was added directly to the wells and incubated for another 4 h. The absorbance (optical density, OD) was measured at 490 nm using a microplate reader. LPS (1 μg/mL) and SaLTA (100 μg/mL) dissolved in complete DMEM were set as positive controls [9]. DPBS was set as a negative control (NC), and the proliferative activity was defined as 100%. Proliferative activity (%) = OD (sample)/OD (negative control) × 100%.
2.5. Macrophage Stimulation Assay
RAW 264.7 cells were seeded at 5.0 × 10⁵ cells/mL in 24-well plates with DMEM, supplemented with 10% FBS (v/v) and 1% penicillin–streptomycin solution, and incubated at 37 °C with 5% CO2 for 4 h. Then, the spent culture medium was replaced with an increasing concentration of LTA (25, 50, and 100 μg/mL) dissolved in complete DMEM, and incubated for another 24 h. LPS (1 μg/mL) and SaLTA (100 μg/mL) dissolved in complete DMEM were set as positive controls [9]. The culture supernatants were collected by centrifugation at 1500× g for 8 min. The NO content and three cytokines, TNFα, IL-6, and IL-10, were measured using detection kits, according to the manufacturer’s protocols.
2.6. Transcriptome and Proteome Analyses
RAW 264.7 cells were seeded at 5.0 × 10⁵ cells/mL in 6-well plates with complete DMEM, and incubated at 37 °C in a 5% CO2 environment for 4 h. The spent culture medium was then replaced with fresh complete DMEM containing 100 μg/mL of LTA, and incubated for another 24 h. Complete DMEM was used as a negative control. The cells were harvested and rinsed three times with DPBS. Total RNA was extracted using TRIzol reagent (TIANGEN, Beijing, China). The samples were sent to Majorbio Bio-Pharm Biotechnology Co., Ltd. (Shanghai, China) for RNA-seq and four-dimensional data-independent acquisition (4D-DIA) proteomic sequencing.
2.6.1. RNA-seq Data Processing and Analysis
RNA-seq experiments were performed using the Illumina NovaSeq X Plus platform (PE150) and NovaSeq Reagent Kit (San Diego, CA, USA). Quality-controlled reads were obtained by removing reads containing ploy-N and adapter, and low-quality reads (quality score < 20), using the fastp software (version 0.19.5) [22]. Then, processed reads were aligned to the Mus musculus reference genome in orientation mode using HISAT2 software [23]. The transcriptome of each sample was reassembled using StringTie version 2.1.2 [24]. Differential expression analysis was performed using DESeq2 software (version 1.24.0) [25]. The p-value was adjusted by the false discovery rate (FDR) < 0.05. A corrected p-value of 0.05 and a |log2-fold change| of 1 were selected as the default thresholds for the significant DEGs. The Kyoto Encyclopedia of Genes and Genomes (KEGG) database was employed to identify pathways that were significantly enriched by HOM5301 LTA treatment. Pathways were considered significantly enriched in DEGs when the p-adjust was less than 0.05.
2.6.2. Proteomic Data Processing and Analysis
The proteomic data obtained by liquid chromatography with tandem mass spectrometry (LC-MS-MS) were processed and analyzed using the online Majorbio Cloud Platform [26]. The MS/MS spectra were matched to the UniProt database. The abundance of each protein in each sample was normalized to the average abundance of the protein in all samples to obtain the relative protein abundance ratio for further analysis. Differential expression analysis was performed using Student’s t-test in R software (version 4.2.1) [27]. An adjusted p < 0.05 and a |log2FC| of ≥1 were set as the thresholds for the significant differentially expressed proteins (DEPs). The DEPs identified between the LTA and negative control groups were annotated using the KEGG database. Pathways were defined as significantly enriched in DEPs when the p-adjust was less than 0.05.
2.6.3. Protein–Protein Interaction Networks Analysis
The DEPs related to TLR and cytokine–cytokine interaction pathways were selected to construct a protein–protein interaction (PPI) network using the STRING database (STRING: functional protein association networks, http://string-db.org/, accessed on 10 April 2024.). The relative expression levels of several key node genes and proteins in the PPI network were randomly selected for statistical analysis, respectively.
2.7. Statistical Analysis
All values are presented as mean ± standard deviation. Statistical significance was determined using GraphPad Prism version 8. Significances between multiple groups were analyzed using one-way analysis of variance followed by the Tukey multiple comparison test. The significance between two groups was assessed using Student’s t-test. Statistical significance was determined at p < 0.05.
3. Results
3.1. Characterization of LTA
LTA from H. coagulans HOM5301 was purified using octyl agarose gel CL-4B, as described in the Methods section, and analyzed using HPLC-SEC-RID. A single concentrated peak was observed using HPLC, with LTA eluting from the column after approximately 11 min (Figure 1A).
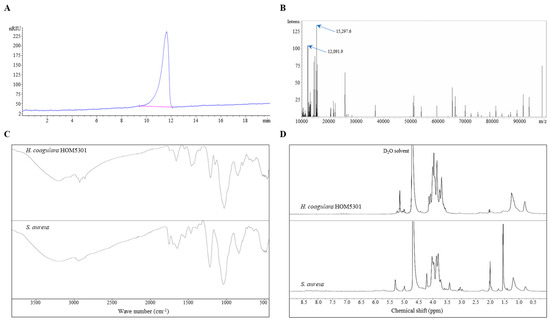
Figure 1.
Properties of LTA isolated from H. coagulans HOM5301. (A) HPLC-SEC-RID analysis of the purified LTA. (B) MALDI-TOF mass spectrum of purified LTA (10,000–100,000 m/z). (C) FT-IR spectra of purified LTA and SaLTA. (D) 1H-NMR spectra of purified LTA and SaLTA in D2O solvent (600 MHz).
The results of MALDI-TOF mass spectrometry showed that there was no significant response signal between 0 and 10,000 m/z, aside from the solvent peaks. However, characteristic peaks were primarily observed between 10,000–16,000 m/z in the 10,000–100,000 m/z range (Figure 1B).
A comparison between LTA and SaLTA is shown in Figure 1C. Several characteristic peaks of the two samples appeared at the same positions. The peak at 2920 cm−1 was attributed to the -OH group. The stretching vibration of the amide group was recorded at 1654 cm−1. The band at 1202 cm−1 corresponded to the vibration of the P=O bond. The bands at 1023 cm−1 indicated vibrations from amino acids, sugars, and other residues.
Figure 1D shows the 1H-NMR spectra of LTA and SaLTA. The major differences between the two proton NMR spectra were in the chemical shifts (δ)H = 1.5, 2.0, and 3.5–4.0. The singlet at δH = 5.1 was attributed to the -OH group. The -CH-group proton peak appeared at δH = 4.2. The 1H of the sugar residue showed a broad signal near 4.0 ppm. Peaks at 2.0–2.1 and 1.5 ppm were derived from the resonances of -CH2 and -CH3, respectively.
3.2. Influence on Macrophage Proliferation
The MTS assay was performed to measure the proliferative effect and cytotoxicity of LTA in macrophages, by determining cell viability (Figure 2). Compared to the negative control (NC), LTA significantly promoted macrophage proliferation at concentrations between 12.5 and 100 μg/mL. However, LTA showed a cytotoxic effect on macrophages at a concentration of 200 μg/mL. Therefore, three concentrations (25, 50, and 100 μg/mL) were selected to assess the immunostimulatory activity of LTA on macrophages.
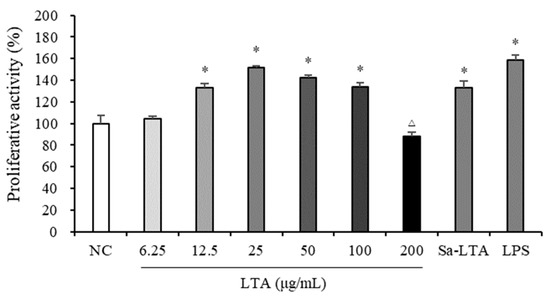
Figure 2.
Proliferative effects of LTA on macrophages. * indicates significantly higher than the negative control (NC) (p < 0.05); △ indicates significantly lower than the NC (p < 0.05).
3.3. Effects on Macrophage Stimulation
To evaluate the effect of LTA on macrophage stimulation, four indicators were measured: nitric oxide (NO), TNFα, IL-6, and IL-10 (Figure 3). The three tested concentrations of LTA (25, 50, and 100 μg/mL) showed similar abilities to promote NO production, comparable to 1 μg/mL LPS (p > 0.05), and significantly higher than 100 μg/mL SaLTA (p < 0.05). LTA increased TNFα expression in a dose-dependent manner, with both the 50 and 100 μg/mL concentrations inducing higher TNFα production than LPS (p < 0.05). Additionally, LTA induced greater secretion of TNFα than SaLTA (p < 0.05). While LTA increased the release of IL-6, it did so to a lesser extent than LPS. At the same concentration (100 μg/mL), LTA induced higher IL-6 production than SaLTA. In contrast, LTA did not significantly enhance the expression of the anti-inflammatory cytokine IL-10 compared to LPS or SaLTA. A concentration of 100 μg/mL was selected for further analyses.
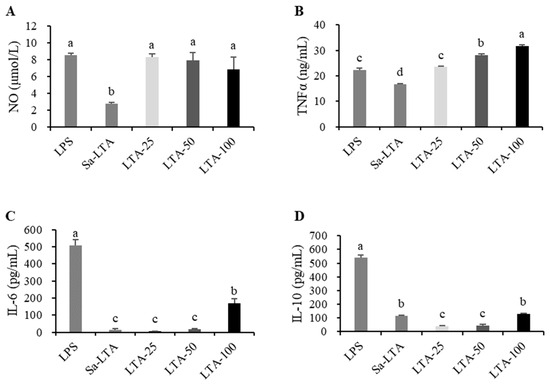
Figure 3.
Effects of LTA on the production of NO (A), TNFα (B), IL-6 (C), and IL-10 (D) in RAW 264.7 cells. The different letter labels on error bars represent statistically significant differences among the tested samples (p < 0.05).
3.4. Overall Analysis of Gene and Protein Expression
RNA-seq and 4D-DIA proteomic sequencing were employed to identify changes in gene and protein expression induced by LTA treatment in RAW 264.6 cells, and to further elucidate the molecular mechanisms underlying LTA’s immunomodulatory activities. At the gene-transcription level, 10,842 genes were co-transcribed in both the control and LTA-treated groups, while 818 genes were exclusively transcribed in the LTA-treated group (Figure 4A). The overall distribution of DEGs is displayed as a volcano plot in Figure 4C, revealing that LTA treatment up-regulated 2924 genes, and down-regulated 1826 genes.
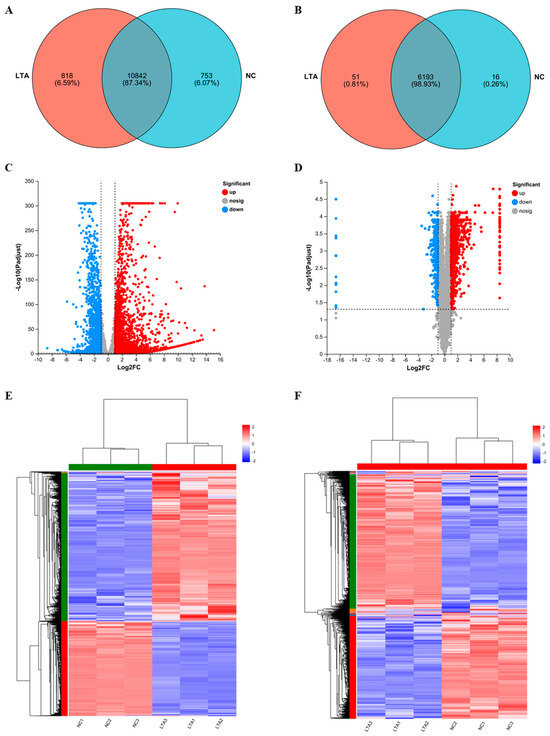
Figure 4.
Differential expression patterns of mRNAs and proteins between the negative control and LTA-treated RAW 264.7 macrophages. (A) Venn diagram of genes co-expressed between the NC and LTA-treated groups. (B) Venn diagram of proteins co-expressed between the NC and LTA-treated groups. (C) Volcano plot of all sequenced genes from the NC and LTA-treated groups. (D) Volcano plot of all sequenced proteins from the NC and LTA-treated groups. (E) Heat map of differentially expressed genes (DEGs) between the NC and LTA-treated groups. (F) Heat map of differentially expressed proteins (DEPs) between the NC and LTA-treated groups.
At the protein expression level, 6193 proteins were co-expressed in both groups, while 51 proteins were uniquely expressed in the LTA-treated group (Figure 4B). Moreover, 1111 DEPs were identified, as illustrated by the volcano plot in Figure 4D, with 843 up-regulated and 268 down-regulated by LTA. Heat maps were generated to display clusters of DEGs (Figure 4E) and DEPs (Figure 4F) between the NC and LTA-treated groups, demonstrating consistent clustering among those three biological replicates for each treatment.
3.5. Functional Enrichment Analysis of DEGs and DEPs
To investigate the implications of DEGs and DEPs, and to elucidate the potential regulatory mechanisms in LTA-exposed RAW 264.7 macrophages, KEGG functional enrichment analysis was performed. The LTA-treated macrophages exhibited 44 significantly enriched KEGG pathways based on DEGs (Figure 5A), while the NC group exhibited only nine significantly enriched KEGG pathways based on DEPs (Figure 5B). At the gene expression level, immune-related pathways including the nuclear factor-kappa B (NF-κB) signaling pathway, cytokine–cytokine receptor interaction, viral protein interaction with cytokine and cytokine receptors, the TNF signaling pathway, a phagosome, the IL-17 signaling pathway, and the phosphatidylinositol 3-kinase (PI3K)/protein kinase B (PKB/AKT) signaling pathway were significantly enriched (p-adjust < 0.05). At the protein-translation level, only two immune-related pathways, cytokine–cytokine receptor interaction and phagosomes, were significantly enriched (p-adjust < 0.05), consistent with the results observed at the gene expression level.
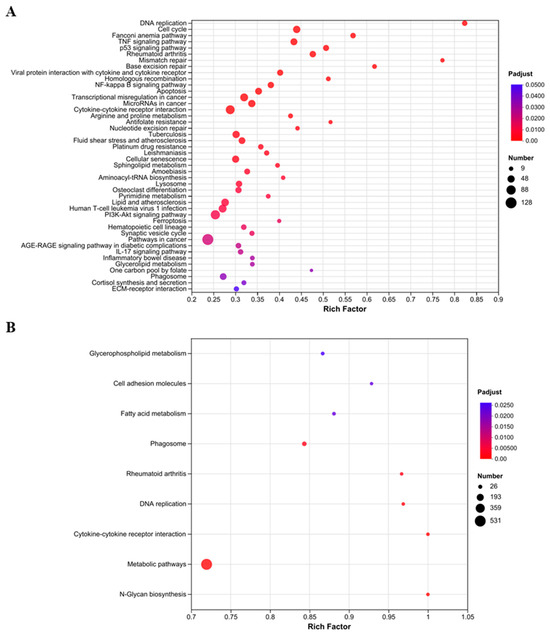
Figure 5.
Functional enrichment analysis of DEGs and DEPs based on KEGG pathway category. (A) Scatterplot of significantly enriched KEGG pathways in DEGs (p-adjust < 0.05). (B) Scatterplot of significantly enriched KEGG pathways in DEPs (p-adjust < 0.05). The color and size of the dots represent the p-adjust values and DEP numbers, respectively.
3.6. PPI Network Analysis
To explore the potential regulatory mechanisms in LTA-exposed RAW 264.7 macrophages, DEPs related to TLR signaling and cytokine–cytokine interaction pathways were mapped onto the STRING database for the PPI network. As shown in Figure 6, the PPI network consisted of 42 nodes. Nine widely reported nodes were randomly selected for comparative analyses of gene expression (Figure 7) and protein expression (Figure 8).
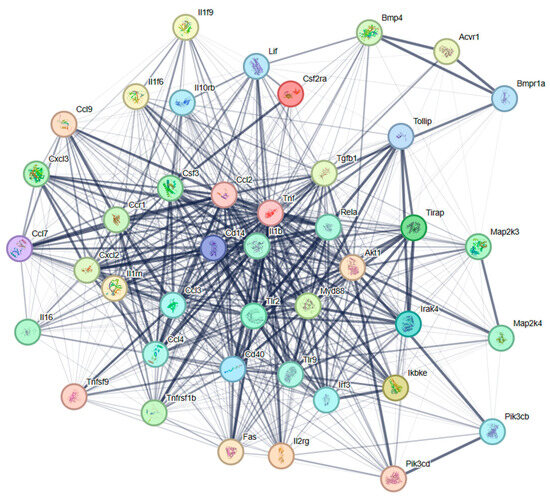
Figure 6.
PPI network of DEPs associated with TLR signaling and cytokine–cytokine interaction pathways. The network nodes represent the DEPs, and the lines indicate associations between the linked DEPs.
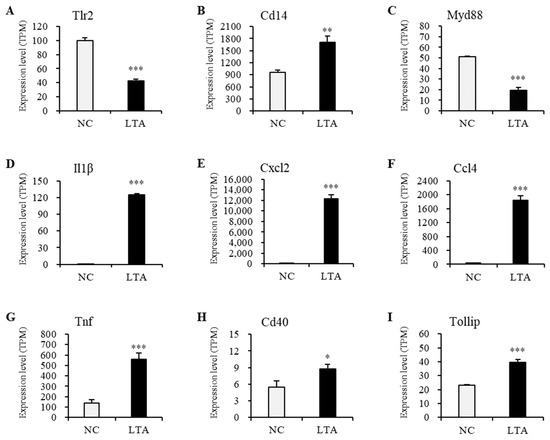
Figure 7.
Relative expression levels of the nine selected genes in the PPI network with significant differences between the negative control and LTA-treated RAW 264.7 macrophages. (A) Tlr2. (B) Cd14. (C) Myd88. (D) Il1β. (E) Cxcl2. (F) Ccl4. (G) Tnf. (H) Cd40. (I) Tollip. Quantification results were normalized using transcripts per million. * p < 0.05, ** p < 0.01, and *** p < 0.001 vs. NC.
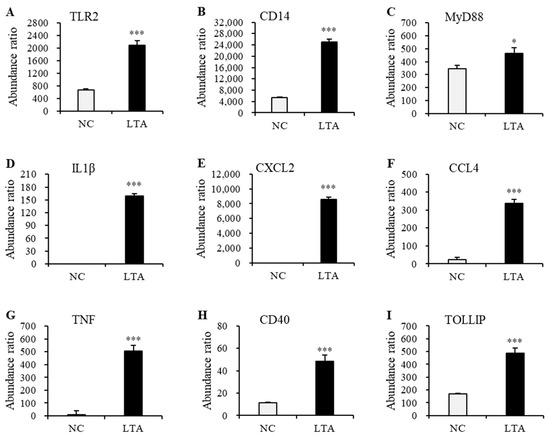
Figure 8.
The expression levels of the nine selected proteins in the PPI network with significant differences between the negative control and LTA-treated RAW 264.7 cells. (A) TLR2. (B) CD14. (C) MyD88. (D) IL1β. (E) CXCL2. (F) CCL4. (G) TNF. (H) CD40. (I) TOLLIP. * p < 0.05 and *** p < 0.001 vs. NC.
The gene expression levels of Tlr2 and Myd88 in macrophages treated with LTA for 24 h were significantly lower than those in the NC group. However, protein expression levels of TLR2 and MyD88 in LTA-treated macrophages were significantly higher than those in the NC group. Additionally, the gene expression levels of Cd14, Il1β, Cxcl2, Ccl4, Tnf, Cd40, and Tollip, along with their corresponding protein expression levels, were significantly increased in the LTA treatment group (p < 0.05).
4. Discussion
Lipoteichoic acid (LTA), a component of the cell wall, is considered a critical molecule for the immunomodulatory effects of probiotics [28]. Variations in the molecular structure of LTAs from different probiotic strains lead to diverse immunostimulatory activities. For instance, Claes et al. reported that LTA is an important MAMP in Lacticaseibacillus rhamnosus GG (LGG) with pro-inflammatory activities [17]. Conversely, L. plantarum NCIMB8826 LTA has been reported to exhibit anti-inflammatory properties [29]. To select the optimal strain for specific applications, it is essential to understand the detailed molecular mechanisms of action.
In a previous study, we reported that daily administration of H. coagulans HOM5301 for one month significantly boosted both non-specific and specific immunity in mice, especially the phagocytic capacity of monocytes/macrophages [15]. In this study, multi-spectrometric analyses preliminarily indicated that HOM5301 LTA consists of a glycerophosphate backbone with amide, hexose, and amino acid substituents, and other groups, with a molecular weight range of 10–16 kDa. HOM5301 LTA is structurally distinct from SaLTA [30]. Furthermore, HOM5301 LTA efficiently activated macrophages, promoting the expression of NO, TNFα, and IL-6 to a greater extent than SaLTA, a potent inducer of inflammation [31,32]. This suggests that HOM5301 LTA has great potential as an immune-boosting agent. Given the complexity of LTA’s structure, further research is needed to elucidate its chemical structure and structure-activity relationship.
To elucidate the mechanism by which HOM5301 LTA activates macrophages, we employed RNA sequencing and proteomic approaches. The up-regulation of key pro-inflammatory genes detected by RNA-seq was corroborated by proteomic analysis, indicating a strong activation effect of HOM5301 LTA on macrophages. After 24 h of LTA treatment, we observed greater differential expression at the gene level than at the protein level. Interestingly, the expression levels of Tlr2 and Myd88 in LTA-treated macrophages were significantly lower at the gene level, compared to the NC group, while the corresponding protein levels were significantly higher. This discrepancy may be due to the time lag between gene transcription and protein translation. Future studies should analyze gene expression during the early stages of LTA treatment.
Phagocytosis, primarily performed by neutrophils, monocytes, and macrophages, is a fundamental defense mechanism in organisms and is a component of non-specific immunity [33]. The synergistic interaction between the mononuclear-phagocyte and lymphocyte systems forms the basis of specific immune responses (humoral and cellular immunity) [34]. A key step in phagocytosis is the formation of phagosomes, which are proposed as organelles that link innate and adaptive immunity [35]. Cytokine–cytokine receptor interactions regulate the immune system, including cell growth, differentiation, and immune responses. For example, different types of cytokines, such as ILs, interferons, TNFs, and chemokines, can stimulate the proliferation and differentiation of immune cells by binding to specific receptors, thereby enhancing or inhibiting immune responses [36]. Through KEGG analysis, we confirmed that HOM5301 LTA transcriptionally and translationally activated macrophages via two immune-related pathways: cytokine–cytokine receptor interactions and phagosomes.
Several studies have reported that LTA interacts with TLR2 to initiate innate immune responses [17,29]. To determine the molecular mechanism by which HOM5301 LTA acts on macrophages, we constructed a PPI network using DEPs involved in TLR signaling and cytokine–cytokine interaction pathways. The proposed mechanism of action is illustrated in Figure 9. HOM5301 LTA stimulates TLR2, recruiting MyD88 and IRAK, which subsequently trigger downstream cascades leading to the activation of mitogen-activated protein kinases (MAPK) and NF-κB. This cascade ultimately induces the expression of pro-inflammatory cytokines, such as TNF, IL6, IL1β, CD40, CSF, and chemokines, including CXCL2, CXCL3, CCL2, and CCL4. The pro-inflammatory properties of HOM5301 LTA are TLR2-dependent, but may require the coreceptor CD14. This finding is similar to that of Nilsen et al., who found that the pro-inflammatory property of SaLTA was TLR2 dependent and required the coreceptors CD14 and CD36 [37]. Additionally, we found that several negative regulators of pro-inflammation, such as the Toll-interacting protein, transforming growth factor beta, and IL-10, were up-regulated, which helps prevent exaggerated inflammatory responses caused by HOM5301 LTA. This is consistent with the immunoregulatory characteristics of LTA from LGG in bone marrow-derived dendritic cells [9]. Further studies on HOM5301 LTA in gut-associated lymphoid tissue and in mice are required to better understand the mechanism of action of H. coagulans in enhancing immunity.
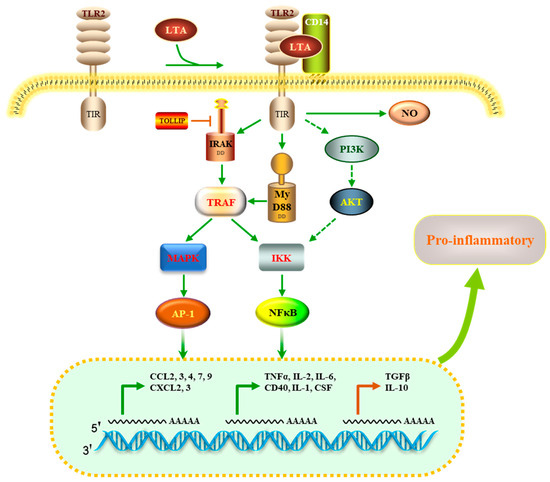
Figure 9.
Proposed mechanisms for the immunomodulatory activity of HOM5301 LTA on macrophages.
5. Conclusions
In this study, we extracted, purified, and characterized LTA from H. coagulans HOM5301. The results showed that HOM5301 LTA consists of a glycerophosphate backbone. Its molecular weight is in the range of 10–16 kDa. Comparative transcriptome and proteome analyses showed that LTA is an important MAMP of H. coagulans HOM5301, which activates macrophages via extracellular interactions with TLR2. The MAPK and NF-κB pathways are crucial to the LTA-induced immunomodulatory effect on macrophages, which partly explains the mechanism of action of H. coagulans HOM5301 in boosting immunity. The application of LTA derived from H. coagulans as an immunoadjuvant shows potential; however, more in-depth and extensive research is required.
Author Contributions
Conceptualization, S.Z., P.L., S.L., and N.S.; methodology, S.Z., Y.D., and T.W.; software, S.Z. and X.Z.; validation, S.Z. and N.S.; formal analysis, S.Z. and X.Z.; investigation, S.Z. and Y.D.; data curation, S.Z., Y.D., and X.Z.; writing—original draft preparation, S.Z.; writing—review and editing, S.Z., P.L., and N.S.; visualization, S.Z.; supervision, P.L. and S.L.; project administration, Y.X. and N.S.; funding acquisition, C.L. and N.S. All authors have read and agreed to the published version of the manuscript.
Funding
This research was funded by National Natural Science Foundation of China (32201994) and Coree Beijing Co., Ltd. (RD06).
Data Availability Statement
The raw data supporting the conclusions of this article will be made available by the authors upon request.
Conflicts of Interest
Authors Shiqi Zhang, Xiao Zhang, Yan Ding, Tingting Wang, Suwon Lee, Ying Xu and Chongyoon Lim were employed by the company Food & Biotech R&D Center, Coree Beijing Co., Ltd. The remaining authors declare that the research was conducted in the absence of any commercial or financial relationships that could be construed as a potential conflict of interest.
References
- Liang, J.; Li, C.; Chen, Z.; Guo, F.; Dou, J.; Wang, T.; Xu, Z.S. Progress of research and application of Heyndrickxia coagulans (Bacillus coagulans) as probiotic bacteria. Front. Cell Infect. Microbiol. 2024, 14, 1415790. [Google Scholar] [CrossRef] [PubMed]
- Anaya-Loyola, M.A.; Enciso-Moreno, J.A.; Lopez-Ramos, J.E.; Garcia-Marin, G.; Orozco Alvarez, M.Y.; Vega-Garcia, A.M.; Mosqueda, J.; Garcia-Gutierrez, D.G.; Keller, D.; Perez-Ramirez, I.F. Bacillus coagulans GBI-30, 6068 decreases upper respiratory and gastrointestinal tract symptoms in healthy Mexican scholar-aged children by modulating immune-related proteins. Food Res. Int. 2019, 125, 108567. [Google Scholar] [CrossRef]
- Hoffman, J.R.; Hoffman, M.W.; Zelicha, H.; Gepner, Y.; Willoughby, D.S.; Feinstein, U.; Ostfeld, I. The effect of 2 weeks of inactivated probiotic Bacillus coagulans on endocrine, inflammatory, and performance responses during self-defense training in soldiers. J. Strength Cond. Res. 2019, 33, 2330–2337. [Google Scholar] [CrossRef] [PubMed]
- Majeed, M.; Nagabhushanam, K.; Arumugam, S.; Majeed, S.; Ali, F. Bacillus coagulans MTCC 5856 for the management of major depression with irritable bowel syndrome: A randomised, double-blind, placebo controlled, multi-centre, pilot clinical study. Food Nutr. Res. 2018, 62, 1218. [Google Scholar] [CrossRef]
- Jensen, G.S.; Benson, K.F.; Carter, S.G.; Endres, J.R. GanedenBC30 cell wall and metabolites: Anti-inflammatory and immune modulating effects in vitro. BMC Immunol. 2010, 11, 1–14. [Google Scholar] [CrossRef] [PubMed]
- Wang, Y.; Lin, J.; Cheng, Z.; Wang, T.; Chen, J.; Long, M. Bacillus coagulans TL3 inhibits LPS-induced caecum damage in rat by regulating the TLR4/MyD88/NF-kappaB and Nrf2 signal pathways and modulating intestinal microflora. Oxid Med. Cell Longev. 2022, 2022, 5463290. [Google Scholar] [CrossRef]
- Liu, Y.; Wang, J.; Wu, C. Modulation of gut microbiota and immune system by probiotics, pre-biotics, and post-biotics. Front. Nutr. 2021, 8, 634897. [Google Scholar] [CrossRef]
- Morath, S.; von Aulock, S.; Hartung, T. Structure/function relationships of lipoteichoic acids. J. Endotoxin Res. 2005, 11, 348–356. [Google Scholar] [CrossRef]
- Friedrich, A.D.; Leoni, J.; Paz, M.L.; Gonzalez Maglio, D.H. Lipoteichoic acid from Lacticaseibacillus rhamnosus GG modulates dendritic cells and T cells in the gut. Nutrients 2022, 14, 723. [Google Scholar] [CrossRef]
- Kim, Y.; Park, J.Y.; Kim, H.; Chung, D.K. Differential role of lipoteichoic acids isolated from Staphylococcus aureus and Lactobacillus plantarum on the aggravation and alleviation of atopic dermatitis. Microb. Pathog. 2020, 147, 104360. [Google Scholar] [CrossRef]
- Kang, S.S.; Sim, J.R.; Yun, C.H.; Han, S.H. Lipoteichoic acids as a major virulence factor causing inflammatory responses via Toll-like receptor 2. Arch. Pharm. Res. 2016, 39, 1519–1529. [Google Scholar] [CrossRef] [PubMed]
- Matsuzaki, C.; Shiraishi, T.; Chiou, T.Y.; Nakashima, Y.; Higashimura, Y.; Yokota, S.I.; Yamamoto, K.; Takahashi, T. Role of lipoteichoic acid from the genus Apilactobacillus in inducing a strong IgA response. Appl. Environ. Microbiol. 2022, 88, e0019022. [Google Scholar] [CrossRef]
- Lu, Q.; Guo, Y.; Yang, G.; Cui, L.; Wu, Z.; Zeng, X.; Pan, D.; Cai, Z. Structure and anti-inflammation potential of lipoteichoic acids isolated from Lactobacillus strains. Foods 2022, 11, 1610. [Google Scholar] [CrossRef] [PubMed]
- Pyclik, M.; Srutkova, D.; Schwarzer, M.; Górska, S. Bifidobacteria cell wall-derived exo-polysaccharides, lipoteichoic acids, peptidoglycans, polar lipids and proteins—Their chemical structure and biological attributes. Int. J. Biol. Macromol. 2020, 147, 333–349. [Google Scholar] [CrossRef]
- Zhang, S.; Zhang, D.; Wang, T.; Lee, S.; Lim, C.; Zhao, Y.; Li, P. In vitro and in vivo evaluation of efficacy and safety of Weizmannia coagulans HOM5301 for boosting immunity. J. Funct. Foods 2023, 107, 105694. [Google Scholar] [CrossRef]
- Balaguer, F.; Enrique, M.; Llopis, S.; Barrena, M.; Navarro, V.; Alvarez, B.; Chenoll, E.; Ramon, D.; Tortajada, M.; Martorell, P. Lipoteichoic acid from Bifidobacterium animalis subsp. lactis BPL1: A novel postbiotic that reduces fat deposition via IGF-1 pathway. Microb. Biotechnol. 2022, 15, 805–816. [Google Scholar] [CrossRef] [PubMed]
- Claes, I.J.; Segers, M.E.; Verhoeven, T.L.; Dusselier, M.; Sels, B.F.; De Keersmaecker, S.C.; Vanderleyden, J.; Lebeer, S. Lipoteichoic acid is an important microbe-associated molecular pattern of Lactobacillus rhamnosus GG. Microb. Cell Fact. 2012, 11, 161. [Google Scholar] [CrossRef]
- Liu, Y.; Liu, W.; Li, J.; Tang, S.; Wang, M.; Huang, W.; Yao, W.; Gao, X. A polysaccharide extracted from Astragalus membranaceus residue improves cognitive dysfunction by altering gut microbiota in diabetic mice. Carbohyd. Polym. 2019, 205, 500–512. [Google Scholar] [CrossRef]
- Wu, S.; Liu, H.; Li, S.; Sun, H.; He, X.; Huang, Y.; Long, H. Transcriptome analysis reveals possible immunomodulatory activity mechanism of Chlorella sp. exopolysaccharides on RAW264.7 macrophages. Mar. Drugs. 2021, 19, 217. [Google Scholar] [CrossRef]
- Jang, K.S.; Baik, J.E.; Han, S.H.; Chung, D.K.; Kim, B.G. Multi-spectrometric analyses of lipoteichoic acids isolated from Lactobacillus plantarum. Biochem. Biophys. Res. Commun. 2011, 407, 823–830. [Google Scholar] [CrossRef]
- Yoshida, S.; Kawai, H.; Soe, Y.; Eain, H.S.; Sanou, S.; Takabatake, K.; Takeshita, Y.; Hisatomi, M.; Nagatsuka, H.; Asaumi, J.; et al. Efficacy of cisplatin-CXCR4 antagonist combination therapy in oral cancer. Cancers 2024, 16, 2326. [Google Scholar] [CrossRef] [PubMed]
- Chen, S.; Zhou, Y.; Chen, Y.; Gu, J. fastp: An ultra-fast all-in-one FASTQ preprocessor. Bioinformatics 2018, 34, i884–i890. [Google Scholar] [CrossRef] [PubMed]
- Kim, D.; Langmead, B.; Salzberg, S.L. HISAT: A fast spliced aligner with low memory requirements. Nat. Methods 2015, 12, 357–360. [Google Scholar] [CrossRef]
- Pertea, M.; Kim, D.; Pertea, G.M.; Leek, J.T.; Salzberg, S.L. Transcript-level expression analysis of RNA-seq experiments with HISAT, StringTie and Ballgown. Nat. Protoc. 2016, 11, 1650–1667. [Google Scholar] [CrossRef] [PubMed]
- Love, M.I.; Huber, W.; Anders, S. Moderated estimation of fold change and dispersion for RNA-seq data with DESeq2. Genome Biol. 2014, 15, 550. [Google Scholar] [CrossRef]
- Ren, Y.; Yu, G.; Shi, C.; Liu, L.; Guo, Q.; Han, C.; Zhang, D.; Zhang, L.; Liu, B.; Gao, H.; et al. Majorbio Cloud: A one-stop, comprehensive bioinformatic platform for multiomics analyses. Imeta 2022, 1, e12. [Google Scholar] [CrossRef]
- Gatto, L.; Breckels, L.M.; Naake, T.; Gibb, S. Visualization of proteomics data using R and bioconductor. Proteomics 2015, 15, 1375–1389. [Google Scholar] [CrossRef]
- Han, J.; Zhao, X.; Zhao, X.; Li, P.; Gu, Q. Insight into the structure, biosynthesis, isolation method and biological function of teichoic acid in different gram-positive microorganisms: A review. Int. J. Biol. Macromol. 2023, 253, 126825. [Google Scholar] [CrossRef] [PubMed]
- Grangette, C.; Nutten, S.; Palumbo, E.; Morath, S.; Hermann, C.; Dewulf, J.; Pot, B.; Hartung, T.; Hols, P.; Mercenier, A. Enhanced antiinflammatory capacity of a Lactobacillus plantarum mutant synthesizing modified teichoic acids. Proc. Natl. Acad. Sci. USA 2005, 102, 10321–10326. [Google Scholar] [CrossRef]
- Schneewind, O.; Missiakas, D. Lipoteichoic acids, phosphate-containing polymers in the envelope of gram-positive bacteria. J. Bacteriol. 2014, 196, 1133–1142. [Google Scholar] [CrossRef]
- Kim, W.J.; Yu, H.S.; Lee, N.K.; Paik, H.D. Levilactobacillus brevis KU15151 inhibits Staphylococcus aureus lipoteichoic acid-induced inflammation in RAW 264.7 macrophages. Probiotics Antimicro. 2022, 14, 767–777. [Google Scholar] [CrossRef] [PubMed]
- Ryu, Y.H.; Baik, J.E.; Yang, J.S.; Kang, S.S.; Im, J.; Yun, C.H.; Kim, D.W.; Lee, K.; Chung, D.K.; Ju, H.R.; et al. Differential immunostimulatory effects of Gram-positive bacteria due to their lipoteichoic acids. Int. Immunopharmacol. 2009, 9, 127–133. [Google Scholar] [CrossRef]
- Ochando, J.; Mulder, W.J.M.; Madsen, J.C.; Netea, M.G.; Duivenvoorden, R. Trained immunity—Basic concepts and contributions to immunopathology. Nat. Rev. Nephrol. 2023, 19, 23–37. [Google Scholar] [CrossRef] [PubMed]
- Cortes-Perez, N.G.; de Moreno de LeBlanc, A.; Gomez-Gutierrez, J.G.; LeBlanc, J.G.; Bermudez-Humaran, L.G. Probiotics and trained immunity. Biomolecules 2021, 11, 1402. [Google Scholar] [CrossRef]
- Kagan, J.C.; Iwasaki, A. Phagosome as the organelle linking innate and adaptive immunity. Traffic 2012, 13, 1053–1061. [Google Scholar] [CrossRef]
- Chou, W.C.; Rampanelli, E.; Li, X.; Ting, J.P. Impact of intracellular innate immune receptors on immunometabolism. Cell Mol. Immunol. 2022, 19, 337–351. [Google Scholar] [CrossRef] [PubMed]
- Nilsen, N.J.; Deininger, S.; Nonstad, U.; Skjeldal, F.; Husebye, H.; Rodionov, D.; von Aulock, S.; Hartung, T.; Lien, E.; Bakke, O.; et al. Cellular trafficking of lipoteichoic acid and Toll-like receptor 2 in relation to signaling: Role of CD14 and CD36. J. Leukoc. Biol. 2008, 84, 280–291. [Google Scholar] [CrossRef] [PubMed]
Disclaimer/Publisher’s Note: The statements, opinions and data contained in all publications are solely those of the individual author(s) and contributor(s) and not of MDPI and/or the editor(s). MDPI and/or the editor(s) disclaim responsibility for any injury to people or property resulting from any ideas, methods, instructions or products referred to in the content. |
© 2024 by the authors. Licensee MDPI, Basel, Switzerland. This article is an open access article distributed under the terms and conditions of the Creative Commons Attribution (CC BY) license (https://creativecommons.org/licenses/by/4.0/).