Nuclear-Magnetic-Resonance-Spectroscopy-Derived Serum Biomarkers of Metabolic Vulnerability Are Associated with Disability and Neurodegeneration in Multiple Sclerosis
Abstract
1. Introduction
2. Methods
2.1. Study Design
2.2. Serum Nuclear Magnetic Resonance (NMR) Analysis
IVXmin = 2.0 ⟹ score = 1
IVXmax = 8.3 ⟹ score = 100
MMX = 0.75097(4 − 0.02234 Leu + 0.0000528 Leu2) + 0.55737(7 − 0.02895 Val +
0.0000608 Val2) + (0.00867 Ile) + 0.65649(1 + 0.0025 Cit + 0.0000167 Cit2)
MMXmin = 1.281 ⟹ score = 1
MMXmax = 2.0 ⟹ score = 100
MVX = 2.72923 IVX + 11.96062ln(MMX) − 1.12749 IVX × ln(MMX)
MVXmin = 20.3 ⟹ score = 1
MVXmax = 28.0 ⟹ score = 100
2.3. Data Analysis
3. Results
4. Discussion
Supplementary Materials
Author Contributions
Funding
Institutional Review Board Statement
Informed Consent Statement
Data Availability Statement
Conflicts of Interest
References
- Ciccarelli, O.; Barkhof, F.; Bodini, B.; De Stefano, N.; Golay, X.; Nicolay, K.; Pelletier, D.; Pouwels, P.J.W.; Smith, S.A.; Wheeler-Kingshott, C.A.M.; et al. Pathogenesis of multiple sclerosis: Insights from molecular and metabolic imaging. Lancet Neurol. 2014, 13, 807–822. [Google Scholar] [CrossRef] [PubMed]
- Brandes, R.P.; Rezende, F. Glycolysis and Inflammation: Partners in Crime! Circ. Res. 2021, 129, 30–32. [Google Scholar] [CrossRef]
- Soto-Heredero, G.; de las Heras, M.M.G.; Gabandé-Rodríguez, E.; Oller, J.; Mittelbrunn, M. Glycolysis—A key player in the inflammatory response. FEBS J. 2020, 287, 3350–3369. [Google Scholar] [CrossRef] [PubMed]
- Zotta, A.; Zaslona, Z.; O’Neill, L.A. Is Citrate A Critical Signal in Immunity and Inflammation? J. Cell Signal. 2020, 1, 87–96. [Google Scholar]
- Le Floc’H, N.; Melchior, D.; Obled, C. Modifications of protein and amino acid metabolism during inflammation and immune system activation. Livest. Prod. Sci. 2004, 87, 37–45. [Google Scholar] [CrossRef]
- Kelly, B.; Pearce, E.L. Amino Assets: How Amino Acids Support Immunity. Cell Metab. 2020, 32, 154–175. [Google Scholar] [CrossRef] [PubMed]
- Fukushima, K.; Harada, S.; Takeuchi, A.; Kurihara, A.; Iida, M.; Fukai, K.; Kuwabara, K.; Kato, S.; Matsumoto, M.; Hirata, A.; et al. Association between dyslipidemia and plasma levels of branched-chain amino acids in the Japanese population without diabetes mellitus. J. Clin. Lipidol. 2019, 13, 932–939.e2. [Google Scholar] [CrossRef]
- Fellows, K.; Uher, T.; Browne, R.W.; Weinstock-Guttman, B.; Horakova, D.; Posova, H.; Vaneckova, M.; Seidl, Z.; Krasensky, J.; Tyblova, M.; et al. Protective associations of HDL with blood-brain barrier injury in multiple sclerosis patients. J. Lipid. Res. 2015, 56, 2010–2018. [Google Scholar] [CrossRef]
- Otvos, J.D. Measurement of lipoprotein subclass profiles by nuclear magnetic resonance spectroscopy. Clin. Lab. 2002, 48, 171–180. [Google Scholar]
- Singh, K.; Chandra, A.; Sperry, T.; Joshi, P.H.; Khera, A.; Virani, S.S.; Ballantyne, C.M.; Otvos, J.D.; Dullaart, R.P.F.; Gruppen, E.G.; et al. Associations Between High-Density Lipoprotein Particles and Ischemic Events by Vascular Domain, Sex, and Ethnicity: A Pooled Cohort Analysis. Circulation 2020, 142, 657–669. [Google Scholar] [CrossRef]
- Colhoun, H.M.; Otvos, J.D.; Rubens, M.B.; Taskinen, M.R.; Underwood, S.R.; Fuller, J.H. Lipoprotein subclasses and particle sizes and their relationship with coronary artery calcification in men and women with and without type 1 diabetes. Diabetes 2002, 51, 1949–1956. [Google Scholar] [CrossRef] [PubMed][Green Version]
- Emeasoba, E.U.; Ibeson, E.; Nwosu, I.; Montemarano, N.; Shani, J.; Shetty, V.S. Clinical Relevance of Nuclear Magnetic Resonance LipoProfile. Front. Nucl. Med. 2022, 2, 960522. [Google Scholar] [CrossRef]
- Stadler, J.T.; Lackner, S.; Mörkl, S.; Trakaki, A.; Scharnagl, H.; Borenich, A.; Wonisch, W.; Mangge, H.; Zelzer, S.; Meier-Allard, N.; et al. Obesity Affects HDL Metabolism, Composition and Subclass Distribution. Biomedicines 2021, 9, 242. [Google Scholar] [CrossRef] [PubMed]
- Stadler, J.T.; Marsche, G. Obesity-Related Changes in High-Density Lipoprotein Metabolism and Function. Int. J. Mol. Sci. 2020, 21, 8985. [Google Scholar] [CrossRef]
- Flores-Guerrero, J.L.; Gruppen, E.G.; Connelly, M.A.; Shalaurova, I.; Otvos, J.D.; Garcia, E.; Bakker, S.J.L.; Dullaart, R.P.F. A Newly Developed Diabetes Risk Index, Based on Lipoprotein Subfractions and Branched Chain Amino Acids, is Associated with Incident Type 2 Diabetes Mellitus in the PREVEND Cohort. J. Clin. Med. 2020, 9, 2781. [Google Scholar] [CrossRef]
- Weinstock-Guttman, B.; Zivadinov, R.; Mahfooz, N.; Carl, E.; Drake, A.; Schneider, J.; Teter, B.; Hussein, S.; Mehta, B.; Weiskopf, M.; et al. Serum lipid profiles are associated with disability and MRI outcomes in multiple sclerosis. J. Neuroinflammation 2011, 8, 127. [Google Scholar] [CrossRef]
- Otvos, J.D.; Shalaurova, I.; May, H.T.; Muhlestein, J.B.; Wilkins, J.T.; McGarrah, R.W.; Kraus, W.E. Multimarkers of metabolic malnutrition and inflammation and their association with mortality risk in cardiac catheterisation patients: A prospective, longitudinal, observational, cohort study. Lancet Healthy Longev. 2023, 4, e72–e82. [Google Scholar] [CrossRef]
- Polman, C.H.; Reingold, S.C.; Banwell, B.; Clanet, M.; Cohen, J.A.; Filippi, M.; Fujihara, K.; Havrdova, E.; Hutchinson, M.; Kappos, L.; et al. Diagnostic criteria for multiple sclerosis: 2010 revisions to the McDonald criteria. Ann. Neurol. 2011, 69, 292–302. [Google Scholar] [CrossRef]
- Lublin, F.D.; Reingold, S.C.; Cohen, J.A.; Cutter, G.R.; Sørensen, P.S.; Thompson, A.J.; Wolinsky, J.S.; Balcer, L.J.; Banwell, B.; Barkhof, F.; et al. Defining the clinical course of multiple sclerosis: The 2013 revisions. Neurology 2014, 83, 278–286. [Google Scholar] [CrossRef] [PubMed]
- Kurtzke, J.F. Rating neurologic impairment in multiple sclerosis: An expanded disability status scale (EDSS). Neurology 1983, 33, 1444–1452. [Google Scholar] [CrossRef]
- Zivadinov, R.; Rudick, R.A.; De Masi, R.; Nasuelli, D.; Ukmar, M.; Pozzi–Mucelli, R.S.; Grop, A.; Cazzato, G.; Zorzon, M. Effects of IV methylprednisolone on brain atrophy in relapsing-remitting MS. Neurology 2001, 57, 1239–1247. [Google Scholar] [CrossRef] [PubMed]
- Smith, S.M.; Zhanga, Y.; Jenkinsona, M.; Chenab, J.; Matthews, P.; Federicoc, A.; De Stefano, N. Accurate, robust, and automated longitudinal and cross-sectional brain change analysis. Neuroimage 2002, 17, 479–489. [Google Scholar] [CrossRef]
- Zivadinov, R.; Weinstock-Guttman, B.; Benedict, R.; Tamaño-Blanco, M.; Hussein, S.; Abdelrahman, N.; Durfee, J.; Ramanathan, M. Preservation of gray matter volume in multiple sclerosis patients with the Met allele of the rs6265 (Val66Met) SNP of brain-derived neurotrophic factor. Hum. Mol. Genet. 2007, 16, 2659–2668. [Google Scholar] [CrossRef] [PubMed]
- Jeyarajah, E.J.; Cromwell, W.C.; Otvos, J.D. Lipoprotein particle analysis by nuclear magnetic resonance spectroscopy. Clin. Lab. Med. 2006, 26, 847–870. [Google Scholar] [CrossRef]
- Huffman, K.M.; Parker, D.C.; Bhapkar, M.; Racette, S.B.; Martin, C.K.; Redman, L.M.; Das, S.K.; Connelly, M.A.; Pieper, C.F.; Orenduff, M.; et al. Calorie restriction improves lipid-related emerging cardiometabolic risk factors in healthy adults without obesity: Distinct influences of BMI and sex from CALERIE a multicentre, phase 2, randomised controlled trial. EClinicalMedicine 2022, 43, 101261. [Google Scholar] [CrossRef] [PubMed]
- R Core Team. R: A Language and Environment for Statistical Computing; R Foundation for Statistical Computing: Vienna, Austria, 2017. [Google Scholar]
- Wickham, H. ggplot2: Elegant Graphics for Data Analysis; Use R! Springer International Publishing: Cham, Switzerland, 2016. [Google Scholar]
- Lakens, D. Calculating and reporting effect sizes to facilitate cumulative science: A practical primer for t-tests and ANOVAs. Front. Psychol. 2013, 4, 863. [Google Scholar] [CrossRef]
- Kassambara, A. rstatix: Pipe-Friendly Framework for Basic Statistical Tests. The Comprehensive R Archive Network. 2023. Available online: https://cran.r-project.org/web/packages/rstatix/index.html (accessed on 15 May 2024).
- Miles, J.; Shevlin, M. Applying Regression & Correlation: A Guide for Students and Researchers; Sage Publications: London, UK; Thousand Oaks, CA, USA, 2001; 253p. [Google Scholar]
- Rispoli, M.G.; Valentinuzzi, S.; De Luca, G.; Del Boccio, P.; Federici, L.; Di Ioia, M.; Digiovanni, A.; Grasso, E.A.; Pozzilli, V.; Villani, A.; et al. Contribution of Metabolomics to Multiple Sclerosis Diagnosis, Prognosis and Treatment. Int. J. Mol. Sci. 2021, 22, 11112. [Google Scholar] [CrossRef]
- Connelly, M.A.; Otvos, J.D.; Shalaurova, I.; Playford, M.P.; Mehta, N.N. GlycA, a novel biomarker of systemic inflammation and cardiovascular disease risk. J. Transl. Med. 2017, 15, 219. [Google Scholar] [CrossRef]
- Otvos, J.D.; Shalaurova, I.; Wolak-Dinsmore, J.; Connelly, M.A.; Mackey, R.H.; Stein, J.H.; Tracy, R.P. GlycA: A Composite Nuclear Magnetic Resonance Biomarker of Systemic Inflammation. Clin. Chem. 2015, 61, 714–723. [Google Scholar] [CrossRef]
- Gilmore, C.P.; Donaldson, I.; Bo, L.; Owens, T.; Lowe, J.; Evangelou, N. Regional variations in the extent and pattern of grey matter demyelination in multiple sclerosis: A comparison between the cerebral cortex, cerebellar cortex, deep grey matter nuclei and the spinal cord. J. Neurol. Neurosurg. Psychiatry 2009, 80, 182–187. [Google Scholar] [CrossRef]
- Klistorner, S.; Barnett, M.H.; Klistorner, A. Mechanisms of central brain atrophy in multiple sclerosis. Mult. Scler. 2022, 28, 2038–2045. [Google Scholar] [CrossRef] [PubMed]
- Ballout, R.A.; Remaley, A.T. GlycA: A New Biomarker for Systemic Inflammation and Cardiovascular Disease (CVD) Risk Assessment. J. Lab. Precis. Med. 2020, 5. [Google Scholar] [CrossRef] [PubMed]
- Jorissen, W.; Wouters, E.; Bogie, J.F.; Vanmierlo, T.; Noben, J.-P.; Sviridov, D.; Hellings, N.; Somers, V.; Valcke, R.; Vanwijmeersch, B.; et al. Relapsing-remitting multiple sclerosis patients display an altered lipoprotein profile with dysfunctional HDL. Sci. Rep. 2017, 7, 43410. [Google Scholar] [CrossRef] [PubMed]
- Holecek, M. Branched-chain amino acids in health and disease: Metabolism, alterations in blood plasma, and as supplements. Nutr Metab 2018, 15, 33. [Google Scholar] [CrossRef]
- Monaco, F.; Fumero, S.; Mondino, A.; Mutani, R. Plasma and cerebrospinal fluid tryptophan in multiple sclerosis and degenerative diseases. J. Neurol. Neurosurg. Psychiatry 1979, 42, 640–641. [Google Scholar] [CrossRef]
- Fitzgerald, K.C.; Smith, M.D.; Kim, S.; Sotirchos, E.S.; Kornberg, M.D.; Douglas, M.; Nourbakhsh, B.; Graves, J.; Rattan, R.; Poisson, L.; et al. Multi-omic evaluation of metabolic alterations in multiple sclerosis identifies shifts in aromatic amino acid metabolism. Cell Rep. Med. 2021, 2, 100424. [Google Scholar] [CrossRef]
- Shi, T.; Browne, R.W.; Tamaño-Blanco, M.; Jakimovski, D.; Weinstock-Guttman, B.; Zivadinov, R.; Ramanathan, M.; Blair, R.H. Metabolomic profiles in relapsing-remitting and progressive multiple sclerosis compared to healthy controls: A five-year follow-up study. Metabolomics 2023, 19, 44. [Google Scholar] [CrossRef]
- Geurts, J.J.; Calabrese, M.; Fisher, E.; Rudick, R.A. Measurement and clinical effect of grey matter pathology in multiple sclerosis. Lancet Neurol. 2012, 11, 1082–1092. [Google Scholar] [CrossRef]
- Bø, L.; Vedeler, C.A.; Nyland, H.; Trapp, B.D.; Mørk, S.J. Intracortical multiple sclerosis lesions are not associated with increased lymphocyte infiltration. Mult. Scler. 2003, 9, 323–331. [Google Scholar] [CrossRef]
- Pereira, F.V.; de Menezes Jarry, V.; Castro, J.T.; Appenzeller, S.; Reis, F. Pediatric inflammatory demyelinating disorders and mimickers: How to differentiate with MRI? Autoimmun Rev. 2021, 20, 102801. [Google Scholar] [CrossRef]
- Grossman, R.I. Magnetization transfer in multiple sclerosis. Ann. Neurol. 1994, 36, S97–S99. [Google Scholar] [CrossRef]


| HC | RR-MS | P-MS | p-Value | |
|---|---|---|---|---|
| Sample size n | 153 | 187 | 91 | – |
| Gender, female (%) | 85 (55.6) | 141 (75.4) | 66 (72.5) | <0.001 |
| Age, years | 45.9 (13.9) | 44.3 (9.65) | 54.1 (8.82) | <0.001 |
| Body mass index, kg/m2 | 28.0 ± 5.94 | 27.1 ± 6.15 | 25.6 ± 5.44 | <0.001 |
| Race: | ||||
| Caucasian | 133 (88.1%) | 171 (92.4%) | 86 (94.5%) | – |
| African American | 13 (8.6%) | 9 (4.9%) | 4 (4.4%) | |
| Hispanic/Latino | 1 (.66%) | 3 (1.6%) | 1 (1.1%) | |
| Asian | 3 (2.0%) | 1 (.54%) | – | |
| Other | 1 (0.66%) | 1 (.54%) | – | |
| Missing | 2 (1.3%) | 2 (1.1%) | – | |
| Disease duration, years | – | 12.1 (8.47) | 21.5 (11.4) | <0.001 |
| EDSS a | - | 2.5 (1.5-3.5) | 6.0 (5-6.5) | <0.001 |
| Disease-modifying treatments: | ||||
| No treatment | – | 20 (12.0%) | 16 (18.2%) | – |
| Interferon | 67 (40.4%) | 31 (35.2%) | ||
| Glatiramer acetate | 35 (21.1%) | 25 (28.4%) | ||
| Other | 44 (26.5%) | 16 (18.2%) | ||
| Missing | 21 | 3 |
| NMR Biomarker | HC-RR-PMS (p-Value) | ||
|---|---|---|---|
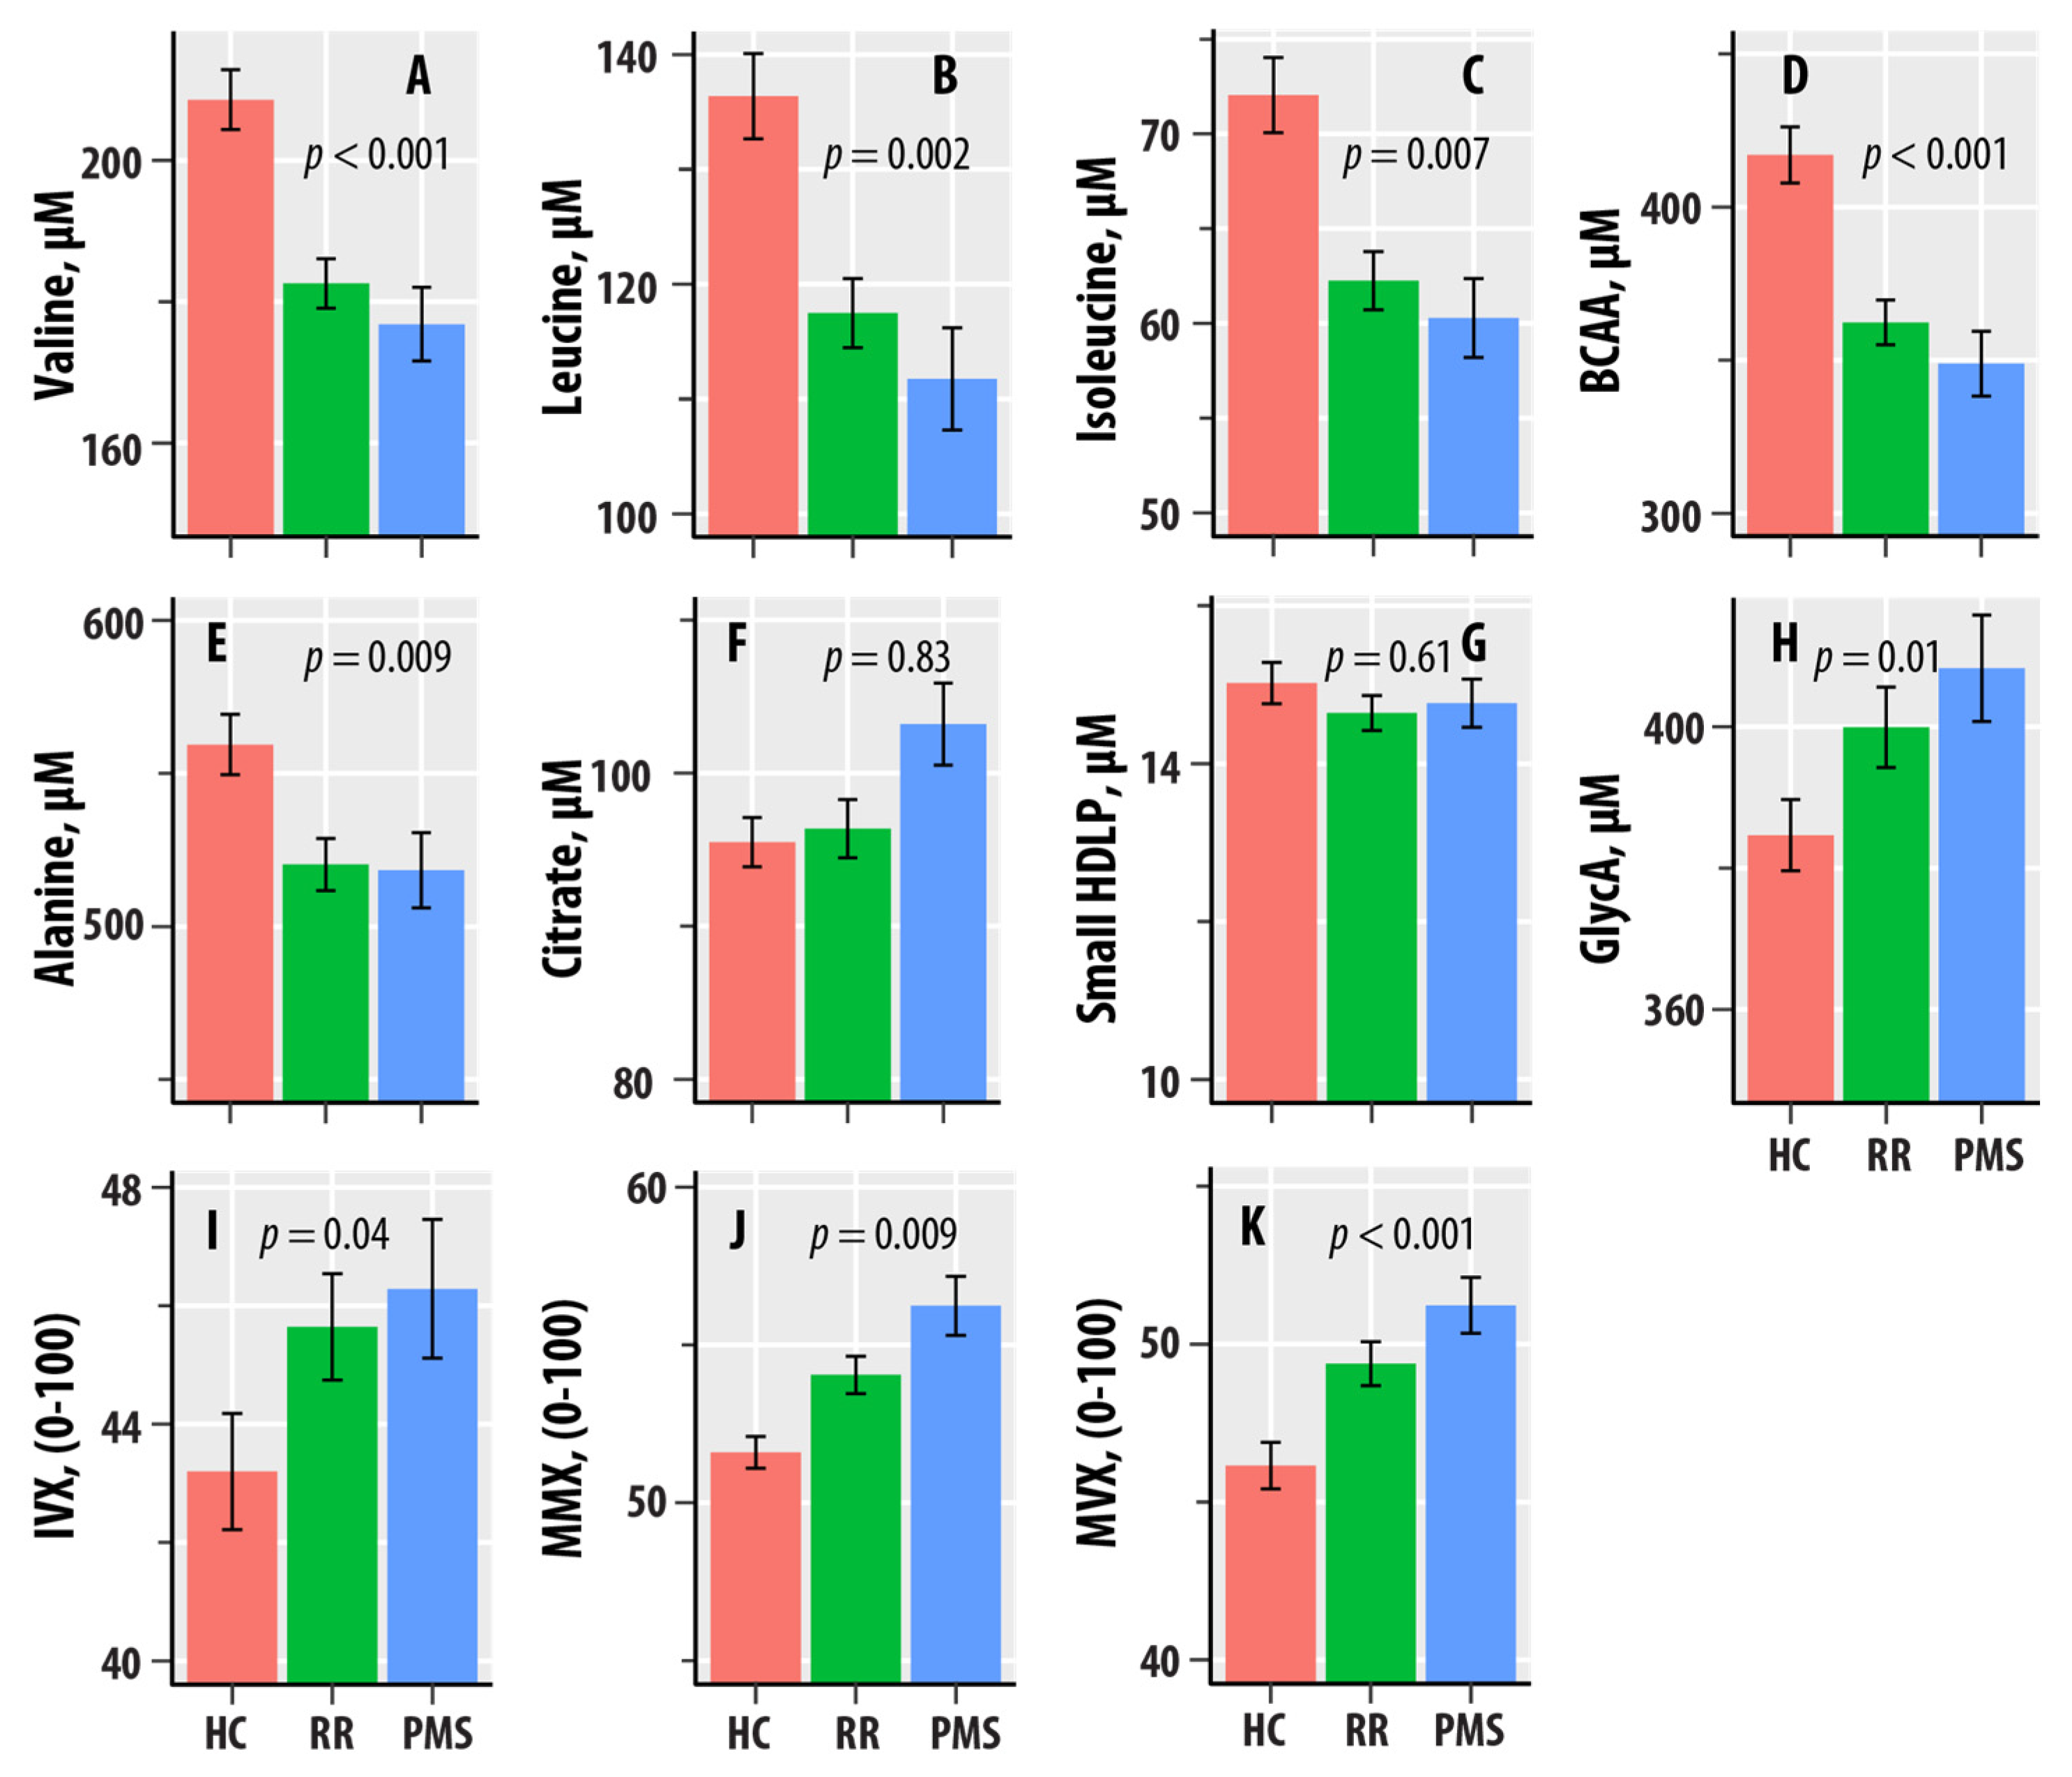
| Valine | 0.036 (<0.001) | −18.2 | −21.6 |
| Leucine | 0.031 (0.002) | −14.5 | −19.5 |
| Isoleucine | 0.025 (0.007) | −6.92 | −8.01 |
| BCAA | 0.038 (<0.001) | −39.6 | −49.1 |
| Alanine | 0.023 (0.009) | −35.9 | −44.1 |
| Citrate | <0.001 (0.83) | 0.965 | 2.03 |
| sHDLP | 0.002 (0.61) | −0.176 | −0.439 |
| GlycA | 0.023 (0.01) | 16.4 | 27.5 |
| IVX | 0.016 (0.04) | 1.85 | 4.22 |
| MMX | 0.023 (0.009) | 1.87 | 3.21 |
| MVX | 0.039 (<0.001) | 2.42 | 4.96 |
| NMR Biomarker | EDSS | Timed Ambulation * | ||
|---|---|---|---|---|
| (p-Value) | (p-Value) | |||
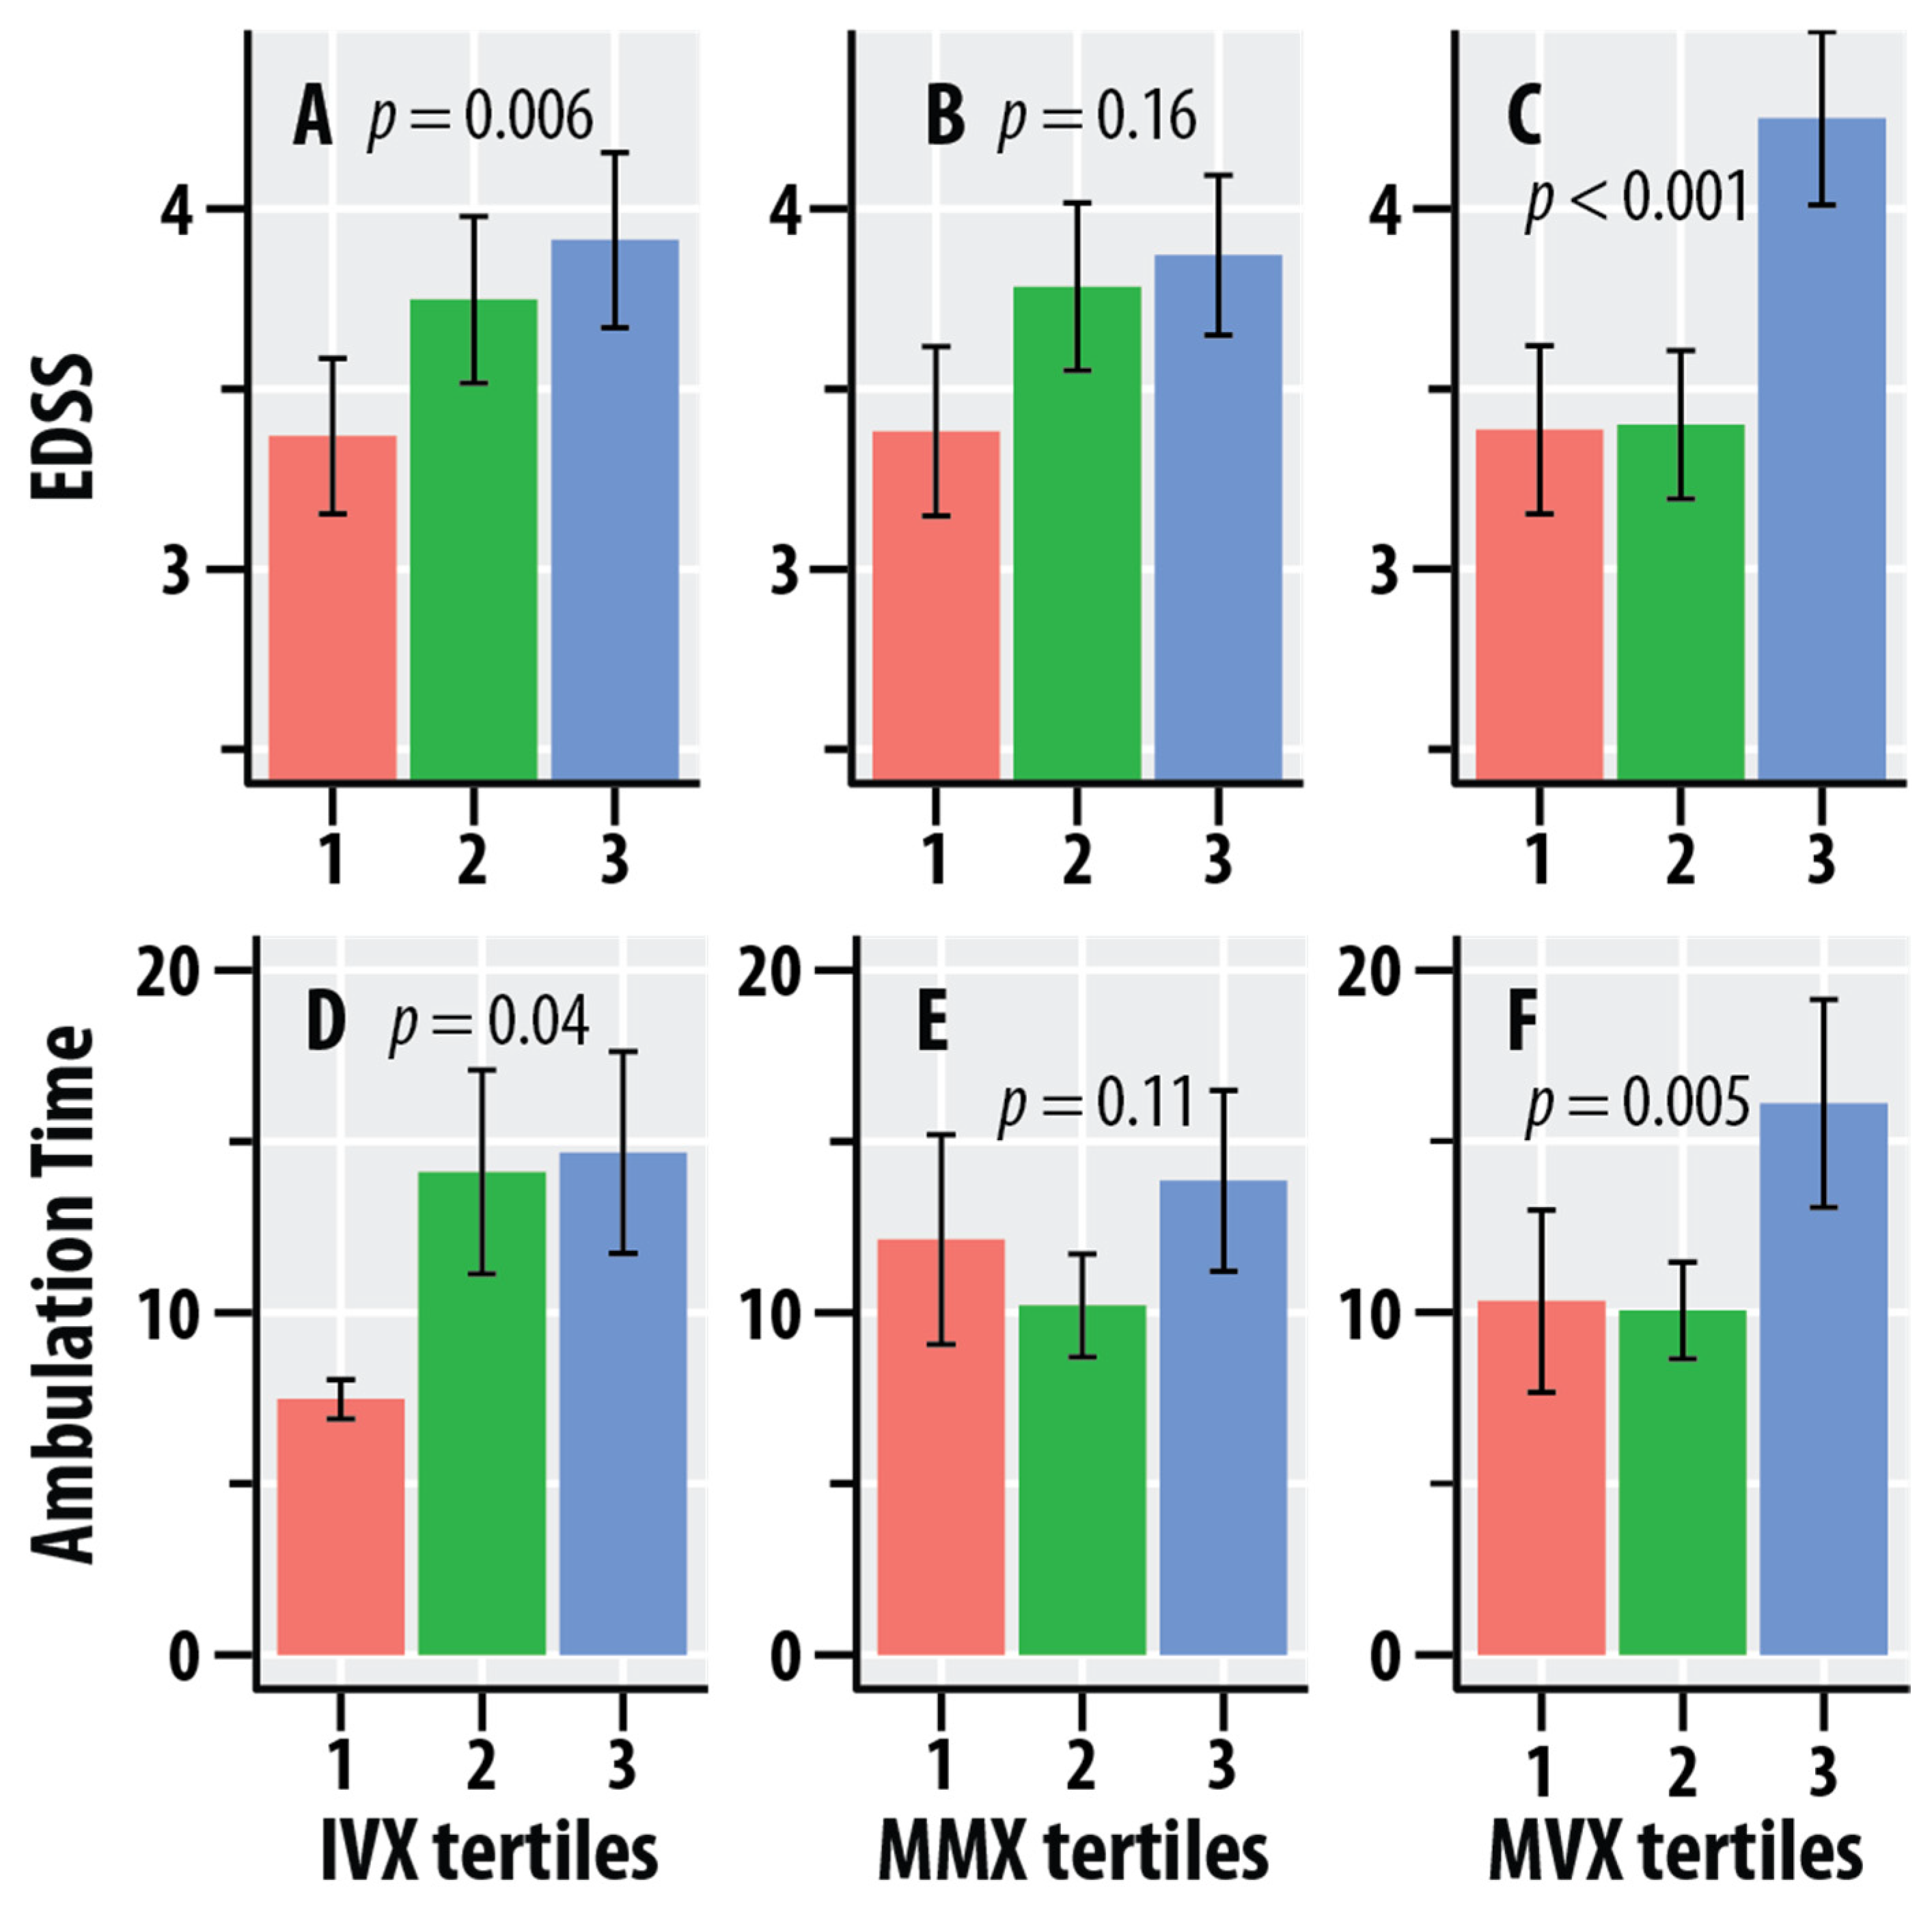
| Valine | 0.010 (0.11) | −2.36 | 0.012 (0.12) | −16.4 |
| Leucine | 0.010 (0.13) | −2.04 | 0.016 (0.08) | −16.5 |
| Isoleucine | 0.014 (0.06) | −1.23 | 0.016 (0.08) | −8.28 |
| BCAA | 0.013 (0.07) | −5.62 | 0.017 (0.07) | −41.1 |
| Alanine | 0.010 (0.12) | −5.72 | 0.031 (0.015) | −63.0 |
| Citrate | 0.002 (0.52) | 0.534 | <0.001 (0.69) | 2.29 |
| sHDLP | 0.022 (0.02) | −0.225 | 0.007 (0.25) | −0.764 |
| GlycA | 0.009 (0.14) | 3.43 | 0.010 (0.16) | 23.2 |
| IVX | 0.031 (0.006) | 1.02 | 0.023 (0.04) | 5.13 |
| MMX | 0.008 (0.16) | 0.379 | 0.013 (0.11) | 2.97 |
| MVX | 0.046 (<0.001) | 0.946 | 0.041 (0.005) | 5.34 |
| NMR-Derived Biomarker | T2-LV (p-Value) | T1-LV (p-Value) | WBV (p-Value) | GMV (p-Value) | DGM (p-Value) | CV (p-Value) | LVV (p-Value) |
|---|---|---|---|---|---|---|---|
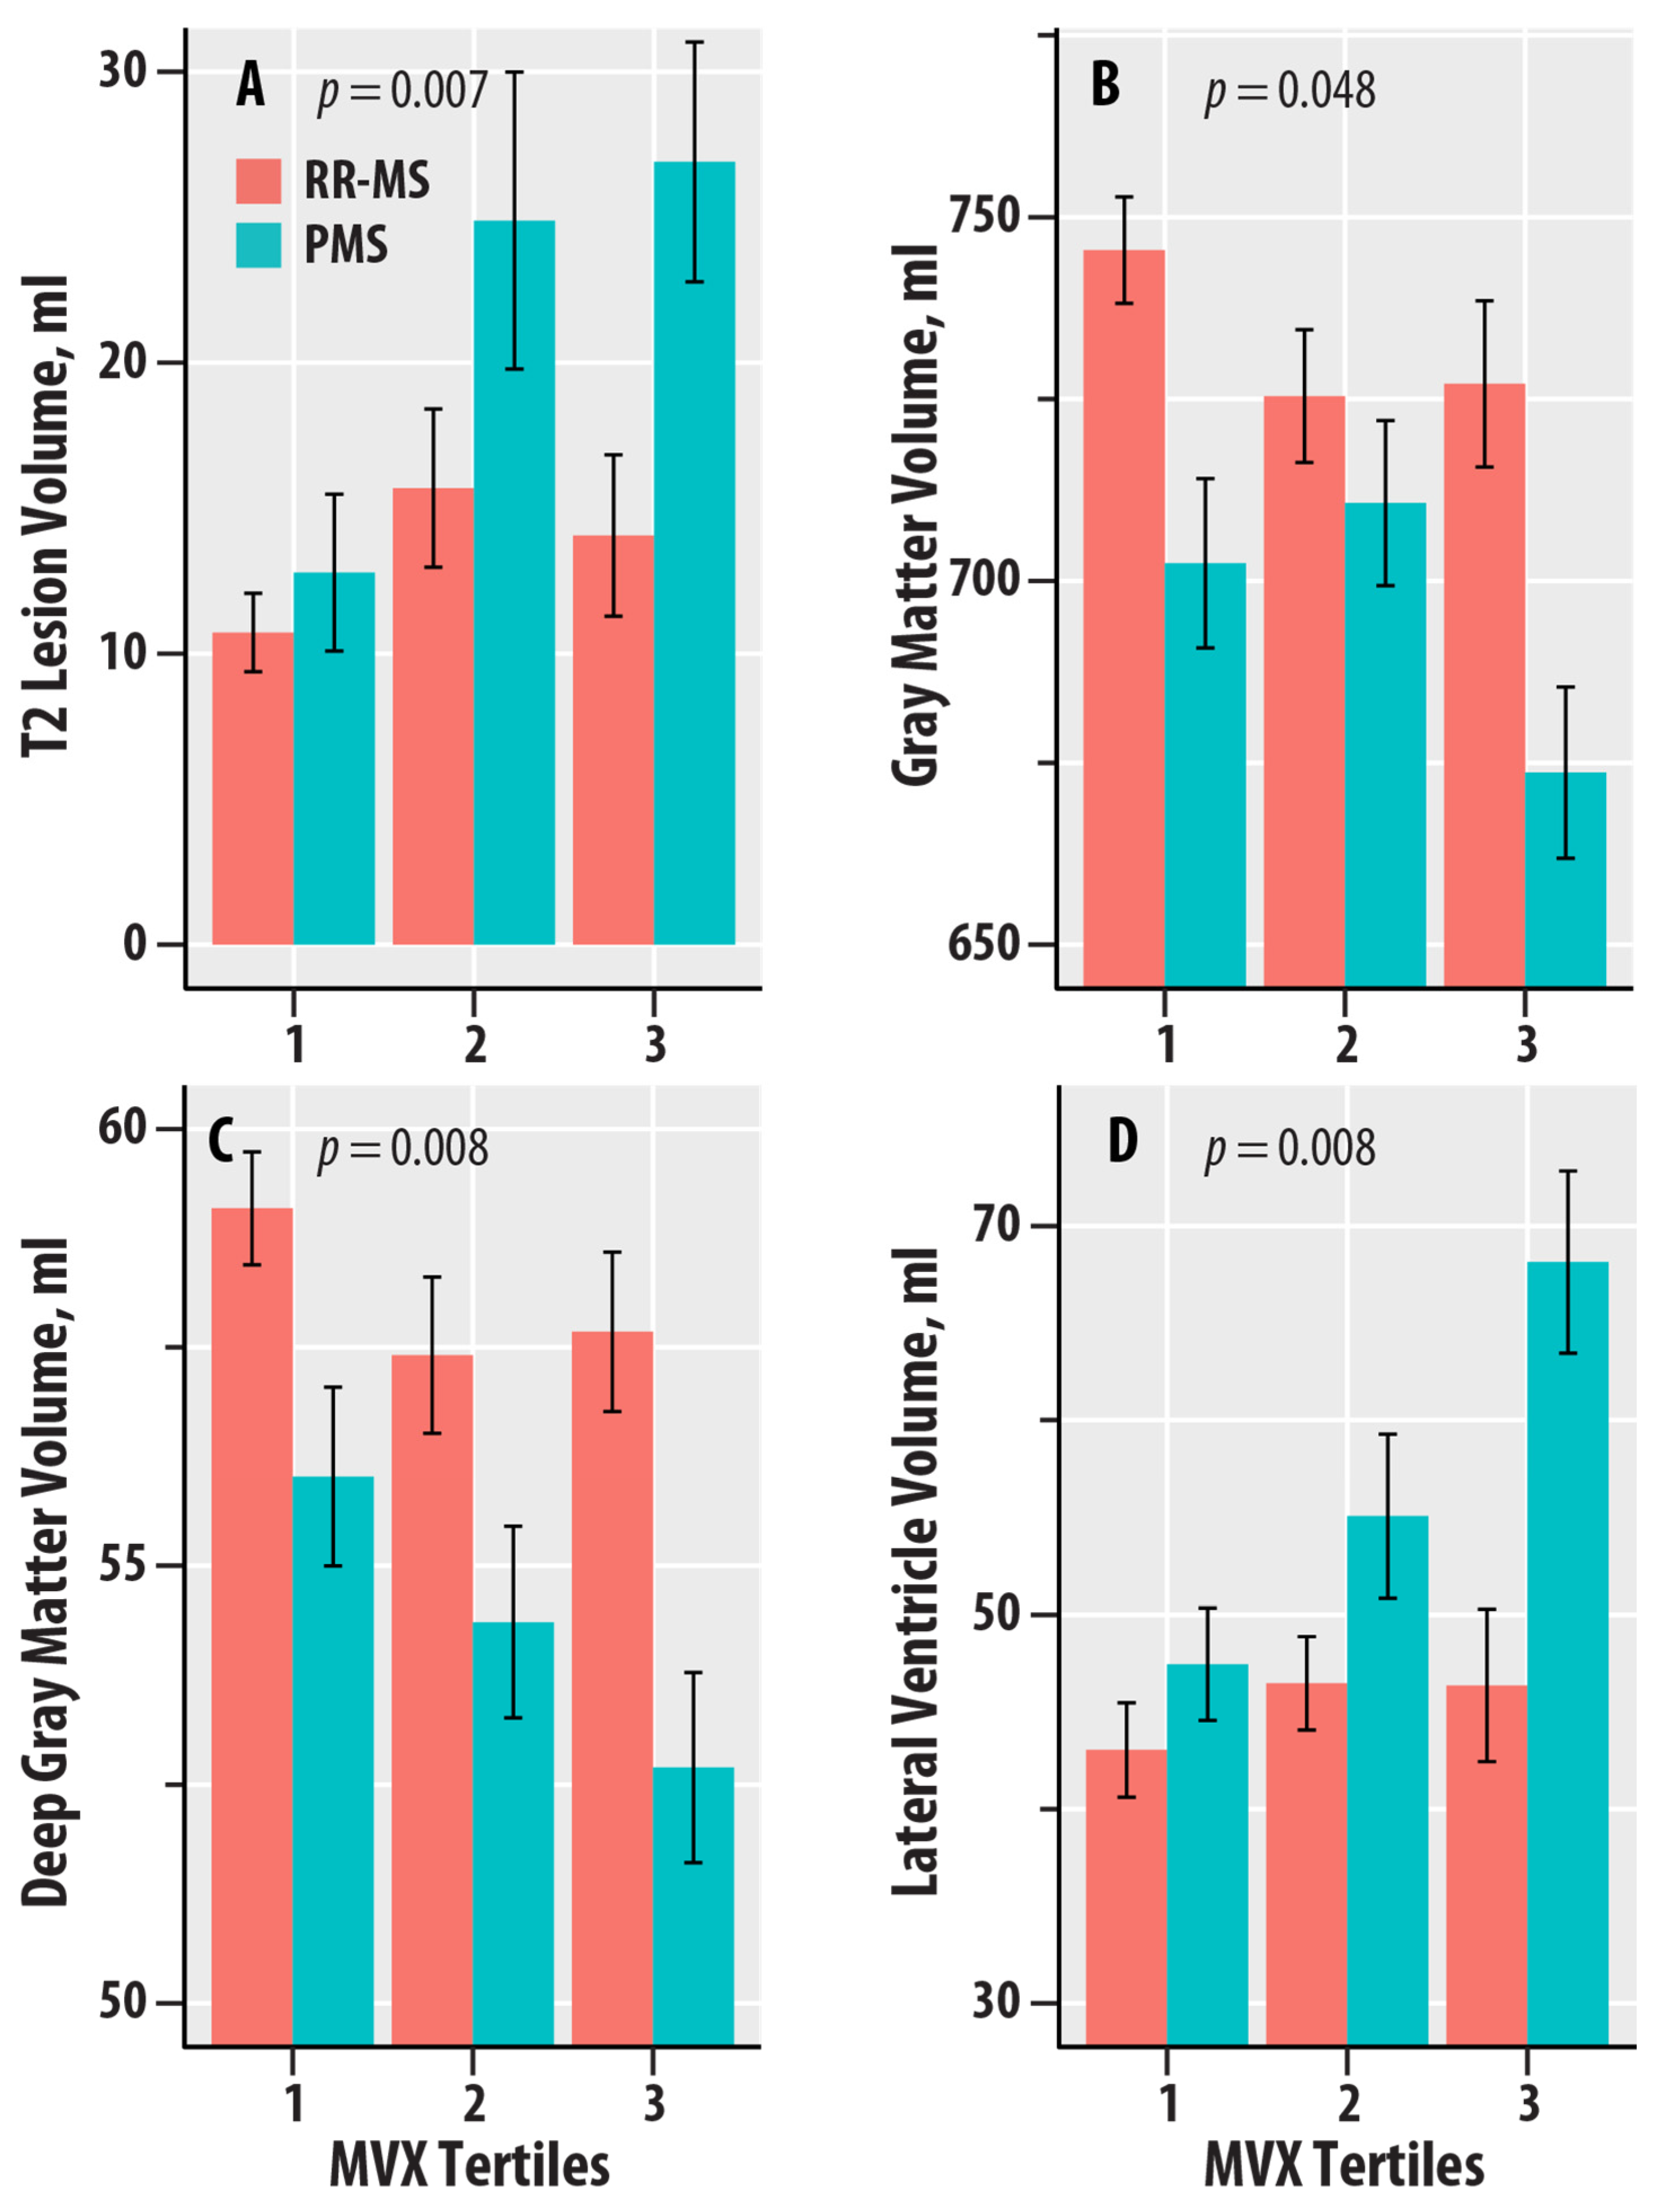
| Valine | 0.020 (0.04) | 0.020 (0.04) | 0.012 (0.10) | 0.020 (0.03) | 0.015 (0.07) | 0.024 (0.02) | 0.017 (0.046) |
| Leucine | 0.024 (0.02) | 0.035 (0.006) | 0.001 (0.60) | 0.001 (0.58) | 0.005 (0.30) | 0.003 (0.41) | 0.011 (0.11) |
| Isoleucine | 0.012 (0.10) | 0.019 (0.046) | 0.014 (0.07) | 0.015 (0.06) | 0.014 (0.07) | 0.019 (0.04) | 0.013 (0.09) |
| BCAA | 0.024 (0.02) | 0.031 (0.01) | 0.008 (0.17) | 0.011 (0.10) | 0.012 (0.09) | 0.016 (0.06) | 0.017 (0.046) |
| Alanine | <0.001 (0.83) | 0.005 (0.32) | 0.003 (0.41) | 0.001 (0.59) | 0.004 (0.34) | 0.002 (0.50) | <0.001 (0.96) |
| Citrate | 0.001 (0.62) | 0.003 (0.46) | 0.008 (0.18) | 0.001 (0.63) | 0.007 (0.19) | 0.002 (0.49) | <0.001 (0.94) |
| sHDLP | 0.015 (0.06) | 0.009 (0.16) | 0.001 (0.63) | 0.005 (0.28) | 0.017 (0.047) | 0.003 (0.37) | 0.005 (0.27) |
| GlycA | 0.004 (0.35) | <0.001 (0.94) | 0.008 (0.18) | 0.015 (0.065) | 0.013 (0.08) | 0.013 (0.08) | 0.023 (0.022) |
| IVX | 0.015 (0.07) | 0.002 (0.55) | 0.005 (0.27) | 0.017 (0.048) | 0.028 (0.01) | 0.014 (0.08) | 0.019 (0.04) |
| MMX | 0.014 (0.08) | 0.019 (0.04) | <0.001 (0.93) | <0.001 (0.88) | <0.001 (0.69) | <0.001 (0.79) | 0.006 (0.25) |
| MVX | 0.032 (0.007) | 0.014 (0.08) | 0.004 (0.32) | 0.017 (0.048) | 0.030 (0.008) | 0.015 (0.06) | 0.030 (0.008) |
Disclaimer/Publisher’s Note: The statements, opinions and data contained in all publications are solely those of the individual author(s) and contributor(s) and not of MDPI and/or the editor(s). MDPI and/or the editor(s) disclaim responsibility for any injury to people or property resulting from any ideas, methods, instructions or products referred to in the content. |
© 2024 by the authors. Licensee MDPI, Basel, Switzerland. This article is an open access article distributed under the terms and conditions of the Creative Commons Attribution (CC BY) license (https://creativecommons.org/licenses/by/4.0/).
Share and Cite
Wicks, T.R.; Shalaurova, I.; Browne, R.W.; Wolska, A.; Weinstock-Guttman, B.; Zivadinov, R.; Remaley, A.T.; Otvos, J.D.; Ramanathan, M. Nuclear-Magnetic-Resonance-Spectroscopy-Derived Serum Biomarkers of Metabolic Vulnerability Are Associated with Disability and Neurodegeneration in Multiple Sclerosis. Nutrients 2024, 16, 2866. https://doi.org/10.3390/nu16172866
Wicks TR, Shalaurova I, Browne RW, Wolska A, Weinstock-Guttman B, Zivadinov R, Remaley AT, Otvos JD, Ramanathan M. Nuclear-Magnetic-Resonance-Spectroscopy-Derived Serum Biomarkers of Metabolic Vulnerability Are Associated with Disability and Neurodegeneration in Multiple Sclerosis. Nutrients. 2024; 16(17):2866. https://doi.org/10.3390/nu16172866
Chicago/Turabian StyleWicks, Taylor R., Irina Shalaurova, Richard W. Browne, Anna Wolska, Bianca Weinstock-Guttman, Robert Zivadinov, Alan T. Remaley, James D. Otvos, and Murali Ramanathan. 2024. "Nuclear-Magnetic-Resonance-Spectroscopy-Derived Serum Biomarkers of Metabolic Vulnerability Are Associated with Disability and Neurodegeneration in Multiple Sclerosis" Nutrients 16, no. 17: 2866. https://doi.org/10.3390/nu16172866
APA StyleWicks, T. R., Shalaurova, I., Browne, R. W., Wolska, A., Weinstock-Guttman, B., Zivadinov, R., Remaley, A. T., Otvos, J. D., & Ramanathan, M. (2024). Nuclear-Magnetic-Resonance-Spectroscopy-Derived Serum Biomarkers of Metabolic Vulnerability Are Associated with Disability and Neurodegeneration in Multiple Sclerosis. Nutrients, 16(17), 2866. https://doi.org/10.3390/nu16172866


