Article

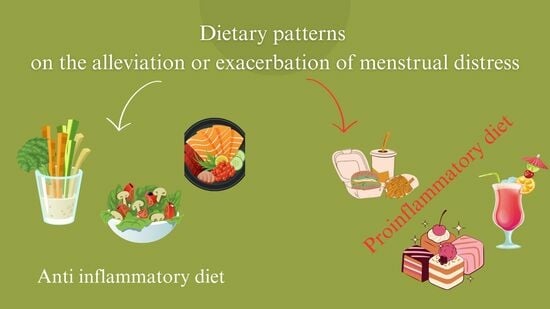
An Assessment of Women’s Knowledge of the Menstrual Cycle and the Influence of Diet and Adherence to Dietary Patterns on the Alleviation or Exacerbation of Menstrual Distress

by
Anna Ciołek
1,
Malgorzata Kostecka
1,*,
Julianna Kostecka
2,
Paulina Kawecka
1 and
Monika Popik-Samborska
3
1
Department of Chemistry, Faculty of Food Science and Biotechnology, University of Life Sciences, Akademicka 15, 20-950 Lublin, Poland
2
Faculty of Medicine, Medical University of Lublin, Chodźki 19, 20-093 Lublin, Poland
3
Dietetic Centre Project Health, Ametystowa 16, 20-576 Lublin, Poland
*
Author to whom correspondence should be addressed.
Nutrients 2024, 16(1), 69; https://doi.org/10.3390/nu16010069
Submission received: 13 November 2023 / Revised: 14 December 2023 / Accepted: 18 December 2023 / Published: 25 December 2023
(This article belongs to the Special Issue Public Health, Nutritional Behavior and Nutritional Status)

Abstract

:
A growing number of women of reproductive age experience menstrual disorders. The menstrual cycle is considerably influenced by dietary habits, physical activity, and the use of stimulants. The main aim of this study was to assess women’s knowledge about the menstrual cycle and the influence of diet and lifestyle factors on menstrual symptoms, and to identify dietary models that may alleviate or exacerbate menstrual distress. A total of 505 young women participated in the study. Nearly 90% of the respondents reported at least one menstrual disorder, mostly dysmenorrhea (70.7%), whereas secondary amenorrhea was least frequently reported (13.8%) (p = 0.002). In the study population, dysmenorrhea/menstrual distress was linked with higher consumption frequency of certain food groups. Women with severe dysmenorrhea consumed refined cereal products, processed meat, sugar, and water significantly more frequently than women with moderate menstrual pain. In turn, sweetened dairy products, animal fats, and fruit were consumed more frequently by women with low intensity of menstrual pain (mild pain). Significant differences in knowledge about the menstrual cycle and physiological changes in the body were observed between the compared dietary models.

Graphical Abstract

1. Introduction

A growing number of women of reproductive age experience menstrual disorders. Menstrual symptoms such as dysmenorrhea, heavy menstrual bleeding, and perimenstrual mood disorders are known to be widespread among the general population [1]. Clinical trials have shown that menstrual symptoms can have a large impact on women’s mental and physical well-being, personal relationships, education and career attainment, and can lead to long-standing impairments in the quality of life [2]. Furthermore, it is estimated that many women initially do not consult a doctor while facing menstrual symptoms [3,4]. However, dysmenorrhea, which is characterized by menstrual pain in the absence of pelvic pathology, is one of the main reasons for gynecological consultations among young women [5]. The annual economic burden due to menstrual symptoms in Japanese women was estimated at approximately 683 billion Japanese yen, and in more than 70% of cases, dysmenorrhea was associated with a decrease in work productivity [6,7]. Data indicate that more than one-quarter of women reduced their working hours or were absent from work for at least 1 day per 6 months as a result of menstrual pain [6]. Depending on their severity, menstrual distress symptoms can also negatively affect women’s daily lives by preventing them from participating in social activities and maintaining social relations [7,8,9]. Research has also demonstrated that work or school absenteeism due to menstruation poses a significant economic, social, and health burden [9,10,11,12]. Despite the widespread prevalence of menstrual distress and the resulting decrease in the quality of life, including school and work absenteeism, this illness has received remarkably little scientific attention.
Dietary and lifestyle factors significantly affect the functioning of body organs and sex hormone levels. The menstrual cycle is considerably influenced by dietary habits, physical activity, and the use of stimulants. These factors affect the BMI and body fat percentage which are directly linked with ovulation disorders, and painful and irregular menstruation. The importance of dietary patterns for pain relief in women with dysmenorrhea is increasingly discussed in the literature [13]. However, too little attention has been paid to the role of specific food components in reducing menstrual distress. It is believed that healthy eating patterns may have pain-relieving properties. The development of an optimal diet for patients with dysmenorrhea constitutes a major challenge. Diets with low nutrient density, low in vitamins and minerals, and abundant in processed foods, may exert a negative impact on women’s overall health and well-being, and increase the risk of diet-related diseases which, under certain circumstances, can lead to menstrual disorders and exacerbate menstrual distress symptoms [14,15].
In recent years, numerous attempts have been made to identify modifiable factors, including lifestyle factors, that potentially alleviate menstrual distress. Research findings could substantially contribute to an improvement in women’s well-being by analyzing the relationship between dietary components and lifestyle factors that affect menstrual distress symptoms. The main aim of this study was to assess selected parameters associated with menstrual health and to correlate these parameters with the studied women’s diet and nutrition knowledge. Potential correlations between adherence to an emergent dietary model and the severity of menstrual distress were also examined.

2. Materials and Methods

2.1. Study Design

A cross-sectional study was conducted in the city of Lublin and in Lublin voivodeship in eastern Poland between April 2022 and January 2023. The study involved a paper questionnaire and an online questionnaire that was completed independently by the participants with the use of Google Forms.
Participants
The minimal sample size for the study was calculated with the use of Cochran’s formula [16] for the Polish population of women aged 18 to 40 years (N = 5,144,208 as of 31 December 2022) based on Statistical Yearbook data (Statistics Poland) [17]. The minimal sample size was determined at 384 persons at a significance level of 0.05, maximum error of 5%, and a sampling fraction of 0.5. The calculated sample size was adjusted for a 20% attrition rate to produce a total of 461 participants. A higher number of female respondents was achieved during recruitment, which decreased the maximum error and increased the power of the applied tests.
Inclusion criteria:
-
Age: 18–40 years;
-
Absence of serious illnesses that constitute exclusion criteria;
-
Informed consent to participate in the study.
Exclusion criteria:
-
Amenorrhea (absence of menstruation);
-
Miscarriage in the previous 6 months;
-
Pregnancy;
-
Presence of biological offspring;
-
Use of hormonal drugs (other than contraceptives), steroids, antidepressants, sleeping pills, or sedatives in the previous 6 months or directly before the trial;
-
Chronic diseases and metabolic disorders, including type 1 and 2 diabetes, insulin resistance, polycystic ovary syndrome, endometriosis, sterility, infertility, hormonal disorders, thyroid disorders, kidney disorders, asthma, Crohn’s disease, anemia, eating disorders, epilepsy, rheumatoid arthritis, cancer, HPV infection;
-
Diagnosed gynecological diseases or disorders, including congenital abnormalities of the reproductive tract;
-
Pelvic floor disorders;
-
Lack of consent to participate in the study.

2.2. Study Tools and Data Collection

Information about the study was posted on Facebook groups, posters at Lublin universities, and in gynecological clinics. The survey was completely voluntary and anonymous, and the participants did not provide any personal or sensitive information that could enable their identification. The study involved a conventional paper questionnaire and an online questionnaire that was completed with the use of Google Forms on a dedicated Facebook page. All participants were residents of Lublin voivodeship. Before the trial, all women were informed about the purpose of the study and the research protocol. Survey completion was regarded as an indication of consent to participate in the study. The main questionnaire contained questions about the menstrual cycle (duration; presence, type and prevalence of menstrual symptoms; heavy bleeding; pain; intermenstrual bleeding; secondary amenorrhea), as well as 7 questions analyzing the participants’ knowledge about the physiology of the menstrual cycle and menstrual disorders. The participants received 1 point for every correct answer and 0 points for every incorrect answer. There were a maximum of 7 points in total, where 0–4 points denoted a low level of knowledge and >4 points denoted a high level of knowledge. Menstrual pain was rated on the visual analog scale (VAS). The participants were asked to indicate the average severity of menstrual pain by placing an “x” on a straight horizontal line with a length of 10 cm. The ends of the line represented the extreme limits of pain, where 0 points denoted a complete absence of pain, and 10 denoted severe pain. Pain intensity was self-assessed on the following scale: low (0–4.0 points), moderate (4.1–7.0 points), and severe (7.1–10 points), where 0.1 points was represented by 0.1 cm on the horizontal line. This part of the questionnaire also contained questions about the use of vitamin D supplements, dietary supplements (including herbal supplements), smoking, and alcohol consumption. The second part of the study involved a short food frequency questionnaire (FFQ). The questionnaire contained 37 food products divided into the following groups: cereal products; dairy products; meat and meat products; eggs and fish; fats and bread spreads; vegetables; pulses; fruit; nuts; sugar and confectionery products; beverages (including alcoholic beverages); and fast-food products. The respondents were asked to indicate the average consumption frequency of the products listed in the FFQ in the past year by selecting one of the seven options in the questionnaire: less than once a month; 1–3 times a month; 1–2 times a week; 3–4 times a week; 5–6 times a week; once daily; twice or more daily. The declared consumption frequency was converted into daily frequency using the appropriate conversion factors (Table 1). The participants’ biographic data were collected, including age, place of residence, education, and marital status. The surveyed subjects were also asked to indicate their body height (cm) and body weight (kg) based on independently performed anthropometric measurements and to describe any changes in body weight in the previous 6 months. Based on the obtained anthropometric data, the body mass index (BMI) was calculated by dividing body weight (kilograms) by the square of the height (meters). The interpretation of BMI was based on the guidelines of the World Health Organization:
-
<18.5 kg/m2—underweight;
-
18.5–24.99 kg/m2—normal weight;
-
25.0–29.99 kg/m2—overweight;
-
30.0–34.99 kg/m2—stage I obesity;
-
>35 kg/m2—stage II obesity.
Paper questionnaires were filled out independently at home. The questionnaires were revised, and missing information was provided during a meeting with a researcher. Online questionnaires were completed with the use of Google Forms, and the completeness of the answers was checked by the researchers. The paper questionnaire and the online questionnaire involved the same main questionnaire and the FFQ. A total of 571 women completed the questionnaire, and 505 correctly completed questionnaires were returned.

2.3. Dietary Patterns

Dietary patterns were derived by cluster analysis. The input variables were 14 dietary (in times/day) components of DPs. All input variables were standardized using our own database to achieve a mean equal to 0 and a standard deviation equal to 1. To identify the optimal number of clusters, the analysis was conducted several times. The K-means clustering algorithm was used, and the subjects were grouped based on the Euclidean distance. Finally, two clusters were selected (an anti-inflammatory model and a proinflammatory model). The correctness of cluster identification and labelling was verified by comparing the components of DPs between clusters in a one-way analysis of variance.

2.4. Data Processing and Statistical Analysis

Missing data were addressed by excluding incomplete questionnaires or sections from the analysis. The results were presented in tables and figures and were described. Categorical variables were presented as sample percentages (%), and continuous variables were expressed as the mean ± standard deviation. The differences between groups were analyzed in the chi-squared test (categorical variables) or the Mann–Whitney test (continuous variables). The Kruskal–Wallis test was applied to analyze the relationships between the variables in more than two mutually independent groups. Before statistical analysis, the data were checked for normal distribution in the Kolmogorov–Smirnov test. The odds ratios (ORs) and 95% confidence intervals (95% CIs) were calculated. The reference category (OR = 1.00) was mild intensity of menstrual pain. The significance of ORs was assessed by Wald’s statistics. The results of all tests were regarded as statistically significant at p < 0.05. Data were processed in the Statistica program (version 13.1 PL; StatSoft Inc., Tulsa, OK, USA; StatSoft, Krakow, Poland) and in SPSS v. 27.

3. Results

The study involved 505 women with the mean age of 24.7 ± 4.5 years (range: 19–40 years). Nearly 50% of the participants resided in cities with a population of ≥250,000, and rural inhabitants accounted for 27.9% of the studied group (Table 2). Most of the surveyed women lived in informal relationships (49.9%), and a relatively high percentage of the population (23.0%) declared to be single. The vast majority of the studied subjects were professionally active or were students in paid employment (84.2%), and nearly 5% of the participants were unemployed.
The average BMI was 22.4 ± 4.2 kg/m2. Most of the studied subjects (69.2%) had a healthy body weight. Overweight and obesity were determined in 23.5% of the surveyed population, where 51.3% of the participants were characterized by gynoid obesity (pear-shaped body), and 48.7% by android obesity (apple-shaped body). Only 5.2% of the subjects were underweight. Changes in body weight in the previous 6 months were reported by 52.0% of the participants, where 70% of the subjects declared weight gain, and 30% reported weight loss (p = 0.013). In both cases, the average change in body weight was 3.8 ± 1.6 kg. Changes in body weight were more frequently reported by women with excessive BMI (p = 0.001) and women with android obesity (p = 0.021).

3.1. Selected Menstrual Health Parameters

In the vast majority of the surveyed subjects, the length of the menstrual cycle ranged from 26 to 31 days, and cycles shorter than 26 days were reported by 10.7% of the participants. Most women had regular menstrual cycles (84.3%), and menstruation lasted 5.1 ± 1.0 days on average. Bleeding intensity was assessed as moderate by the vast majority of the participants (63.2%), whereas heavy or very heavy bleeding was reported by nearly every fourth respondent (26.1%). The average pain intensity measured on the VAS was 6.3 ± 2.8 points, and the results were used to divide women into three groups with different levels of pain intensity. The first group consisted of women with a VAS score of 0–4 points (mild pain), the second group comprised participants with a VAS score of 4.1–7 points (moderate pain), and the third group consisted of subjects with a VAS score of 7.1–10 points (severe pain).
Menstrual distress and disorders significantly affect overall health status. Nearly 90% of the respondents reported at least one menstrual disorder, mostly dysmenorrhea (70.7%), whereas secondary amenorrhea was least frequently reported (13.8%) (p = 0.002). The most frequent menstrual distress symptoms were abdominal pain, back pain, and generalized pain, and the prevalence of these symptoms increased with a rise in the menstrual pain score (Table 3).

3.2. The Influence of Diet and Eating Habits on the Menstrual Cycle

Most of the subjects consumed four meals per day (N = 207, 41%), whereas the smallest number of women (N = 29, 5.7%) consumed two or fewer meals per day. In the studied group, 16.0% of the respondents adhered to a special diet, mostly a vegetarian diet (54.5% of the respondents adhered to a special diet). Light (low-calorie) food products were consumed by 73.3% of the surveyed subjects, and every tenth respondent consumed these products regularly or always. Dietary supplements were used by 84% of the surveyed population in the preceding 6 months. The most popular supplements were vitamin D, magnesium, vitamin B6, vitamin and mineral preparations, omega-3 fatty acids, and herbal supplements that alleviate menstrual pain and boost immunity. The phase of the menstrual cycle considerably affected food intake in more than half of the respondents (p = 0.012). During menstruation, 21.7% of the women (p = 0.023) experienced increased hunger, whereas 17.6% (p = 0.031) experienced food cravings, mainly sugar cravings.
On average, most women consumed 1730 mL of beverages per day, around 3.4 vegetable portions per day, 2.5 portions of cereal products per day, and 1.6 portions of sweets per day. The most frequently consumed food products were beverages, vegetables, fruit, sugar, and sweets, whereas fish, dry legumes, and nuts were consumed least frequently (Table 4). It should be noted that the consumption frequency of these groups of food products varied considerably from several times per day to several times per month. The following groups of food products were consumed least frequently: fermented dairy products, alcohol, fish, potatoes, and dry legumes. In this context, only reduced alcohol consumption can be regarded as a positive factor.
In the study population, dysmenorrhea/menstrual distress was linked with a higher consumption frequency of certain food groups. Women with severe dysmenorrhea consumed refined cereal products, processed meat, sugar, and animal fats significantly more frequently than women with mild menstrual pain. In turn, sweetened dairy products, whole-grain cereal products, fruit, and vegetables were consumed more frequently by women with mild intensity of menstrual pain (mild pain) (Table 4).

3.3. Evaluation of Menstrual Health Parameters and Eating Habits in Women Adhering to Two Dietary Models

Two dietary models were developed based on the groups of food products and the frequency with which these products were consumed by the surveyed women. The first model, referred to as the anti-inflammatory model, is largely consistent with the planetary health diet which is composed mainly of vegetables, fruit, whole-grain cereal products, and legumes, and is characterized by reduced consumption of red meat, processed meat, refined cereal products, starchy vegetables, and added sugar. The second model, referred to as the proinflammatory model, involved higher consumption of processed foods, in particular refined cereal products, processed meat, animal fats, potatoes, sugar, sweets, sweetened beverages, and fast foods, and reduced consumption of vegetables, fruit, dairy products, and high-fiber cereal products. Based on the declared consumption of various groups of food products, 324 women (64.6%) were included in the first model, and 181 women (35.4%) were included in the second model (p = 0.0231). Smoking and alcohol consumption were the main health-related parameters that differentiated the participants. The number of women who had never smoked and consumed alcohol sporadically (less than several times per month) was significantly higher in model 1 than in model 2 (65.6% vs. 41.9%, p = 0.027, and 52.1% vs. 34.8%, p = 0.031, respectively).
No significant differences in average BMI values were observed between women following model 1 and model 2 (22.7 ± 4.6 vs. 22.3 ± 3.8 kg/m2, respectively, p = 0.236). However, the number of women with a healthy BMI was significantly higher in model 1 than in model 2 (79.1% vs. 63.0%, p = 0.004). The percentage of overweight and obese women was significantly higher in model 2 than in model 1 (37.0% vs. 15.9%), but no significant differences in the percentage of women with gynoid and android obesity were noted between models.
The percentage of women experiencing low intensity of menstrual pain (mild pain) was significantly higher in model 1 (41.9%) than in model 2 (6%) (Table 5). Women adhering to the anti-inflammatory diet were also less affected by other menstrual distress symptoms.
The use of dietary supplements, consumption of food products with a decreased content of one or more nutrients, and consumption of low-calorie foods did not differ significantly between the compared models (p > 0.05). Women adhering to the proinflammatory diet experienced hunger significantly more often (p = 0.28) and more frequently consumed a higher number of meals per day (p = 0.038) during menstruation. Women from the compared models differed significantly in their knowledge about the menstrual cycle and physiological changes in the body (p < 0.05). Women adhering to the anti-inflammatory diet had higher levels of knowledge.
Education was a factor that significantly influenced the participants’ knowledge about the effect of dietary components such as saturated fatty acids (Figure 1), vitamin D (Figure 2), and simple sugars (Figure 3) on the menstrual cycle.
Most participants were of the opinion that a diet rich in unsaturated fatty acids (54.1%, p = 0.0941), vitamin D (68.9%, p = 0.0231), zinc, selenium, and iodine (68.9%, p = 0.162), B vitamins (76.4%, p = 0.0712), and antioxidants (66.7%, p = 0.172) contributes to a healthy menstrual cycle. Only 36.4% of the surveyed women identified saturated fatty acids and 35.4% identified simple sugars as dietary components that do not contribute to a healthy menstrual cycle.

4. Discussion

The literature on the relationship between diet and menstrual distress is selective and ambiguous. According to research, there is evidence to suggest that diet is linked with menstrual distress, including dysmenorrhea and/or other menstrual distress symptoms. However, most of the published studies are of low quality and rely on different methodologies (for diagnosing menstrual pain or collecting information about the participants’ diets), which prevents a reliable comparison of data and the formulation of conclusions. Most studies on the subject were conducted in Asia and Africa, whereas only a handful of trials were carried out in Europe, including in Spain [18], Serbia [19], and Italy [20,21], which limits the scope of the available data. Two Polish epidemiological studies demonstrated that dysmenorrhea affects 65% of Polish women [22,23]. In the work of Barcikowska et al. [24], only 68 of the studied subjects (6.0%) did not report any symptoms of dysmenorrhea. In contrast, Szymańska et al. [13] assessed the influence of adherence to a dietary model on menstruation distress only in women with heavy and painful menstruation. The present study contributes new knowledge about the influence of diet and the proposed dietary models on the menstrual cycle and distress in a population of Polish women.
Recent studies have reported that in women who do not receive hormonal therapy (contraception, hormone replacement therapy), hormonal changes during the menstrual cycle have a significant impact on eating habits. An awareness of these changes can help women control their food intake and maintain normal weight [25,26]. The premenstrual syndrome (PMS) may predispose women to changes in appetite and food cravings [26,27]. In the population analyzed in this study, nearly a quarter of the surveyed women experienced increased appetite, including sugar cravings, during menstruation, and high pain intensity was significantly correlated with increased consumption of sweets (p = 0.001). Similar results were reported by Lefebvre et al. [28] who analyzed women’s preferences for various groups of food products during the menstrual cycle. They found that most menstruating women craved fruit, sweets, and carbohydrates [28]. One of the hypotheses to be considered for the increase in carbohydrate intake during menstruation is the relationship between simple carbohydrates (high glycemic index) and a higher production of cerebral serotonin which reduces the negative mood effects [29]. It is believed that women unconsciously increase carbohydrate consumption in the days prior to menstruation to produce neurotransmitters that are related to mood improvement because carbohydrates, especially simple carbohydrates, increase the availability of tryptophan, a precursor of serotonin in the brain [29,30,31].
According to many researchers, dietary factors, lifestyle factors, and dietary models that potentially affect the intensity of menstrual pain should be identified. Research has shown that lifestyle habits, including the frequency of breakfast consumption, were associated with menstrual pain. In the present study, women with mild menstrual pain consumed regular meals (74.1% vs. 69.3%, p = 0.0031) and breakfasts (63.9% vs. 58.1%, p = 0.046) more frequently than women with severe menstrual pain. Similar results were noted in a study of Japanese women aged 18–20 years, where respondents who consumed breakfast 0–3 times per week experienced irregular menstrual cycles and severe menstrual pain significantly more often than women who consumed breakfast 4–7 days per week [32,33].
Menstrual health is integral to women’s overall health and well-being. Despite the above, menstrual disorders remain insufficiently investigated, and some women have very little knowledge about the menstrual cycle. In the Western world, women tend to be more knowledgeable, and menstruation is no longer regarded as a taboo subject [34], but the physiological basis of menstruation, biological changes at puberty, the menstrual cycle, and infection risks posed by poor menstruation hygiene are hardly ever discussed openly [35,36]. A study conducted in Bangladesh revealed that most adolescent girls lacked scientific knowledge about menstruation and puberty, and adolescents were reluctant to address this topic or seek treatment for menstrual distress due to popular myths, misconceptions, and other cultural biases [37]. In a study of 125 American women, 52.8% of the participants had a high knowledge about the ovulatory cycle, whereas only 50.4% of the respondents were familiar with the average duration of menstrual flow [38]. Lungdsberg [39] investigated 1000 American women of various ethnicity, socioeconomic status, and educational background, and found that approximately 40% of the respondents were not fully familiar with the ovulatory cycle. A survey of 14- to 21-year-old girls and women conducted by Plan International UK in the United Kingdom and Ireland revealed that one in seven participants did not know what was happening during their first menstruation [40]. In 2020, a study carried out in Poland by the Kulczyk Foundation also demonstrated that nearly 40% of the surveyed girls and women aged 15–45 years had insufficient knowledge about the menstrual cycle, limited access to reliable information about menstruation, and a decreased quality of life and well-being [41]. In the present study, more than 60% of the participants had sufficient knowledge about the physiology of the menstrual cycle (education was a significantly differentiating factor, p < 0.002; 73% of university graduates vs. only 36% of women with secondary school education had adequate levels of knowledge), but more than a third of the respondents were not familiar with the length of the menstrual cycle, and 24% could not indicate the successive phases of the cycle.
Many women relied on alternative methods of self-care that were not always optimal. Similarly to this study, Fernández-Martínez [42] observed that non-steroidal anti-inflammatory drugs were the main self-care strategy of alleviating menstrual pain. In an epidemiological study of Danish women, the prevalence of menstrual pain (dysmenorrhea) was found to be inversely associated with the dietary intake of fish oil (n-3 fatty acid) and vitamin B12. These findings support the hypothesis that menstrual cramps, which are prostaglandin-mediated, can be influenced by dietary fatty acids, and that fish oil supplements could be potentially used to treat or prevent dysmenorrhea [43]. A high ratio of dietary omega-3 to omega-6 fatty acids could potentially alleviate dysmenorrhea. According to Hansen [44], diets rich in polyunsaturated fatty acids (PUFAs) can decrease the consumption of non-steroidal anti-inflammatory drugs during menstruation. In the current study, more than 80% of the surveyed women used dietary supplements, including remedies that alleviate menstrual pain and discomfort.
Adherence to a dietary pattern could be a factor that affects health, including menstrual health. However, this issue has been investigated by a small number of reliable studies [13,45,46]. Similarly to the present study, Szymanska et al. [13] found that adherence to an unprocessed diet based on the Mediterranean diet or the anti-inflammatory diet reduced pain intensity or decreased the incidence of menstrual distress. The cited authors analyzed the consumption frequency of selected food groups, such as vegetables, fruit, dairy, meat, legumes, fish, fast foods/salty products, and sweets. The presented findings can guide the development of new therapies for relieving menstrual pain.

Strengths and Limitations

Despite the fact that menstrual distress, in particular dysmenorrhea, affects a large portion of the female population, only a few studies have addressed the relationship between menstrual distress symptoms and diet. Most of the studies have been conducted in Asia on small population samples, and they investigated only a limited number of food products. The present study has several strengths. Above all, attempts were made to examine the complex relationship between menstrual distress symptoms, in particular dysmenorrhea, and Polish women’s diets. In addition, the study sample was selected based on a narrow set of inclusion criteria, and validated tools were used assess menstrual pain and the participants’ diets. The results can be used to draw reliable conclusions about the influence of diet on menstrual distress and to explore the underlying mechanisms of action. Two dietary models were identified and correlated with menstrual health factors, lifestyle factors, and women’s knowledge about the menstrual cycle. The present findings can be used to formulate the objectives of health and nutrition education programs for women of reproductive age. Furthermore, moderate and severe menstrual pain was reported by a relatively high number of the surveyed women, which increased the power of statistical tests.
The main limitation of the study is that the study sample was not randomly selected, and that cross-sectional data were collected. As a result, the causes of menstrual distress could not be identified, and only the presence of correlations or relationships between the analyzed factors in the studied group of women could be determined.

5. Conclusions

Can menstrual health be linked to women’s diet and nutritional knowledge? Can adherence to a dietary pattern confer potential benefits and influence the severity of menstrual discomfort? This study showed that in the analyzed population, menstrual pain/distress was associated with the consumption frequency of selected groups of food products. Two dietary models that potentially affect the menstrual cycle were identified. Consumption of a diet based on the principles of the planetary diet promoted a reduction in menstrual discomfort. Women consuming an anti-inflammatory diet containing low-processed products (vegetables, fruit, whole-grain cereals, dairy and legumes) experienced significantly less menstrual pain. In contrast, consumption of highly processed foods, including sweets, processed meat, foods high in saturated fat and low in fiber, was more frequently associated with increased menstrual pain and discomfort.
Significant differences in knowledge about the menstrual cycle and physiological changes in the body were observed between women adhering to the compared dietary models. The results indicate that an educational program targeting women of reproductive age and health professionals should be implemented to disseminate knowledge on the impact of diet and lifestyle factors on the alleviation of menstrual distress symptoms.

Author Contributions

A.C., M.K. and M.P.-S. were responsible for the concept and design of the main study. J.K., P.K. and A.C. were responsible for data cleaning and statistical analysis. M.K., P.K., M.P.-S. and J.K. were responsible for data interpretation for this particular paper, for writing the manuscript, and for data collection for the main study. M.K. and A.C. were responsible for revising the manuscript critically for important intellectual content. All authors have read and agreed to the published version of the manuscript.

Funding

The study was financially supported by the Polish Ministry of Science and Higher Education; the authors performed research with the help of volunteers (members of the Student Scientific Society of Dietetics).

Institutional Review Board Statement

The research plan was approved by the Ethics Committee of the Medical University of Lublin (KE-0254/273/2021, approval date: 16 December 2021).

Informed Consent Statement

Not applicable.

Data Availability Statement

Due to ethical restrictions and participant confidentiality, data cannot be made publicly available.

Acknowledgments

Thanks are expressed to the participants for their contributions to the study and the authors would like to thank Agnieszka Wójcik, Teresa Poniewozik, Aneta Milszmauedan and Milena Jaworska for their help with data collection.

Conflicts of Interest

The authors declare no conflict of interest.

References

  1. Kocaoz, S.; Cirpan, R.; Degirmencioglu, A.Z. The prevalence and impacts heavy menstrual bleeding on anemia, fatigue and quality of life in women of reproductive age. Pak. J. Med. Sci. 2019, 35, 365–370. [Google Scholar] [CrossRef] [PubMed]
  2. MacGregor, B.; Allaire, C.; Bedaiwy, M.A.; Yong, P.J.; Bougie, O. Disease Burden of Dysmenorrhea: Impact on Life Course Potential. Int. J. Womens Health 2023, 15, 499–509. [Google Scholar] [CrossRef] [PubMed]
  3. Schoep, M.E.; Nieboer, T.E.; van der Zanden, M.; Braat, D.D.M.; Nap, A.W. The impact of menstrual symptoms on everyday life: A survey among 42,879 women. Am. J. Obstet. Gynecol. 2019, 220, 569. [Google Scholar] [CrossRef]
  4. Yamada, K.; Kamagata, E. Reduction of quality-adjusted life years (QALYs) in patients with premenstrual dysphoric disorder (PMDD). Qual. Life Res. 2017, 26, 3069–3073. [Google Scholar] [CrossRef] [PubMed]
  5. Fernández-Martínez, E.; Onieva-Zafra, M.D.; Parra-Fernández, M.L. The Impact of Dysmenorrhea on Quality of Life among Spanish Female University Students. Int. J. Environ. Res. Public Health 2019, 16, 713. [Google Scholar] [CrossRef] [PubMed]
  6. Yoshino, O.; Takahashi, N.; Suzukamo, Y. Menstrual symptoms, health-related quality of life, and work productivity in Japanese women with dysmenorrhea receiving different treatments: Prospective observational study. Adv. Ther. 2022, 39, 2562–2577. [Google Scholar] [CrossRef] [PubMed]
  7. Mizuta, R.; Maeda, N.; Tashiro, T.; Suzuki, Y.; Oda, S.; Komiya, M.; Urabe, Y. Quality of life by dysmenorrhea severity in young and adult Japanese females: A web-based cross-sectional study. PLoS ONE 2023, 18, e0283130. [Google Scholar] [CrossRef] [PubMed]
  8. ACOG Committee Opinion No. 760: Dysmenorrhea and Endometriosis in the Adolescent. Obstet. Gynecol. 2018, 132, 249–258. [CrossRef]
  9. Unnisa, H.; Annam, P.; Gubba, N.C.; Begum, A.; Thatikonda, K. Assessment of quality of life and effect of non-pharmacological management in dysmenorrhea. Ann. Med. Surg. 2022, 81, 104407. [Google Scholar] [CrossRef]
  10. Kanchan, Y.; Rizwana, S.; Charu, S.; Kalpna, G.; Jitendra, J.; Goury, C. Menstrual pattern in medical students and their knowledge and attitude towards it. Int. J. Med. Health Res. 2018, 4, 19–22. [Google Scholar]
  11. Bauman, D.; Sommer, A.; Hamer, T.; Noy, D.; Elami, M.; Yogev, S.S.; Magiel, E.; Revel-Vilk, S. Reduced Activity and Quality of Life in Women Soldiers with Heavy Menstrual Bleeding and Dysmenorrhea. J. Pediatr. Adolesc. Gynecol. 2022, 35, 53–58. [Google Scholar] [CrossRef] [PubMed]
  12. Knopczyk, J.; Kaczorowska, A.; Mroczek, A. Influence of menstruation on pain of lumbar–sacra spine in women aged 20–35. In Holistic Dimension of Modern Medicine, 1st ed.; Krajewska-Kułak, E., Łukaszuk, C., Lewko, J., Kułak, W., Eds.; Uniwersytet Medyczny w Białymstoku: Białystok, Poland, 2021; Volume 8, pp. 973–982. ISBN 978-83-959846-8-6. (In Polish) [Google Scholar]
  13. Szymańska, K.; Jaworski, M.; Gotlib, J.; Panczyk, M. Elements of eating pattern and intensity of dysmenorrhea—A cross-sectional study in sample of Polish women. Med. Sci. Pulse 2020, 14, 10–17. [Google Scholar] [CrossRef]
  14. Graff, E.; Vedantam, S.; Parianos, M.; Khakoo, N.; Beiling, M.; Pearlman, M. Dietary Intake and Systemic Inflammation: Can We Use Food as Medicine? Curr. Nutr. Rep. 2023, 12, 247–254. [Google Scholar] [CrossRef] [PubMed]
  15. Wohlgemuth, K.J.; Arieta, L.R.; Brewer, G.J.; Hoselton, A.L.; Gould, L.M.; Smith-Ryan, A.E. Sex differences and considerations for female specific nutritional strategies: A narrative review. J. Int. Soc. Sports Nutr. 2021, 18, 27–46. [Google Scholar] [CrossRef] [PubMed]
  16. Cochran, W.G. Sampling Techniques, 3rd ed.; John Wiley & Sons: New York, NY, USA, 1977. [Google Scholar]
  17. Główny Urząd Statystyczny. Available online: https://stat.gov.pl/ (accessed on 22 January 2023).
  18. Onieva-Zafra, M.D.; Fernández-Martínez, E.; Abreu-Sánchez, A.; Iglesias-López, M.T.; García-Padilla, F.M.; Pedregal-González, M.; Parra-Fernández, M.L. Relationship between Diet, Menstrual Pain and other Menstrual Characteristics among Spanish Students. Nutrients 2020, 12, 1759. [Google Scholar] [CrossRef] [PubMed]
  19. Pejčić, A.; Janković, S. Risk factors for dysmenorrhea among young adult female university students. Ann. Dell’ist. Super. Di Sanita 2016, 52, 98–103. [Google Scholar] [CrossRef]
  20. Di Cintio, E.; Parazzini, F.; Tozzi, L.; Luchini, L.; Mezzopane, R.; Marchini, M.; Fedele, L. Dietary habits, reproductive and menstrual factors and risk of dysmenorrhoea. Eur. J. Epidemiol. 1997, 13, 925–930. [Google Scholar] [CrossRef]
  21. Grandi, G.; Ferrari, X.; Cannoletta, P.; Volpe, C.A. Prevalence of menstrual pain in young women: What is dysmenorrhea? J. Pain Res. 2012, 2012, 169–174. [Google Scholar] [CrossRef]
  22. Teul, I.; Kliś, K.; Jarzębak, K.; Wronka, I. The prevalence and correlates of menstrual pain in healthy university students. Ann. Acad. Medicae Stetin. 2014, 60, 89–94. [Google Scholar]
  23. Zurawiecka, M.; Wronka, I. Association of primary dysmenorrhea with anthropometrical and socioeconomic factors in polish university students. J. Obstet. Gynaecol. Res. 2018, 44, 1259–1267. [Google Scholar] [CrossRef]
  24. Barcikowska, Z.; Wójcik-Bilkiewicz, K.; Sobierajska-Rek, A.; Grzybowska, M.E.; Wąż, P.; Zorena, K. Dysmenorrhea and Associated Factors among Polish Women: A Cross-Sectional Study. Pain Res. Manag. 2020, 2020, 6161536. [Google Scholar] [CrossRef] [PubMed]
  25. Hirschberg, A.L. Sex hormones, appetite and eating behaviour in women. Maturitas 2012, 71, 248–256. [Google Scholar] [CrossRef] [PubMed]
  26. Kamemoto, K.; Yamada, M.; Matsuda, T.; Ogata, H.; Ishikawa, A.; Kanno, M.; Miyashita, M.; Sakamaki-Sunaga, M. Effects of menstrual cycle on appetite-regulating hormones and energy intake in response to cycling exercise in physically active women. J. Appl. Physiol. 2022, 132, 224–235. [Google Scholar] [CrossRef] [PubMed]
  27. Saad, G.; Strenstron, E. Calories, beauty, and ovulation: The effects of the menstrual cycle on food and appearance-related consumption. J. Cons. Psychol. 2012, 22, 102–113. [Google Scholar] [CrossRef]
  28. Lefebvre, M.; Hengartner, M.P.; Tronci, E.; Mancini, T.; Ille, F.; Röblitz, S.; Krüger, T.; Leeners, B. Food preferences throughout the menstrual cycle—A computer-assisted neuro-endocrino-psychological investigation. Physiol. Behav. 2022, 255, 113943. [Google Scholar] [CrossRef] [PubMed]
  29. Murakami, K.; Sasaki, S.; Takahashi, Y.; Uenishi, K.; Watanabe, T.; Kohri, T.; Yamasaki, M.; Watanabe, R.; Baba, K.; Shibata, K.; et al. Dietary glycemic index is associated with decreased premenstrual symptoms in young Japanese women. Nutrition 2008, 24, 554–561. [Google Scholar] [CrossRef] [PubMed]
  30. Tucci, S.A.; Murphy, L.E.; Boyland, E.J.; Dye, L.; Halford, J.C. Oral contra—Ceptive effects on food choice during the follicular and luteal phases of the menstrual cycle: A laboratory based study. Appetite 2010, 55, 388–392. [Google Scholar] [CrossRef]
  31. Gorczyca, A.M.; Sjaarda, L.A.; Mitchell, E.M.; Mitchell, E.M.; Perkins, N.J.; Schliep, K.C.; Wactawski-Wende, J.; Mumford, S.L. Changes in macronutrient, micronutrient, and food group intakes throughout the menstrual cycle in healthy, premenopausal women. Eur. J. Nutr. 2016, 55, 1181–1188. [Google Scholar] [CrossRef]
  32. Kazama, M.; Maruyama, K.; Nakamura, K. Prevalence of dysmenorrhea and its correlating lifestyle factors in Japanese female junior high school students. Tohoku J. Exp. Med. 2015, 236, 107–113. [Google Scholar] [CrossRef]
  33. Naraoka, Y.; Hosokawa, M.; Minato-Inokawa, S.; Sato, Y. Severity of Menstrual Pain Is Associated with Nutritional Intake and Lifestyle Habits. Healthcare 2023, 11, 1289. [Google Scholar] [CrossRef]
  34. Policy Brief: Women and Menstruation in the EU. Available online: https://eurohealth.ie/policy-brief-women-and-menstruation-in-the-eu-2/#_edn17 (accessed on 23 October 2023).
  35. Tjon-A-Ten, V. (Ed.) Menstrual Hygiene: A Neglected Condition for the Achievement of Several Millennium Development Goals; Europe External Policy Advisors: Brussels, Belgium, 2007; pp. 1–24. [Google Scholar]
  36. Mohammed, S.; Larsen-Reindorf, R.E. Menstrual knowledge, sociocultural restrictions, and barriers to menstrual hygiene management in Ghana: Evidence from a multi-method survey among adolescent schoolgirls and schoolboys. PLoS ONE 2020, 15, 0241106. [Google Scholar] [CrossRef] [PubMed]
  37. Haque, S.; Rahman, M.; Itsukow, K.; Mutahara, M.; Sakisaka, K. The effect of a school-based educational intervention on menstrual health: An intervention study among adolescent girls in Bangladesh. BMJ Open 2014, 4, 004607. [Google Scholar] [CrossRef] [PubMed]
  38. Ayoola, A.B.; Zandee, G.L.; Adams, Y.J. Women’s knowledge of ovulation, the menstrual cycle, and its associated reproductive changes. Birth 2016, 43, 255–262. [Google Scholar] [CrossRef] [PubMed]
  39. Lundsberg, L.S.; Pal, L.; Gariepy, A.M.; Xu, X.; Chu, M.C.; Illuzzi, J.L. Knowledge, attitudes, and practices regarding conception and fertility: A population-based survey among reproductive-age United States women. Fertil. Steril. 2014, 101, 767–774. [Google Scholar] [CrossRef] [PubMed]
  40. Tingle, C.; Vora, S. Break the Barriers: Girls’ Experiences of Menstruation in the UK Plan International UK. 2018. Available online: https://plan-uk.org/file/plan-uk-break-the-barriers-report-032018pdf/download?token=Fs-HYP3v (accessed on 20 October 2023).
  41. Menstruation. Quantitative and Qualitative Research Report. Available online: https://kulczykfoundation.org.pl/uploads/media/default/0001/05/0fbe618f4aa748170c8b3f096367e2c607888eb8.pdf (accessed on 23 October 2023).
  42. Fernández-Martínez, E.; Onieva-Zafra, M.D.; Abreu-Sánchez, A.; Fernández-Muñóz, J.J.; Parra-Fernández, M.L. Absenteeism during menstruation among nursing students in Spain. Int. J. Environ. Res. Public Health 2019, 17, 53. [Google Scholar] [CrossRef] [PubMed]
  43. Deutch, B.; Bonefeld Jørgensen, E.; Hansen, J.C. Menstrual discomfort in Danish women reduced by dietary supplements of omega-3 PUFA and B12 (fish oil or seal oil capsules). Nutr. Res. 2000, 20, 621–631. [Google Scholar] [CrossRef]
  44. Hansen, S.O.; Knudsen, U.B. Endometriosis, dysmenorrhoea and diet. Eur. J. Obstet. Gynecol. Reprod. Biol. 2013, 169, 162–171. [Google Scholar] [CrossRef]
  45. Najafi, N.; Khalkhali, H.; Moghaddam Tabrizi, F.; Zarrin, R. Major dietary patterns in relation to menstrual pain: A nested case control study. BMC Womens Health 2018, 18, 69. [Google Scholar] [CrossRef]
  46. Bajalan, Z.; Alimoradi, Z.; Moafi, F. Nutrition as a potential factor of primary dysmenorrhea: A systematic review of observational studies. Gynecol. Obstet. Investig. 2019, 84, 209–224. [Google Scholar] [CrossRef]
Figure 1. The relationship between education and the participants’ knowledge about the influence of dietary components on the menstrual cycle (saturated fatty acids).
Nutrients 16 00069 g001
Figure 2. The relationship between education and the participants’ knowledge about the influence of dietary components on the menstrual cycle (vitamin D).
Nutrients 16 00069 g002
Figure 3. The relationship between education and the participants’ knowledge about the influence of dietary components on the menstrual cycle (simple sugars).
Nutrients 16 00069 g003
Table 1. Conversion factors applied to the consumption frequency classes defined in the FFQ.
Frequency of Consumption as Defined in FFQConversion Factor to Daily Frequency
Less than once a month0.00
1–3 times a month0.07
1–2 times a week0.21
3–4 times a week0.50
5–6 times a week0.79
Once daily1.00
Twice or more daily2.00
Table 2. Sociodemographic characteristics of the studied group (N = 505).
Sociodemographic ParametersNN [%]p-Value
Place of residence <0.05
  • City with a population of >250,000
25450.3%
  • City with a population of <250,000
11021.8%
  • Rural area
14127.9%
Age <0.05
  • <25 years
19839.2%
  • >25 years
30760.8%
Marital status <0.05
  • Single
11623.0%
  • Informal relationship
25249.9%
  • Married
13727.1%
Education <0.05
  • Primary school
204%
  • Secondary school
16532.7%
  • University
31562.3%
  • Vocational school
51%
Professional status <0.05
  • Student
5711.3%
  • Student in paid employment
15931.5%
  • Employed
26652.7%
  • Unemployed
234.5%
Differences are significant at p < 0.05.
Table 3. Menstrual disorders and distress symptoms relative to the self-reported intensity of menstrual pain (VAS).
Mild Pain,
N = 147 (29.1%)
Moderate Pain,
N = 234 (46.4%)
Severe Pain,
N = 124 (24.5%)
Kruskal–Wallis Test
NN%NN%NN%
Abdominal pain8960.517775.61241000.003
Anxiety1912.915967.97560.50.005
Generalized pain2315.617373.911794.30.002
Uterine contractions10672.117072.69576.6ns
Back pain9161.217876.09778.2ns
Headache5638.15623.96854.80.012
Fatigue3926.57933.78467.70.003
Leg pain2718.414160.39677.40.002
Nausea117.5177.3108.0ns
Insomnia2919.75925.28770.20.003
Loss of appetite4631.37233.24133.1ns
Diarrhea/constipation5134.77130.34334.6ns
Heart palpitations128.22410.32721.80.041
ns—not statistically significant.
Table 4. Consumption frequency of selected groups of food products relative to the intensity of menstrual pain (tertile division, N = 505) and the odds ratios (95% confidence interval) in an analysis of the relationships between severe menstrual pain vs. mild menstrual pain and the consumption of particular food groups.
Intensity of Menstrual Painp-Value
Total N = 505MildModerateSevereSevere Menstrual Pain (Ref. Mild Menstrual Pain)
Daily FrequencyDaily FrequencyDaily FrequencyDaily Frequency
Refined cereal products1.4(0–2)1.2(0–2)1.5(0–2)1.7(0–2)0.00311.76 ** (1.06–1.98)
Whole-grain cereal products0.81(0–2)0.94(0–2)0.83(0–2)0.67(0–2)0.0230.88 * (0.64–1.02)
Milk1.5(0–2)1.5(0–2)1.4(0–2)1.4(0–2)ns0.92 (0.89–1.14)
Fermented milks0.3(0–2)0.3(0–2)0.4(0–2)0.3(0–2)ns0.94 (0.91–1.09)
Sweetened dairy products1.5(0–2)1.5(0–2)1.7(0–2)1.0(0–2)0.00160.73 (0.62–1.07)
Fresh meat0.6(0–2)0.6(0–2)0.7(0–2)0.6(0–2)ns1.02 (0.97–1.04)
Processed meat1.5(0–2)1.3(0–2)1.3(0–2)1.7(0–2)0.0021.54 * (1.12–1.87)
Fish0.2(0–1)0.2(0–1)0.2(0–1)0.2(0–1)ns1.03 (0.92–1.09)
Vegetable fats0.4(0–2)0.4(0–2)0.5(0–2)0.3(0–2)ns0.91 (0.81–1.01)
Animal fats1.6(0–2)1.4(0–2)1.3(0–2)1.8(0–2)0.0411.45 * (1.12–1.87)
Potatoes0.3(0–0.79)0.3(0–0.79)0.3(0–0.79)0.3(0–0.79)ns1.02 (0.97–1.04)
Vegetables1.7(0–2)1.8(0–2)1.5(0–2)1.1(0–2)0.00270.53 ** (0.46–0.89)
Dry legumes0.3(0–1)0.3(0–1)0.3(0–1)0.3(0–1)ns1.02 (0.97–1.05)
Nuts0.2(0–2)0.2(0–2)0.2(0–2)0.2(0–2)ns1.02 (0.98–1.07)
Fruit1.7(0–2)1.9(0–2)1.6(0–2)1.4(0–2)0.00270.71 * (0.64–0.89)
Sugar and sweets1.6(0–2)1.1(0–2)1.4(0–2)1.9(0–2)0.0012,19 ** (1.34–2.51)
Sweetened beverages0.5(0–2)0.3(0–2)0.7(0–2)0.4(0–2)0.00311.19 (1.01–1.36)
Fast foods0.7(0–1)0.7(0–1)0.8(0–1)0.7(0–1)ns1.02 (0.97–1.08)
Alcohol0.4(0–2)0.6(0–2)0.4(0–2)0.5(0–2)0.0420.91 (0.76–1.09)
Water1.7(0–2)1.6(0–2)1.1(0–2)1.8(0–2)0.00261.23 (1.01–1.46)
Statistically significant: ns—not statistically significant; * p < 0.05; ** p < 0.01.
Table 5. Menstrual health parameters, diet, and levels of knowledge in the compared dietary models.
Model 1 (Anti-Inflammatory)Model 2 (Proinflammatory)p-Value in the Chi-Squared Test
N = 324N%N = 181N%
Intensity of menstrual pain 0.015
  • mild
13641.9%116%
  • moderate
16751.5%6737%
  • severe
216.6%10357%
Regular menstrual cycle 0.041
  • yes
28989.2%13775.7%
  • no
3510.8%4424.3%
Menstrual distress symptoms 0.017
  • <3
11134.33519.3%
  • 3–8
18657.4%6737%
  • >8
278.3%7943.6%
Number of meals per day 0.038
  • 1–3
8927.5%4625.5%
  • 4
15146.6%5630.9%
  • >5
8425.9%7943.6%
Adherence to a special diet 0.028
  • yes
3310.2%4826.5%
  • no
29189.8%13373.5%
Consumption of light food products 0.225
  • never
8125%5429.8%
  • rarely
21265.4%12066.3%
  • regularly/always
319.6%73.9%
Use of dietary supplements in the previous 6 months 0.317
  • yes
26381.2%16189%
  • no
6118.8%2511%
Increased food intake during menstruation 0.037
  • yes
11234.6%10658.6%
  • no
21265.4%7541.4%
Increased hunger during menstruation 0.028
  • yes
7924.4%9451.9%
  • no
24575.6%8748.1%
Knowledge about dietary components that influence mood during menstruation 0.021
  • yes
24776.2%10256.4%
  • no
7723.8%7943.6%
Knowledge about the menstrual cycle 0.036
  • low
10532.4%9854.1%
  • high
21967.6%8345.9%
The influence of diet on the men-strual cycle 0.029
  • no influence
0-137.2%
  • low influence
5416.7%3619.9%
  • considerable influence
12438.3%7541.4%
  • very high influence
14645%5731.5%
Disclaimer/Publisher’s Note: The statements, opinions and data contained in all publications are solely those of the individual author(s) and contributor(s) and not of MDPI and/or the editor(s). MDPI and/or the editor(s) disclaim responsibility for any injury to people or property resulting from any ideas, methods, instructions or products referred to in the content.

