Vitamin D and K Supplementation Is Associated with Changes in the Methylation Profile of U266-Multiple Myeloma Cells, Influencing the Proliferative Potential and Resistance to Bortezomib


Abstract
:1. Introduction
2. Materials and Methods
2.1. Cell Culture and the Course of the Experiment
2.2. DNA Extraction and Bisulfate Conversion
2.3. Methylation Arrays
2.4. Bioinformatics Analysis of Genome-Wide Methylation
2.5. Gene Expression Analysis by qRT-PCR
3. Results
3.1. DNA Methylation Changes
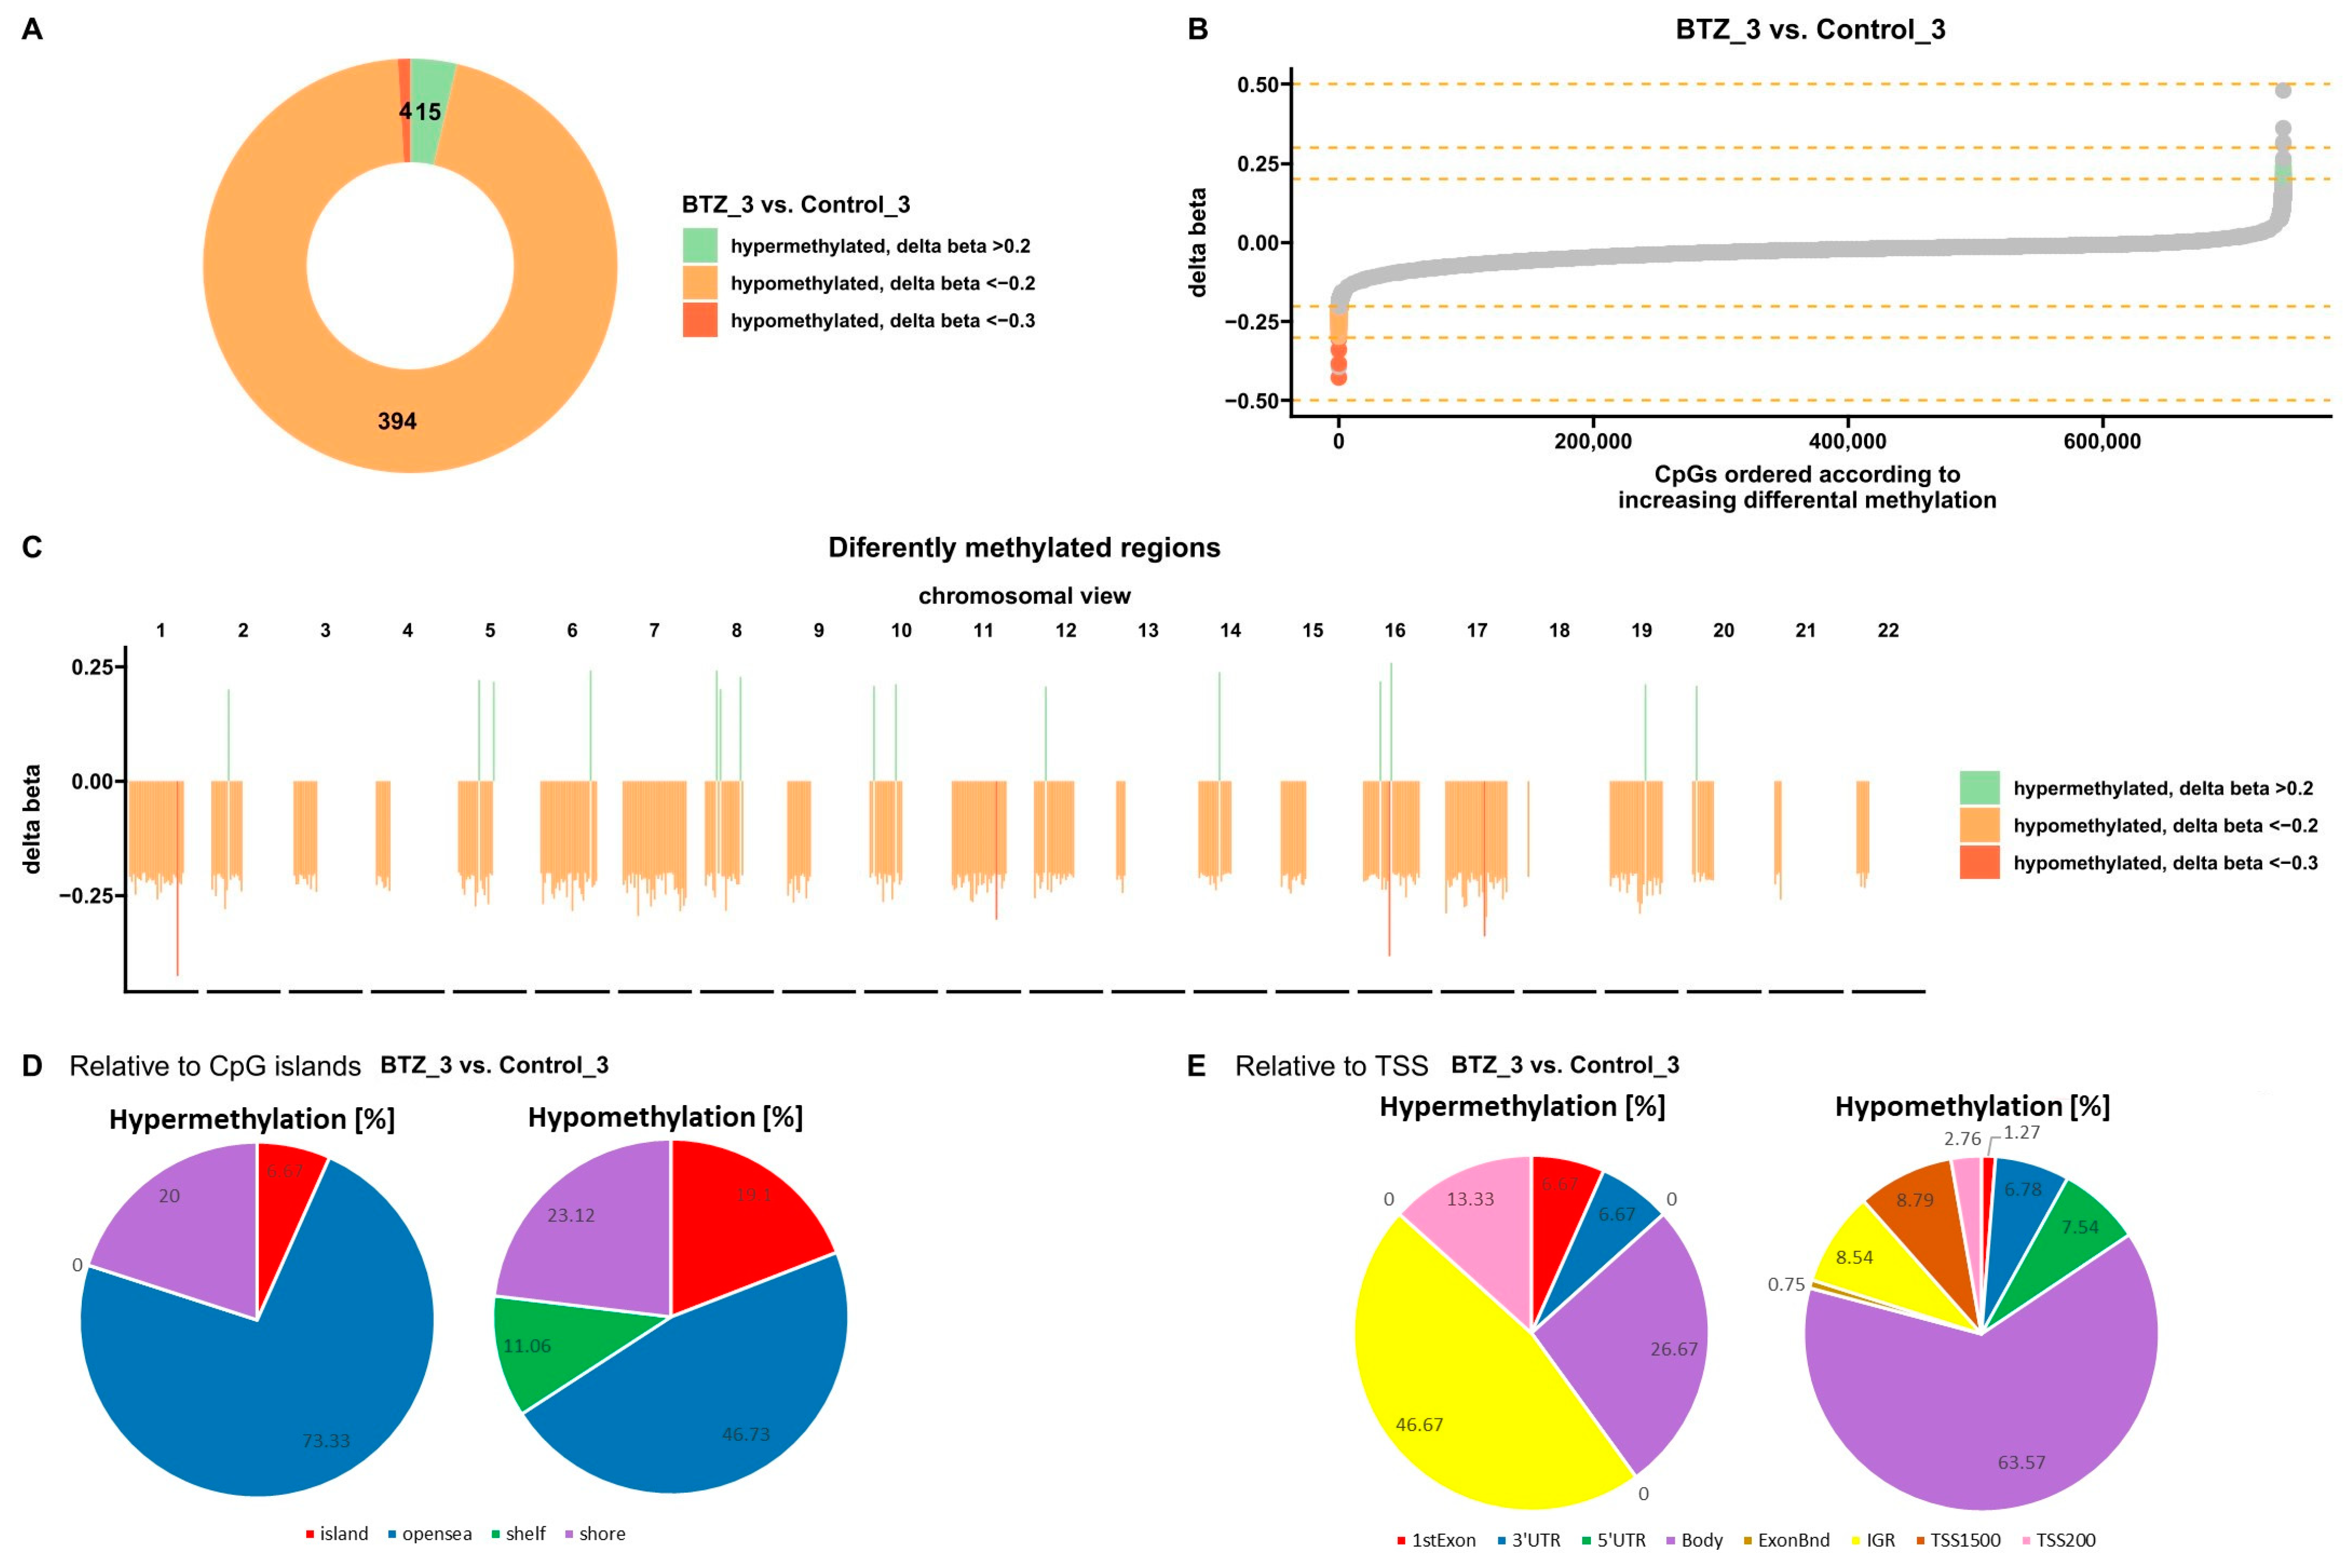
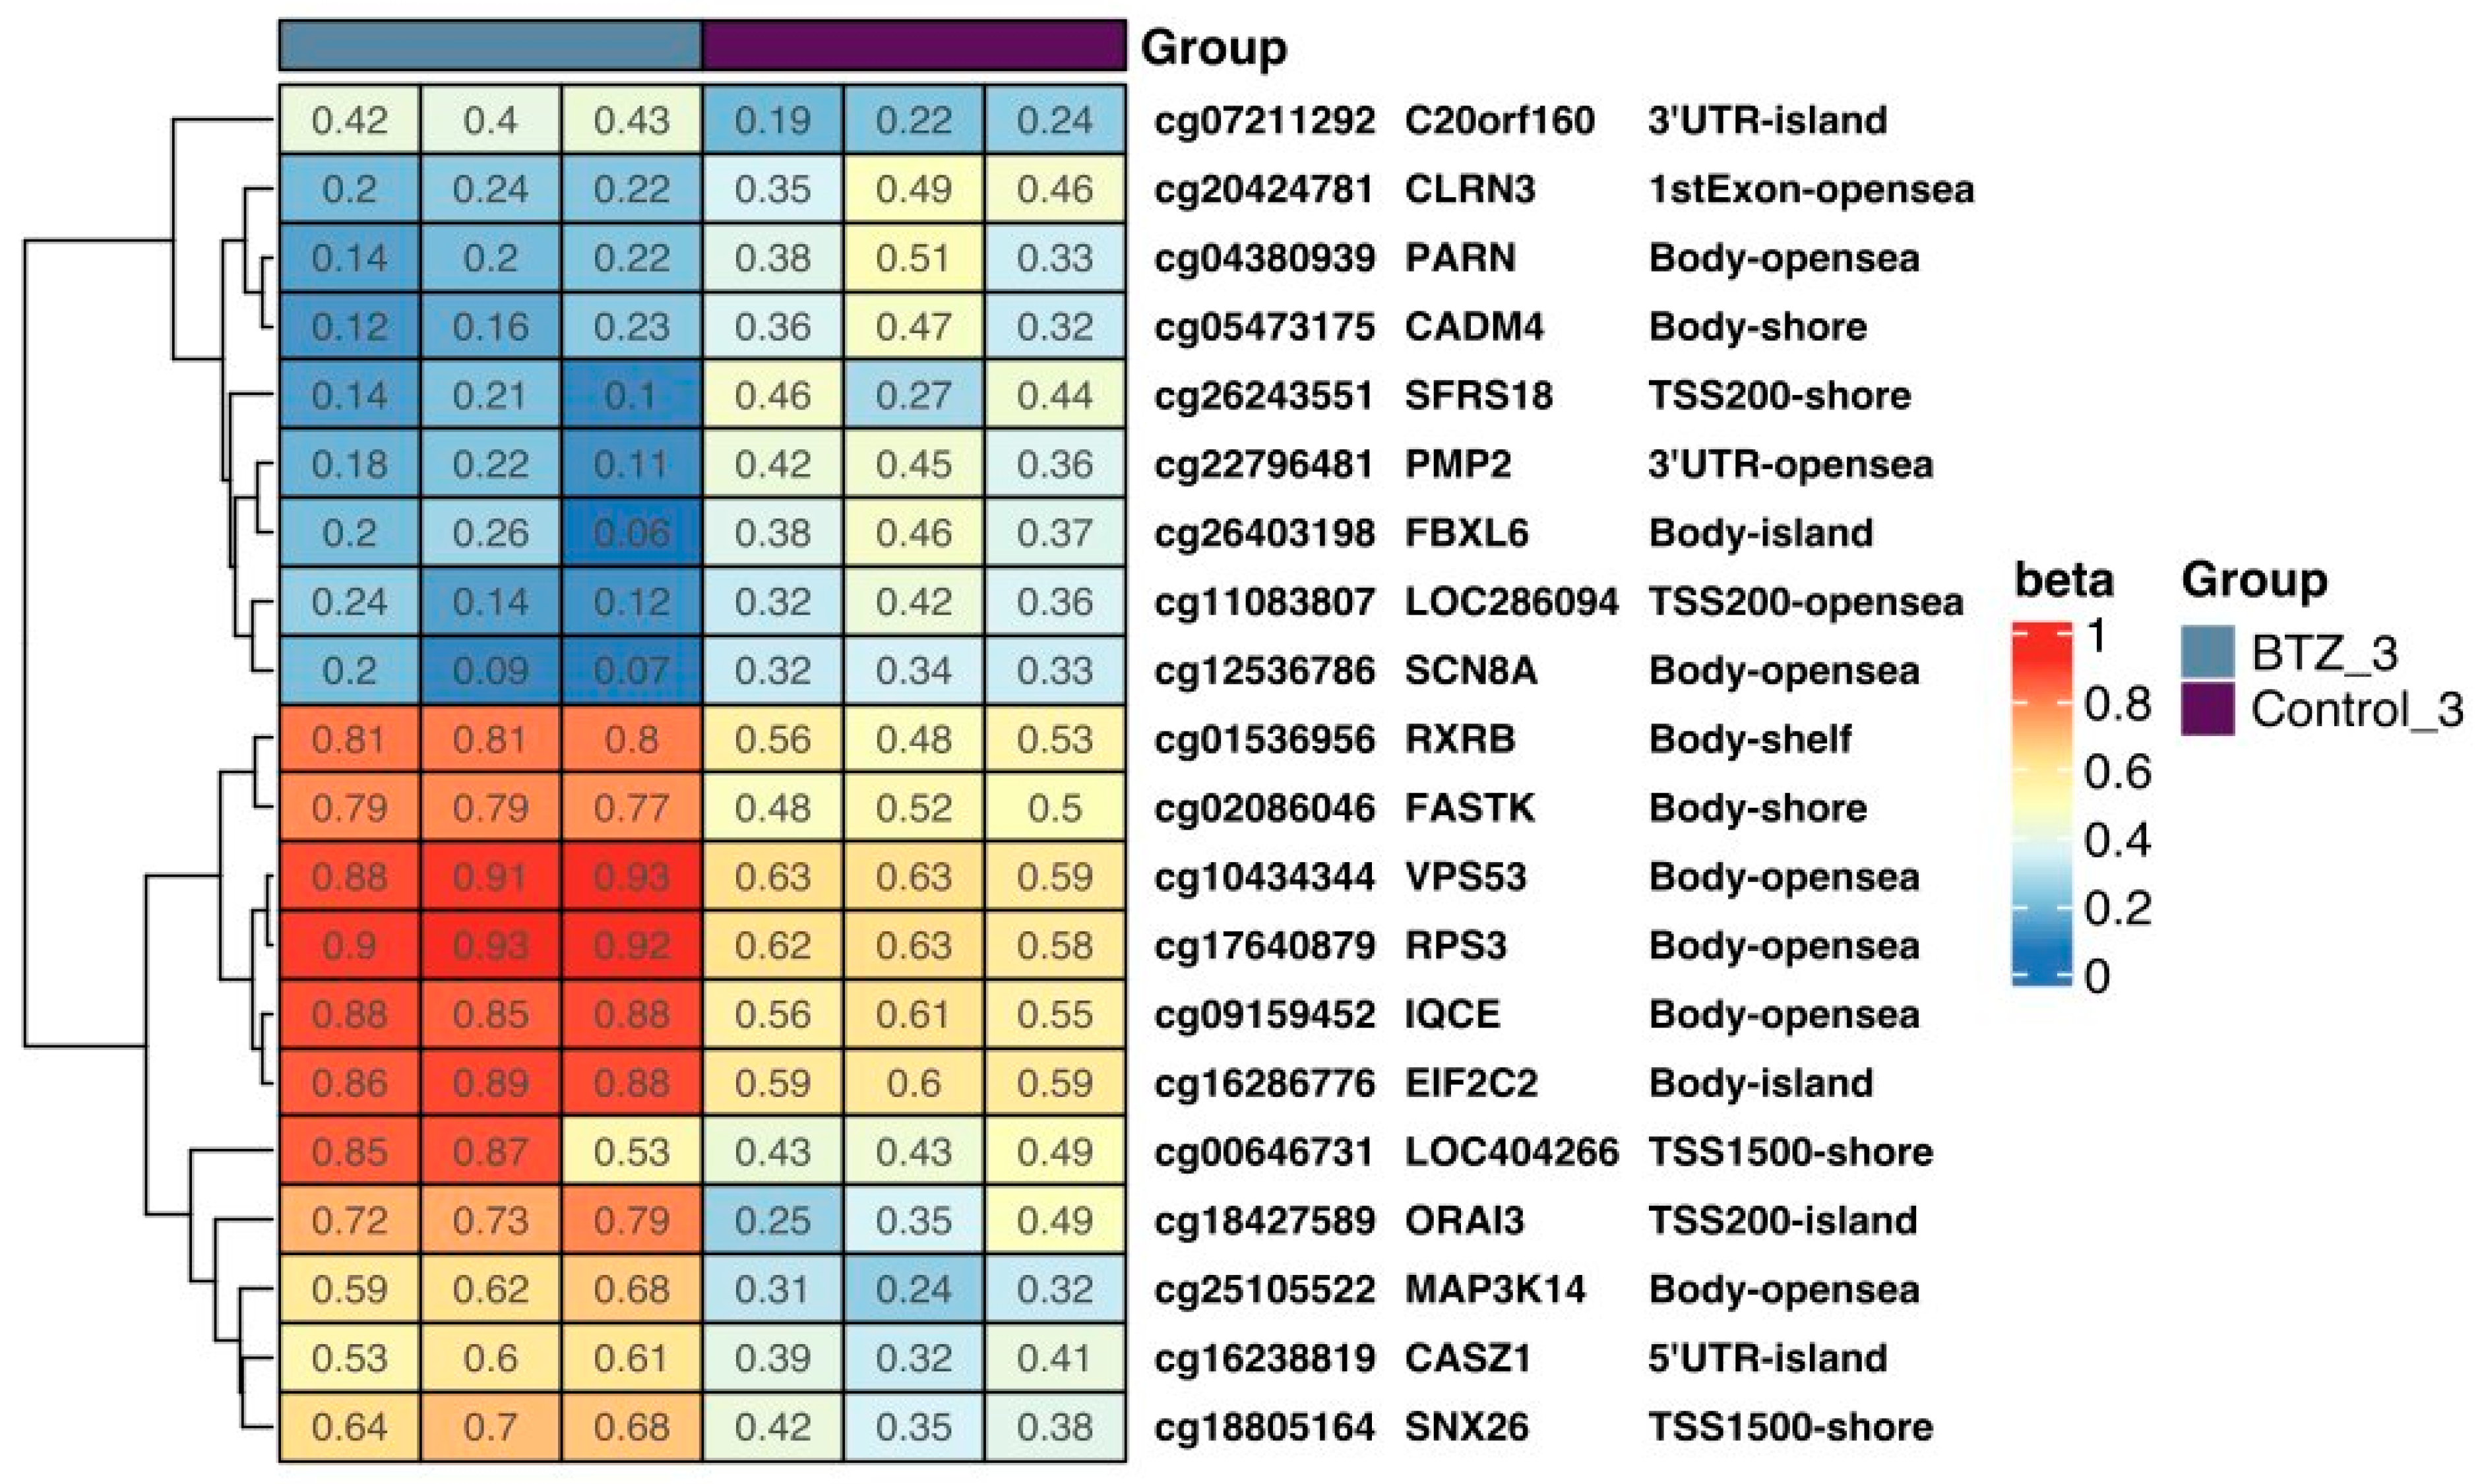
3.1.1. DNA Methylation Changes Associated with the Development of Resistance of U266 Myeloma Cells to BTZ
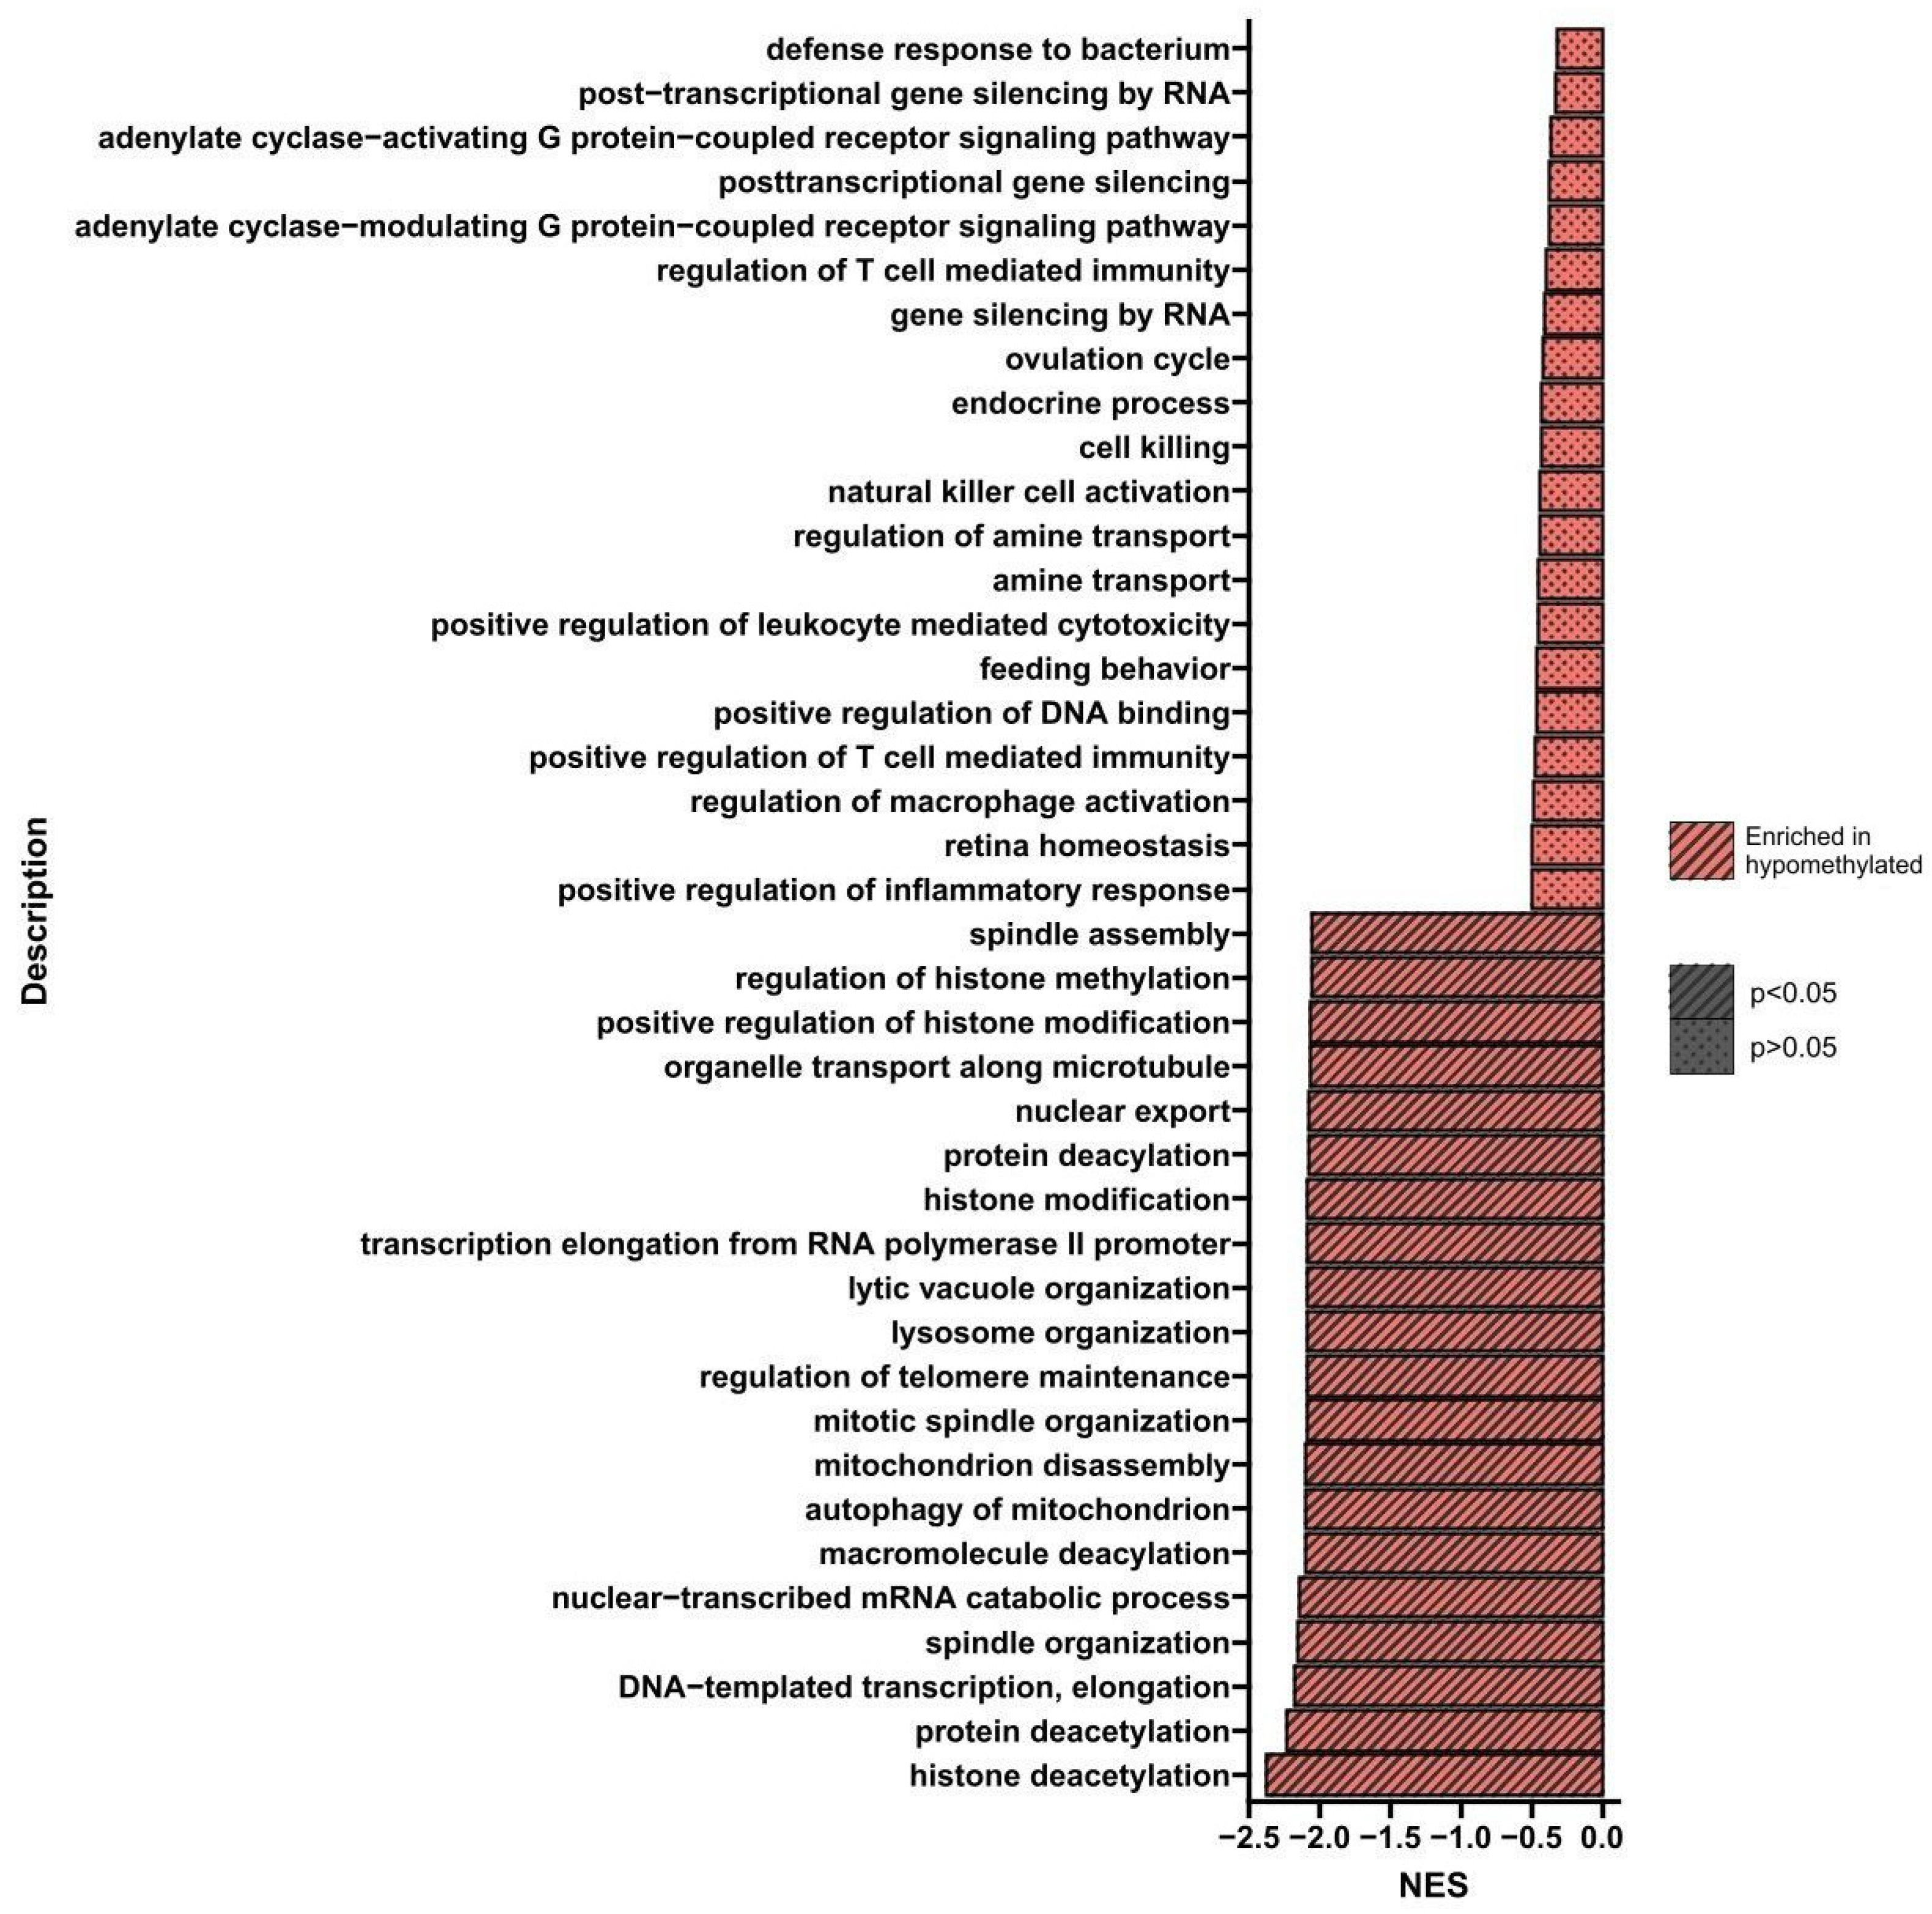
Gene Set Enrichment Analysis (GSEA)
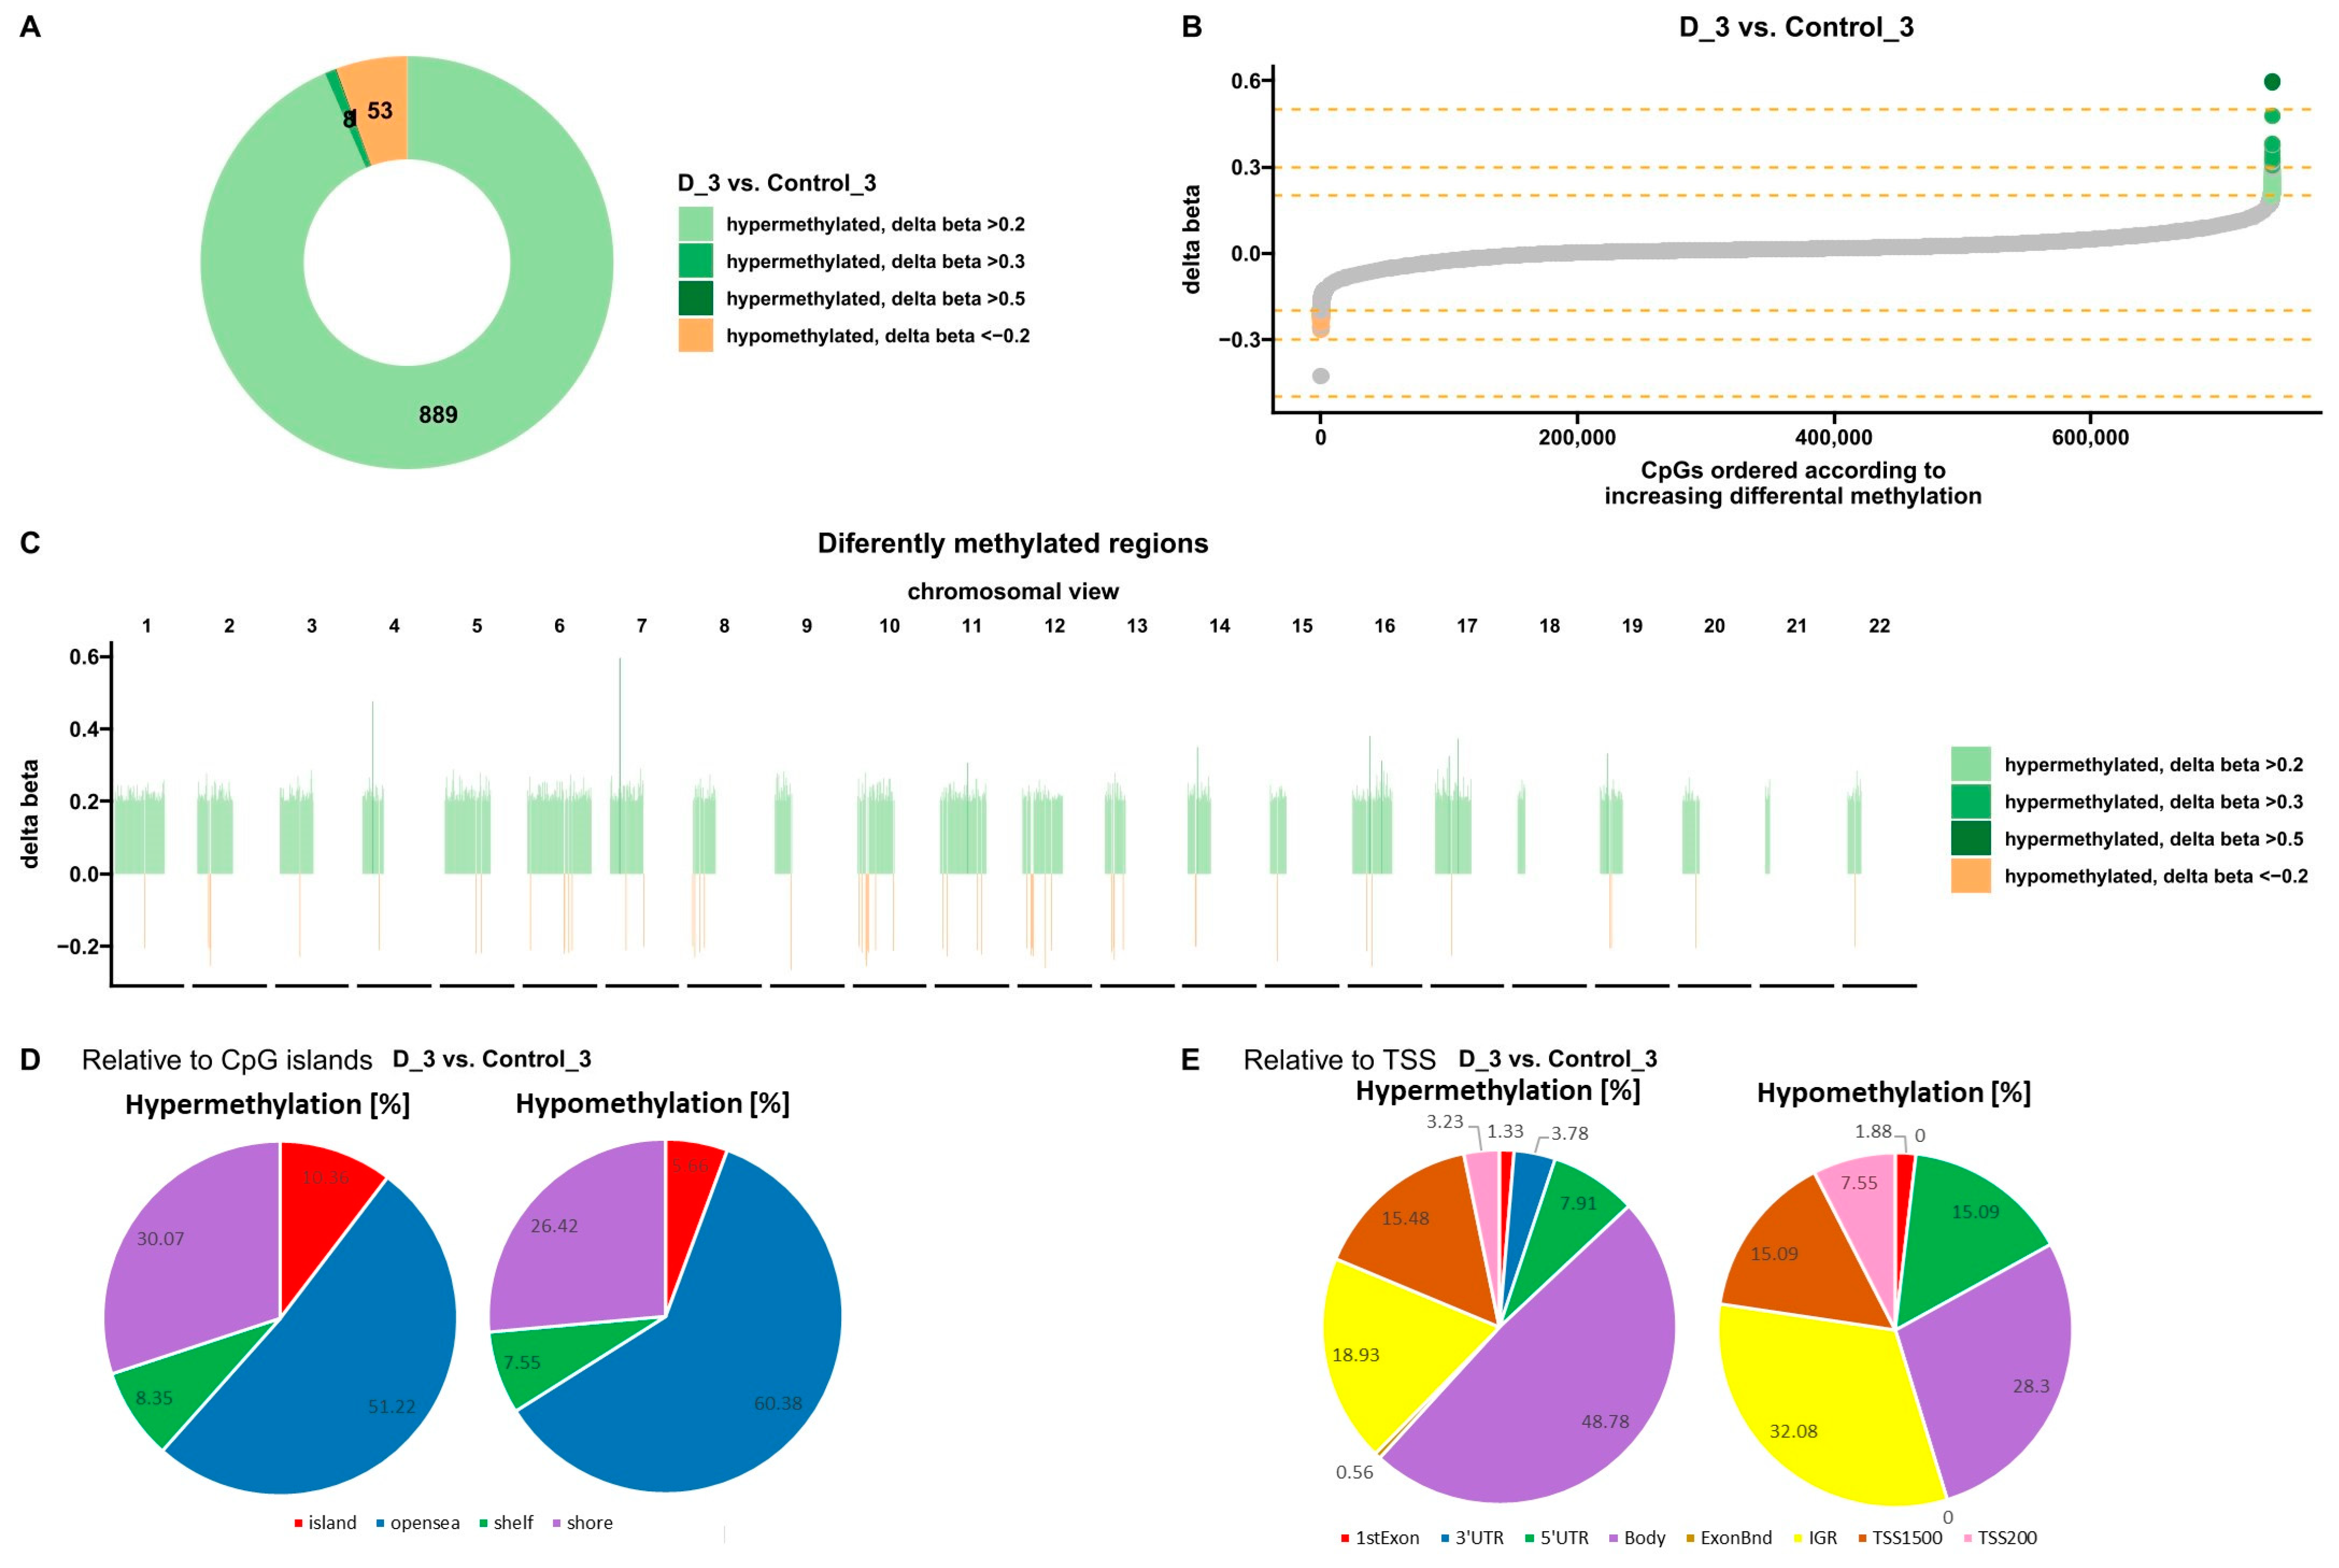
3.1.2. Effect of VD on DNA Methylation Changes in U266 Myeloma Cells
Gene Set Enrichment Analysis (GSEA)
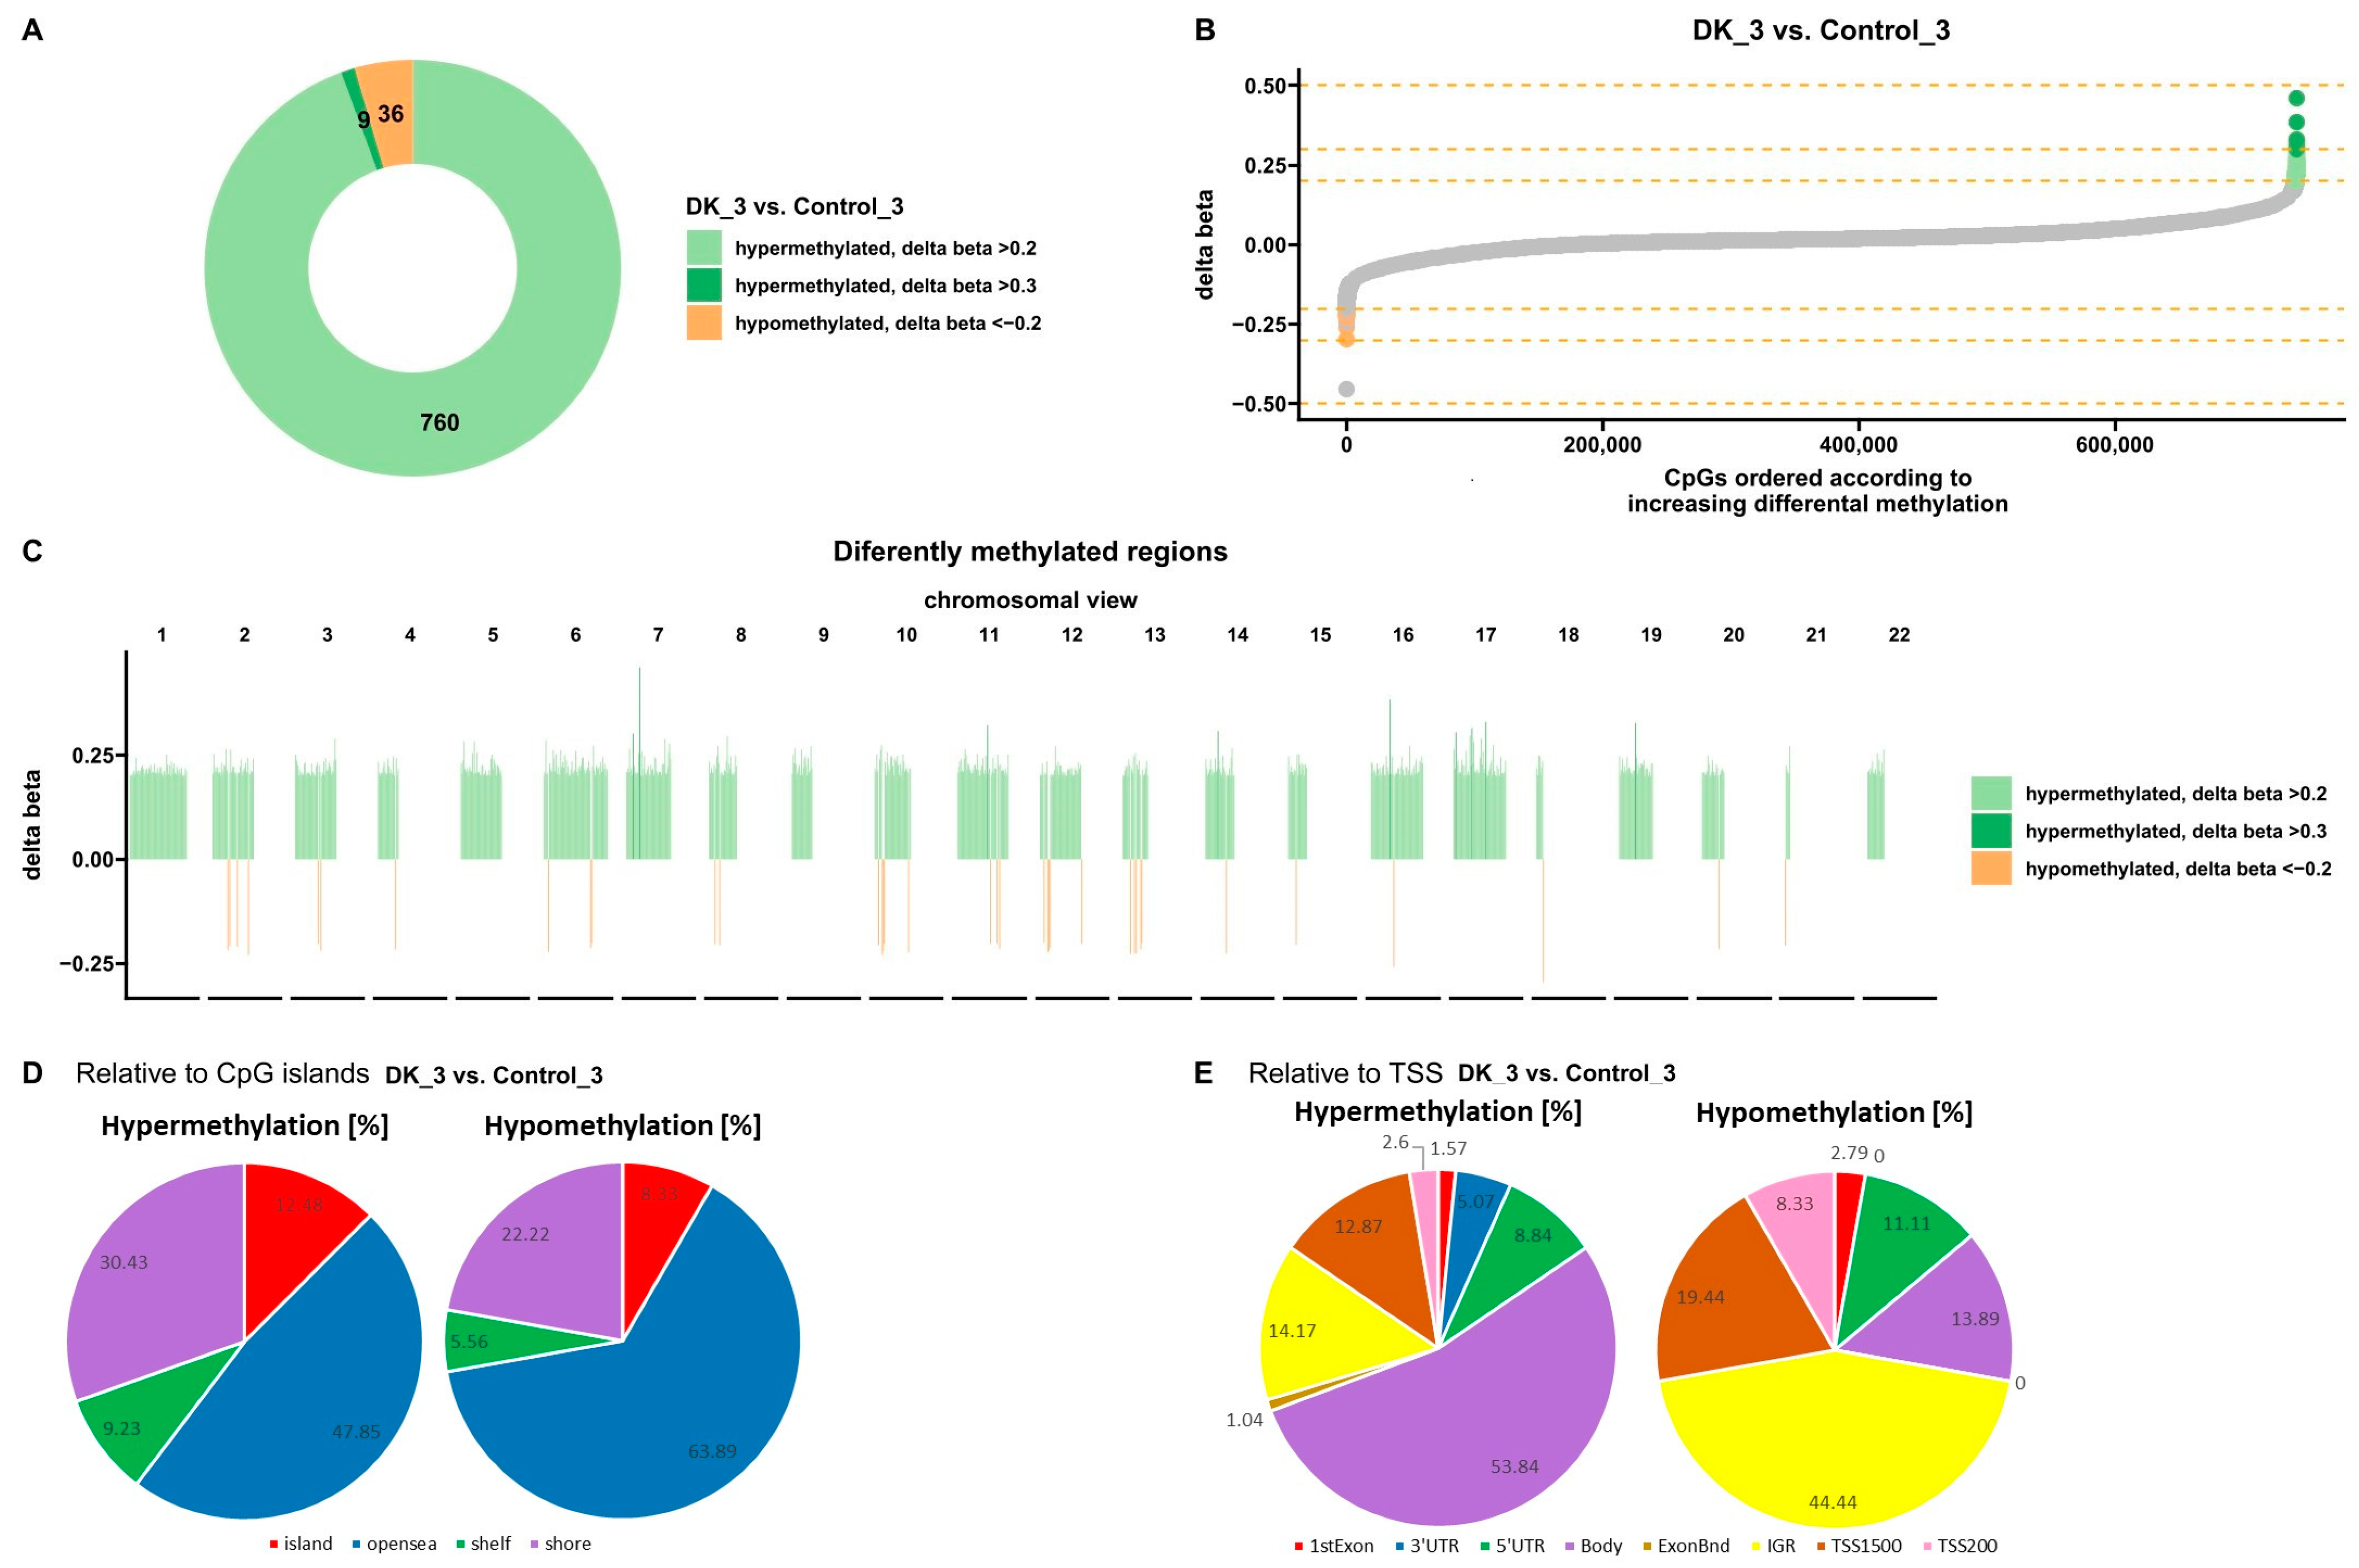
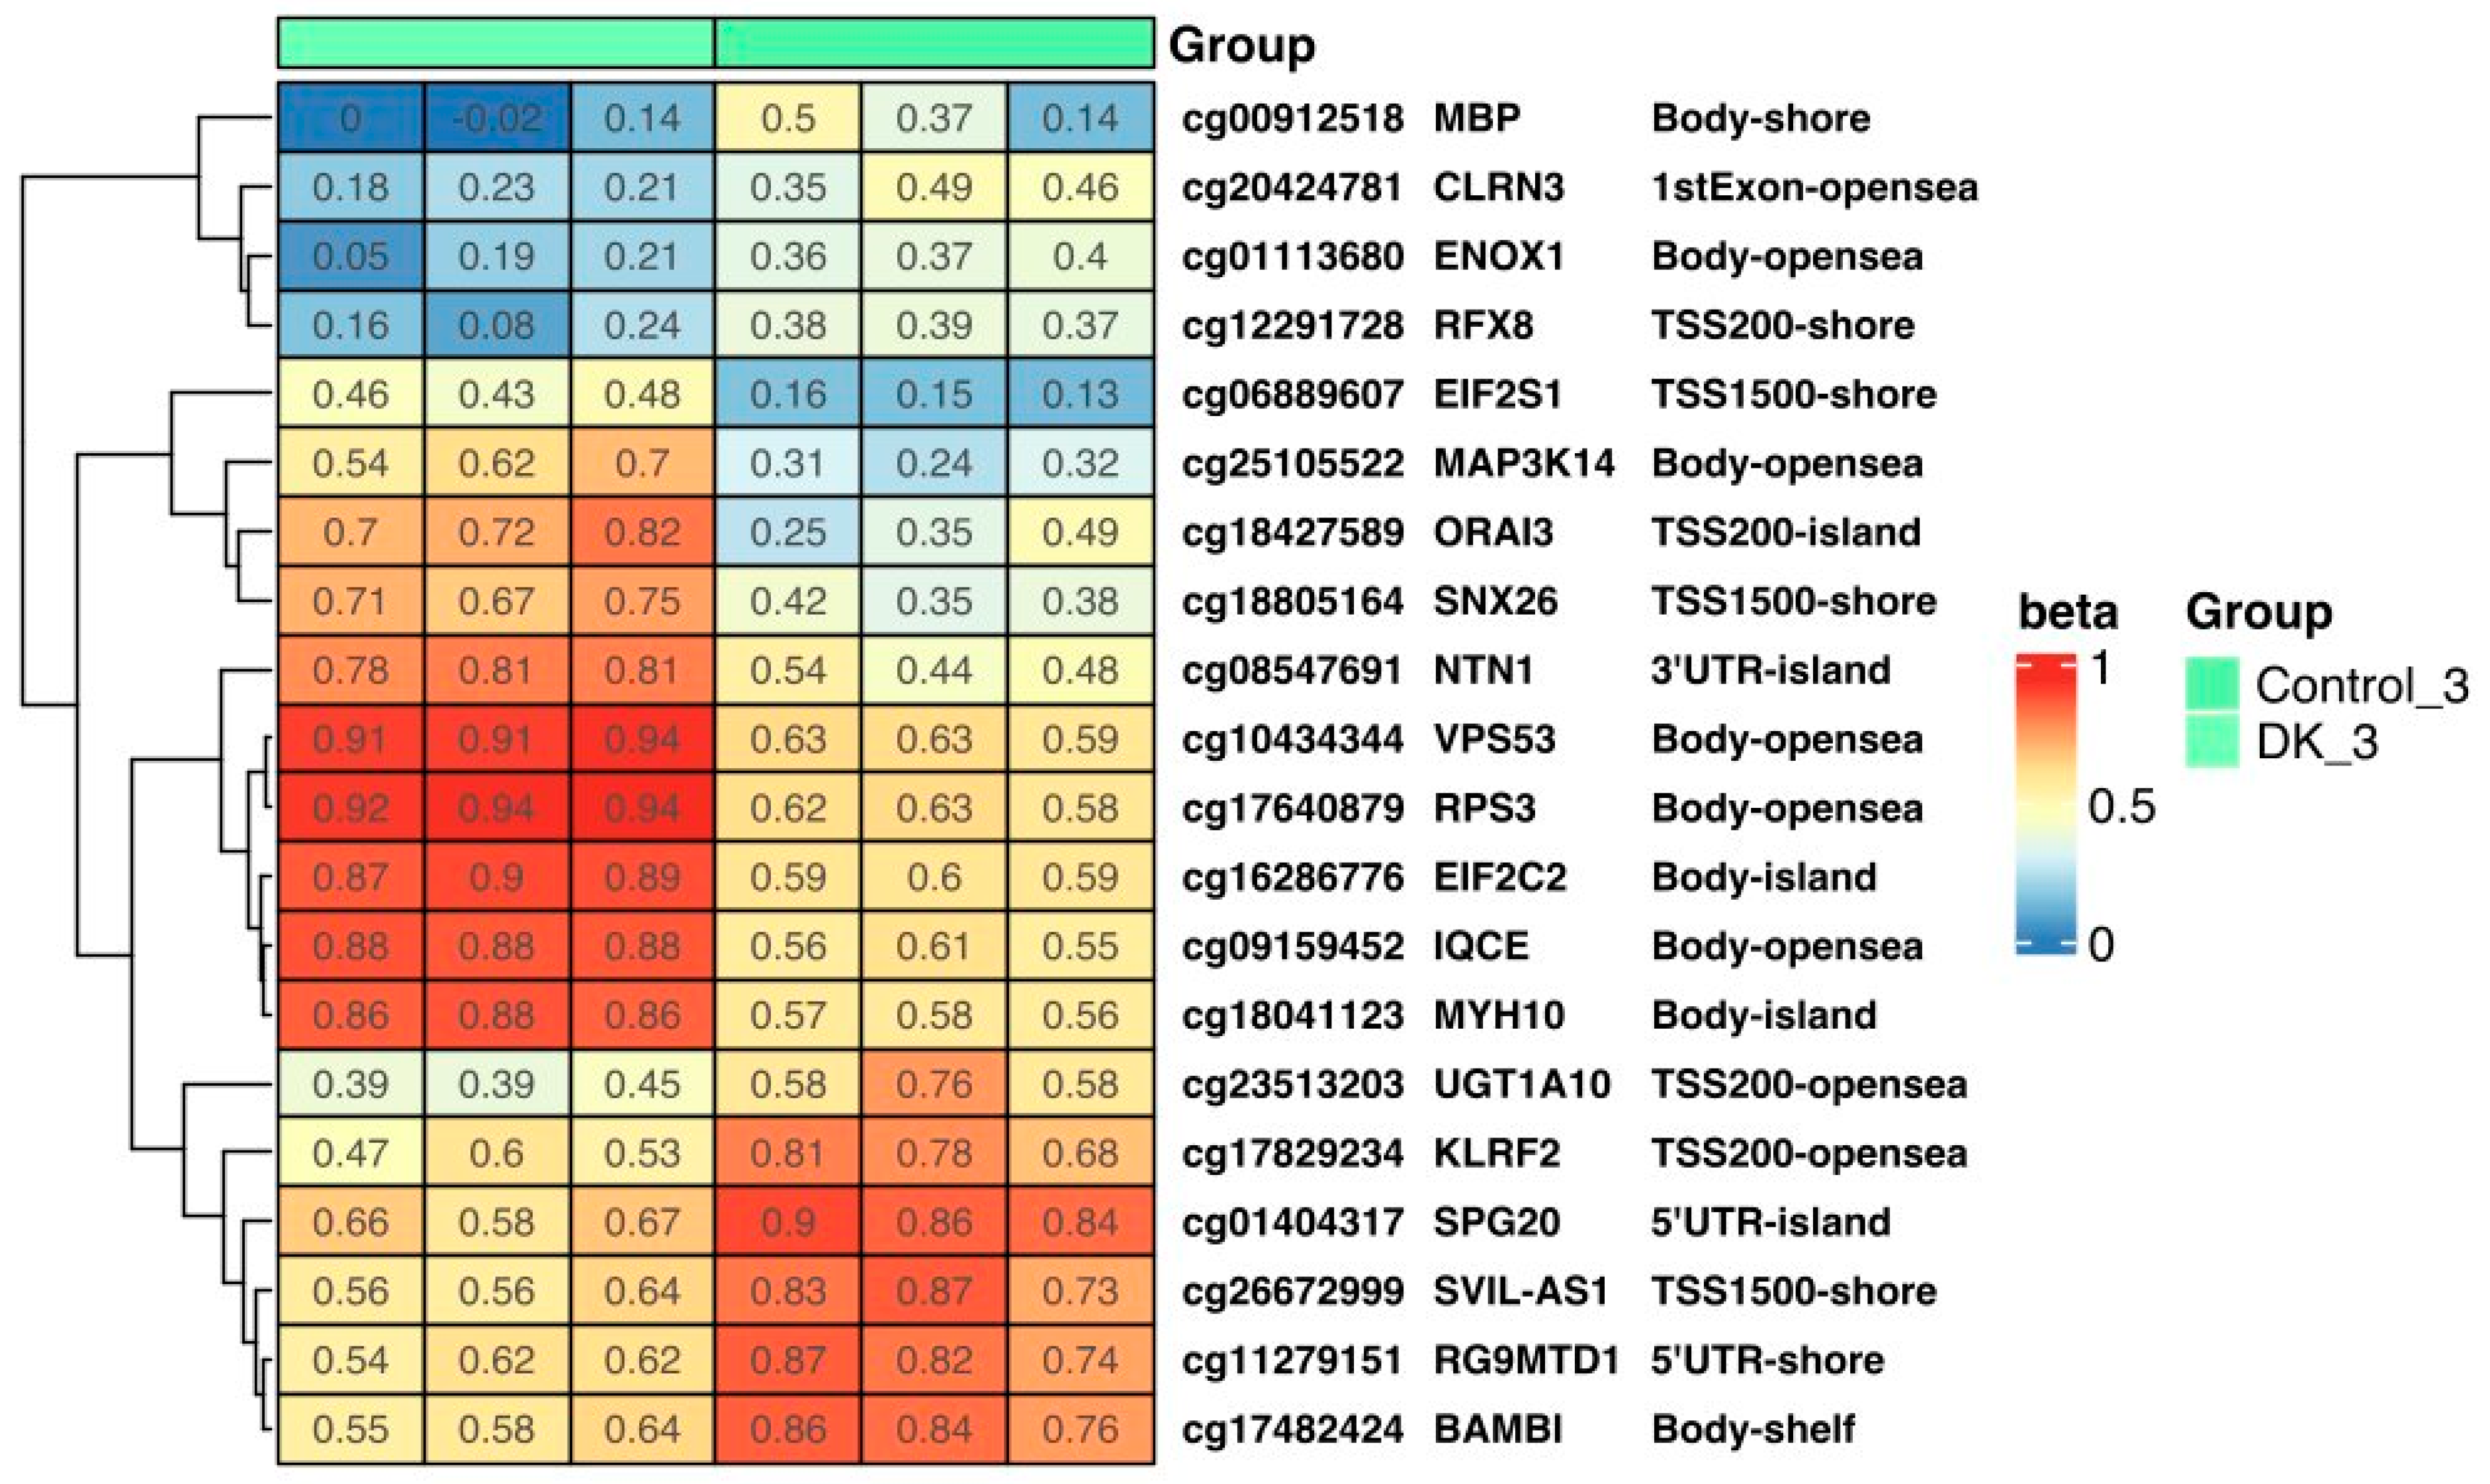
3.1.3. Effect of VD and VK on DNA Methylation Changes in U266 Myeloma Cells
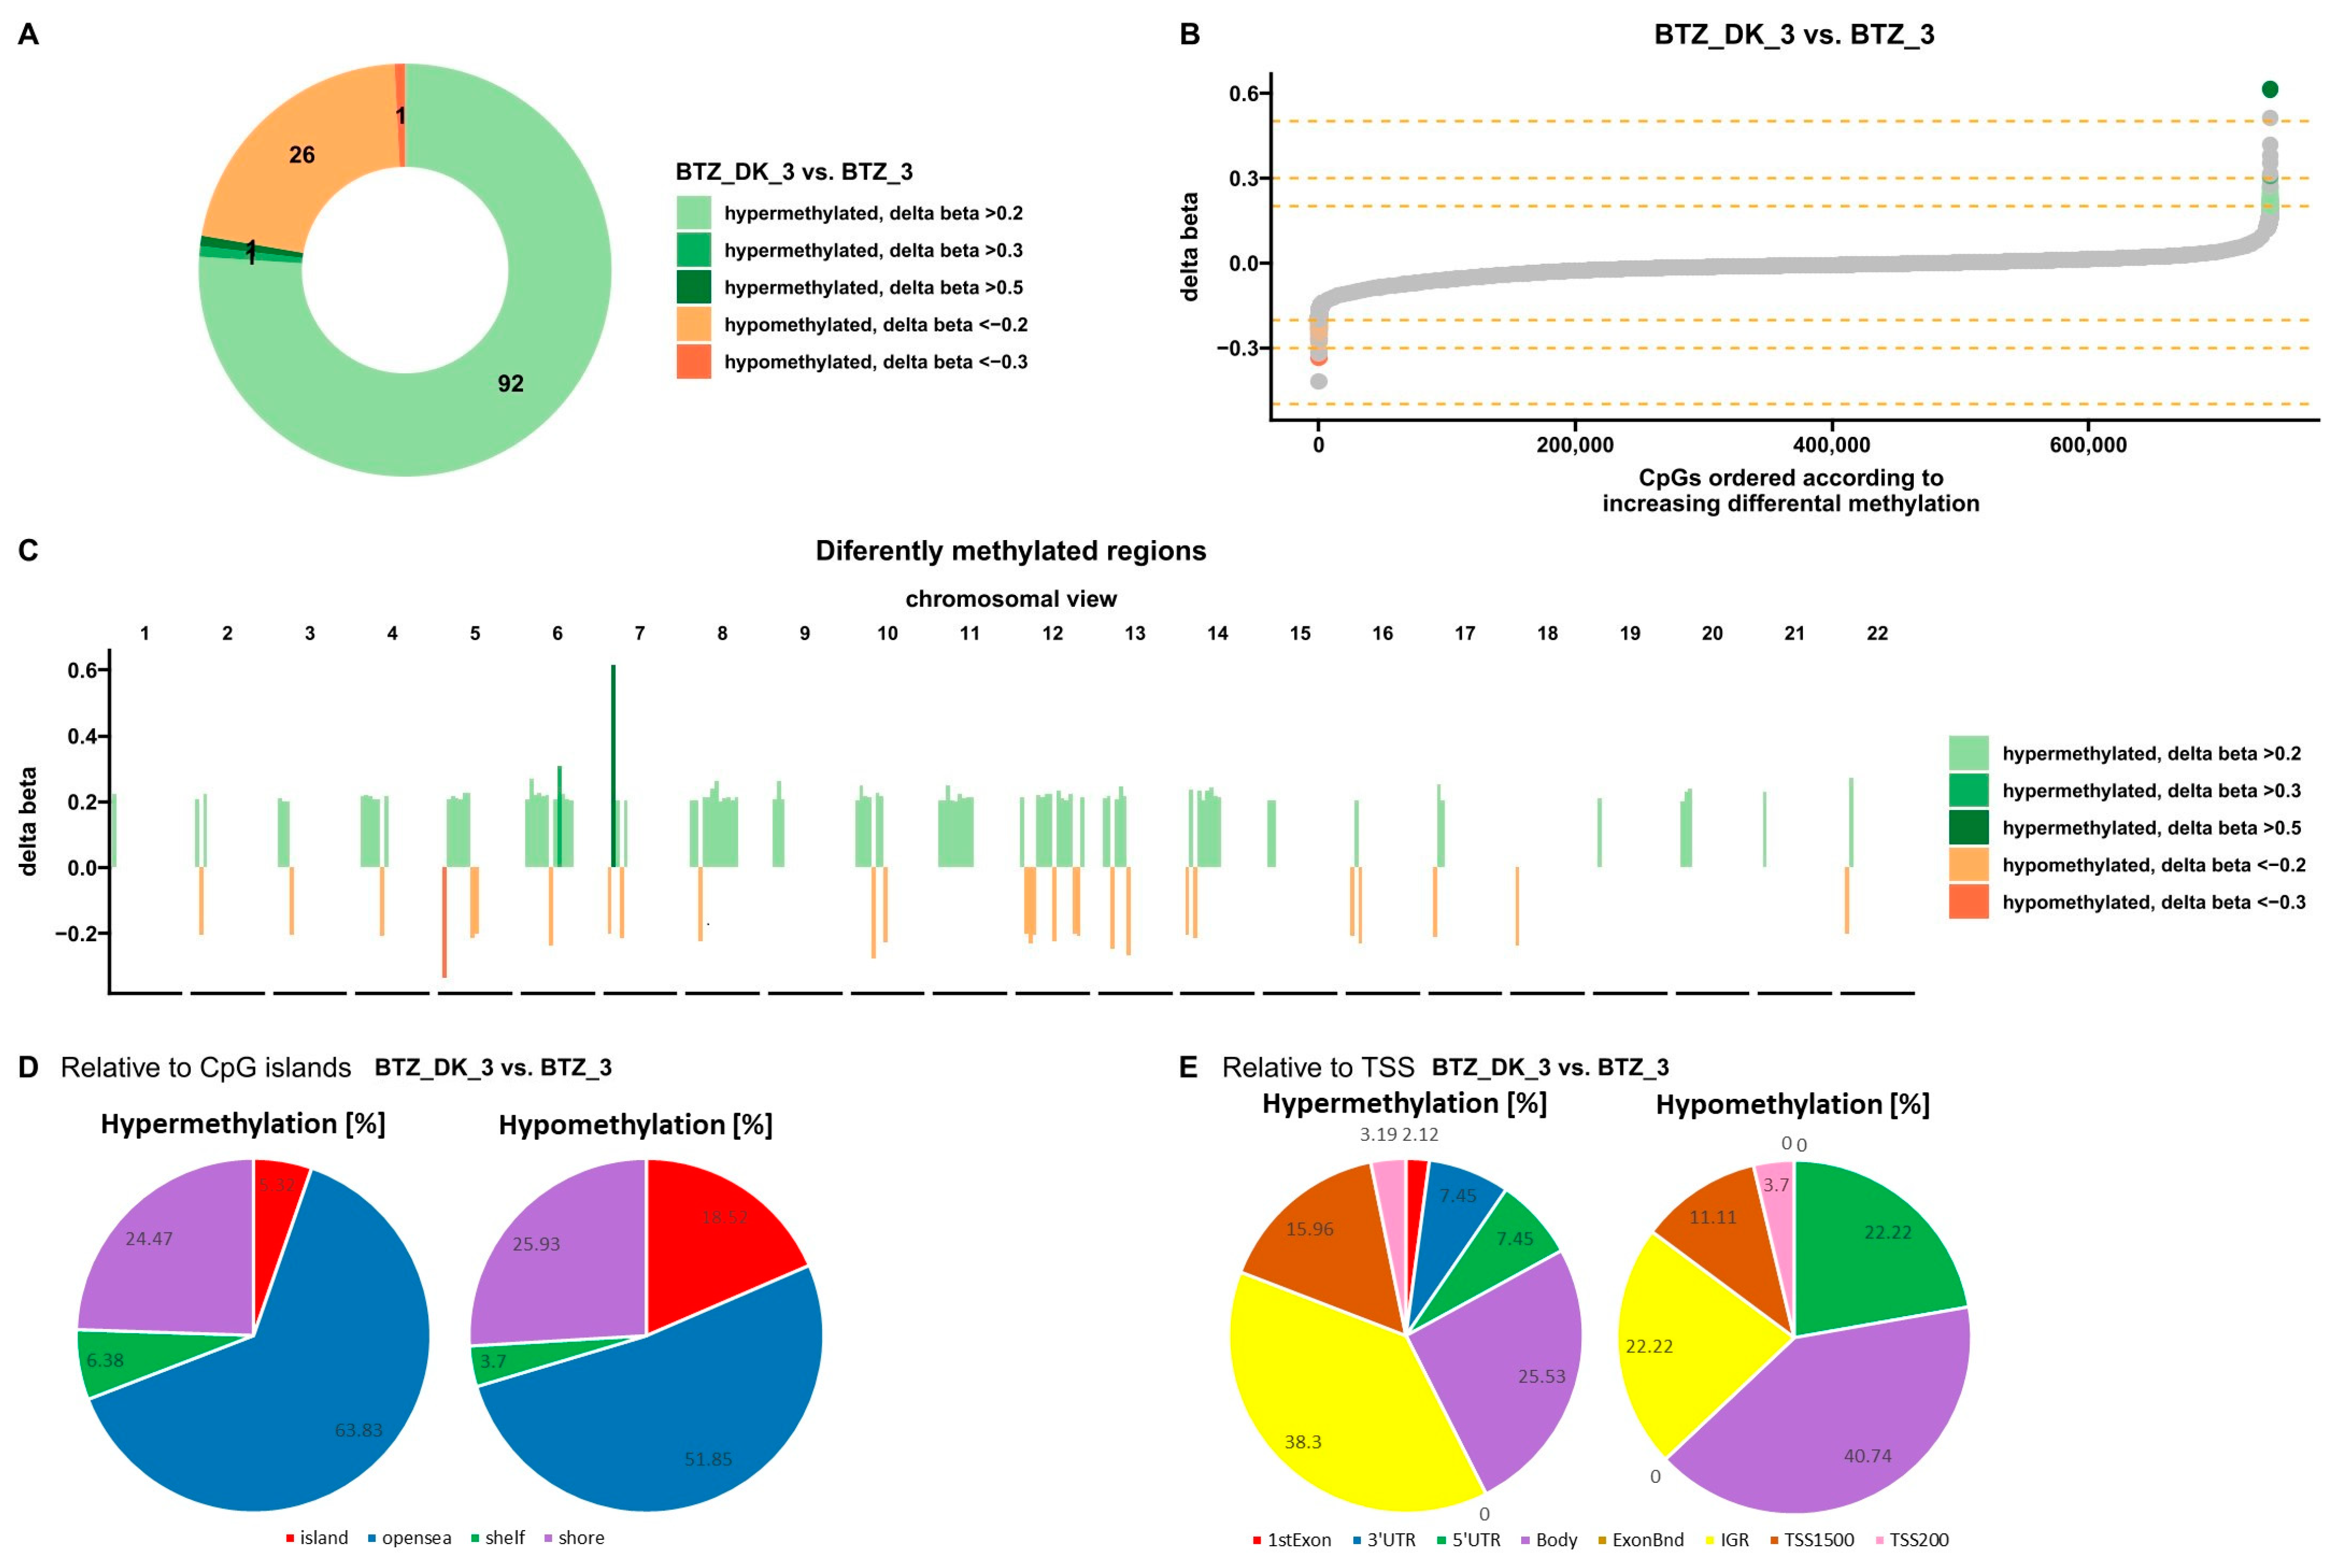
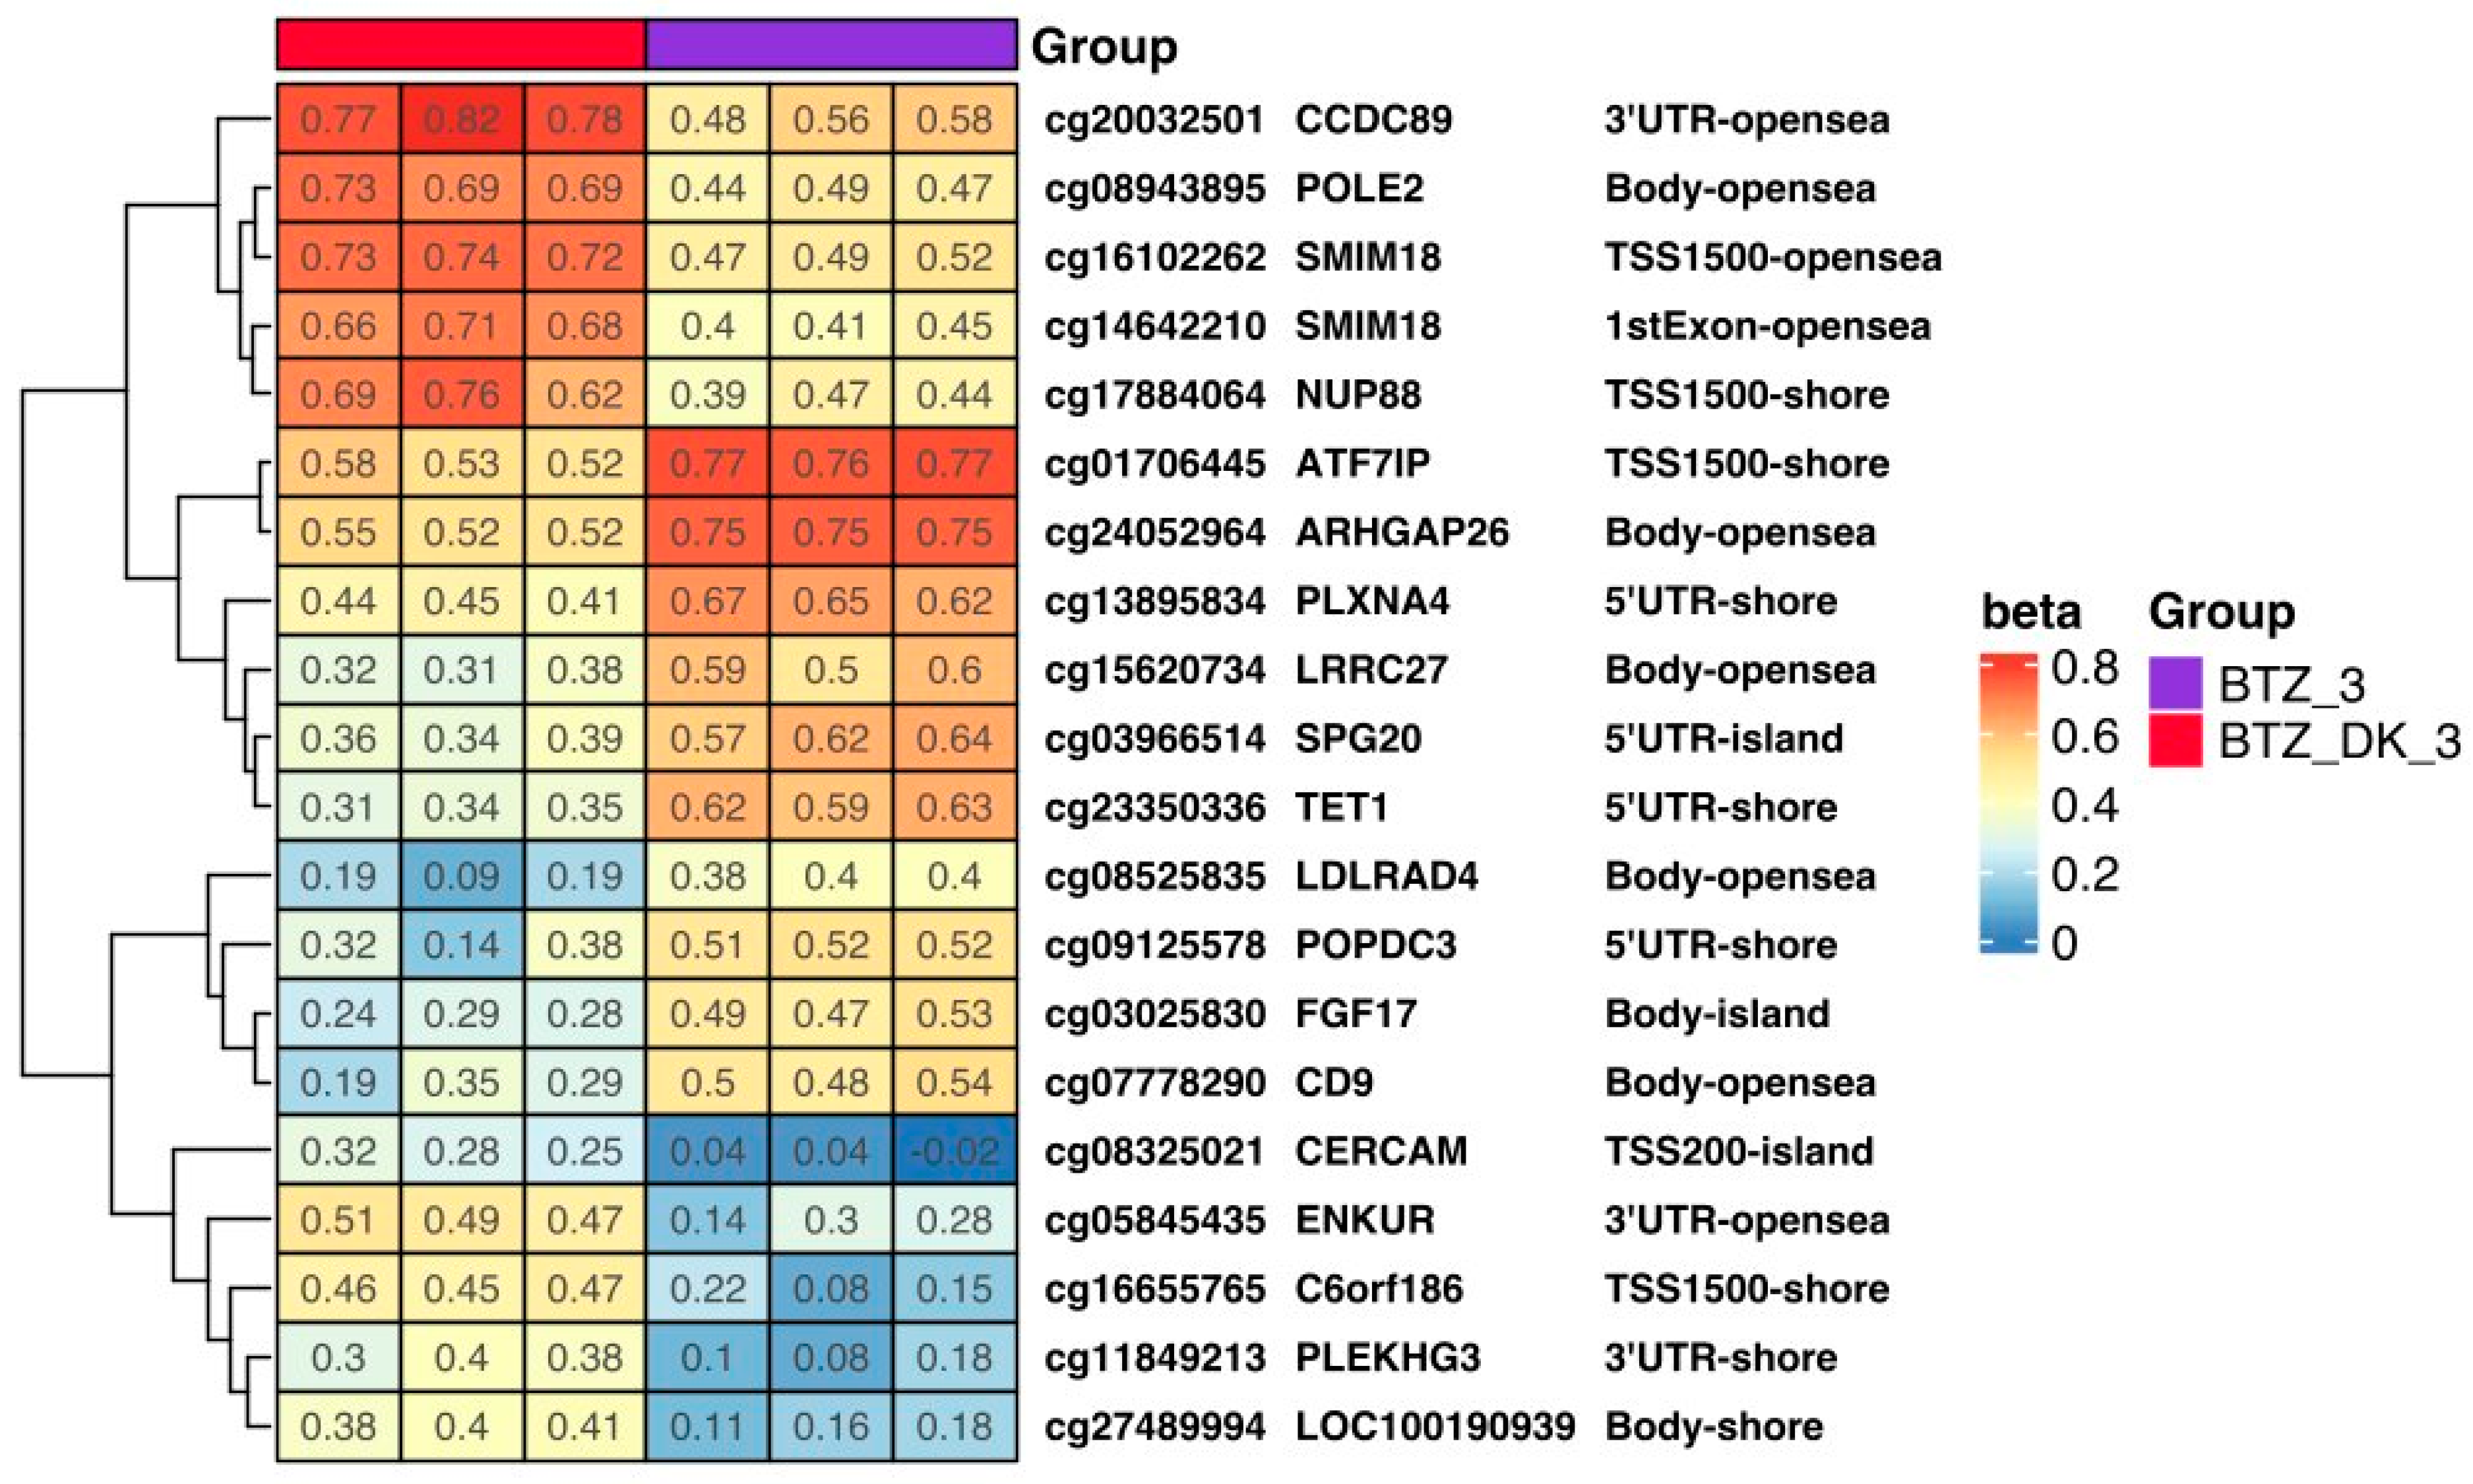
3.1.4. DNA Methylation Changes Induced by VD and VK in U266 Myeloma Cells in a BTZ-Resistant Phenotype
3.2. Expression of Selected Genes
4. Discussion
5. Conclusions
6. Study Limitations
Supplementary Materials
Author Contributions
Funding
Institutional Review Board Statement
Informed Consent Statement
Data Availability Statement
Conflicts of Interest
References
- Richardson, P.G.; Mitsiades, C.; Hideshima, T.; Anderson, K.C. Bortezomib: Proteasome Inhibition as an Effective Anticancer Therapy. Annu. Rev. Med. 2006, 57, 33–47. [Google Scholar] [CrossRef] [PubMed]
- Łuczkowska, K.; Rogińska, D.; Kulig, P.; Bielikowicz, A.; Baumert, B.; Machaliński, B. Bortezomib-Induced Epigenetic Alterations in Nerve Cells: Focus on the Mechanisms Contributing to the Peripheral Neuropathy Development. Int. J. Mol. Sci. 2022, 23, 2431. [Google Scholar] [CrossRef] [PubMed]
- Łuczkowska, K.; Rogińska, D.; Ulańczyk, Z.; Paczkowska, E.; Schmidt, C.A.; Machaliński, B. Molecular Mechanisms of Bortezomib Action: Novel Evidence for the miRNA–mRNA Interaction Involvement. Int. J. Mol. Sci. 2020, 21, 350. [Google Scholar] [CrossRef] [PubMed]
- Łuczkowska, K.; Sokolowska, K.E.; Taryma-Lesniak, O.; Pastuszak, K.; Supernat, A.; Bybjerg-Grauholm, J.; Hansen, L.L.; Paczkowska, E.; Wojdacz, T.K.; Machaliński, B. Bortezomib induces methylation changes in neuroblastoma cells that appear to play a significant role in resistance development to this compound. Sci. Rep. 2021, 11, 9846. [Google Scholar] [CrossRef] [PubMed]
- Jeon, S.-M.; Shin, E.-A. Exploring vitamin D metabolism and function in cancer. Exp. Mol. Med. 2018, 50, 1–14. [Google Scholar] [CrossRef]
- Christakos, S.; Dhawan, P.; Verstuyf, A.; Verlinden, L.; Carmeliet, G. Vitamin D: Metabolism, Molecular Mechanism of Action, and Pleiotropic Effects. Physiol. Rev. 2016, 96, 365–408. [Google Scholar] [CrossRef]
- Hii, C.S.; Ferrante, A. The Non-Genomic Actions of Vitamin D. Nutrients 2016, 8, 135. [Google Scholar] [CrossRef]
- Cruz, M.A.D.; Ulfenborg, B.; Blomstrand, P.; Faresjö, M.; Ståhl, F.; Karlsson, S. Characterization of methylation patterns associated with lifestyle factors and vitamin D supplementation in a healthy elderly cohort from Southwest Sweden. Sci. Rep. 2022, 12, 12670. [Google Scholar] [CrossRef]
- Valencia, R.A.C.; Martino, D.J.; Saffery, R.; Ellis, J.A. In vitro exposure of human blood mononuclear cells to active vitamin D does not induce substantial change to DNA methylation on a genome-scale. J. Steroid Biochem. Mol. Biol. 2014, 141, 144–149. [Google Scholar] [CrossRef]
- Chauss, D.; Freiwald, T.; McGregor, R.; Yan, B.; Wang, L.; Nova-Lamperti, E.; Kumar, D.; Zhang, Z.; Teague, H.; West, E.E.; et al. Autocrine vitamin D signaling switches off pro-inflammatory programs of TH1 cells. Nat. Immunol. 2021, 23, 62–74. [Google Scholar] [CrossRef]
- Łuczkowska, K.; Kulig, P.; Baumert, B.; Machaliński, B. The Evidence That 25(OH)D3 and VK2 MK-7 Vitamins Influence the Proliferative Potential and Gene Expression Profiles of Multiple Myeloma Cells and the Development of Resistance to Bortezomib. Nutrients 2022, 14, 5190. [Google Scholar] [CrossRef] [PubMed]
- Veldman, C.M.; Cantorna, M.T.; DeLuca, H.F. Expression of 1,25-Dihydroxyvitamin D3 Receptor in the Immune System. Arch. Biochem. Biophys. 2000, 374, 334–338. [Google Scholar] [CrossRef] [PubMed]
- Bunch, B.L.; Ma, Y.; Attwood, K.; Amable, L.; Luo, W.; Morrison, C.; Guru, K.A.; Woloszynska-Read, A.; Hershberger, P.A.; Trump, D.L. Vitamin D _3 enhances the response to cisplatin in bladder cancer through VDR and TA p73 signaling crosstalk. Cancer Med. 2019, 8, 2449–2461. [Google Scholar] [CrossRef] [PubMed]
- Ozdemir, F.; Esen, N.; Ovali, E.; Tekelioglu, Y.; Yilmaz, M.; Aydin, F.; Kavgaci, H.; Boruban, C. Effects of Dexamethasone, All-Trans Retinoic Acid, Vitamin D_3 and Interferon-α on FO Myeloma Cells. Chemotherapy 2004, 50, 190–193. [Google Scholar] [CrossRef] [PubMed]
- Busch, L.; Mougiakakos, D.; Büttner-Herold, M.; Müller, M.J.; Volmer, D.A.; Bach, C.; Fabri, M.; Bittenbring, J.T.; Neumann, F.; Boxhammer, R.; et al. Lenalidomide enhances MOR202-dependent macrophage-mediated effector functions via the vitamin D pathway. Leukemia 2018, 32, 2445–2458. [Google Scholar] [CrossRef] [PubMed]
- Kulig, P.; Łuczkowska, K.; Bielikowicz, A.; Zdrojewska, D.; Baumert, B.; Machaliński, B. Vitamin D as a Potential Player in Immunologic Control over Multiple Myeloma Cells: Implications for Adjuvant Therapies. Nutrients 2022, 14, 1802. [Google Scholar] [CrossRef] [PubMed]
- Duan, F.; Mei, C.; Yang, L.; Zheng, J.; Lu, H.; Xia, Y.; Hsu, S.; Liang, H.; Hong, L. Vitamin K2 promotes PI3K/AKT/HIF-1α-mediated glycolysis that leads to AMPK-dependent autophagic cell death in bladder cancer cells. Sci. Rep. 2020, 10, 7714. [Google Scholar] [CrossRef]
- Xu, W.; Wu, H.; Chen, S.; Wang, X.; Tanaka, S.; Sugiyama, K.; Yamada, H.; Hirano, T. Cytotoxic effects of vitamins K1, K2, and K3 against human T lymphoblastoid leukemia cells through apoptosis induction and cell cycle arrest. Chem. Biol. Drug Des. 2020, 96, 1134–1147. [Google Scholar] [CrossRef]
- Yokoyama, T.; Miyazawa, K.; Naito, M.; Toyotake, J.; Tauchi, T.; Itoh, M.; Yuo, A.; Hayashi, Y.; Georgescu, M.-M.; Kondo, Y.; et al. Vitamin K2 induces autophagy and apoptosis simultaneously in leukemia cells. Autophagy 2008, 4, 629–640. [Google Scholar] [CrossRef]
- Tsujioka, T.; Miura, Y.; Otsuki, T.; Nishimura, Y.; Hyodoh, F.; Wada, H.; Sugihara, T. The mechanisms of vitamin K2-induced apoptosis of myeloma cells. Haematologica 2006, 91, 613–619. [Google Scholar]
- Matsunaga, S.; Ito, H.; Sakou, T. The effect of vitamin K and D supplementation on ovariectomy-induced bone loss. Calcif. Tissue Int. 1999, 65, 285–289. [Google Scholar] [CrossRef] [PubMed]
- Ushiroyama, T.; Ikeda, A.; Ueki, M. Effect of continuous combined therapy with vitamin K2 and vitamin D3 on bone mineral density and coagulofibrinolysis function in postmenopausal women. Maturitas 2002, 41, 211–221. [Google Scholar] [CrossRef] [PubMed]
- Braam, L.A.J.L.M.; Hoeks, A.P.G.; Brouns, F.; Hamulyák, K.; Gerichhausen, M.J.; Vermeer, C. Beneficial effects of vitamins D and K on the elastic properties of the vessel wall in postmenopausal women: A follow-up study. Thromb Haemost. 2004, 91, 373–380. [Google Scholar] [CrossRef] [PubMed]
- Kurnatowska, I.; Grzelak, P.; Masajtis-Zagajewska, A.; Kaczmarska, M.; Stefańczyk, L.; Vermeer, C.; Maresz, K.; Nowicki, M. Effect of vitamin K2 on progression of atherosclerosis and vascular calcification in nondialyzed patients with chronic kidney disease stages 3–5. Pol. Arch. Intern. Med. 2015, 125, 631–640. [Google Scholar] [CrossRef] [PubMed]
- Luczkowska, K.; Kulig, P.; Rusińska, K.; Baumert, B.; Machaliński, B. 5-Aza-2′-Deoxycytidine Alters the Methylation Profile of Bortezomib-Resistant U266 Multiple Myeloma Cells and Affects Their Proliferative Potential. Int. J. Mol. Sci. 2023, 24, 16780. [Google Scholar] [CrossRef] [PubMed]
- Li, Y.; Cui, K.; Zhang, Q.; Li, X.; Lin, X.; Tang, Y.; Prochownik, E.V.; Li, Y. FBXL6 degrades phosphorylated p53 to promote tumor growth. Cell Death Differ. 2021, 28, 2112–2125. [Google Scholar] [CrossRef] [PubMed]
- Sugiaman-Trapman, D.; Vitezic, M.; Jouhilahti, E.-M.; Mathelier, A.; Lauter, G.; Misra, S.; Daub, C.O.; Kere, J.; Swoboda, P. Characterization of the human RFX transcription factor family by regulatory and target gene analysis. BMC Genom. 2018, 19, 181. [Google Scholar] [CrossRef]
- Nakayama, H.; Ohnuki, H.; Nakahara, M.; Nishida-Fukuda, H.; Sakaue, T.; Fukuda, S.; Higashiyama, S.; Doi, Y.; Mitsuyoshi, M.; Okimoto, T.; et al. Inactivation of axon guidance molecule netrin-1 in human colorectal cancer by an epigenetic mechanism. Biochem. Biophys. Res. Commun. 2022, 611, 146–150. [Google Scholar] [CrossRef]
- Zhang, L.; Zhou, A.; Zhu, S.; Min, L.; Liu, S.; Li, P.; Zhang, S. The role of GTPase-activating protein ARHGAP26 in human cancers. Mol. Cell. Biochem. 2021, 477, 319–326. [Google Scholar] [CrossRef]
- Kulig, P.; Milczarek, S.; Bakinowska, E.; Szalewska, L.; Baumert, B.; Machaliński, B. Lenalidomide in Multiple Myeloma: Review of Resistance Mechanisms, Current Treatment Strategies and Future Perspectives. Cancers 2023, 15, 963. [Google Scholar] [CrossRef]
- Davies, F.; Baz, R. Lenalidomide mode of action: Linking bench and clinical findings. Blood Rev. 2010, 24, S13–S19. [Google Scholar] [CrossRef] [PubMed]
- Mikhael, J.; Belhadj-Merzoug, K.; Hulin, C.; Vincent, L.; Moreau, P.; Gasparetto, C.; Pour, L.; Spicka, I.; Vij, R.; Zonder, J.; et al. A phase 2 study of isatuximab monotherapy in patients with multiple myeloma who are refractory to daratumumab. Blood Cancer J. 2021, 11, 89. [Google Scholar] [CrossRef] [PubMed]
- Dima, D.; Dower, J.; Comenzo, R.L.; Varga, C. Evaluating Daratumumab in the Treatment of Multiple Myeloma: Safety, Efficacy and Place in Therapy. Cancer Manag. Res. 2020, 12, 7891–7903. [Google Scholar] [CrossRef] [PubMed]
- Siegel, D.S.; Wang, M.; Martin, T.G.; Infante, J.R.; Kaufman, J.L.; Ranjangam, K.; Huang, M.; Bilotti, E.; Vij, R. A Phase 2 Study of Prolonged Carfilzomib Therapy in Patients with Multiple Myeloma Previously Enrolled in Carfilzomib Clinical Trials. Blood 2012, 120, 2962. [Google Scholar] [CrossRef]
- Palumbo, A.; Chanan-Khan, A.; Weisel, K.; Nooka, A.K.; Masszi, T.; Beksac, M.; Spicka, I.; Hungria, V.; Munder, M.; Mateos, M.V.; et al. Daratumumab, Bortezomib, and Dexamethasone for Multiple Myeloma. N. Engl. J. Med. 2016, 375, 754–766. [Google Scholar] [CrossRef] [PubMed]
- Moreau, P.; Attal, M.; Hulin, C.; Arnulf, B.; Belhadj, K.; Benboubker, L.; Béné, M.C.; Broijl, A.; Caillon, H.; Caillot, D.; et al. Bortezomib, thalidomide, and dexamethasone with or without daratumumab before and after autologous stem-cell transplantation for newly diagnosed multiple myeloma (CASSIOPEIA): A randomised, open-label, phase 3 study. Lancet 2019, 394, 29–38. [Google Scholar] [CrossRef] [PubMed]
- Voorhees, P.M.; Kaufman, J.L.; Laubach, J.P.; Sborov, D.W.; Reeves, B.; Rodriguez, C.; Chari, A.; Silbermann, R.; Costa, L.J.; Anderson, L.D., Jr.; et al. Daratumumab, lenalidomide, bortezomib, and dexamethasone for transplant-eligible newly diagnosed multiple myeloma: The GRIFFIN trial. Blood 2020, 136, 936–945. [Google Scholar] [CrossRef]
- Facon, T.; Kumar, S.; Plesner, T.; Orlowski, R.Z.; Moreau, P.; Bahlis, N.; Basu, S.; Nahi, H.; Hulin, C.; Quach, H.; et al. Daratumumab plus Lenalidomide and Dexamethasone for Untreated Myeloma. N. Engl. J. Med. 2019, 380, 2104–2115. [Google Scholar] [CrossRef]
- Baeke, F.; Takiishi, T.; Korf, H.; Gysemans, C.; Mathieu, C. Vitamin D: Modulator of the immune system. Curr. Opin. Pharmacol. 2010, 10, 482–496. [Google Scholar] [CrossRef]
- Campbell, M.J.; Trump, D.L. Vitamin D Receptor Signaling and Cancer. Endocrinol. Metab. Clin. N. Am. 2017, 46, 1009–1038. [Google Scholar] [CrossRef]
- Fife, R.; Sledge, G.; Proctor, C. Effects of vitamin D3 on proliferation of cancer cells in vitro. Cancer Lett. 1997, 120, 65–69. [Google Scholar] [CrossRef] [PubMed]
- Park, W.H.; Seol, J.G.; Kim, E.S.; Binderup, L.; Koeffler, H.P.; Kim, B.K.; Lee, Y.Y. The induction of apoptosis by a combined 1,25(OH)2D3 analog, EB1089 and TGF-β1 in NCI-H929 multiple myeloma cells. Int. J. Oncol. 2002, 20, 533–542. [Google Scholar] [CrossRef] [PubMed]
- Park, W.H.; Seol, J.G.; Kim, E.S.; Jung, C.W.; Lee, C.C.; Binderup, L.; Koeffler, H.; Kim, B.K.; Lee, Y.Y. Cell Cycle Arrest Induced by the Vitamin D3 Analog EB1089 in NCI-H929 Myeloma Cells Is Associated with Induction of the Cyclin-Dependent Kinase Inhibitor p27. Exp. Cell Res. 2000, 254, 279–286. [Google Scholar] [CrossRef] [PubMed]
- Park, W.H.; Seol, J.G.; Kim, E.S.; Hyun, J.M.; Jung, C.W.; Lee, C.C.; Binderup, L.; Koeffler, H.P.; Kim, B.K.; Lee, Y.Y. Induction of apoptosis by vitamin D _3 analogue EB1089 in NCI-H929 myeloma cells via activation of caspase 3 and p38 MAP kinase: Induction of Apoptosis by EB1089 in NCI-H929 Cells. Br. J. Haematol. 2000, 109, 576–583. [Google Scholar] [CrossRef] [PubMed]
- Oortgiesen, B.E.; Kroes, J.A.; Scholtens, P.; Hoogland, J.; de Keijzer, P.D.; Siemes, C.; Jansman, F.G.A.; Kibbelaar, R.E.; Veeger, N.J.G.M.; Hoogendoorn, M.; et al. High prevalence of peripheral neuropathy in multiple myeloma patients and the impact of vitamin D levels, a cross-sectional study. Support. Care Cancer 2021, 30, 271–278. [Google Scholar] [CrossRef] [PubMed]
- Wang, J.; Udd, K.A.; Vidisheva, A.; Swift, R.A.; Spektor, T.M.; Bravin, E.; Ibrahim, E.; Treisman, J.; Masri, M.; Berenson, J.R. Low serum vitamin D occurs commonly among multiple myeloma patients treated with bortezomib and/or thalidomide and is associated with severe neuropathy. Support. Care Cancer 2016, 24, 3105–3110. [Google Scholar] [CrossRef] [PubMed]
- Eicher, F.; Mansouri Taleghani, B.; Schild, C.; Bacher, U.; Pabst, T. Reduced survival after autologous stem cell transplantation in myeloma and lymphoma patients with low vitamin D serum levels. Hematol. Oncol. 2020, 38, 523–530. [Google Scholar] [CrossRef]
- Donati, B.; Ferrari, A.; Ruffini, A.; Manzotti, G.; Fragliasso, V.; Merli, F.; Zanelli, M.; Valli, R.; Luminari, S.; Ciarrocchi, A. Gene expression profile unveils diverse biological effect of serum vitamin D in Hodgkin’s and diffuse large B-cell lymphoma. Hematol. Oncol. 2020, 39, 205–214. [Google Scholar] [CrossRef]
- Graf, S.A.; Heppt, M.V.; Wessely, A.; Krebs, S.; Kammerbauer, C.; Hornig, E.; Strieder, A.; Blum, H.; Bosserhoff, A.; Berking, C. The myelin protein PMP2 is regulated by SOX10 and drives melanoma cell invasion. Pigment. Cell Melanoma Res. 2019, 32, 424–434. [Google Scholar] [CrossRef]
- Yegnasubramanian, S.; Haffner, M.C.; Zhang, Y.; Gurel, B.; Cornish, T.C.; Wu, Z.; Irizarry, R.A.; Morgan, J.; Hicks, J.; DeWeese, T.L.; et al. DNA Hypomethylation Arises Later in Prostate Cancer Progression than CpG Island Hypermethylation and Contributes to Metastatic Tumor Heterogeneity. Cancer Res 2008, 68, 8954–8967. [Google Scholar] [CrossRef]
- Zelic, R.; Fiano, V.; Grasso, C.; Zugna, D.; Pettersson, A.A.; Gillio-Tos, A.A.; Merletti, F.; Richiardi, L. Global DNA hypomethylation in prostate cancer development and progression: A systematic review. Prostate Cancer Prostatic Dis. 2014, 18, 1–12. [Google Scholar] [CrossRef] [PubMed]
- Sive, J.I.; Feber, A.; Smith, D.; Quinn, J.; Beck, S.; Yong, K. Global hypomethylation in myeloma is associated with poor prognosis. Br. J. Haematol. 2015, 172, 473–475. [Google Scholar] [CrossRef] [PubMed]
- Heuck, C.J.; Mehta, J.; Bhagat, T.; Gundabolu, K.; Yu, Y.; Khan, S.; Chrysofakis, G.; Schinke, C.; Tariman, J.; Vickrey, E.; et al. Myeloma Is Characterized by Stage-Specific Alterations in DNA Methylation That Occur Early during Myelomagenesis. J. Immunol. 2013, 190, 2966–2975. [Google Scholar] [CrossRef] [PubMed]
- Huang, L.; An, X.; Zhu, Y.; Zhang, K.; Xiao, L.; Yao, X.; Zeng, X.; Liang, S.; Yu, J. Netrin-1 induces the anti-apoptotic and pro-survival effects of B-ALL cells through the Unc5b-MAPK axis. Cell Commun. Signal. 2022, 20, 122. [Google Scholar] [CrossRef] [PubMed]
- Jin, Q.; Cheng, M.; Xia, X.; Han, Y.; Zhang, J.; Cao, P.; Zhou, G. Down-regulation of MYH10 driven by chromosome 17p13.1 deletion promotes hepatocellular carcinoma metastasis through activation of the EGFR pathway. J. Cell. Mol. Med. 2021, 25, 11142–11156. [Google Scholar] [CrossRef] [PubMed]
- Qian, J.; Qian, Z.; Lin, J.; Yao, D.-M.; Chen, Q.; Li, Y.; Ji, R.-B.; Yang, J.; Xiao, G.-F.; Wang, Y.-L. Abnormal methylation of GRAF promoter Chinese patients with acute myeloid leukemia. Leuk. Res. 2011, 35, 783–786. [Google Scholar] [CrossRef] [PubMed]
- Bojesen, S.E.; Ammerpohl, O.; Weinhäusl, A.; Haas, O.A.; Mettal, H.; Bohle, R.M.; Borkhardt, A.; Fuchs, U. Characterisation of the GRAF gene promoter and its methylation in patients with acute myeloid leukaemia and myelodysplastic syndrome. Br. J. Cancer 2006, 94, 323–332. [Google Scholar] [CrossRef] [PubMed]
- Li, J.; Xu, Y.-H.; Lu, Y.; Ma, X.-P.; Chen, P.; Luo, S.-W.; Jia, Z.-G.; Liu, Y.; Guo, Y. Identifying Differentially Expressed Genes and Small Molecule Drugs for Prostate Cancer by a Bioinformatics Strategy. Asian Pac. J. Cancer Prev. 2013, 14, 5281–5286. [Google Scholar] [CrossRef]
- Debernardi, C.; Libera, L.; Berrino, E.; Sahnane, N.; Chiaravalli, A.M.; Laudi, C.; Berselli, M.; Sapino, A.; Sessa, F.; Venesio, T. Evaluation of global and intragenic hypomethylation in colorectal adenomas improves patient stratification and colorectal cancer risk prediction. Clin. Epigenetics 2021, 13, 154. [Google Scholar] [CrossRef]
- Kushwaha, G.; Dozmorov, M.; Wren, J.D.; Qiu, J.; Shi, H.; Xu, D. Hypomethylation coordinates antagonistically with hypermethylation in cancer development: A case study of leukemia. Hum. Genom. 2016, 10, 83–102. [Google Scholar] [CrossRef]
- Sheaffer, K.L.; Elliott, E.N.; Kaestner, K.H. DNA Hypomethylation Contributes to Genomic Instability and Intestinal Cancer Initiation. Cancer Prev. Res. 2016, 9, 534–546. [Google Scholar] [CrossRef] [PubMed]


| Gene | Primer Sequences |
|---|---|
| ARHGAP26 | F 5′-CCTTAGGGGCAGAGTTGCTC-3′ R 5′-CAGCCCCGATCTGTTCCTTT-3′ |
| MYH10 | F 5′-CCAAACGTCAGGGAGCATCT-3′ R 5′-GGTGGCTCATGAAGACCAGA-3′ |
| PMP2 | F 5′-AAGCTCTGGGTGTGGGGTTA-3′ R 5′-TGCAGGGTTACGATGCTCTT-3′ |
| RFX8 | F 5′-AGCAGCTCCATGTCACACAG-3′ R 5′-TCCTTGACTTGCTTGAGCGT-3′ |
| BAMBI | F 5′-GGTGCAGGAGCTGACTTCTT-3′ R 5′-ATTCCAGCTCCCTTGGATGC-3′ |
| CLEC12b | F 5′-AAAAGAGGGCATCCAGCTCC-3′ R 5′-GCCCAGTTGCTGGGATAAGT-3′ |
| Gene | Control_3 Mean ± SD; 95% CI | BTZ_3 Mean ± SD; 95% CI | D_3 Mean ± SD; 95% CI | DK_3 Mean ± SD; 95% CI | BTZ_DK_3 Mean ± SD; 95% CI |
|---|---|---|---|---|---|
| ARHGAP26 | 1.00 ± 0.08; 0.75–1.25 | 0.78 ± 0.09; 0.50–1.06 | 1.16 ± 0.01; 1.01–1.31 | 1.34 ± 0.11; 1.00–1.68 | 1.69 ± 0.24; 0.94–2.43 |
| MYH10 | 0.21 ± 0.03; −0.28–0.71 | 0.06 ± 0.01; 0.01–0.10 | 0.09 ± 0.02; 0.03–0.16 | 0.18 ± 0.07; −0.06–0.42 | 0.19 ± 0.04; 0.06–0.32 |
| PMP2 | 0.05 ± 0.02; −0.01–0.12 | 0.11 ± 0.04; −0.02–0.23 | 0.36 ± 0.24; −0.39–1.11 | 0.41 ± 0.03; 0.30–0.52 | 0.44 ± 0.17; −0.09–0.98 |
| RFX8 | 0.23 ± 0.04; 0.10–0.35 | 0.13 ± 0.03; 0.02–0.25 | 0.40 ± 0.12; 0.02–0.78 | 0.73 ± 0.16; 0.21–1.25 | 0.33 ± 0.13; −0.09–0.75 |
| BAMBI | 11.50 ± 1.94; 5.57–17.42 | 11.55 ± 1.41; 7.26–15.84 | 15.46 ± 1.37; 10.98–19.95 | 29.10 ± 7.02; 7.73–50.46 | 20.58 ± 4.66; 6.39–34.77 |
| CLEC12b | 0.16 ± 0.09; −0.15–0.46 | 0.10 ± 0.01; 0.04–0.15 | 0.22 ± 0.07; −0.02–0.45 | 0.38 ± 0.1; 0.06–0.69 | 0.35 ± 0.07; 0.12–0.58 |
Disclaimer/Publisher’s Note: The statements, opinions and data contained in all publications are solely those of the individual author(s) and contributor(s) and not of MDPI and/or the editor(s). MDPI and/or the editor(s) disclaim responsibility for any injury to people or property resulting from any ideas, methods, instructions or products referred to in the content. |
© 2023 by the authors. Licensee MDPI, Basel, Switzerland. This article is an open access article distributed under the terms and conditions of the Creative Commons Attribution (CC BY) license (https://creativecommons.org/licenses/by/4.0/).
Share and Cite
Łuczkowska, K.; Kulig, P.; Baumert, B.; Machaliński, B. Vitamin D and K Supplementation Is Associated with Changes in the Methylation Profile of U266-Multiple Myeloma Cells, Influencing the Proliferative Potential and Resistance to Bortezomib. Nutrients 2024, 16, 142. https://doi.org/10.3390/nu16010142
Łuczkowska K, Kulig P, Baumert B, Machaliński B. Vitamin D and K Supplementation Is Associated with Changes in the Methylation Profile of U266-Multiple Myeloma Cells, Influencing the Proliferative Potential and Resistance to Bortezomib. Nutrients. 2024; 16(1):142. https://doi.org/10.3390/nu16010142
Chicago/Turabian StyleŁuczkowska, Karolina, Piotr Kulig, Bartłomiej Baumert, and Bogusław Machaliński. 2024. "Vitamin D and K Supplementation Is Associated with Changes in the Methylation Profile of U266-Multiple Myeloma Cells, Influencing the Proliferative Potential and Resistance to Bortezomib" Nutrients 16, no. 1: 142. https://doi.org/10.3390/nu16010142
APA StyleŁuczkowska, K., Kulig, P., Baumert, B., & Machaliński, B. (2024). Vitamin D and K Supplementation Is Associated with Changes in the Methylation Profile of U266-Multiple Myeloma Cells, Influencing the Proliferative Potential and Resistance to Bortezomib. Nutrients, 16(1), 142. https://doi.org/10.3390/nu16010142