
Inadequate Energy Delivery Is Frequent among COVID-19 Patients Requiring ECMO Support and Associated with Increased ICU Mortality

 , , , , , ,
  , ,
, ,
Abstract
1. Introduction
2. Materials and Methods
2.1. Nutrition-Related Data
2.2. Data Collection
2.3. Statistical Analysis
- -
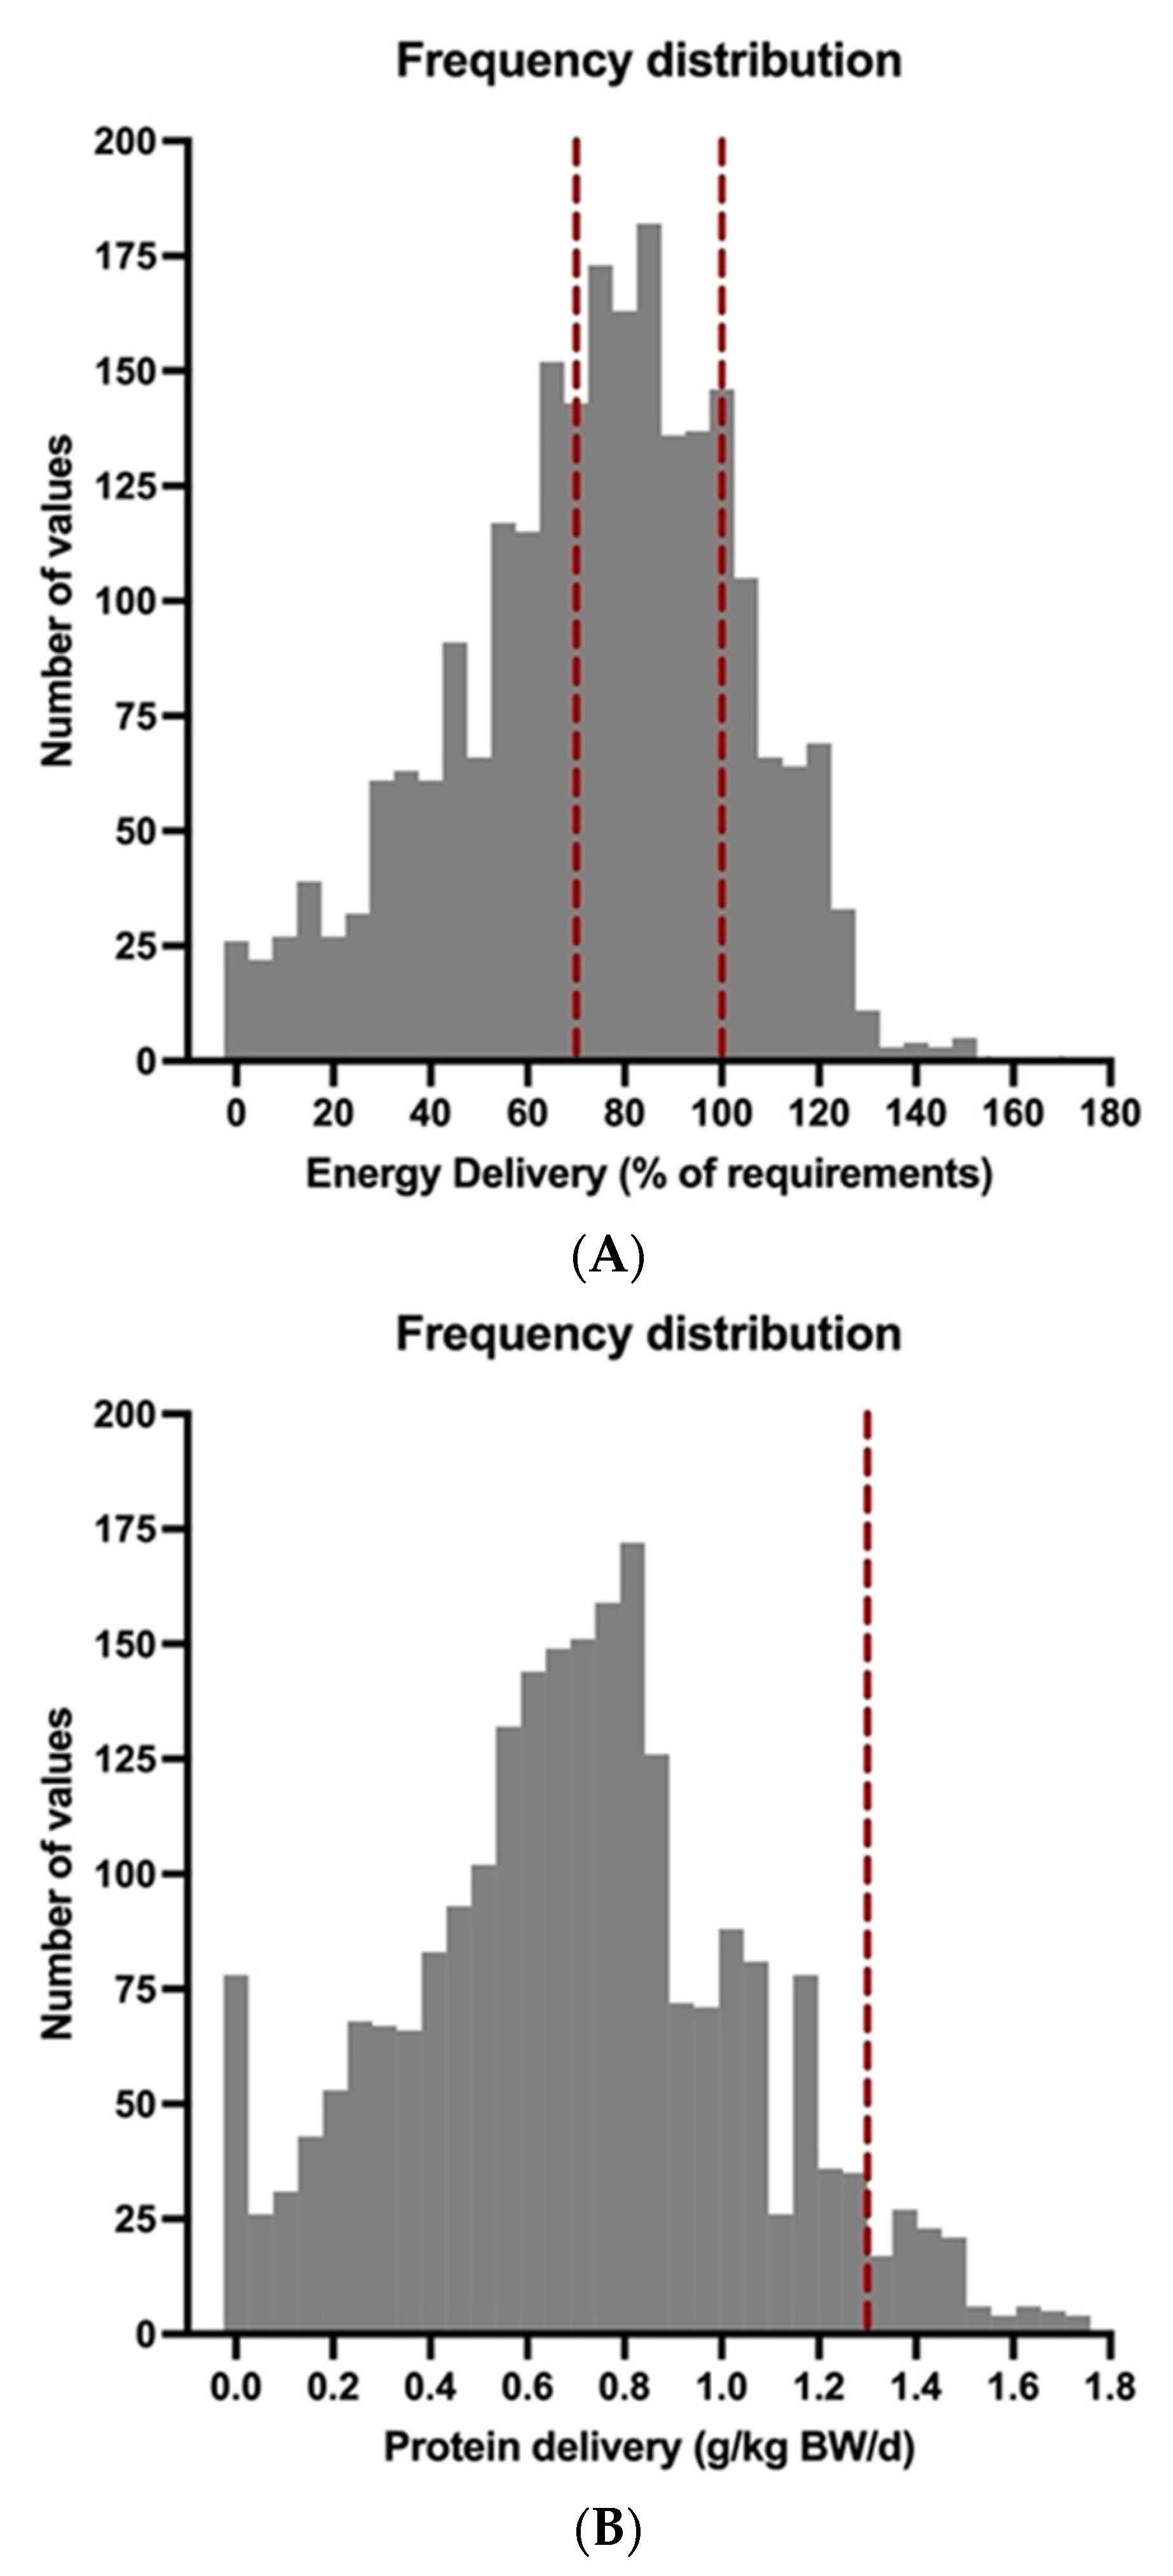
- Overall daily energy and protein delivery = mean ± standard deviation of calorie delivery (% of requirements according to ESPEN guidelines) and protein delivery (g/kg BW/d) of all patients during the entire observation period. These calculations were used to provide an overview of the nutrition support of our patient population and to make comparisons with already published data more feasible.
- -
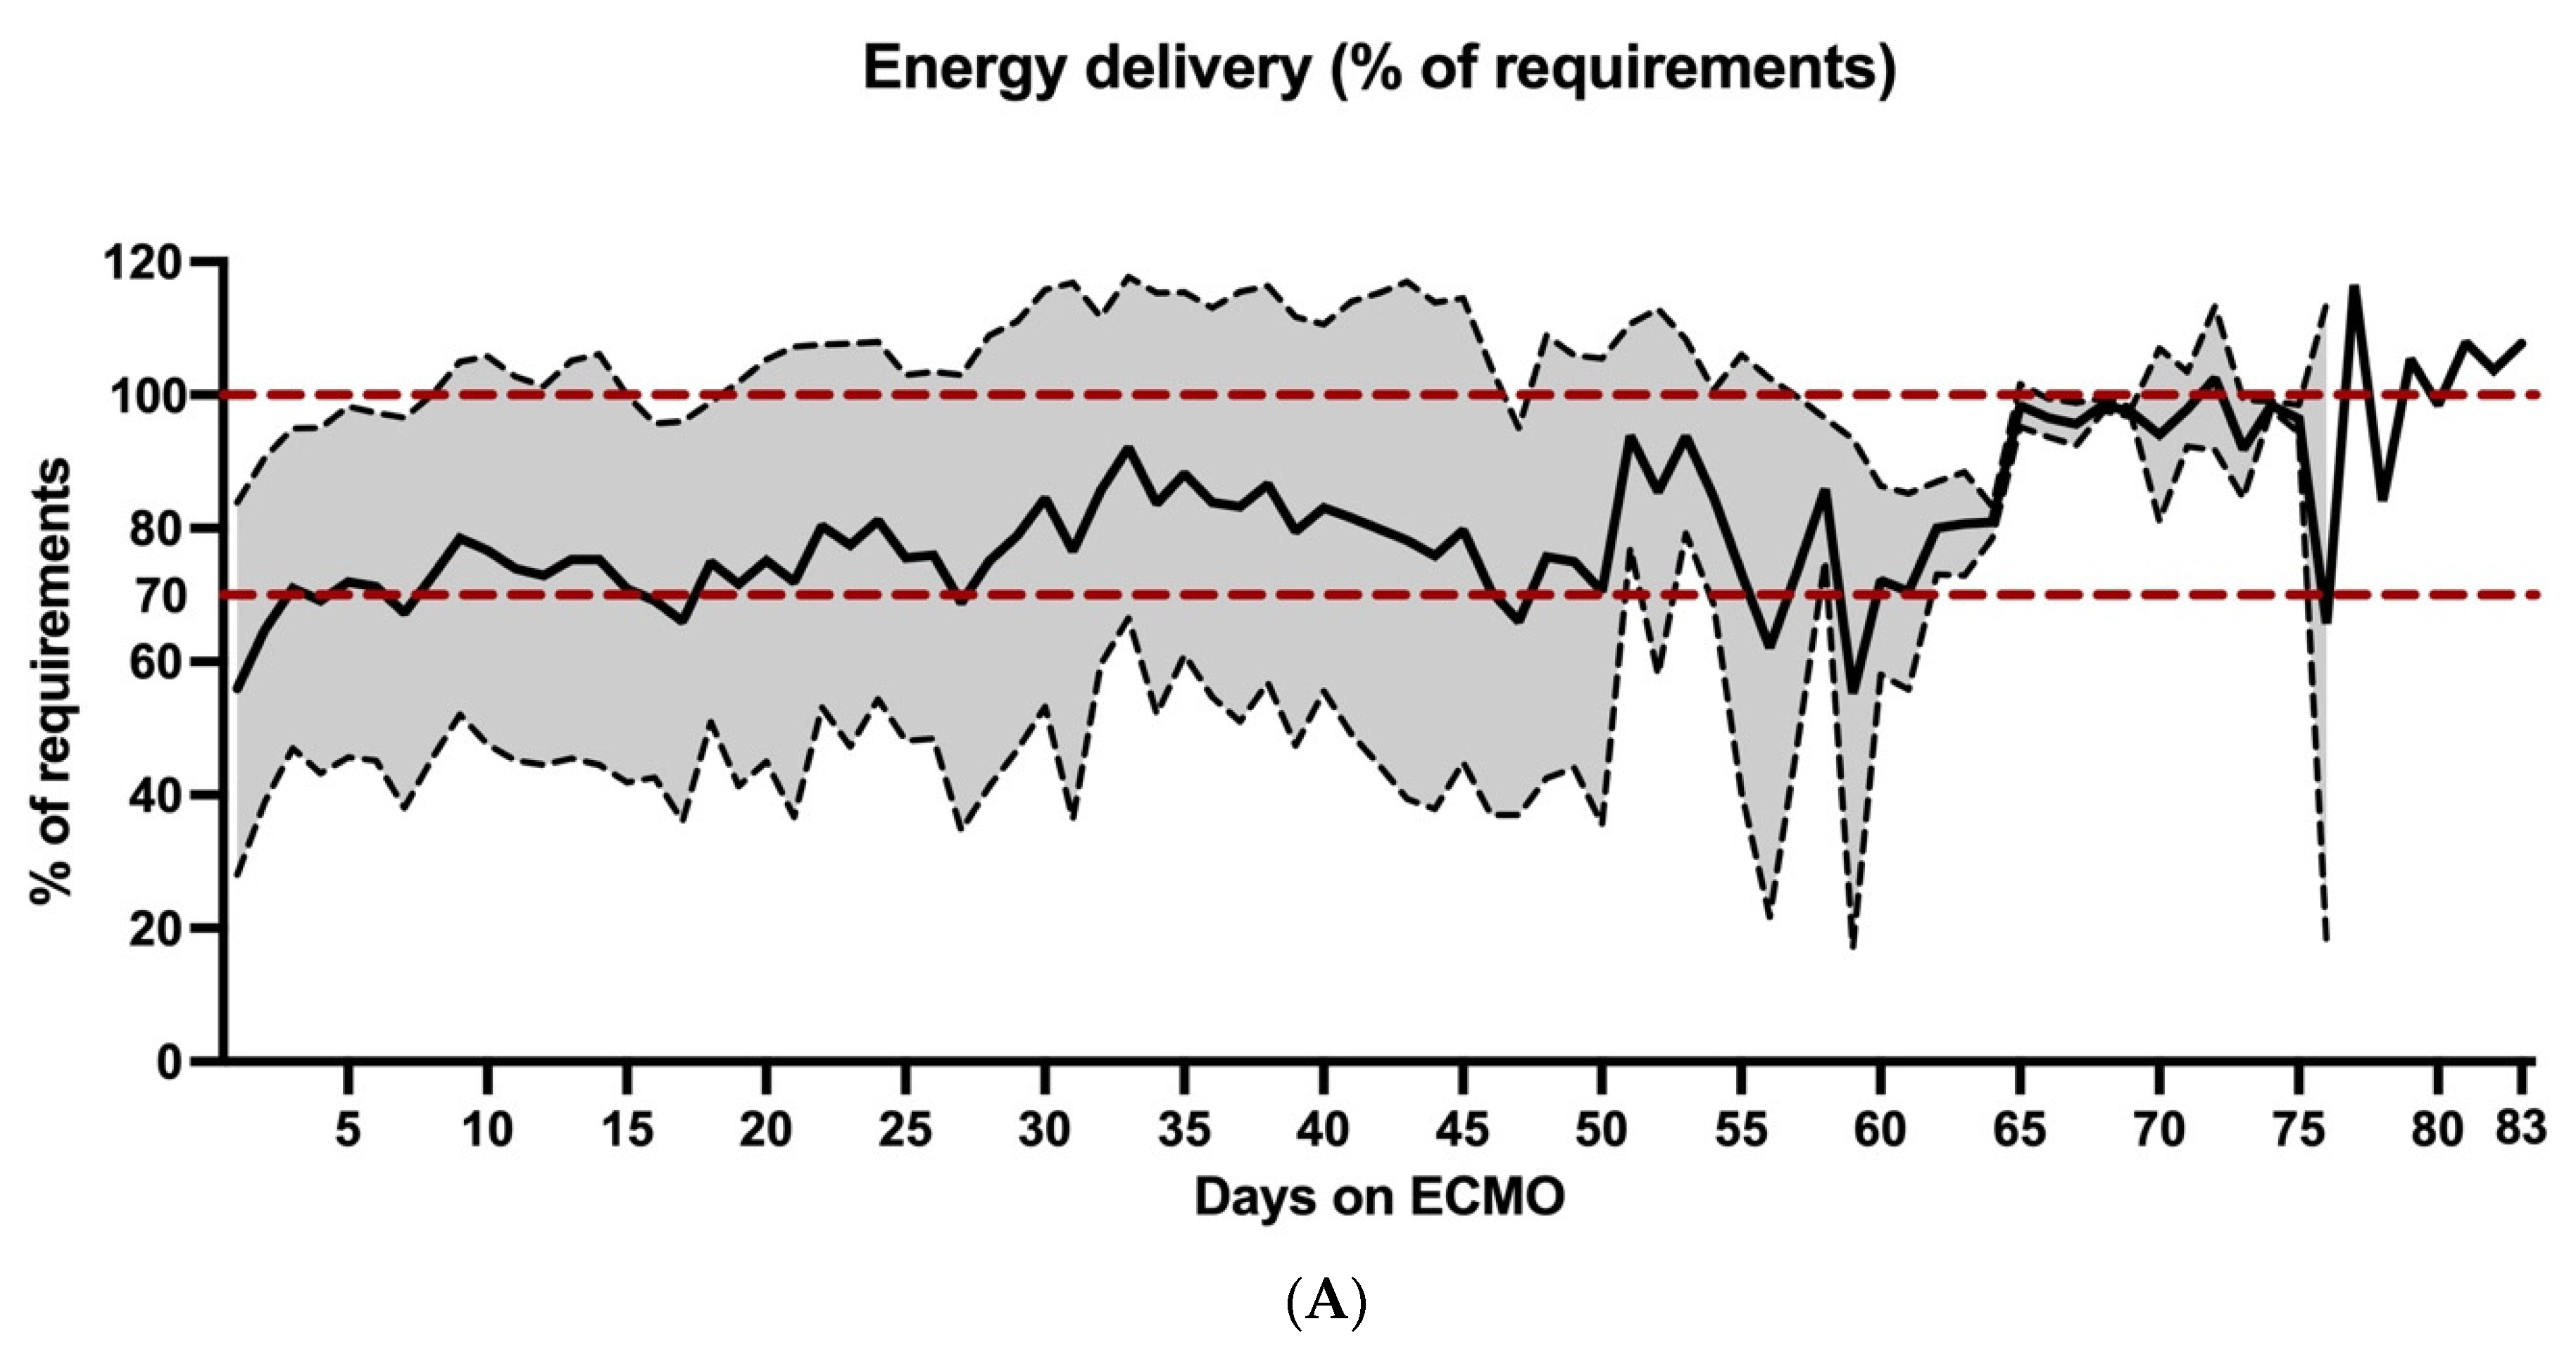
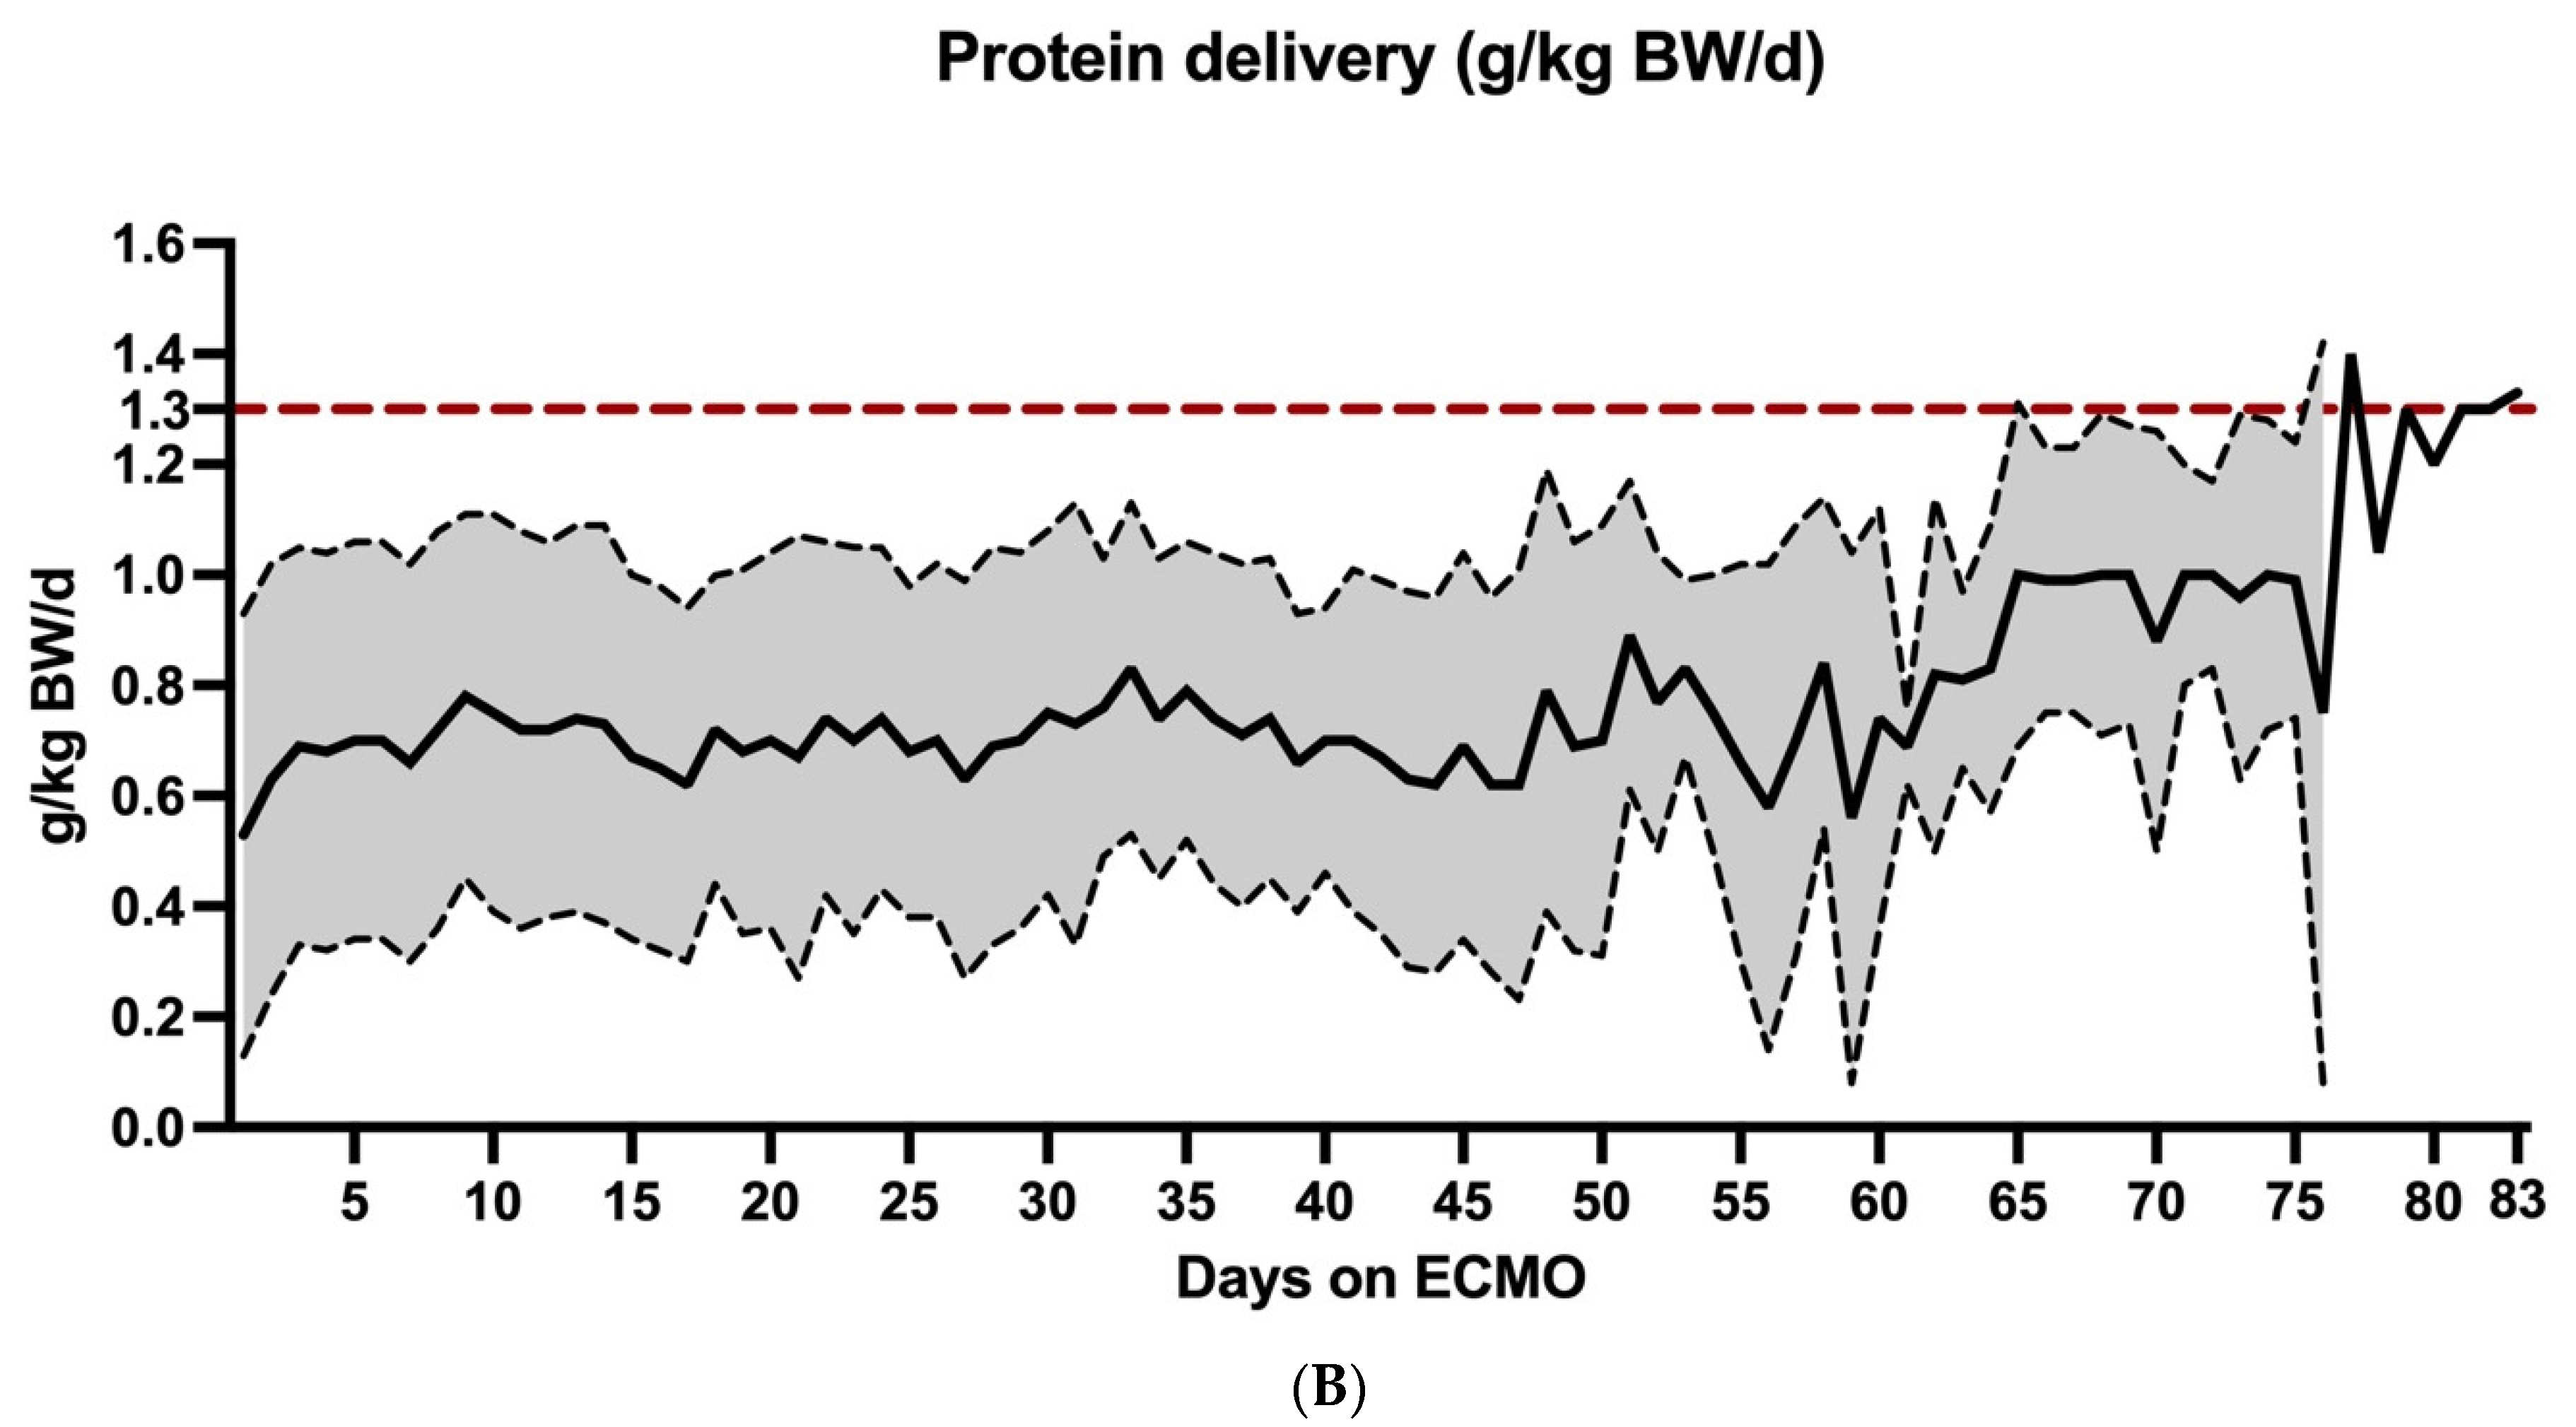
- Time course of daily mean energy and protein delivery = mean ± standard deviation of calorie and protein delivery for each day during ECMO therapy. These data were used to analyze changes in nutrition supply over time.
- -
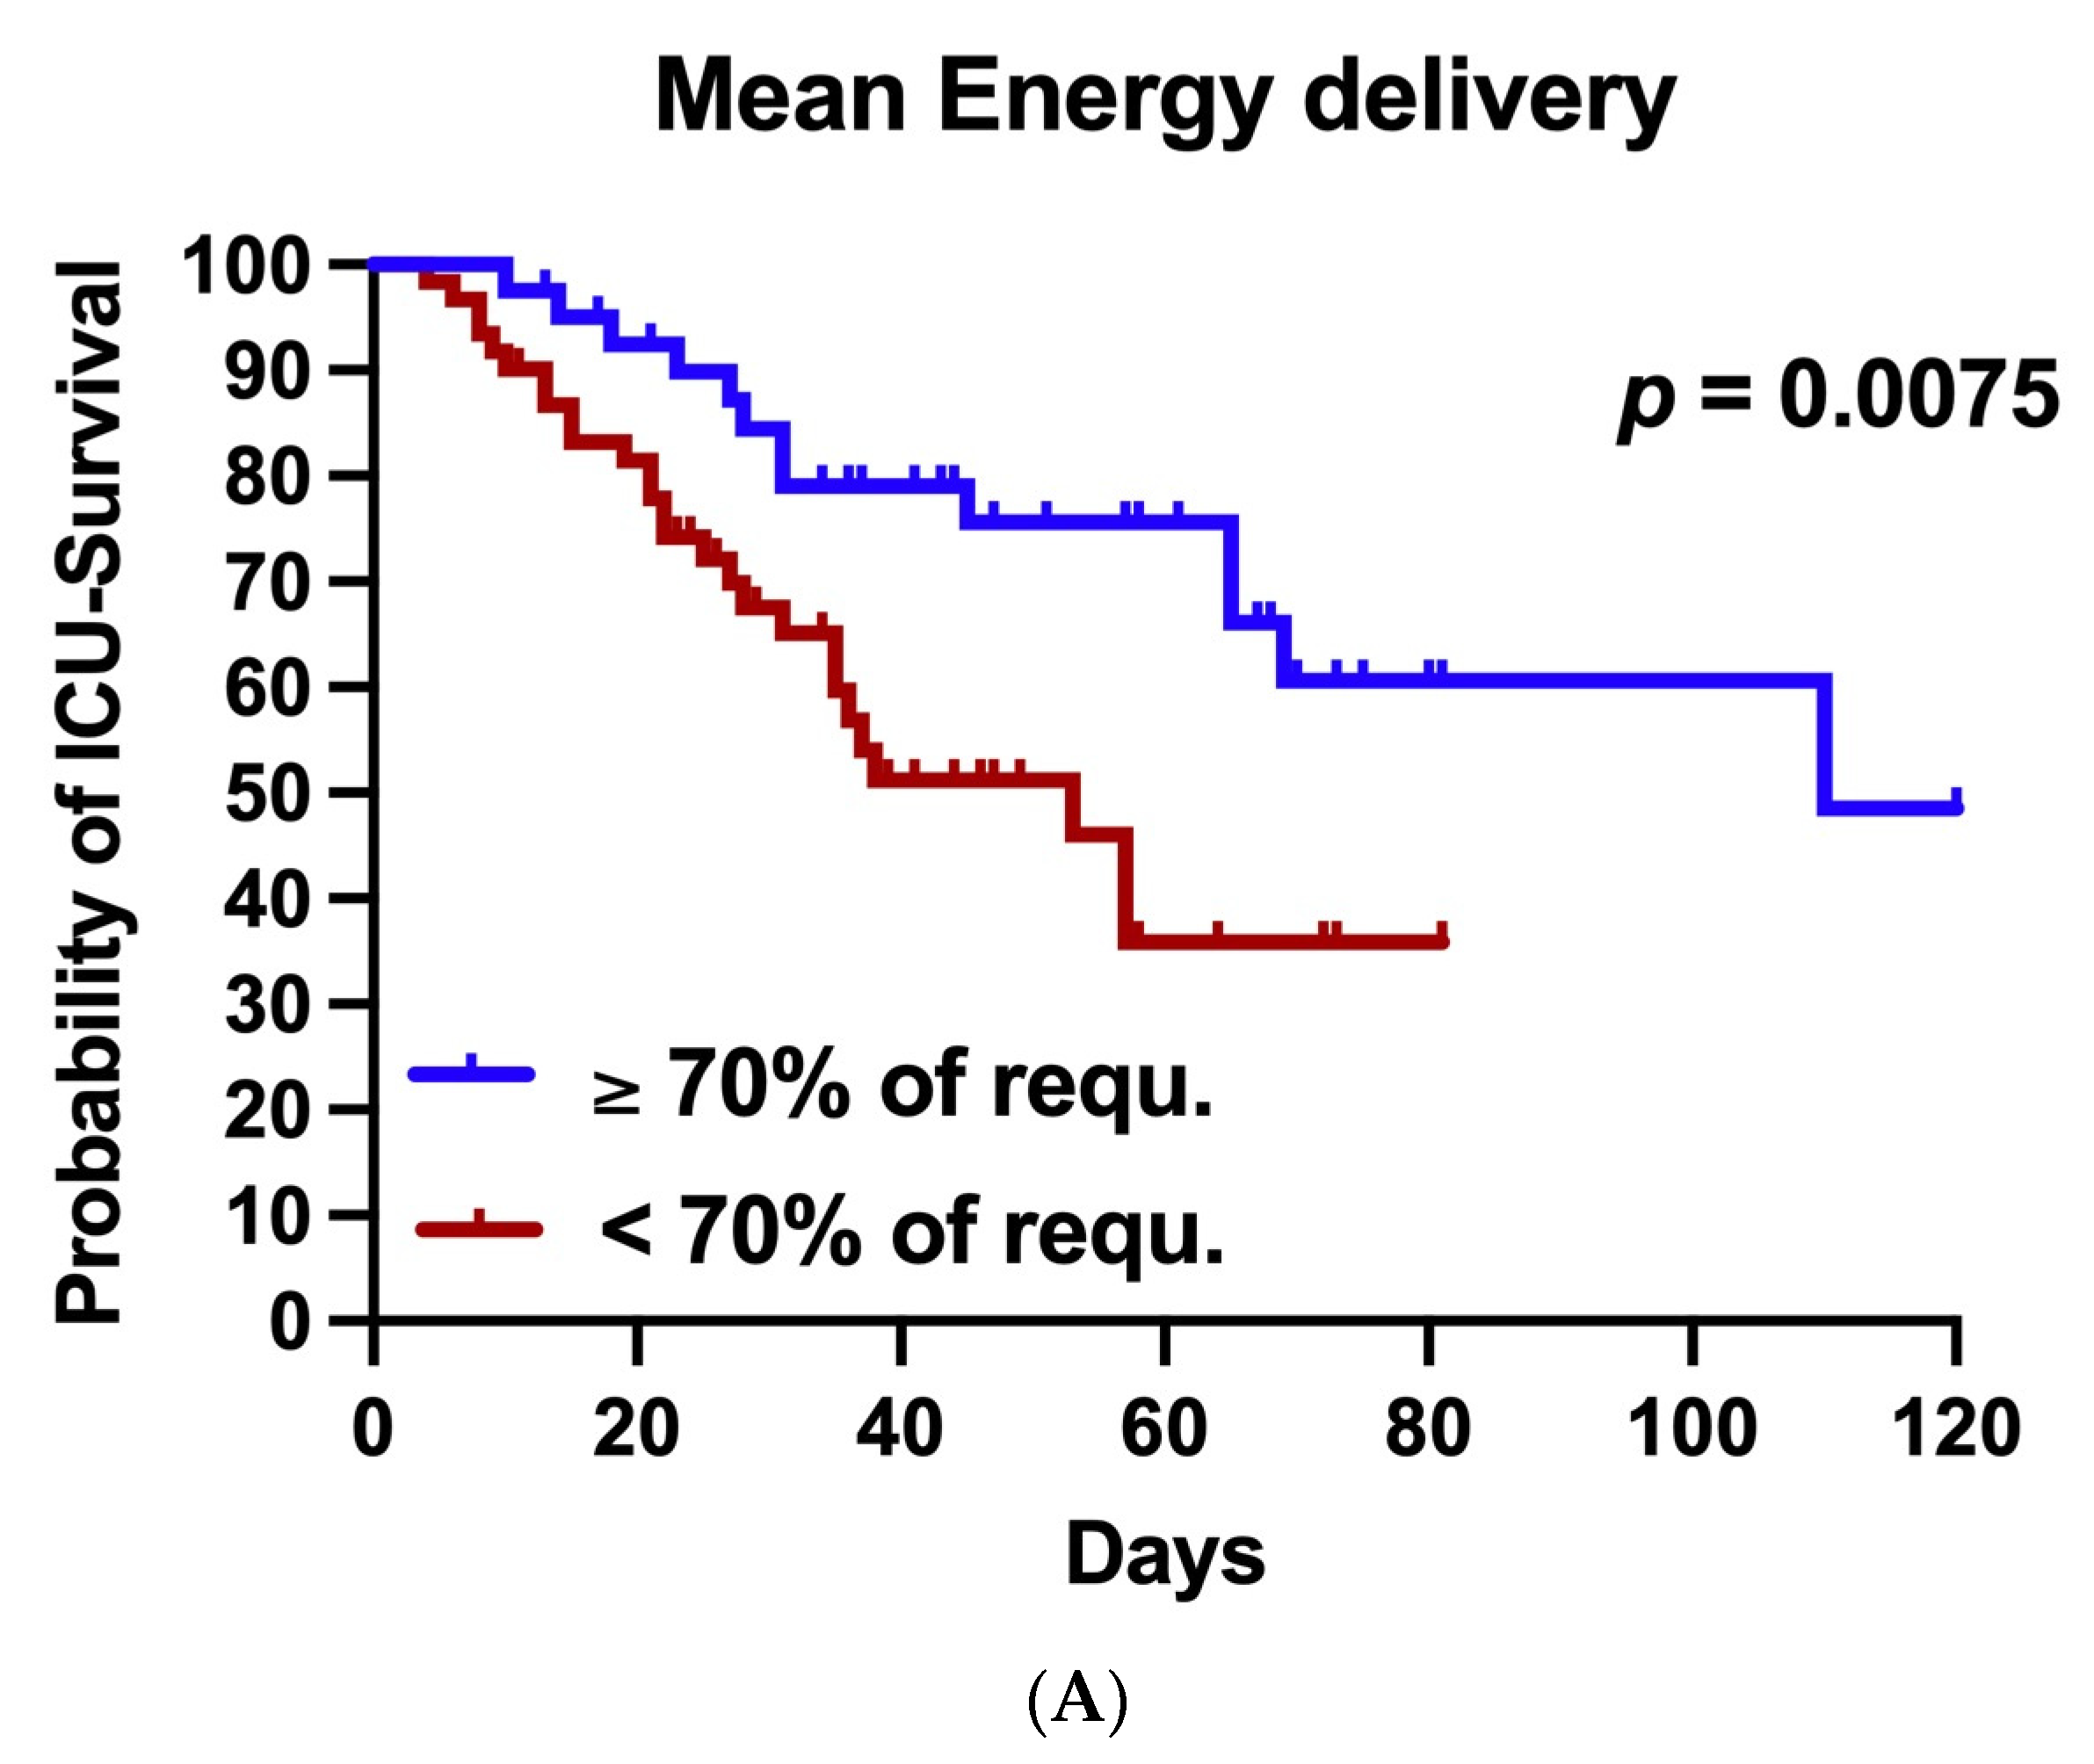
- In order to evaluate the effects of medical nutrition therapy on ICU survival, we divided our patient population into two groups according to the adequacy of energy supply (mean calorie delivery ≥70% and <70% of calculated requirements over the course of ECMO therapy). For this reason, calorie and protein delivery for each patient over the course of ECMO support was calculated as = mean ± standard deviation of calorie and protein delivery of each patient over the time course of ECMO support. The time period between the start of ECMO and its end, or death, was used for the calculation of mean energy and protein delivery for each patient.
3. Results
3.1. Data on Nutrition Support during ECMO Therapy
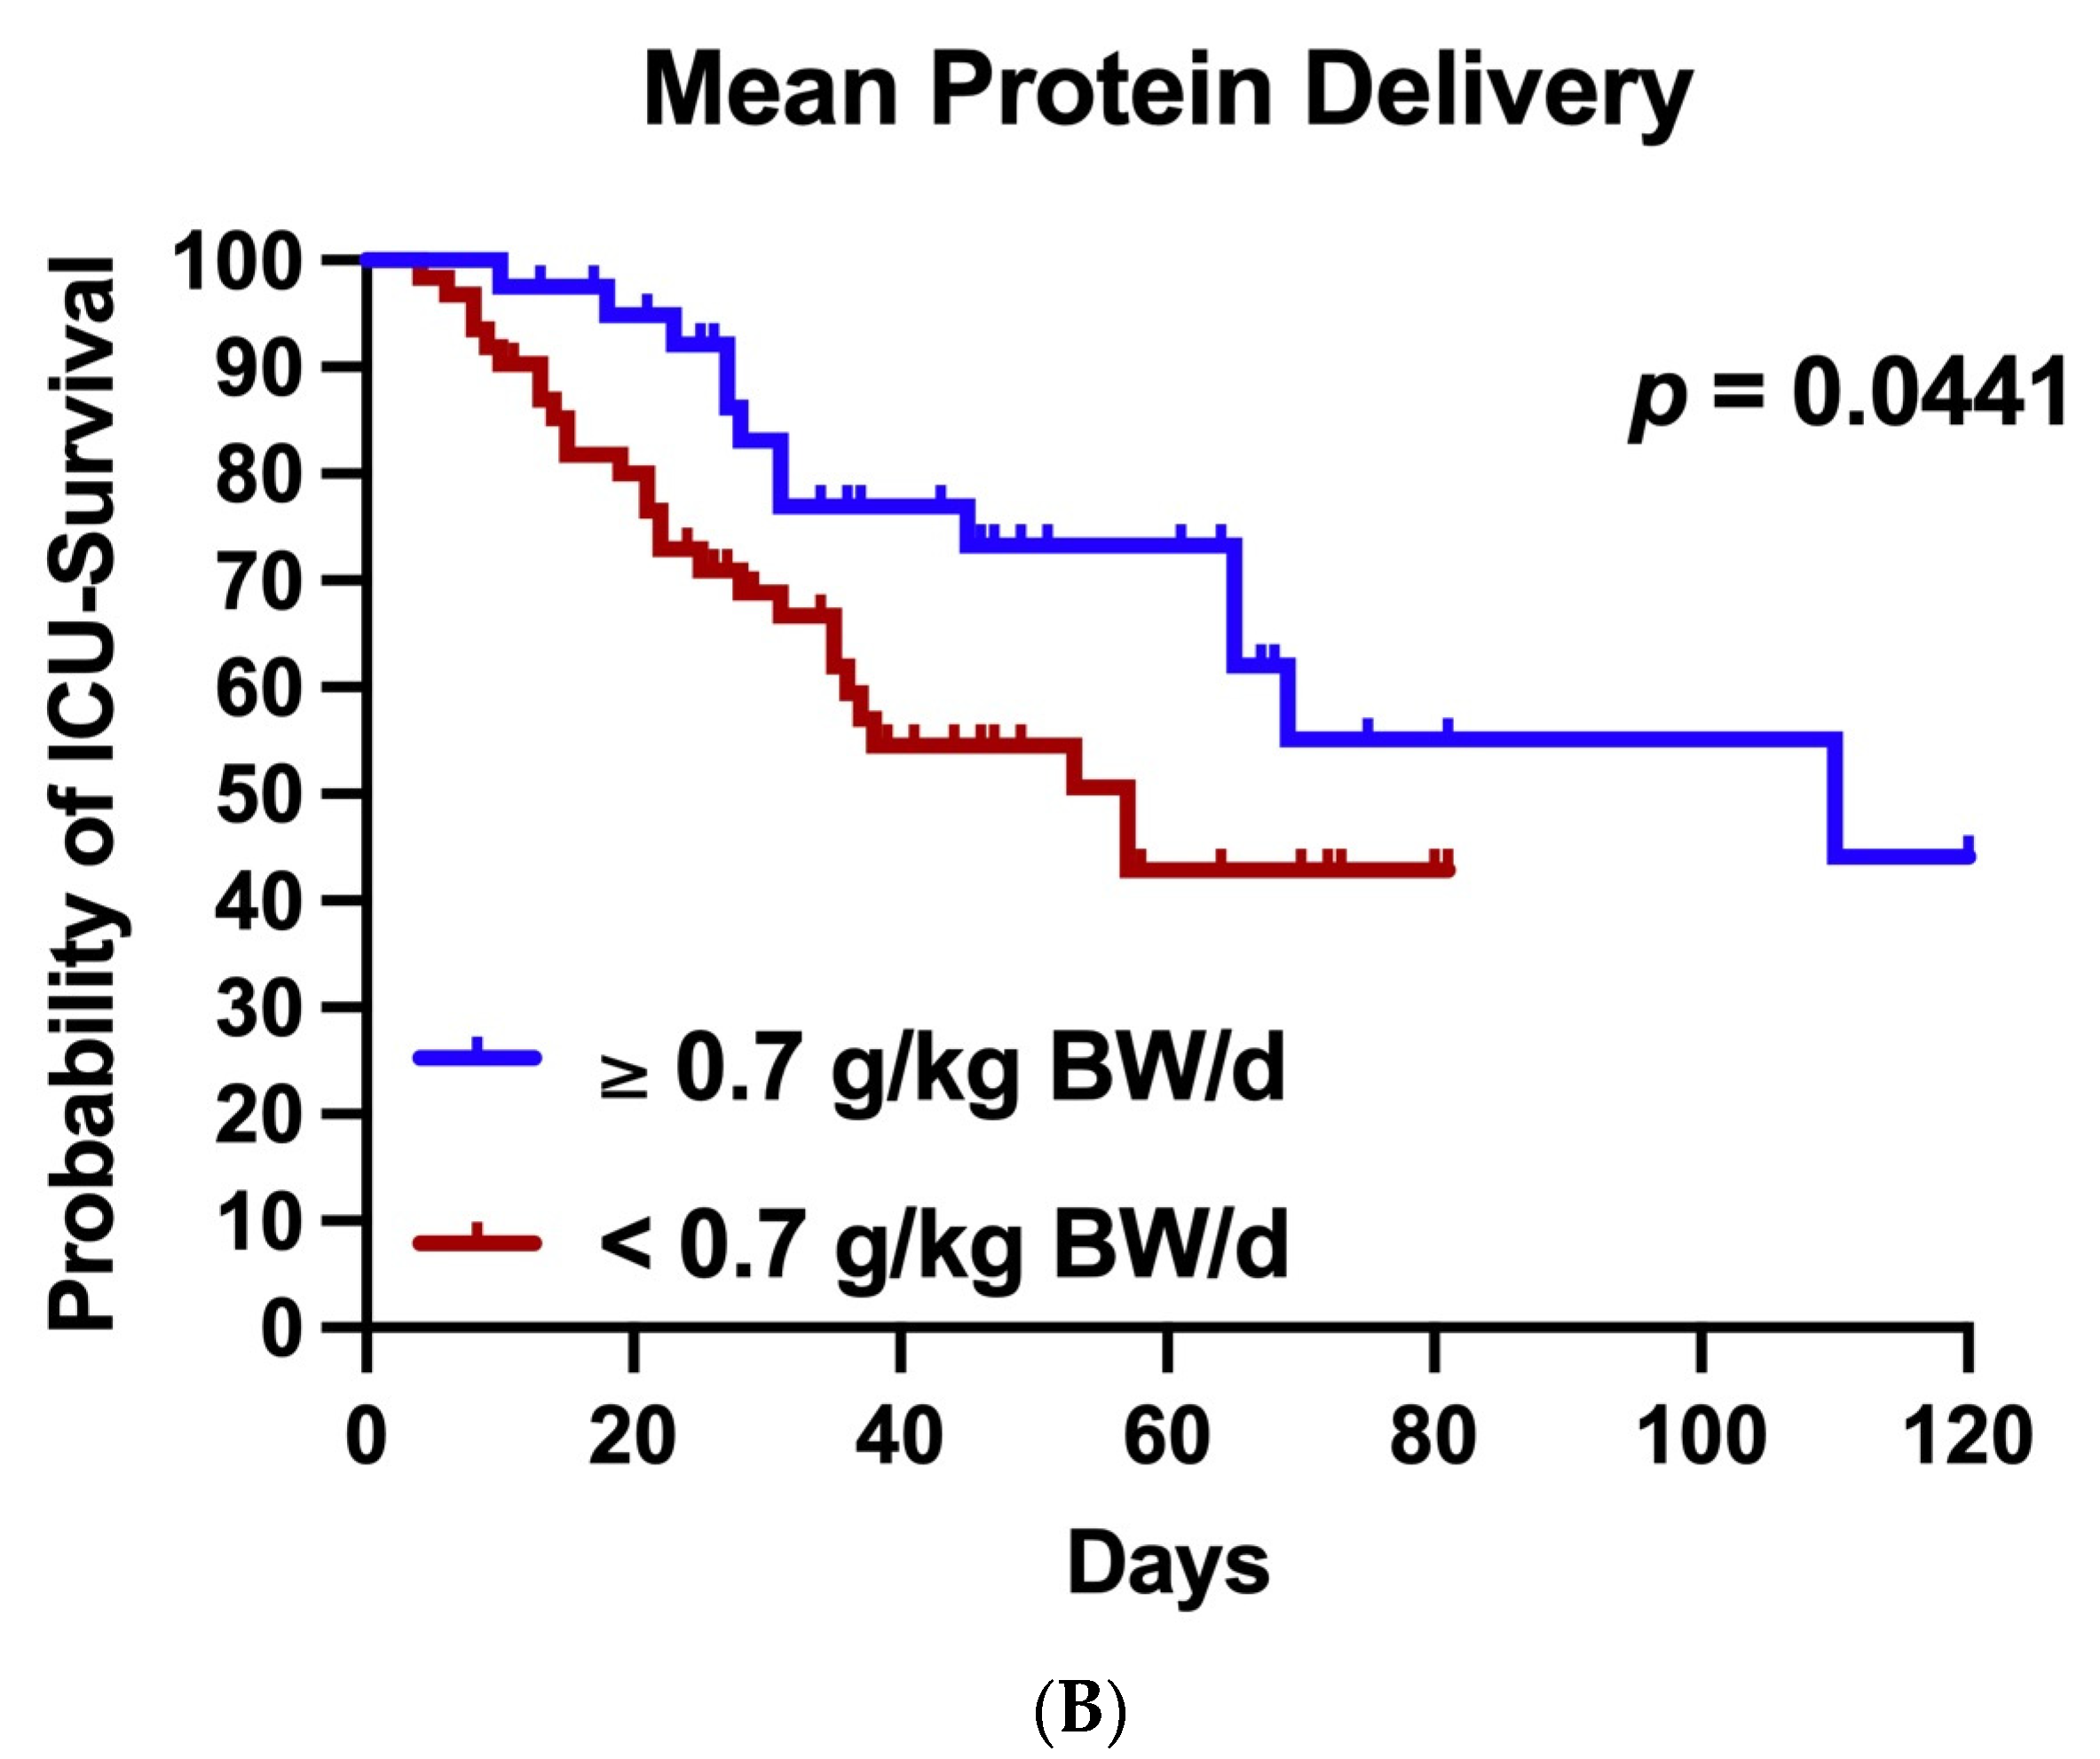
3.2. Nutrition Support and Outcome
4. Discussion
4.1. Undernutrition Is Frequent among ECMO Patients
4.2. Protein Intake
4.3. Association with Mortality
4.4. Limitations
5. Conclusions
Supplementary Materials
Author Contributions
Funding
Institutional Review Board Statement
Informed Consent Statement
Data Availability Statement
Acknowledgments
Conflicts of Interest
Abbreviations
| aHR | adjusted hazard ratio |
| ARDS | acute respiratory distress syndrome |
| BMI | body mass index |
| BW | actual body weight |
| CI | confidence interval |
| COVID-19 | coronavirus disease 2019 |
| d | day |
| del | delivery |
| ECMO | extracorporeal membrane oxygenation |
| EN | enteral nutrition |
| ESPEN | European Society for Clinical Nutrition and Metabolism |
| g | gram |
| GRV | gastric residual volume |
| HR | hazard ratio |
| ICU | intensive care unit |
| IQR | interquartile range |
| kcal | kilocalories |
| kg | kilogram |
| LOS | length of stay |
| mg | milligram |
| Non-Surv | non-survivors |
| PN | parenteral nutrition |
| prop | propofol |
| requ | requirements |
| SAPSII | Simplified Acute Physiology Score II |
| SOFA | Sequential Organ Failure Assessment Score |
| Std | standard deviation |
| Surv | survivors |
| vv | venovenous |
References
- Rives-Lange, C.; Zimmer, A.; Merazka, A.; Carette, C.; Martins-Bexinga, A.; Hauw-Berlemont, C.; Guerot, E.; Jannot, A.S.; Diehl, J.L.; Czernichow, S.; et al. Evolution of the nutritional status of COVID-19 critically-ill patients: A prospective observational study from ICU admission to three months after ICU discharge. Clin. Nutr. 2022, 41, 3026–3031. [Google Scholar] [CrossRef] [PubMed]
- Shahbazi, S.; Hajimohammadebrahim-Ketabforoush, M.; Vahdat Shariatpanahi, M.; Shahbazi, E.; Vahdat Shariatpanahi, Z. The validity of the global leadership initiative on malnutrition criteria for diagnosing malnutrition in critically ill patients with COVID-19: A prospective cohort study. Clin. Nutr. ESPEN 2021, 43, 377–382. [Google Scholar] [CrossRef] [PubMed]
- Zhao, X.; Li, Y.; Ge, Y.; Shi, Y.; Lv, P.; Zhang, J.; Fu, G.; Zhou, Y.; Jiang, K.; Lin, N.; et al. Evaluation of Nutrition Risk and Its Association With Mortality Risk in Severely and Critically Ill COVID-19 Patients. JPEN J. Parenter. Enteral Nutr. 2021, 45, 32–42. [Google Scholar] [CrossRef]
- Lakenman, P.L.M.; van Schie, J.C.; van der Hoven, B.; Baart, S.J.; Eveleens, R.D.; van Bommel, J.; Olieman, J.F.; Joosten, K.F.M. Nutritional intake and gastro-intestinal symptoms in critically ill COVID-19 patients. Clin. Nutr. 2022, 41, 2903–2909. [Google Scholar] [CrossRef] [PubMed]
- El Moheb, M.; Naar, L.; Christensen, M.A.; Kapoen, C.; Maurer, L.R.; Farhat, M.; Kaafarani, H.M.A. Gastrointestinal Complications in Critically Ill Patients With and Without COVID-19. JAMA 2020, 324, 1899–1901. [Google Scholar] [CrossRef]
- Arkin, N.; Krishnan, K.; Chang, M.G.; Bittner, E.A. Nutrition in critically ill patients with COVID-19: Challenges and special considerations. Clin. Nutr. 2020, 39, 2327–2328. [Google Scholar] [CrossRef]
- Barazzoni, R.; Bischoff, S.C.; Breda, J.; Wickramasinghe, K.; Krznaric, Z.; Nitzan, D.; Pirlich, M.; Singer, P. ESPEN expert statements and practical guidance for nutritional management of individuals with SARS-CoV-2 infection. Clin. Nutr. 2020, 39, 1631–1638. [Google Scholar] [CrossRef]
- Lakenman, P.L.M.; van der Hoven, B.; Schuijs, J.M.; Eveleens, R.D.; van Bommel, J.; Olieman, J.F.; Joosten, K.F.M. Energy expenditure and feeding practices and tolerance during the acute and late phase of critically ill COVID-19 patients. Clin. Nutr. ESPEN 2021, 43, 383–389. [Google Scholar] [CrossRef]
- Whittle, J.; Molinger, J.; MacLeod, D.; Haines, K.; Wischmeyer, P.E. Persistent hypermetabolism and longitudinal energy expenditure in critically ill patients with COVID-19. Crit. Care 2020, 24, 581. [Google Scholar] [CrossRef]
- Yu, P.J.; Cassiere, H.; DeRosa, S.; Bocchieri, K.; Yar, S.; Hartman, A. Hypermetabolism and Coronavirus Disease 2019. JPEN J. Parenter. Enteral Nutr. 2020, 44, 1234–1236. [Google Scholar] [CrossRef]
- Cereda, E.; Guzzardella, A.; Klersy, C.; Belliato, M.; Pellegrini, A.; Sciutti, F.; Mongodi, S.; Masi, S.; Crotti, S.; Savioli, M.; et al. Early caloric deficit is associated with a higher risk of death in invasive ventilated COVID-19 patients. Clin. Nutr. 2022, 41, 3096–3099. [Google Scholar] [CrossRef] [PubMed]
- Combes, A.; Hajage, D.; Capellier, G.; Demoule, A.; Lavoue, S.; Guervilly, C.; Da Silva, D.; Zafrani, L.; Tirot, P.; Veber, B.; et al. Extracorporeal Membrane Oxygenation for Severe Acute Respiratory Distress Syndrome. N. Engl. J. Med. 2018, 378, 1965–1975. [Google Scholar] [CrossRef] [PubMed]
- Shekar, K.; Badulak, J.; Peek, G.; Boeken, U.; Dalton, H.J.; Arora, L.; Zakhary, B.; Ramanathan, K.; Starr, J.; Akkanti, B.; et al. Extracorporeal Life Support Organization Coronavirus Disease 2019 Interim Guidelines: A Consensus Document from an International Group of Interdisciplinary Extracorporeal Membrane Oxygenation Providers. Asaio J. 2020, 66, 707–721. [Google Scholar] [CrossRef]
- Combes, A.; Brodie, D.; Chen, Y.S.; Fan, E.; Henriques, J.P.S.; Hodgson, C.; Lepper, P.M.; Leprince, P.; Maekawa, K.; Muller, T.; et al. The ICM research agenda on extracorporeal life support. Intensive Care Med. 2017, 43, 1306–1318. [Google Scholar] [CrossRef] [PubMed]
- Brodie, D.; Vincent, J.L.; Brochard, L.J.; Combes, A.; Ferguson, N.D.; Hodgson, C.L.; Laffey, J.G.; Mercat, A.; Pesenti, A.; Quintel, M.; et al. Research in Extracorporeal Life Support A Call to Action. Chest 2018, 153, 788–791. [Google Scholar] [CrossRef]
- Estensen, K.; Shekar, K.; Robins, E.; McDonald, C.; Barnett, A.G.; Fraser, J.F. Macro- and micronutrient disposition in an ex vivo model of extracorporeal membrane oxygenation. Intensive Care Med. Exp. 2014, 2, 29. [Google Scholar] [CrossRef]
- Lindberg, B.R.; Videm, V.; Dahl, T.; Sørensen, G.; Fiane, A.E.; Thiara, A.S. Influence of the ECMO circuit on the concentration of nutritional supplements. Sci. Rep. 2020, 10, 19275. [Google Scholar] [CrossRef]
- D’Alesio, M.; Martucci, G.; Arcadipane, A.; Lorusso, R.; Amrein, K. Nutrition during extracorporeal life support: A review of pathophysiological bases and application of guidelines. Artif. Organs 2022, 46, 1240–1248. [Google Scholar] [CrossRef]
- Stoppe, C.; Nesterova, E.; Elke, G. Nutritional support in patients with extracorporeal life support and ventricular assist devices. Curr. Opin. Crit. Care 2018, 24, 269–276. [Google Scholar] [CrossRef]
- Ferrie, S.; Herkes, R.; Forrest, P. Nutrition support during extracorporeal membrane oxygenation (ECMO) in adults: A retrospective audit of 86 patients. Intensive Care Med. 2013, 39, 1989–1994. [Google Scholar] [CrossRef]
- MacGowan, L.; Smith, E.; Elliott-Hammond, C.; Sanderson, B.; Ong, D.; Daly, K.; Barrett, N.A.; Whelan, K.; Bear, D.E. Adequacy of nutrition support during extracorporeal membrane oxygenation. Clin. Nutr. 2019, 38, 324–331. [Google Scholar] [CrossRef] [PubMed]
- Park, J.; Heo, E.; Song, I.A.; Cho, J.; Namgung, H.; Lee, E.; Lee, E.; Kim, D.J. Nutritional support and clinical outcomes in critically ill patients supported with veno-arterial extracorporeal membrane oxygenation. Clin. Nutr. 2020, 39, 2617–2623. [Google Scholar] [CrossRef] [PubMed]
- Ridley, E.J.; Davies, A.R.; Robins, E.J.; Lukas, G.; Bailey, M.J.; Fraser, J.F.; Australian New, Z. Nutrition therapy in adult patients receiving extracorporeal membrane oxygenation: A prospective, multicentre, observational study. Crit. Care Resusc. 2015, 17, 183–189. [Google Scholar] [PubMed]
- Lukas, G.; Davies, A.R.; Hilton, A.K.; Pellegrino, V.A.; Scheinkestel, C.D.; Ridley, E. Nutritional support in adult patients receiving extracorporeal membrane oxygenation. Crit. Care Resusc. 2010, 12, 230–234. [Google Scholar]
- Makikado, L.D.U.; Lasierra, J.L.F.; Perez-Vela, J.L.; Gomez, L.C.; Sanchez, E.T.; Rodriguez, B.M.; Lopez, P.A.; Gonzalez, J.C.M. Early Enteral Nutrition in Adults Receiving Venoarterial Extracorporeal Membrane Oxygenation: An Observational Case Series. JPEN J. Parenter. Enteral Nutr. 2013, 37, 281–284. [Google Scholar] [CrossRef]
- Giner, M.; Laviano, A.; Meguid, M.M.; Gleason, J.R. In 1995 a correlation between malnutrition and poor outcome in critically ill patients still exists. Nutrition 1996, 12, 23–29. [Google Scholar] [CrossRef]
- Al-Dorzi, H.M.; Arabi, Y.M. Enteral Nutrition Safety With Advanced Treatments: Extracorporeal Membrane Oxygenation, Prone Positioning, and Infusion of Neuromuscular Blockers. Nutr. Clin. Pract. 2021, 36, 88–97. [Google Scholar] [CrossRef]
- Davis, R.C.; Durham, L.A.; Kiraly, L.; Patel, J.J. Safety, Tolerability, and Outcomes of Enteral Nutrition in Extracorporeal Membrane Oxygenation. Nutr. Clin. Pract. 2021, 36, 98–104. [Google Scholar] [CrossRef]
- Kagan, I.; Singer, P. Nutritional imbalances during extracorporeal life support. World Rev. Nutr. Diet. 2013, 105, 154–159. [Google Scholar] [CrossRef]
- Singer, P.; Blaser, A.R.; Berger, M.M.; Alhazzani, W.; Calder, P.C.; Casaer, M.P.; Hiesmayr, M.; Mayer, K.; Montejo, J.C.; Pichard, C.; et al. ESPEN guideline on clinical nutrition in the intensive care unit. Clin. Nutr. 2019, 38, 48–79. [Google Scholar] [CrossRef]
- Compher, C.; Bingham, A.L.; McCall, M.; Patel, J.; Rice, T.W.; Braunschweig, C.; McKeever, L. Guidelines for the provision of nutrition support therapy in the adult critically ill patient: The American Society for Parenteral and Enteral Nutrition. JPEN J. Parenter. Enteral Nutr. 2022, 46, 12–41. [Google Scholar] [CrossRef] [PubMed]
- Scott, L.K.; Boudreaux, K.; Thaljeh, F.; Grier, L.R.; Conrad, S.A. Early enteral feedings in adults receiving venovenous extracorporeal membrane oxygenation. JPEN J. Parenter. Enteral Nutr. 2004, 28, 295–300. [Google Scholar] [CrossRef] [PubMed]
- Ohbe, H.; Jo, T.; Yamana, H.; Matsui, H.; Fushimi, K.; Yasunaga, H. Early enteral nutrition for cardiogenic or obstructive shock requiring venoarterial extracorporeal membrane oxygenation: A nationwide inpatient database study. Intensive Care Med. 2018, 44, 1258–1265. [Google Scholar] [CrossRef]
- Hunt, M.F.; Suarez-Pierre, A.; Zhou, X.; Lui, C.; Lo, B.D.; Brown, P.M.; Whitman, G.J.; Choi, C.W. Nutritional Support in Postcardiotomy Shock Extracorporeal Membrane Oxygenation Patients: A Prospective, Observational Study. J. Surg. Res. 2019, 244, 257–264. [Google Scholar] [CrossRef] [PubMed]
- Casaer, M.P.; Mesotten, D.; Hermans, G.; Wouters, P.J.; Schetz, M.; Meyfroidt, G.; Van Cromphaut, S.; Ingels, C.; Meersseman, P.; Muller, J.; et al. Early versus Late Parenteral Nutrition in Critically Ill Adults. N. Engl. J. Med. 2011, 365, 506–517. [Google Scholar] [CrossRef] [PubMed]
- Souba, W.W. Nutritional Support. N. Engl. J. Med. 1997, 336, 41–48. [Google Scholar] [CrossRef]
- Hardy, G.; Camporota, L.; Bear, D.E. Nutrition support practices across the care continuum in a single centre critical care unit during the first surge of the COVID-19 pandemic—A comparison of VV-ECMO and non-ECMO patients. Clin. Nutr. 2022, 41, 2887–2894. [Google Scholar] [CrossRef]
- Schmidt, M.; Hajage, D.; Demoule, A.; Pham, T.; Combes, A.; Dres, M.; Lebbah, S.; Kimmoun, A.; Mercat, A.; Beduneau, G.; et al. Clinical characteristics and day-90 outcomes of 4244 critically ill adults with COVID-19: A prospective cohort study. Intensive Care Med. 2021, 47, 60–73. [Google Scholar] [CrossRef]
- Granholm, A.; Krag, M.; Marker, S.; Alhazzani, W.; Perner, A.; Møller, M.H. Predictors of gastrointestinal bleeding in adult ICU patients in the SUP-ICU trial. Acta Anaesthesiol. Scand. 2021, 65, 792–800. [Google Scholar] [CrossRef] [PubMed]
- Yang, Z.; Hu, Q.; Huang, F.; Xiong, S.; Sun, Y. The prognostic value of the SOFA score in patients with COVID-19: A retrospective, observational study. Medicine 2021, 100, e26900. [Google Scholar] [CrossRef]
- Sekulic, A.D.; Trpkovic, S.V.; Pavlovic, A.P.; Marinkovic, O.M.; Ilic, A.N. Scoring Systems in Assessing Survival of Critically Ill ICU Patients. Med. Sci. Monit. 2015, 21, 2621–2629. [Google Scholar] [CrossRef]
- Rady, M.Y.; Johnson, D.J.; Patel, B.M.; Larson, J.S.; Helmers, R.A. Influence of individual characteristics on outcome of glycemic control in intensive care unit patients with or without diabetes mellitus. Mayo Clin. Proc. 2005, 80, 1558–1567. [Google Scholar] [CrossRef]
- Singer, P.; Anbar, R.; Cohen, J.; Shapiro, H.; Shalita-Chesner, M.; Lev, S.; Grozovski, E.; Theilla, M.; Frishman, S.; Madar, Z. The tight calorie control study (TICACOS): A prospective, randomized, controlled pilot study of nutritional support in critically ill patients. Intensive Care Med. 2011, 37, 601–609. [Google Scholar] [CrossRef] [PubMed]
- Heidegger, C.P.; Berger, M.M.; Graf, S.; Zingg, W.; Darmon, P.; Costanza, M.C.; Thibault, R.; Pichard, C. Optimisation of energy provision with supplemental parenteral nutrition in critically ill patients: A randomised controlled clinical trial. Lancet 2013, 381, 385–393. [Google Scholar] [CrossRef] [PubMed]
- Singer, P.; De Waele, E.; Sanchez, C.; Ruiz Santana, S.; Montejo, J.C.; Laterre, P.F.; Soroksky, A.; Moscovici, E.; Kagan, I. TICACOS international: A multi-center, randomized, prospective controlled study comparing tight calorie control versus Liberal calorie administration study. Clin. Nutr. 2021, 40, 380–387. [Google Scholar] [CrossRef] [PubMed]
- Lewis, S.R.; Schofield-Robinson, O.J.; Alderson, P.; Smith, A.F. Enteral versus parenteral nutrition and enteral versus a combination of enteral and parenteral nutrition for adults in the intensive care unit. Cochrane Database Syst. Rev. 2018, 6, Cd012276. [Google Scholar] [CrossRef] [PubMed]
- Poissy, J.; Damonti, L.; Bignon, A.; Khanna, N.; Von Kietzell, M.; Boggian, K.; Neofytos, D.; Vuotto, F.; Coiteux, V.; Artru, F.; et al. Risk factors for candidemia: A prospective matched case-control study. Crit. Care 2020, 24, 109. [Google Scholar] [CrossRef]
- De Waele, E.; van Zwam, K.; Mattens, S.; Staessens, K.; Diltoer, M.; Honoré, P.M.; Czapla, J.; Nijs, J.; La Meir, M.; Huyghens, L.; et al. Measuring resting energy expenditure during extracorporeal membrane oxygenation: Preliminary clinical experience with a proposed theoretical model. Acta Anaesthesiol. Scand 2015, 59, 1296–1302. [Google Scholar] [CrossRef]
- Wollersheim, T.; Frank, S.; Müller, M.C.; Skrypnikov, V.; Carbon, N.M.; Pickerodt, P.A.; Spies, C.; Mai, K.; Spranger, J.; Weber-Carstens, S. Measuring Energy Expenditure in extracorporeal lung support Patients (MEEP)–Protocol, feasibility and pilot trial. Clin. Nutr. 2018, 37, 301–307. [Google Scholar] [CrossRef]


| Basic Characteristics | Overall | ICU Surv. | ICU Non-Surv. | p= |
|---|---|---|---|---|
| Number of Patients, No. (%) | 102 (100) | 60 (58.8) | 42 (41.2) | |
| Age (years), median (IQR) | 57 (50–62) | 55 (48–60) | 61 (57–66) | <0.0001 |
| Male, No. (%) | 73 (71.6) | 40 (66.7) | 33 (78.6) | 0.2650 |
| Weight (kg), median (IQR) | 90 (80–100) | 89 (80–100) | 90 (80–105) | 0.8826 |
| BMI (kg/m2), median (IQR) | 29 (26–35) | 29 (26–34) | 30 (27–36) | 0.6809 |
| SOFA at admission, median (IQR) | 8 (7–9) | 7 (7–8) | 8 (7–9) | 0.2531 |
| SOFA at ECMO start, median (IQR) | 8 (7–9) | 8 (7–8) | 9 (8–11) | <0.0001 |
| SAPSII at admission, median (IQR) | 42 (37–49) | 40 (34–46) | 45 (40–52) | 0.0024 |
| SAPSII at ECMO start, median (IQR) | 40 (34–46) | 39 (32–44) | 43 (38–51) | 0.0218 |
| ECMO duration (days), median (IQR) | 20 (11–31) | 18 (12–31) | 20 (9–31) | 0.8776 |
| ICU LOS (days), median (IQR) | 35 (22–57) | 44 (26–64) | 27 (15–40) | 0.0023 |
| Nutrition Data | Overall | ICU Surv. | ICU Non-Surv. | p= |
|---|---|---|---|---|
| Daily calorie del. (% of requ.) overall, mean ± Std. | 73.677 (29.1) | 76.3 (28.2) | 69.8 (30.0) | <0.0001 |
| Daily calorie del. (% of requ.) from EN, mean ± Std. | 51.0 (34.6) | 56.0 (33.7) | 43.4 (34.5) | <0.0001 |
| Daily calorie del. (% of requ.) from PN, mean ± Std. | 14.2 (23.9) | 11.6 (22.7) | 18.0 (25.1) | <0.0001 |
| Daily calorie del. (% of requ.) from prop., mean ± Std. | 8.6 (7.7) | 8.7 (7.6) | 8.4 (7.9) | 0.2867 |
| Daily protein del. (g/kg BW/d) overall, mean ± Std. | 0.7 (0.4) | 0.7 (0.3) | 0.7 (0.4) | 0.1650 |
| Daily protein del. (g/KG BW/d) from EN, mean ± Std. | 0.5 (0.4) | 0.5 (0.4) | 0.4 (0.4) | <0.0001 |
| Daily protein del. (g/kg BW/d) from PN, mean ± Std. | 0.2 (0.4) | 0.2 (0.4) | 0.3 (0.4) | <0.0001 |
| Nutrition Support Practices | Overall | ICU Surv. | ICU Non-Surv. | p= |
|---|---|---|---|---|
| Total number of potential nutrition support days | 2344 | 1408 | 936 | |
| Days with calorie del. 70–100% of requ., No. (%) | 952 (40.6) | 596 (42.3) | 356 (38.0) | 0.0394 |
| Days with calorie del. <70%of requ., No. (%) | 956 (40.8) | 522 (37.1) | 434 (46.4) | <0.0001 |
| Days with calorie del. >100% of requ., No. (%) | 436 (18.6) | 290 (20.6) | 146 (15.6) | 0.0024 |
| Days with protein del. ≥0.7 g/kg BW/d, No. (%) | 1187 (50.6) | 709 (50.3) | 478 (51.1) | 0.7360 |
| Days with protein del. ≥1.3 g/kg BW/d, No. (%) | 114 (4.9) | 54 (2.3) | 60 (6.4) | 0.0058 |
| Days with EN, No. (%) | 1516 (64.7) | 1013 (71.9) | 503 (53.7) | <0.0001 |
| Days with PN, No. (%) | 181 (7.7) | 79 (5.6) | 102 (10.9) | <0.0001 |
| Days with EN + PN, No. (%) | 567 (24.1) | 274 (19.5) | 293 (31.3) | <0.0001 |
| Days with no nutrition support, No. (%) | 80 (3.4) | 42 (3.0) | 38 (4.1) | 0.1649 |
| Days with GRV ≥500mL, No. (%) | 196 (8.4) | 97 (6.9) | 99 (10.6) | 0.0018 |
| Days with prokinetic therapy, No. (%) | 1247 (53.2) | 739 (52.5) | 508 (54.3) | 0.3984 |
| Days with ≥1 episode of hyperglycemia, No. (%) | 1306 (55.7) | 733 (52.1) | 573 (61.2) | <0.0001 |
| Days with hypertriglyceridemia, No. (%) | 801 (34.2) | 466 (33.1) | 335 (35.8) | 0.1770 |
| Parameter | Univariable | Multivariable | ||
|---|---|---|---|---|
| HR (95%CI) | p-Value | aHR (95%CI) | p= | |
| Mean Energy del. ≥70% vs. <70% of requ.* | 0.395 (0.197–0.794) | 0.009 | 0.372 (0.182–0.760) | 0.007 |
| Age | 1.068 (1.026–1.112) | 0.001 | 1.094 (1.031–1.162) | 0.003 |
| SAPSII at ECMO Start | 1.037 (1.005–1.069) | 0.023 | 1.009 (0.968–1.051) | 0.677 |
| BMI | 1.042 (0.996–1.089) | 0.074 | 1.071 (1.019–1.125) | 0.007 |
Disclaimer/Publisher’s Note: The statements, opinions and data contained in all publications are solely those of the individual author(s) and contributor(s) and not of MDPI and/or the editor(s). MDPI and/or the editor(s) disclaim responsibility for any injury to people or property resulting from any ideas, methods, instructions or products referred to in the content. |
© 2023 by the authors. Licensee MDPI, Basel, Switzerland. This article is an open access article distributed under the terms and conditions of the Creative Commons Attribution (CC BY) license (https://creativecommons.org/licenses/by/4.0/).
Share and Cite
Schneeweiss-Gleixner, M.; Scheiner, B.; Semmler, G.; Maleczek, M.; Laxar, D.; Hintersteininger, M.; Hermann, M.; Hermann, A.; Buchtele, N.; Schaden, E.; et al. Inadequate Energy Delivery Is Frequent among COVID-19 Patients Requiring ECMO Support and Associated with Increased ICU Mortality. Nutrients 2023, 15, 2098. https://doi.org/10.3390/nu15092098
Schneeweiss-Gleixner M, Scheiner B, Semmler G, Maleczek M, Laxar D, Hintersteininger M, Hermann M, Hermann A, Buchtele N, Schaden E, et al. Inadequate Energy Delivery Is Frequent among COVID-19 Patients Requiring ECMO Support and Associated with Increased ICU Mortality. Nutrients. 2023; 15(9):2098. https://doi.org/10.3390/nu15092098
Chicago/Turabian StyleSchneeweiss-Gleixner, Mathias, Bernhard Scheiner, Georg Semmler, Mathias Maleczek, Daniel Laxar, Marlene Hintersteininger, Martina Hermann, Alexander Hermann, Nina Buchtele, Eva Schaden, and et al. 2023. "Inadequate Energy Delivery Is Frequent among COVID-19 Patients Requiring ECMO Support and Associated with Increased ICU Mortality" Nutrients 15, no. 9: 2098. https://doi.org/10.3390/nu15092098
APA StyleSchneeweiss-Gleixner, M., Scheiner, B., Semmler, G., Maleczek, M., Laxar, D., Hintersteininger, M., Hermann, M., Hermann, A., Buchtele, N., Schaden, E., Staudinger, T., & Zauner, C. (2023). Inadequate Energy Delivery Is Frequent among COVID-19 Patients Requiring ECMO Support and Associated with Increased ICU Mortality. Nutrients, 15(9), 2098. https://doi.org/10.3390/nu15092098