
Efficacy of Dietary Intervention with Group Activities on Dietary Intakes, Frailty Status, and Working Memory: A Cluster-Randomized Controlled Trial in Community Strongholds

 , ,
, ,  and
and
Abstract
1. Introduction
2. Methods
2.1. Ethics and Trial Registration
2.2. Participants
2.3. Sample Size
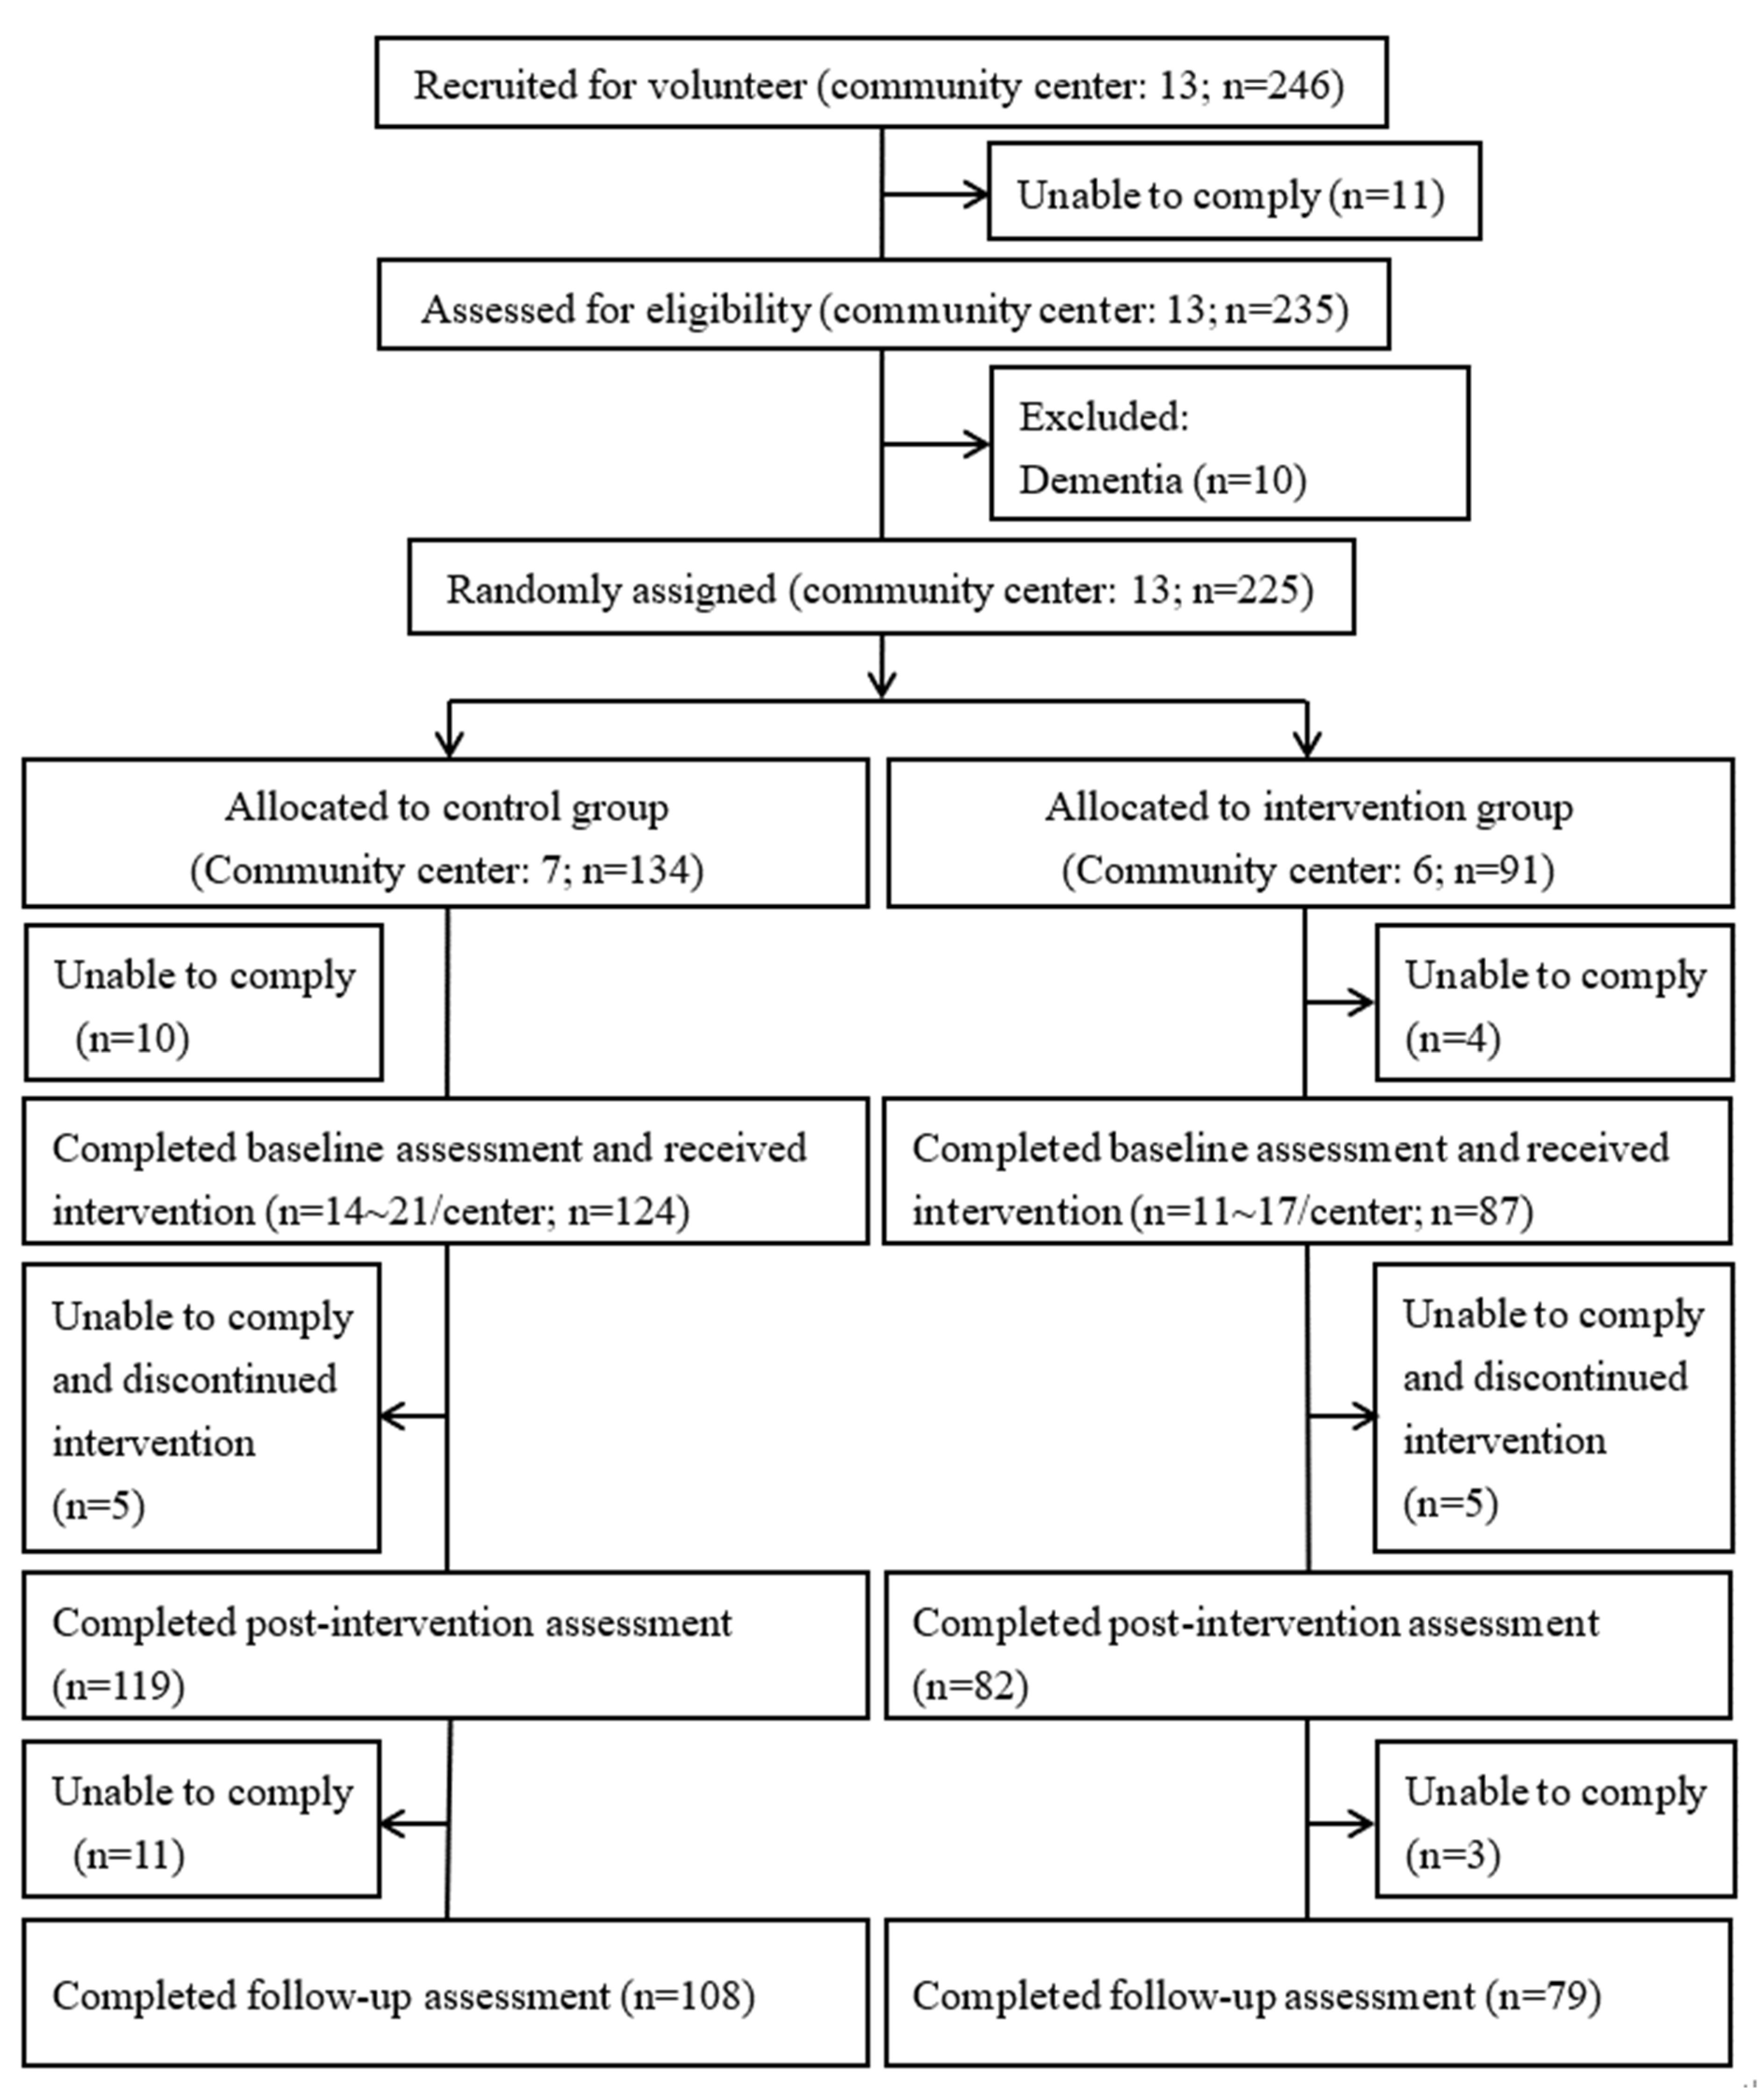
2.4. Study Design
2.5. Dietary Intervention
2.6. Data Collection
2.7. Frailty Assessments
2.8. Working Memory and Depression Assessment
2.9. Dietary Assessment
2.10. Assessment of Stages in Practicing Healthy Dietary Behaviors
2.11. Data Management and Statistical Analysis
3. Results
3.1. Baseline Characteristics
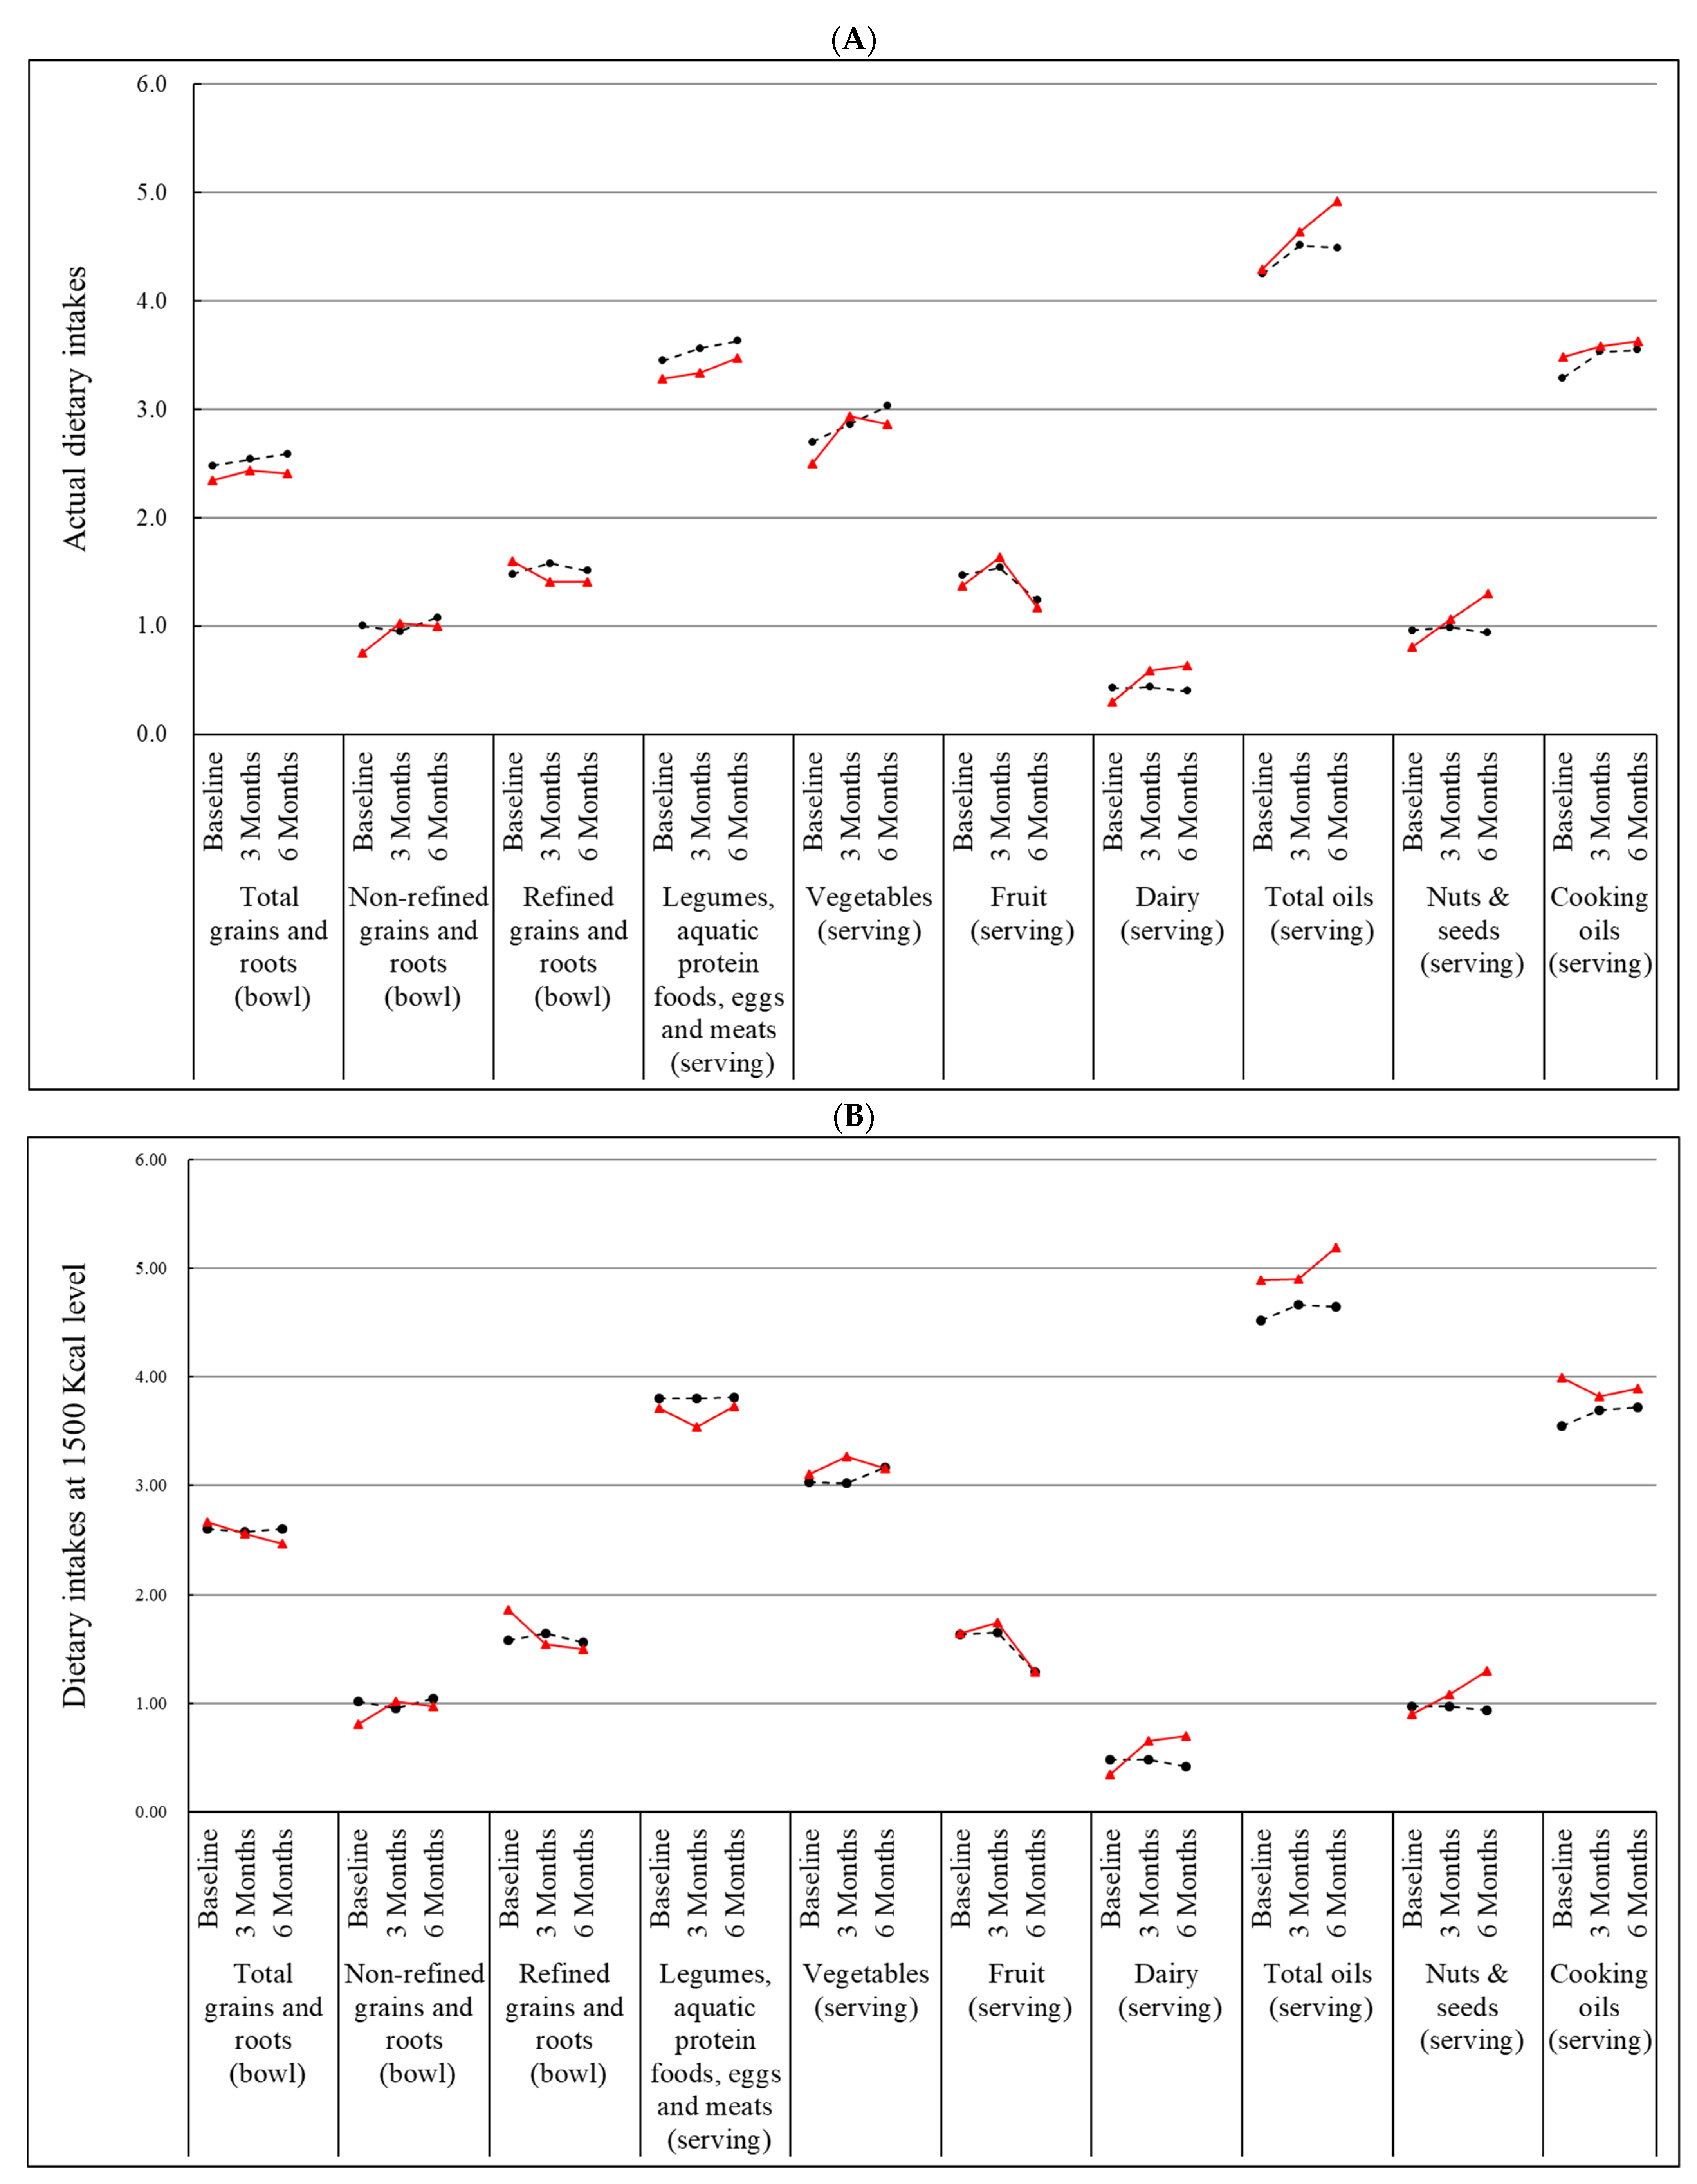
3.2. Effect of Nutrition Education Program on Dietary Intakes
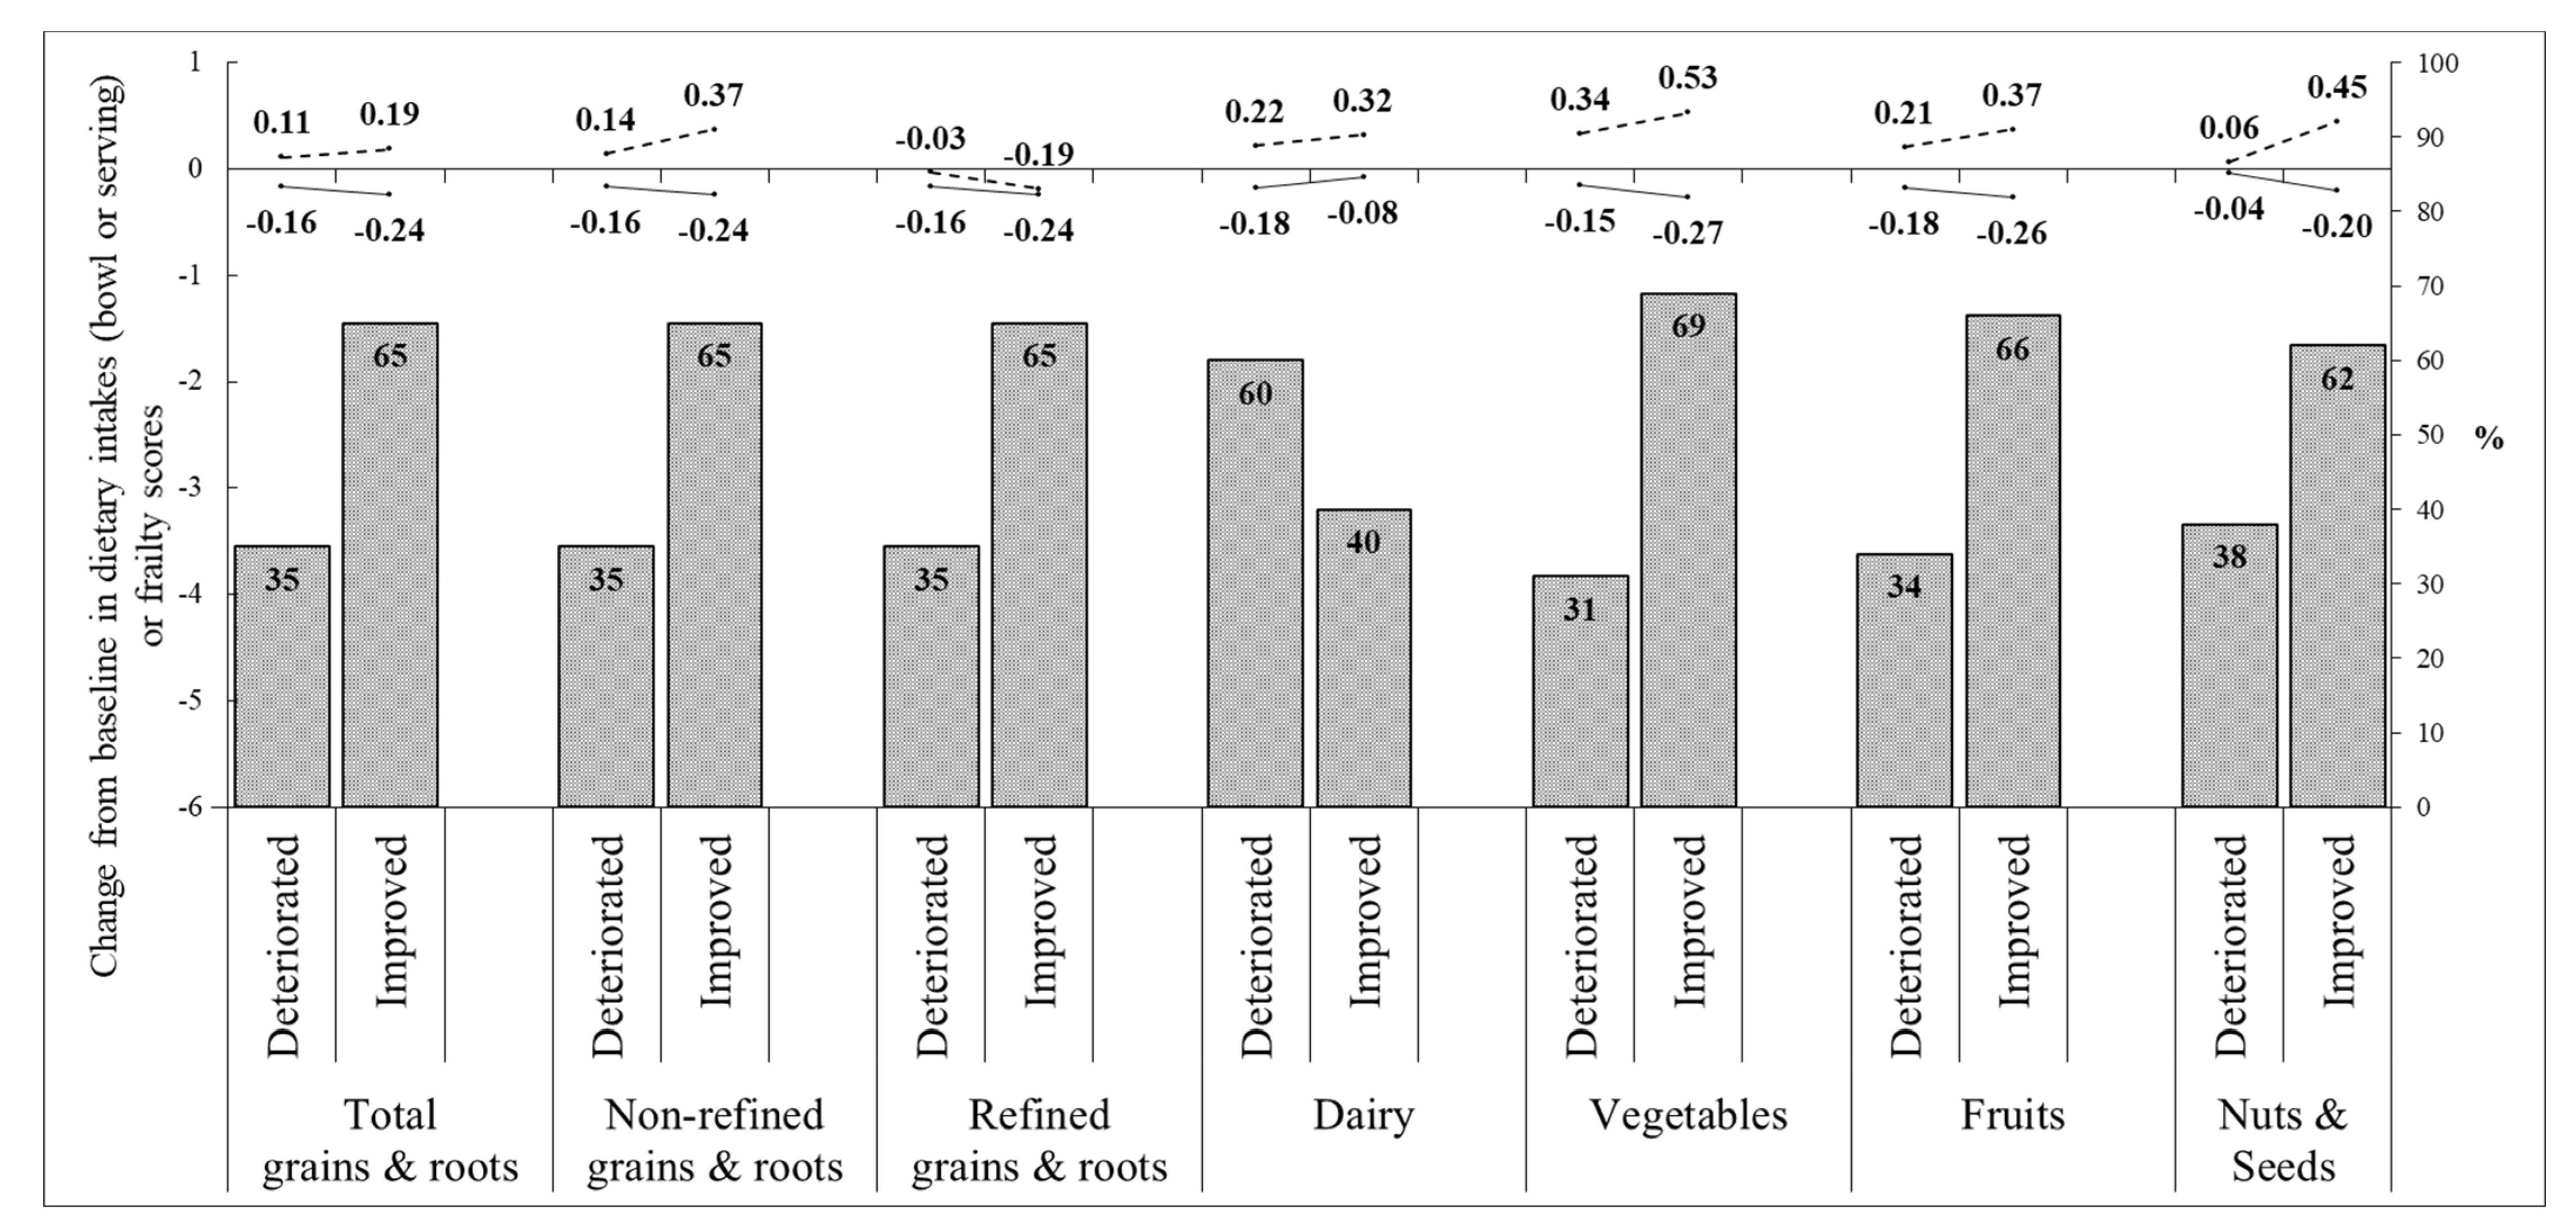
3.3. Effect of Nutrition Education Program on Frailty Status and Frailty Component Score
3.4. Effect of Nutrition Education Activity on GDS-SF and Working Memory
3.5. Effect of Nutrition Education Program on Self-Reported Stages of Healthy Dietary Behaviors
4. Discussion
5. Conclusions
Author Contributions
Funding
Institutional Review Board Statement
Informed Consent Statement
Data Availability Statement
Acknowledgments
Conflicts of Interest
Abbreviations
References
- National Development Council; Propulation Projections for the R.O.C. (Taiwan). Aging Indicators. Available online: https://pop-proj.ndc.gov.tw/chart.aspx?c=10&uid=66&pid=60 (accessed on 10 May 2022).
- Yang, C.C.; Hsueh, J.Y.; Wei, C.Y. Current Status of Long-term Care in Taiwan: Transition of Long-Term Care Plan From 1.0 to 2.0. Int. J. Health Policy Manag. 2020, 9, 363–364. [Google Scholar] [CrossRef] [PubMed]
- Taipei City Community Nutrition Promotion Center. Official Website. Available online: https://community-nutr.tpech.gov.tw/w/CNPC/Index (accessed on 10 May 2022).
- Yannakoulia, M.; Ntanasi, E.; Anastasiou, C.A.; Scarmeas, N. Frailty and Nutrition: From Epidemiological and Clinical Evidence to Potential Mechanisms. Metabolism 2017, 68, 64–76. [Google Scholar] [CrossRef] [PubMed]
- Lorenzo-Lopez, L.; Maseda, A.; de Labra, C.; Regueiro-Folgueira, L.; Rodriguez-Villamil, J.L.; Millan-Calenti, J.C. Nutritional Determinants of Frailty in Older Adults: A Systematic Review. BMC Geriatr. 2017, 17, 108. [Google Scholar] [CrossRef] [PubMed]
- Wu, S.Y.; Yeh, N.H.; Chang, H.Y.; Wang, C.F.; Hung, S.Y.; Wu, S.J.; Pan, W.H. Adequate Protein Intake in Older Adults in the Context of Frailty: Cross-Sectional Results of the Nutrition and Health Survey in Taiwan 2014–2017. Am. J. Clin. Nutr. 2021, 114, 649–660. [Google Scholar] [CrossRef] [PubMed]
- Wu, S.-Y.; Lee, S.-C.; Yeh, N.-H.; Wang, C.-F.; Hung, S.-Y.; Wu, S.-J.; Pan, W.-H. Dietary Characteristics of Elders with Frailty and with Mild Cognitive Impairment: Cross-Sectional Findings and Implications from the Nutrition and Health Survey in Taiwan 2014–2017. Nutrients 2022, 14, 5216. [Google Scholar] [CrossRef]
- Bauer, J.; Biolo, G.; Cederholm, T.; Cesari, M.; Cruz-Jentoft, A.J.; Morley, J.E.; Phillips, S.; Sieber, C.; Stehle, P.; Teta, D.; et al. Evidence-based recommendations for optimal dietary protein intake in older people: A position paper from the PROT-AGE Study Group. J. Am. Med. Dir. Assoc. 2013, 14, 542–559. [Google Scholar] [CrossRef]
- Pan, W.-H.; Wu, S.-Y.; Yeh, N.-H.; Hung, S.-Y. Healthy Taiwanese Eating Approach (TEA) toward Total Wellbeing and Healthy Longevity. Nutrients 2022, 14, 2774. [Google Scholar] [CrossRef]
- Kojima, G.; Avgerinou, C.; Iliffe, S.; Walters, K. Adherence to Mediterranean Diet Reduces Incident Frailty Risk: Systematic Review and Meta-Analysis. J. Am. Geriatr. Soc. 2018, 66, 783–788. [Google Scholar] [CrossRef]
- Solfrizzi, V.; Custodero, C.; Lozupone, M.; Imbimbo, B.P.; Valiani, V.; Agosti, P.; Schilardi, A.; D’Introno, A.; La Montagna, M.; Calvani, M.; et al. Relationships of Dietary Patterns, Foods, and Micro- and Macronutrients with Alzheimer’s Disease and Late-Life Cognitive Disorders: A Systematic Review. J. Alzheimer’s Dis. JAD 2017, 59, 815–849. [Google Scholar] [CrossRef]
- Lo, Y.L.; Hsieh, Y.T.; Hsu, L.L.; Chuang, S.Y.; Chang, H.Y.; Hsu, C.C.; Chen, C.Y.; Pan, W.H. Dietary Pattern Associated with Frailty: Results from Nutrition and Health Survey in Taiwan. J. Am. Geriatr. Soc. 2017, 65, 2009–2015. [Google Scholar] [CrossRef]
- Chuang, S.Y.; Lo, Y.L.; Wu, S.Y.; Wang, P.N.; Pan, W.H. Dietary Patterns and Foods Associated With Cognitive Function in Taiwanese Older Adults: The Cross-sectional and Longitudinal Studies. J. Am. Med. Dir. Assoc. 2019, 20, 544–550.e4. [Google Scholar] [CrossRef] [PubMed]
- Health Promotion Administration, Ministry of Health and Welfare, Taiwan. Daily Food Guide; Health Promotion Administration, Ministry of Health and Welfare: Taipei, Taiwan, 2011; Currently Unavailable.
- Wu, S.Y.; Hsu, L.L.; Hsu, C.C.; Hsieh, T.J.; Su, S.C.; Peng, Y.W.; Guo, T.M.; Kang, Y.W.; Pan, W.H. Dietary education with customised dishware and food supplements can reduce frailty and improve mental well-being in elderly people: A single-blind randomized controlled study. Asia Pac. J. Clin. Nutr. 2018, 27, 1018–1030. [Google Scholar] [CrossRef] [PubMed]
- Hsieh, T.J.; Su, S.C.; Chen, C.W.; Kang, Y.W.; Hu, M.H.; Hsu, L.L.; Wu, S.Y.; Chen, L.; Chang, H.Y.; Chuang, S.Y.; et al. Individualized home-based exercise and nutrition interventions improve frailty in older adults: A randomized controlled trial. Int. J. Behav. Nutr. Phys. Act. 2019, 16, 119. [Google Scholar] [CrossRef] [PubMed]
- Racey, M.; Ali, M.U.; Sherifali, D.; Fitzpatrick-Lewis, D.; Lewis, R.; Jovkovic, M.; Gramlich, L.; Keller, H.; Holroyd-Leduc, J.; Giguère, A.; et al. Effectiveness of nutrition interventions and combined nutrition and physical activity interventions in older adults with frailty or prefrailty: A systematic review and meta-analysis. CMAJ Open 2021, 9, E744–E756. [Google Scholar] [CrossRef]
- Dedeyne, L.; Deschodt, M.; Verschueren, S.; Tournoy, J.; Gielen, E. Effects of multi-domain interventions in (pre)frail elderly on frailty, functional, and cognitive status: A systematic review. Clin. Interv. Aging 2017, 12, 873–896. [Google Scholar] [CrossRef] [PubMed]
- Rutterford, C.; Copas, A.; Eldridge, S. Methods for sample size determination in cluster randomized trials. Int. J. Epidemiol. 2015, 44, 1051–1067. [Google Scholar] [CrossRef]
- Treasure, T.; MacRae, K.D. Minimisation: The platinum standard for trials? Randomisation doesn’t guarantee similarity of groups; minimisation does. BMJ 1998, 317, 362–363. [Google Scholar] [CrossRef]
- Taiwanese Association of Diabetes Educators. The Measuring Dishware. Available online: https://www.tade.org.tw/publications/Item.asp?PI_SID=14 (accessed on 4 May 2022).
- Krathwohl, D.R. A Revision of Bloom’s Taxonomy: An Overview. Theory Into Pract. 2002, 41, 212–218. [Google Scholar] [CrossRef]
- Spahn, J.M.; Reeves, R.S.; Keim, K.S.; Laqautra, I.; Kellogg, M.; Jortberg, B.; Clark, N.A. State of the Evidence Regarding Behavior Change Theories and Strategies in Nutrition Counseling to Facilitate Health and Food Behavior Change. J. Am. Diet. Assoc. 2010, 110, 879–891. [Google Scholar] [CrossRef]
- Simon, H.A. Information-processing theory of human problem solving. Handb. Learn. Cogn. Process. 1978, 5, 271–295. [Google Scholar]
- Wechsler, D. WISC-IV: Administration and Scoring Manual; Harcourt Assessment: San Antonio, TX, USA, 2003. [Google Scholar]
- Mohs, R.C.; Knopman, D.; Petersen, R.C.; Ferris, S.H.; Ernesto, C.; Grundman, M.; Sano, M.; Bieliauskas, L.; Geldmacher, D.; Clark, C.; et al. Development of cognitive instruments for use in clinical trials of antidementia drugs: Additions to the Alzheimer’s Disease Assessment Scale that broaden its scope. The Alzheimer’s Disease Cooperative Study. Alzheimer Dis. Assoc. Disord. 1997, 11 (Suppl. S2), S13–S21. [Google Scholar] [CrossRef] [PubMed]
- Yeh, T.-L.; Liao, I.-C.; Yang, Y.-K.; Ko, H.-C. Geriatric depression scale (Taiwanese and Mandarin translations). Clin. Gerontol. 1995, 15, 1. [Google Scholar]
- Yesavage, J.A.; Sheikh, J.I. 9/Geriatric Depression Scale (GDS). Clin. Gerontol. 2008, 5, 165–173. [Google Scholar] [CrossRef]
- Huang, Y.C.; Lee, M.S.; Pan, W.H.; Wahlqvist, M.L. Validation of a simplified food frequency questionnaire as used in the Nutrition and Health Survey in Taiwan (NAHSIT) for the elderly. Asia Pac. J. Clin. Nutr. 2011, 20, 134–140. [Google Scholar] [PubMed]
- Health Promotion Agency Taiwan. Six Main Food Groups. Available online: https://www.hpa.gov.tw/Pages/List.aspx?nodeid=4086 (accessed on 4 May 2022).
- Willett, W. Implications of Total Energy Intake for Epidemiologic Analyses. In Nutritional Epidemiology, 3rd ed.; Monographs in Epidemiology and Biostatistics; Oxford University Press: Oxford, UK, 2013. [Google Scholar] [CrossRef]
- Chan, D.C.; Tsou, H.H.; Yang, R.S.; Tsauo, J.Y.; Chen, C.Y.; Hsiung, C.A.; Kuo, K.N. A pilot randomized controlled trial to improve geriatric frailty. BMC Geriatr. 2012, 12, 58. [Google Scholar] [CrossRef] [PubMed]
- Kim, H.; Suzuki, T.; Kim, M.; Kojima, N.; Ota, N.; Shimotoyodome, A.; Hase, T.; Hosoi, E.; Yoshida, H. Effects of exercise and milk fat globule membrane (MFGM) supplementation on body composition, physical function, and hematological parameters in community-dwelling frail Japanese women: A randomized double blind, placebo-controlled, follow-up trial. PLoS ONE 2015, 10, e0116256. [Google Scholar] [CrossRef]
- Abizanda, P.; Lopez, M.D.; Garcia, V.P.; Estrella Jde, D.; da Silva Gonzalez, A.; Vilardell, N.B.; Torres, K.A. Effects of an Oral Nutritional Supplementation Plus Physical Exercise Intervention on the Physical Function, Nutritional Status, and Quality of Life in Frail Institutionalized Older Adults: The ACTIVNES Study. J. Am. Med. Dir. Assoc. 2015, 16, 439.e9–439.e16. [Google Scholar] [CrossRef]
- Ng, T.P.; Feng, L.; Nyunt, M.S.; Feng, L.; Niti, M.; Tan, B.Y.; Chan, G.; Khoo, S.A.; Chan, S.M.; Yap, P.; et al. Nutritional, Physical, Cognitive, and Combination Interventions and Frailty Reversal Among Older Adults: A Randomized Controlled Trial. Am. J. Med. 2015, 128, 1225–1236.e1. [Google Scholar] [CrossRef]
- Rydwik, E.; Frandin, K.; Akner, G. Effects of a physical training and nutritional intervention program in frail elderly people regarding habitual physical activity level and activities of daily living—A randomized controlled pilot study. Arch. Gerontol. Geriatr. 2010, 51, 283–289. [Google Scholar] [CrossRef]
- Hernandez Morante, J.J.; Gomez Martinez, C.; Morillas-Ruiz, J.M. Dietary Factors Associated with Frailty in Old Adults: A Review of Nutritional Interventions to Prevent Frailty Development. Nutrients 2019, 11, 102. [Google Scholar] [CrossRef]
- Kwon, J.; Yoshida, Y.; Yoshida, H.; Kim, H.; Suzuki, T.; Lee, Y. Effects of a combined physical training and nutrition intervention on physical performance and health-related quality of life in prefrail older women living in the community: A randomized controlled trial. J. Am. Med. Dir. Assoc. 2015, 16, 263.e1–263.e8. [Google Scholar] [CrossRef] [PubMed]
- Latham, N.K.; Anderson, C.S.; Lee, A.; Bennett, D.A.; Moseley, A.; Cameron, I.D. A randomized, controlled trial of quadriceps resistance exercise and vitamin D in frail older people: The Frailty Interventions Trial in Elderly Subjects (FITNESS). J. Am. Geriatr. Soc. 2003, 51, 291–299. [Google Scholar] [CrossRef] [PubMed]
- Boxer, R.S.; Kenny, A.M.; Schmotzer, B.J.; Vest, M.; Fiutem, J.J.; Pina, I.L. A randomized controlled trial of high dose vitamin D3 in patients with heart failure. JACC. Heart Fail. 2013, 1, 84–90. [Google Scholar] [CrossRef] [PubMed]
- Bauer, J.M.; Verlaan, S.; Bautmans, I.; Brandt, K.; Donini, L.M.; Maggio, M.; McMurdo, M.E.; Mets, T.; Seal, C.; Wijers, S.L.; et al. Effects of a vitamin D and leucine-enriched whey protein nutritional supplement on measures of sarcopenia in older adults, the PROVIDE study: A randomized, double-blind, placebo-controlled trial. J. Am. Med. Dir. Assoc. 2015, 16, 740–747. [Google Scholar] [CrossRef]
- Hutchins-Wiese, H.L.; Kleppinger, A.; Annis, K.; Liva, E.; Lammi-Keefe, C.J.; Durham, H.A.; Kenny, A.M. The Impact of Supplemental N-3 Long Chain Polyunsaturated Fatty Acids and Dietary Antioxidants on Physical Performance in Postmenopausal Women. J. Nutr. Health Aging 2013, 17, 76–80. [Google Scholar] [CrossRef] [PubMed]
- Strike, S.C.; Carlisle, A.; Gibson, E.L.; Dyall, S.C. A High Omega-3 Fatty Acid Multinutrient Supplement Benefits Cognition and Mobility in Older Women: A Randomized, Double-blind, Placebo-controlled Pilot Study. J. Gerontol. Ser. A Biol. Sci. Med. Sci. 2016, 71, 236–242. [Google Scholar] [CrossRef]
- Schilp, J.; Kruizenga, H.M.; Wijnhoven, H.A.; van Binsbergen, J.J.; Visser, M. Effects of a dietetic treatment in older, undernourished, community-dwelling individuals in primary care: A randomized controlled trial. Eur. J. Nutr. 2013, 52, 1939–1948. [Google Scholar] [CrossRef]
- Haider, S.; Dorner, T.E.; Luger, E.; Kapan, A.; Titze, S.; Lackinger, C.; Schindler, K.E. Impact of a Home-Based Physical and Nutritional Intervention Program Conducted by Lay-Volunteers on Handgrip Strength in Prefrail and Frail Older Adults: A Randomized Control Trial. PLoS ONE 2017, 12, e0169613. [Google Scholar] [CrossRef]
- O’Connell, M.L.; Coppinger, T.; McCarthy, A.L. The role of nutrition and physical activity in frailty: A review. Clin. Nutr. ESPEN 2020, 35, 1–11. [Google Scholar] [CrossRef]
- Mohd Suffian, N.I.; Adznam, S.N.; Abu Saad, H.; Chan, Y.M.; Ibrahim, Z.; Omar, N.; Murat, M.F. Frailty Intervention through Nutrition Education and Exercise (FINE). A Health Promotion Intervention to Prevent Frailty and Improve Frailty Status among Pre-Frail Elderly-A Study Protocol of a Cluster Randomized Controlled Trial. Nutrients 2020, 12, 2758. [Google Scholar] [CrossRef]
- Moore, S.E.; McMullan, M.; McEvoy, C.T.; McKinley, M.C.; Woodside, J.V. The effectiveness of peer-supported interventions for encouraging dietary behaviour change in adults: A systematic review. Public Health Nutr. 2019, 22, 624–644. [Google Scholar] [CrossRef] [PubMed]


| Control (n = 124) | Nutrition (n = 84–87) | p Values a | |
|---|---|---|---|
| Age (years) | 73.1 ± 0.60 | 75.23 ± 0.69 | 0.021 |
| Sex (females) | 98 (79.03) | 63 (72.41) | 0.266 |
| Education (>6 years) | 95 (76.61) | 52 (59.77) | 0.009 |
| Weight (Kg) | 57.28 ± 0.82 | 59.38 ± 1.18 | 0.133 |
| Body mass index (kg/m2) | 23.54 ± 0.30 | 24.56 ± 0.42 | 0.044 |
| Self-reported comorbidity | |||
| Hypertension | 64 (51.61) | 43 (49.43) | 0.754 |
| Diabetes mellitus | 25 (20.16) | 24 (27.59) | 0.209 |
| Myocardial infraction | 6 (4.84) | 4 (4.60) | 1.000 |
| Stroke | 5 (4.03) | 4 (4.60) | 1.000 |
| Cancer | 11 (8.87) | 7 (8.05) | 0.833 |
| Geriatric Depression Scale (score) | 1.37 ± 0.21 | 1.24 ± 0.18 | 0.646 |
| Working memory | |||
| Forward Digit Span (digit) | 7.83 ± 0.12 | 6.95 ± 0.17 | <0.0001 |
| Reverse Digit Span (digit) | 4.44 ± 0.13 | 3.94 ± 0.15 | 0.012 |
| Number Cancellation Task (score) | 19.91 ± 0.8 | 16.86 ± 0.92 | 0.014 |
| Frailty score | 0.57 ± 0.07 | 0.66 ± 0.09 | 0.481 |
| Frailty components | |||
| Unintentional weight loss | 12 (9.68) | 10 (11.49) | 0.671 |
| Self-reported exhaustion | 19 (15.32) | 13 (14.94) | 0.940 |
| Weak grip strength | 30 (24.19) | 22 (25.29) | 0.856 |
| Slow gait speed | 3 (2.42) | 5 (5.75) | 0.279 |
| Low level of physical activity | 7 (5.65) | 8 (9.20) | 0.416 |
| Maximum grip strength of dominant hand (Kg) | 21.32 ± 0.58 | 21.18 ± 0.71 | 0.879 |
| 10 m walking time (second) | 9.08 ± 0.22 | 9.27 ± 0.46 | 0.711 |
| Physical activity (Kcal/week) | 2691 ± 149.6 | 2636 ± 241.1 | 0.846 |
| Control (n = 124) | Nutrition (n = 87) | p Values a | |
|---|---|---|---|
| Energy intake (Kcal) | 1405 ± 36 | 1315 ± 38 | 0.092 |
| Protein (% calories) | 14.87 ± 0.21 | 14.4 ± 0.25 | 0.147 |
| Fat (% calories) | 27.49 ± 0.51 | 28.04 ± 0.70 | 0.522 |
| Carbohydrate (% calories) | 57.64 ± 0.55 | 57.57 ± 0.80 | 0.942 |
| Total grains and roots (bowl) | 2.48 ± 0.09 | 2.35 ± 0.10 | 0.369 |
| Non-refined (bowl) | 1.00 ± 0.07 | 0.75 ± 0.08 | 0.024 |
| Refined (bowl) | 1.48 ± 0.08 | 1.60 ± 0.09 | 0.300 |
| Legumes, aquatic protein foods, eggs, and meats (serving) | 3.45 ± 0.12 | 3.28 ± 0.15 | 0.344 |
| Dairy (serving) | 0.43 ± 0.05 | 0.30 ± 0.04 | 0.034 |
| Vegetables (serving) | 2.70 ± 0.14 | 2.50 ± 0.15 | 0.327 |
| Fruits (serving) | 1.47 ± 0.08 | 1.37 ± 0.10 | 0.418 |
| Total oils (serving) | 4.25 ± 0.20 | 4.29 ± 0.22 | 0.904 |
| Nuts and seeds (serving) | 0.96 ± 0.12 | 0.81 ± 0.10 | 0.327 |
| Cooking oils (serving) | 3.29 ± 0.15 | 3.48 ± 0.20 | 0.445 |
| 3 Months | 6 Months | |||||
|---|---|---|---|---|---|---|
| Control (n = 124) | Nutrition (n = 87) | p a | Control (n = 108) | Nutrition (n = 79) | p a | |
| Actual dietary intakes | ||||||
| Total grains and roots (bowl) | 0.06 ± 0.09 | 0.09 ± 0.09 | 0.792 | 0.09 ± 0.08 | 0.06 ± 0.11 | 0.758 |
| Non-refined (bowl) | −0.05 ± 0.07 | 0.28 ± 0.08 | 0.003 | 0.05 ± 0.09 | 0.22 ± 0.11 | 0.190 |
| Refined (bowl) | 0.11 ± 0.07 | −0.19 ± 0.09 | 0.008 | 0.03 ± 0.08 | −0.16 ± 0.10 | 0.087 |
| Legumes, aquatic protein foods, eggs and meats (serving) | 0.10 ± 0.11 | 0.06 ± 0.15 | 0.824 | 0.16 ± 0.13 | 0.21 ± 0.13 | 0.840 |
| Vegetables (serving) | 0.15 ± 0.15 | 0.44 ± 0.17 | 0.214 | 0.27 ± 0.14 | 0.42 ± 0.17 | 0.657 |
| Fruit (serving) | 0.06 ± 0.09 | 0.27 ± 0.10 | 0.132 | −0.22 ± 0.09 | −0.16 ± 0.11 | 0.739 |
| Dairy (serving) | 0 ± 0.04 | 0.29 ± 0.05 | <0.0001 | −0.05 ± 0.04 | 0.33 ± 0.05 | <0.0001 |
| Total oil (serving) | 0.26 ± 0.20 | 0.35 ± 0.21 | 0.766 | 0.22 ± 0.21 | 0.65 ± 0.22 | 0.179 |
| Nuts and seeds (serving) | 0.02 ± 0.08 | 0.25 ± 0.11 | 0.080 | −0.02 ± 0.08 | 0.47 ± 0.16 | 0.002 |
| Cooking oil (serving) | 0.24 ± 0.17 | 0.10 ± 0.18 | 0.583 | 0.24 ± 0.19 | 0.17 ± 0.19 | 0.741 |
| Dietary intakes on the basis of 1500 Kcal | ||||||
| Total wholegrains (bowl) | −0.01 ± 0.05 | −0.11 ± 0.06 | 0.205 | 0.02 ± 0.05 | −0.19 ± 0.06 | 0.008 |
| Non-refined wholegrains (bowl) | −0.07 ± 0.06 | 0.21 ± 0.07 | 0.003 | 0.03 ± 0.07 | 0.13 ± 0.09 | 0.276 |
| Refined wholegrains (bowl) | 0.06 ± 0.06 | −0.32 ± 0.08 | <0.0001 | −0.01 ± 0.07 | −0.33 ± 0.10 | 0.005 |
| Soybean, fish, eggs, and meat (serving) | 0 ± 0.12 | −0.17 ± 0.14 | 0.349 | 0.02 ± 0.12 | 0.04 ± 0.13 | 0.946 |
| Vegetables (serving) | 0 ± 0.16 | 0.17 ± 0.21 | 0.493 | 0.09 ± 0.15 | 0.12 ± 0.21 | 0.949 |
| Fruit (serving) | 0.02 ± 0.09 | 0.10 ± 0.11 | 0.541 | −0.31 ± 0.09 | −0.32 ± 0.12 | 0.950 |
| Dairy (serving) | 0 ± 0.04 | 0.31 ± 0.06 | <0.0001 | −0.07 ± 0.04 | 0.35 ± 0.06 | <0.0001 |
| Total oil (serving) | 0.14 ± 0.18 | 0.01 ± 0.24 | 0.677 | 0.18 ± 0.20 | 0.29 ± 0.26 | 0.617 |
| Nuts and seeds (serving) | 0 ± 0.09 | 0.18 ± 0.11 | 0.191 | −0.02 ± 0.09 | 0.38 ± 0.16 | 0.012 |
| Cooking oil (serving) | 0.14 ± 0.16 | −0.17 ± 0.22 | 0.243 | 0.20 ± 0.18 | −0.09 ± 0.25 | 0.359 |
| 3 Months | 6 Months | |||||
|---|---|---|---|---|---|---|
| Control | Nutrition | p a | Control | Nutrition | p a | |
| Frailty score | −0.03 ± 0.06 | −0.2 ± 0.08 | 0.101 | −0.10 ± 0.07 | −0.08 ± 0.10 | 0.652 |
| Frailty status | −0.01 ± 0.05 | −0.16 ± 0.06 | 0.036 | −0.02 ± 0.05 | −0.06 ± 0.07 | 0.806 |
| Weight (Kg) | 0.08 ± 0.18 | 0.45 ± 0.18 | 0.158 | 0.34 ± 0.2 | 0.43 ± 0.25 | 0.819 |
| Grip strength (Kg) | −0.27 ± 0.19 | 0.29 ± 0.26 | 0.077 | −0.47 ± 0.23 | 0.21 ± 0.26 | 0.056 |
| Walking for 10 m (second) | 0.11 ± 0.13 | −0.18 ± 0.16 | 0.146 | −0.26 ± 0.16 | −0.38 ± 0.17 | 0.564 |
| Physical activity (Kcal/week) | 840.7 ± 144.4 | 722.4 ± 233.4 | 0.649 | 724.5 ± 154.5 | 1106 ± 244.6 | 0.163 |
| 3 Months | 6 Months | |||||
|---|---|---|---|---|---|---|
| Control | Nutrition | p a | Control | Nutrition | p a | |
| Geriatric Depression Scale (score) | 0.22 ± 0.15 | 0.06 ± 0.18 | 0.502 | −0.23 ± 0.18 | 0.03 ± 0.20 | 0.306 |
| Working memory | ||||||
| Forward Digit Span | 0.42 ± 0.09 | 0.85 ± 0.12 | 0.004 | 0.37 ± 0.09 | 0.81 ± 0.14 | 0.007 |
| Reverse Digit Span | 0.53 ± 0.10 | 0.48 ± 0.11 | 0.698 | 0.68 ± 0.11 | 0.55 ± 0.12 | 0.325 |
| Number Cancellation Task | −0.63 ± 0.59 | 0.14 ± 0.80 | 0.460 | −0.69 ± 0.69 | −0.01 ± 0.85 | 0.619 |
Disclaimer/Publisher’s Note: The statements, opinions and data contained in all publications are solely those of the individual author(s) and contributor(s) and not of MDPI and/or the editor(s). MDPI and/or the editor(s) disclaim responsibility for any injury to people or property resulting from any ideas, methods, instructions or products referred to in the content. |
© 2023 by the authors. Licensee MDPI, Basel, Switzerland. This article is an open access article distributed under the terms and conditions of the Creative Commons Attribution (CC BY) license (https://creativecommons.org/licenses/by/4.0/).
Share and Cite
Wu, S.-Y.; Cheng, Y.-Y.; Chang, H.-Y.; Wang, P.-H.; Hsieh, I.-C.; Yeh, N.-H.; Huang, K.-C.; Pan, W.-H. Efficacy of Dietary Intervention with Group Activities on Dietary Intakes, Frailty Status, and Working Memory: A Cluster-Randomized Controlled Trial in Community Strongholds. Nutrients 2023, 15, 1976. https://doi.org/10.3390/nu15081976
Wu S-Y, Cheng Y-Y, Chang H-Y, Wang P-H, Hsieh I-C, Yeh N-H, Huang K-C, Pan W-H. Efficacy of Dietary Intervention with Group Activities on Dietary Intakes, Frailty Status, and Working Memory: A Cluster-Randomized Controlled Trial in Community Strongholds. Nutrients. 2023; 15(8):1976. https://doi.org/10.3390/nu15081976
Chicago/Turabian StyleWu, Szu-Yun, Yu-Yao Cheng, Hsing-Yi Chang, Pei-Hsuan Wang, I-Ching Hsieh, Nai-Hua Yeh, Kuo-Chin Huang, and Wen-Harn Pan. 2023. "Efficacy of Dietary Intervention with Group Activities on Dietary Intakes, Frailty Status, and Working Memory: A Cluster-Randomized Controlled Trial in Community Strongholds" Nutrients 15, no. 8: 1976. https://doi.org/10.3390/nu15081976
APA StyleWu, S.-Y., Cheng, Y.-Y., Chang, H.-Y., Wang, P.-H., Hsieh, I.-C., Yeh, N.-H., Huang, K.-C., & Pan, W.-H. (2023). Efficacy of Dietary Intervention with Group Activities on Dietary Intakes, Frailty Status, and Working Memory: A Cluster-Randomized Controlled Trial in Community Strongholds. Nutrients, 15(8), 1976. https://doi.org/10.3390/nu15081976