Article

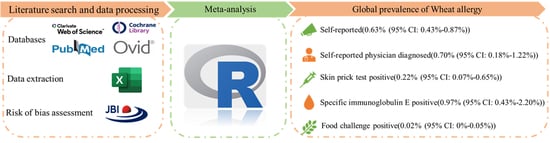
A Meta-Analysis of the Prevalence of Wheat Allergy Worldwide

1
State Key Laboratory of Food Science and Technology, Nanchang University, Nanchang 330047, China
2
School of Food Science and Technology, Nanchang University, Nanchang 330031, China
3
Sino-German Joint Research Institute, Nanchang University, Nanchang 330047, China
4
Jiangxi Province Key Laboratory of Food Allergy, Nanchang University, Nanchang 330047, China
5
School of Pharmaceutical Sciences, Nanchang University, Nanchang 330006, China
*
Author to whom correspondence should be addressed.
Nutrients 2023, 15(7), 1564; https://doi.org/10.3390/nu15071564
Submission received: 16 February 2023 / Revised: 21 March 2023 / Accepted: 22 March 2023 / Published: 23 March 2023
(This article belongs to the Section Nutritional Immunology)

Abstract

:
Wheat allergy is a primary disease of food allergy, and its global prevalence is unclear. This study aimed to characterize the latest worldwide prevalence of wheat allergy based on five different diagnostic methods. Study searches were conducted in Web of Science, PubMed, Ovid LWW, and Cochrane database, with a time limit of 1 January 2007 to 1 September 2022. The review and screening of the articles was undertaken by two independent reviewers. The statistical analysis was conducted by R. A total of 56 articles were finally included. The prevalence of wheat allergy was 0.63% (95% CI: 0.43–0.87%) for self-reported, 0.70% (95% CI: 0.18–1.22%) for self-reported physician-diagnosed, 0.22% (95%CI: 0.07–0.65%) for skin prick test positive, 0.97% (95% CI: 0.43–2.20%) for specific immunoglobulin E positive, and 0.04% (95% CI: 0–0.16%) for food challenge. However, food challenge can be largely subjective, and the results were only based two countries, so the prevalence of wheat allergy confirmed by food challenge may be not entirely trustworthy. In conclusion, investigating the prevalence of wheat allergy in the real world as accurately as possible will contribute to the prevention, management, and risk assessment of wheat allergy.

Graphical Abstract

1. Introduction

Wheat is recognized as a common trigger of immune-mediated food allergy, which has become a public health and food safety issue of global importance, posing a substantial financial and health burden [1,2]. The proteins in wheat that can cause allergic reactions, including those related to gliadin, glutenin, albumin, and globulin. Moreover, omega-5 and gamma gliadin are major allergens in adults with wheat allergy in Thailand [3]. Alpha-amylase/trypsin inhibitor family members exhibit strong IgE reactivity in wheat flour [4], and omega-5 gliadin and high molecular weight gluten are major allergens associated with wheat-dependent exercise-induced anaphylaxis (WDEIA) [5]. Wheat allergy affects people in many countries of the world, seriously damaging people’s health. In Europe, wheat was the most common food trigger of anaphylaxis in adults, and wheat anaphylaxis was more prevalent in central Europe than in southern Europe [6]. In China, a 14-year retrospective study analyzed 907 individuals who were diagnosed with anaphylaxis or severe allergic reaction, showing that wheat allergens were the main trigger of food-induced anaphylaxis in adults and children [7]. Wheat has attracted massive global attention as inducing mild to severe adverse reactions, and it is essential to understand the hazard, especially the prevalence of wheat allergy.
Immunologic reactions to wheat can be divided into IgE-mediated reactions and non-IgE-mediated reactions [8]. Patients with wheat allergy may suffer from an adverse reaction when they are exposed to wheat and its products, such as atopic dermatitis, urticaria and gastrointestinal symptoms, etc. Immediate response is one of the characteristics of IgE-mediated wheat adverse reaction, and the onset of symptoms typically does not exceed 2 h after exposure to wheat and its products [9]. Meanwhile, non-IgE-mediated wheat allergy is dependent on specific immune cell-mediated immune responses, and the main clinical characteristics include eosinophilic esophagitis, eosinophilic gastroenteritis, or eosinophilic colitis.
Patients with wheat allergies can be effectively protected by strict avoidance of wheat allergens in addition to immunotherapy. Moreover, implementing quantitative risk assessment for allergens and mandatory allergen labelling could help patients with wheat allergy avoid exposure to wheat allergens. In 2020, WHO/FAO convened 20 of the world’s leading experts and academics, as well as 10 resource persons, to form an ad hoc joint expert group to review the existing food allergy list based on a risk assessment approach [10]. The prevalence (e.g., the proportion of a defined population known to have experienced an immune-mediated adverse reaction to food), potency (e.g., the amount of the total proteins from the food/ingredient required to cause objective symptoms in a specified proportion), and severity (e.g., frequency or proportion of severe objective reactions to a food/ingredient such as anaphylaxis) of food allergens were the criteria for ad hoc joint WHO/FAO expert consultation to identify priority allergens. Clinically, the diagnosis of wheat allergy was based on the skin prick test (SPT), serological tests (sIgE), and food challenge (FC) combined with clinical history [11]. Importantly, prevalence is a key criterion for allergen risk assessment. Different clinical diagnostic methods would provide different prevalence results. Investigating the point prevalence of different diagnostic methods and insight into the prevalence could benefit the prevention and management of wheat allergy. In fact, the point prevalence of wheat allergy on a global scale is unavailable. Therefore, the aim of this study is to synthesize high-quality prevalence data of wheat allergy based on the literature collection, screening, and data processing to provide a comprehensive analysis of the prevalence of the global population and to analyze the difference among age groups, countries with different economic conditions, and region groups.

2. Materials and Methods

2.1. Protocol and Registration

The protocol of this meta-analysis was registered with the International Prospective Register of Systematic Reviews (PROSPERO; http://www.crd.york.ac.uk/prospero, accessed on 17 May 2022, CRD42022318766).

2.2. Search Strategy

The search strategy mainly referred to Roberto J. Rona [12], with modification. Briefly, the search strategy consists of three groups of terms: (1) “wheat” or “gluten” or “food”; (2) “allergy” or “anaphylaxis” or “hypersensitivity” or “sensitization” or “immunoglobulin E” or “skin prick test” or “challenge” or “provocation”; and (3) “prevalence” or “epidemiology” or “incidence”. The following databases were used: Web of Science, PubMed, Ovid LWW, and Cochrane. For the search results, the following study designs were included: cohort studies, cross-sectional studies, case control studies, and routine health care. Certain types of studies were excluded from this review, including reviews, systematic reviews and meta-analysis, case studies, conference abstracts, case series, and animal studies. All eligible articles must have been published between 1 January 2007 and 1 September 2022. The language of articles was restricted to Chinese and English.

2.3. Definition

In this study, we analyzed the wheat allergy prevalence based on five diagnostic methods. The related definitions are as follows.
Self-reported wheat allergy (SR wheat allergy): self-reported wheat allergy based on questionnaire survey.
Self-reported physician diagnosed wheat allergy (SRPD wheat allergy): self-reported wheat-related adverse reaction diagnosed by physicians.
SPT positive: individuals with reactive SPTs to wheat allergens, and wheal size exceeded 3 mm at least.
Wheat allergy for SPT positive: SPT positive with clinical history.
sIgE positive: positive serology to wheat allergens, and the value of cut off exceeded 0.35 kUA/L at least.
Wheat allergy for sIgE positive: sIgE-positive with clinical history.
Wheat allergy confirmed by FC: positive reaction (objective immediate symptoms or subjective symptoms in some cases) to wheat and its product in any kind of oral food challenge.
The investigated population were stratified by age into children (0–17 years old), adults (≥18 years old), and other (the age range spanned children and adults or undefined age range). The subgroup of developed economies, developing economies, and economies in transition were set up in this study according to the basic economic condition [13]. Additionally, three timespans of 2007–2011 (timespan-1), 2012–2016 (timespan-2), and 2017–2022 (timespan-3) were set up. Moreover, the whole world regions could be divided into six regions, which were the African Region, South-East Asia Region, Eastern Mediterranean Region, Region of the Americas, European Region, and West Pacific Region according to the principles of the World Health Organization (WHO) [14].

2.4. Study Selection and Data Extraction

Two independent reviewers evaluated the titles and abstracts of the retrieved articles and categorized them into included, excluded, and unsure. Moreover, two independent reviewers checked the full texts of the unsure articles above and recategorized. Any discrepancies were resolved by a consensus or arbitrated by a third reviewer. Data extraction of included articles was performed by two independent reviewers, and any inconsistences were checked by a third reviewer. The first author, published year, study design, study period, country, age of patients, and outcome reported of the articles were extracted.

2.5. Risk of Bias Assessment

The risk of bias assessment was conducted by two independent reviewers using the Joanna Briggs Institute (JBI) Critical Appraisal Checklist for Studies Reporting Prevalence Data [15] (Table S1). Any disagreement that arose between the reviewers were resolved through discussion, or with another reviewer. There were nine questions in the checklist, and each question should be answered by “yes”, “no”, or “unclear”. The answer of “yes” was scored “1”, and the answer of “no” or “unclear” was scored 0. The high-quality study was defined as the score of 8–9, the moderate quality study was defined as the score of 5–7, and the low-quality study was defined as the score of 0–4. The low-quality studies were excluded from meta-analysis. Any discrepancies were resolved by consensus or arbitrated by a third reviewer.

2.6. Meta-Analysis of the Prevalence of Wheat Allergy

The meta-analysis was performed by the R program with version of 4.2.0 [16]. Briefly, after loading the “meta” package in R and reading the data by the ‘read.csv’ command, the ‘rate’ was defined as the proportion of the allergic population, which was determined by dividing the number of individuals described as wheat allergy by the total number of people surveyed. The “rate” of each study was categorized based on diagnostic methods and comprised five datasets. The Shapiro-Wilk test was applied to determine whether each dataset followed a normal distribution. If the dataset met the normal distribution, the meta-analysis would be performed directly, if not, the “rate” was transformed by “log”, “logit”, or “arcsin”, and then the meta-analysis was performed. The prevalence of wheat allergy was analyzed based on different diagnostic methods, and the results were presented in a forest plot. For each diagnostic method, a Chi-square (χ2) test was used to analyze whether age, basic economic conditions, and geographical location that would have an effect on prevalence. The heterogeneity of studies was assessed by the I-squared (I2) method. The option of effects model for clinical and methodological studies to assess the point size frequency and 95% confidence interval (95% CI) of wheat allergy depended on the heterogeneity. If the I2 ≤ 50% and p ≥ 0.05, the common effect model was applied, and sensitivity analysis was performed. If the I2 > 50% and p < 0.05, the random effect model was applied, and sensitivity analysis was performed. The publication bias was conducted by Egger’s test, since the data itself or the transformed data fit the normal distribution. The trim-and-fill method was applied in this study.

3. Results

3.1. Study Selection

Figure 1 showed the flowchart for the study screening. Searching through the four databases above, 28,669 articles were collected after removal of duplicates. Subsequently, the titles and abstracts of these articles were reviewed, generating 10,274 articles. Moreover, full text of the remaining articles was reviewed, where the studies about non-wheat allergens, non-Celiac gluten sensitivity, and Celiac disease were excluded. Wheat allergy among individuals with adverse physical conditions and case studies, as well as conference abstracts about wheat allergy, were also excluded. Accordingly, 56 articles were finally included for meta-analysis.

3.2. Study Characteristics

About 56 studies were included in meta-analysis, and 29 studies were conducted in regions of developed economies, and one study was a multicenter study involving regions of developing economic condition and economies in transition, while 25 studies were conducted in regions of developing economies, and one was conducted in the region of economies in transition. Moreover, the statistics based on diagnostic methods among the included studies indicated that 28 studies identified wheat allergy through SR only, one study identified wheat allergy through SRPD only, and six studies investigated both SR and SRPD. Seven studies identified wheat allergy only through SPT, nine studies only through sIgE, and two studies investigated wheat allergy either for SPT positive or sIgE positive. Additionally, three studies identified wheat allergy through FC, and one of them utilized DBPCFC (Table 1). All these studies recruited more than 100,000 individuals in total. Following JBI Critical Appraisal Checklist for Studies Reporting Prevalence Data, 56 of 71 studies were considered as moderate or high quality and were included for final meta-analysis (Table S2).

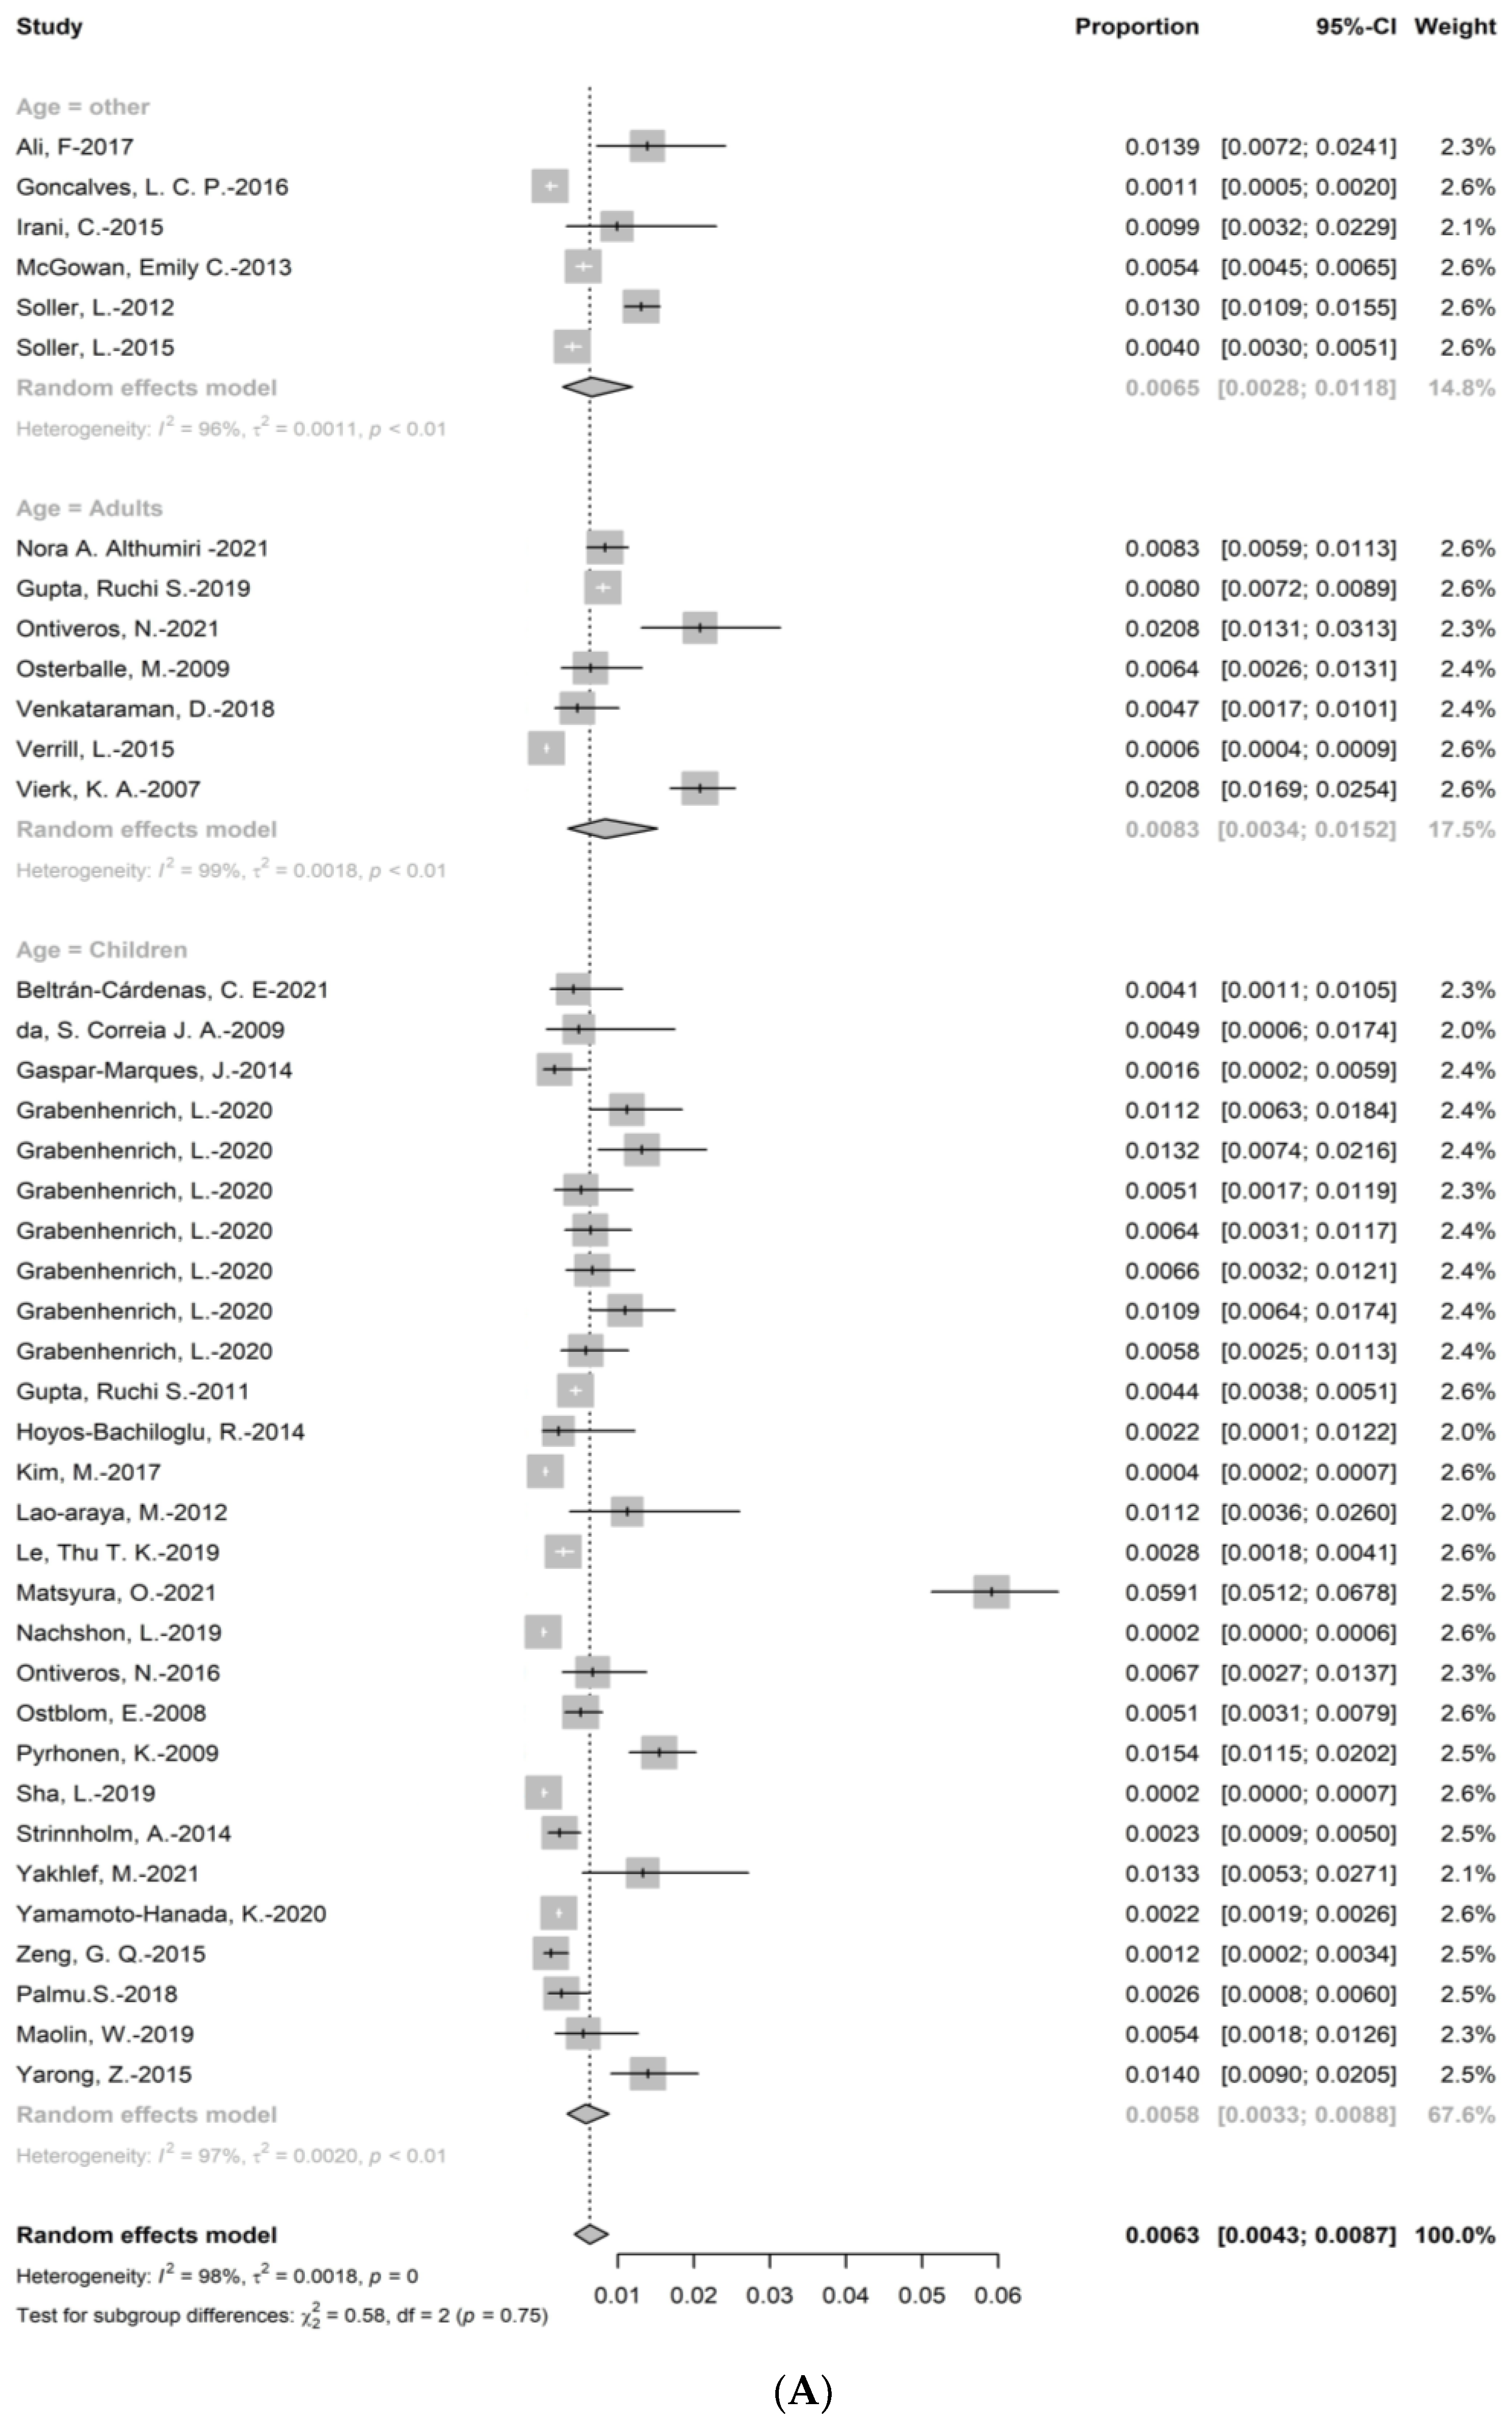
3.3. Prevalence of Wheat Allergy

In this meta-analysis, the methods were divided into self-reported (SR), self-reported physician-diagnosed (SRPD), skin prick test (SPT), specific IgE (sIgE), and food challenge (FC). The pooled prevalence of each diagnostic method was analyzed. The subgroups of region, age, basic economic condition, and timespan were also analyzed, respectively.

3.3.1. SR Wheat Allergy

Among included articles, the investigation of self-reported wheat allergy enrolled approximately 400,000 participants, in which 1676 individuals claimed they suffered from wheat allergy. The point prevalence of SR wheat allergy was 0.63% (95% CI: 0.43–0.87%) (Figure 2). The subgroup analysis showed that the prevalence of wheat allergy in adults (0.83% (95%CI: 0.34–1.52%)) was higher than in children (0.58% (95%CI: 0.33–0.88%), and the prevalence in regions with developed economic condition (0.62% (95%CI: 0.42–0.85%)) was higher than in regions with developing economic conditions (0.46% (95%CI:0.23–0.75%)). As for six regions in the world, the prevalence of wheat allergy in African regions (1.33% (95%CI: 0.53–2.71%)) was the highest, followed by South-East Asia regions (1.12% (95%CI: 0.36–2.60%), European regions (0.84% (95%CI:0.43–1.37%)), regions of Americas (0.61% (95%CI: 0.32–0.98%)), and Eastern Mediterranean regions (0.60% (95%CI: 0.07–1.60%)). Furthermore, the analysis showed that the prevalence of wheat allergy decreased over time (0.88% (95%CI: 0.43–1.48%) in timespan 1 versus 0.66% (95%CI: 0.35–1.08%) in timespan 3). The results of prevalence were stable according to sensitivity analysis, since no single study would influence the overall results in the meta-analysis (Figure S1).

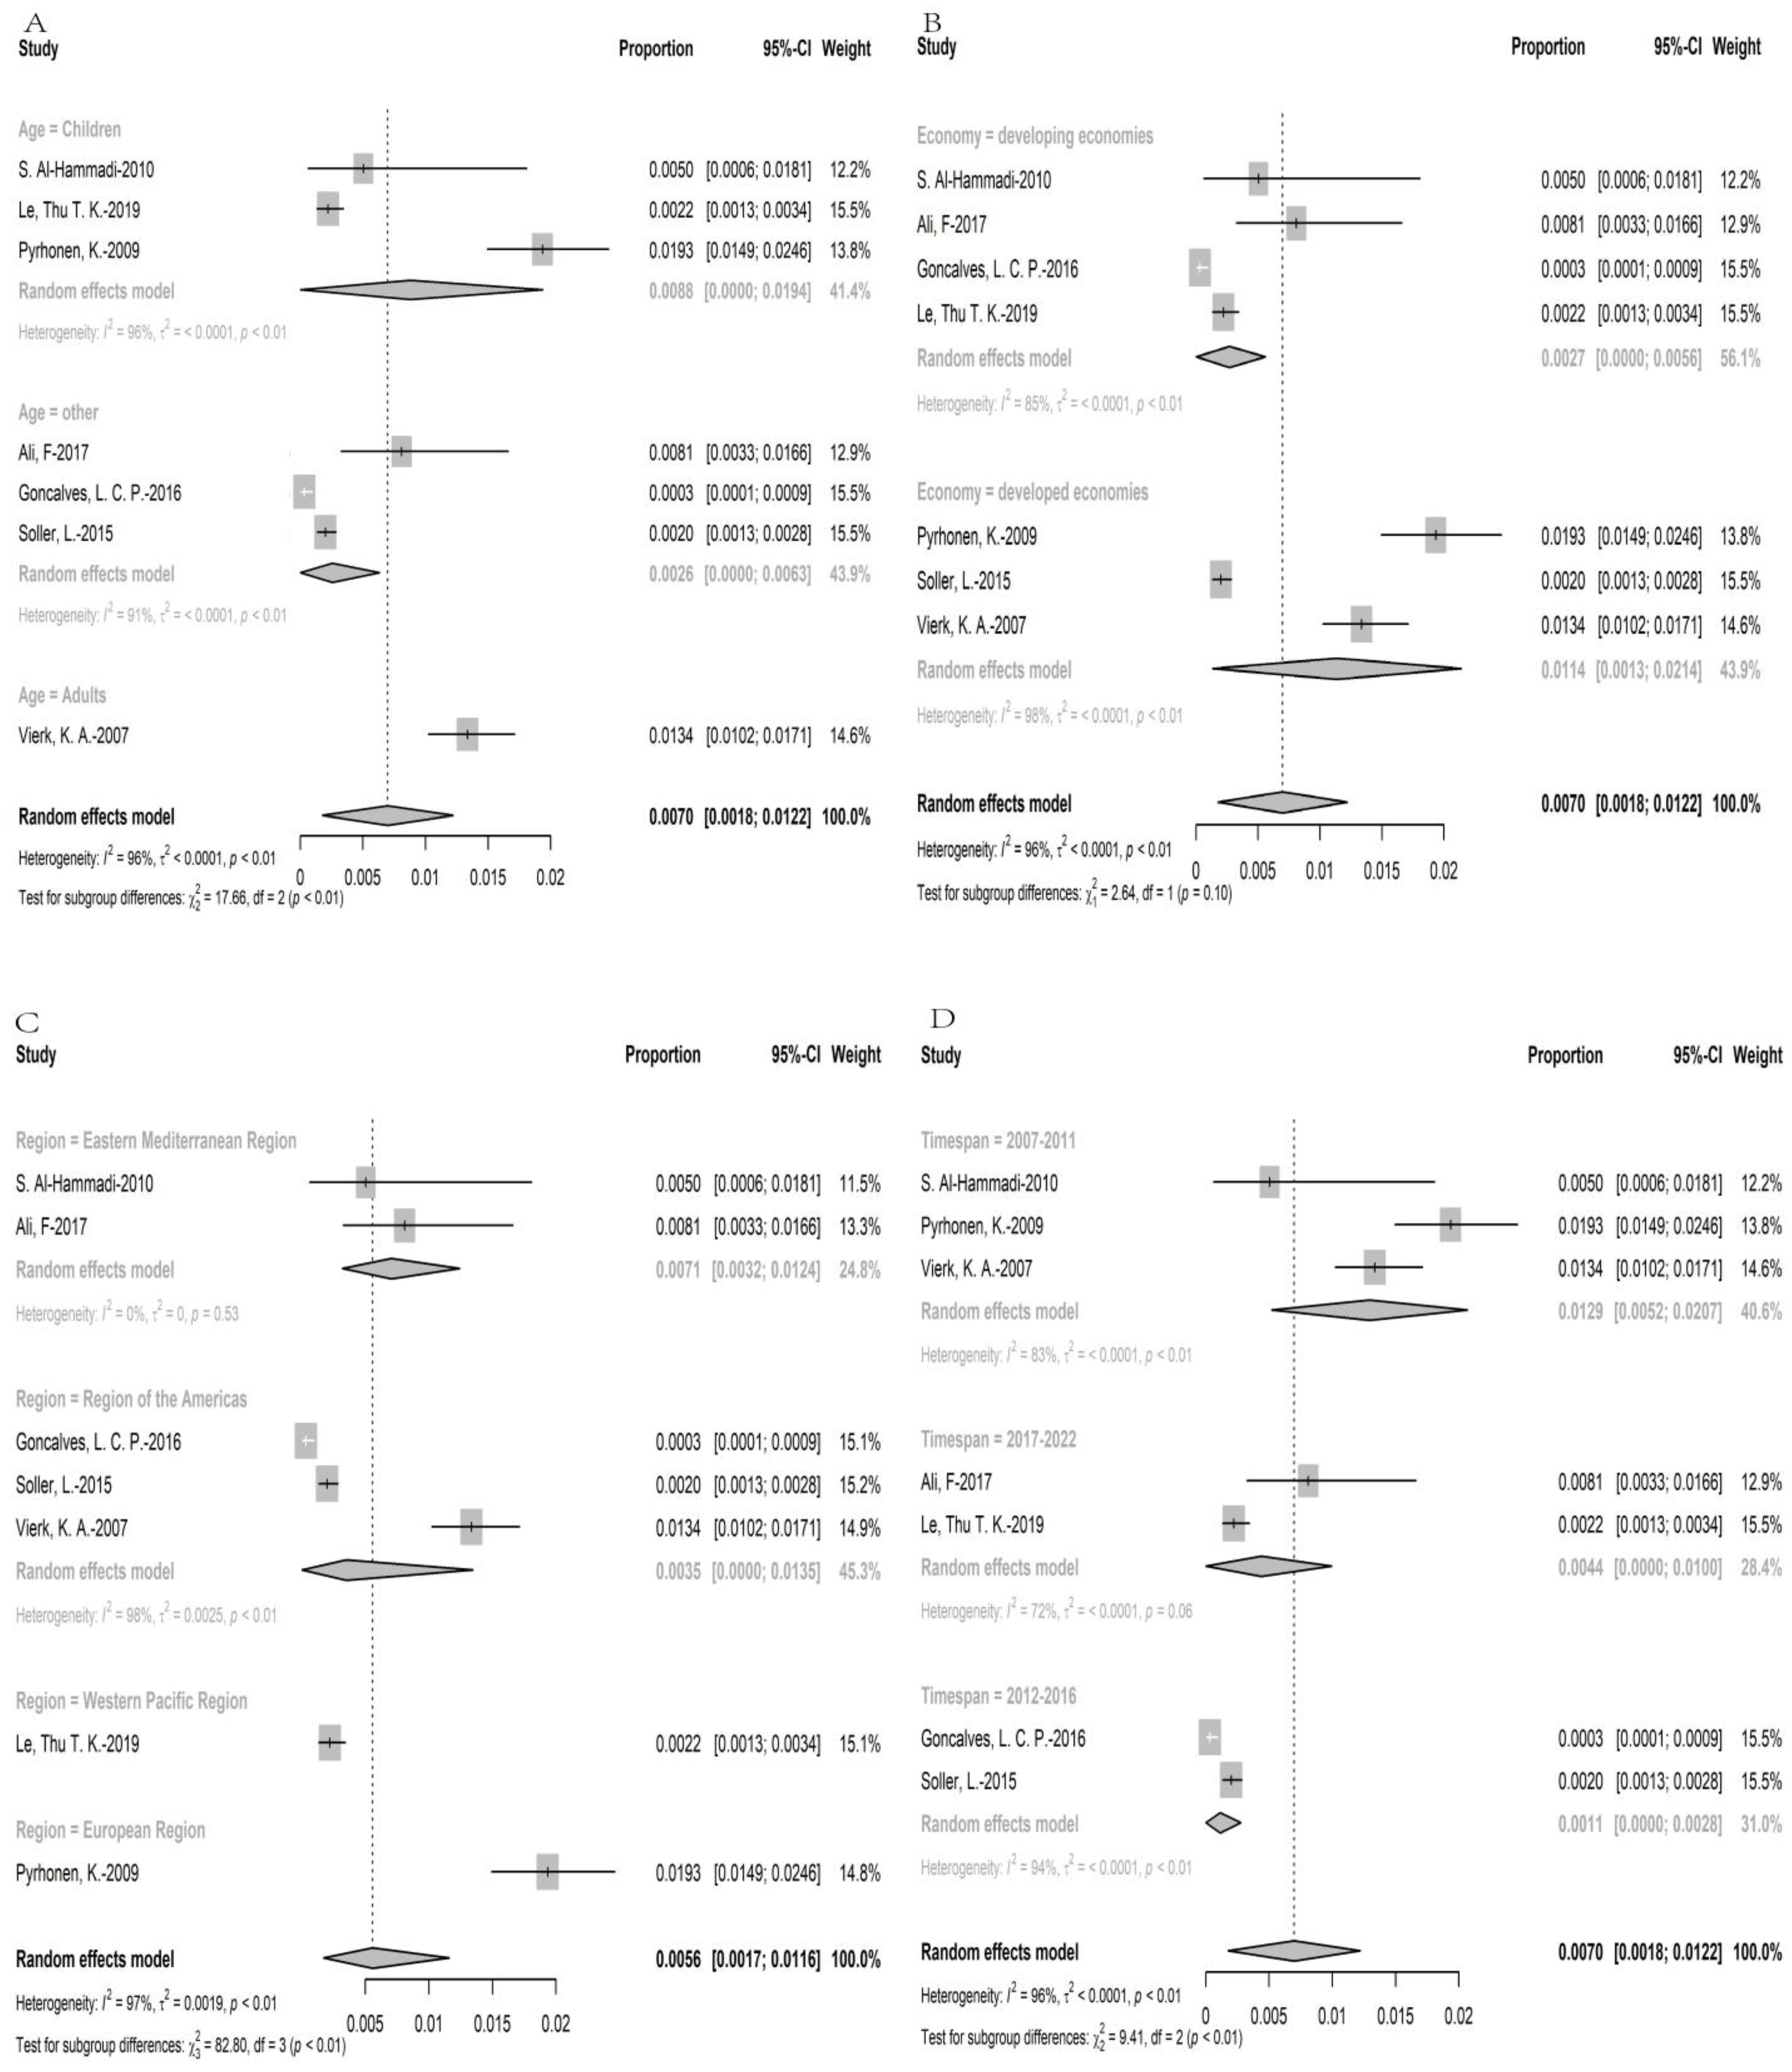
3.3.2. SRPD Wheat Allergy

Among included articles, more than 40,000 participants were investigated through SRPD, in which 186 individuals claimed they suffered from wheat allergy. The point prevalence of SRPD wheat allergy was 0.70% (95% CI: 0.18–1.22%) (Figure 3). The subgroup analysis showed that the prevalence of wheat allergy in adults (1.34% (95%CI: 1.02–1.71%)) was higher than in children (0.88% (95%CI: 0–1.94%), and the prevalence in regions with developed economic condition (1.14% (95%CI: 0.13–2.14%)) was higher than in regions with developing economic condition (0.27% (95%CI:0–0.56%)). As for six regions in the world, the prevalence of wheat allergy in European regions (1.93% (95%CI: 1.49–2.46%)) was the highest, followed by Eastern Mediterranean regions (0.71% (95%CI: 0.32–1.24%)), regions of Americas (0.35% (95%CI: 0–1.35%)), and Western Pacific regions (0.22% (95%CI: 0.13–0.34%)), while South-East Asia regions had no data. Furthermore, the analysis showed that the prevalence of wheat allergy decreased over time (1.29% (95%CI: 0.52–2.07%) in timespan 1 versus 0.44% (95%CI: 0–1.00%) in timespan 3. The results of prevalence were stable according to sensitivity analysis, since no single study would influence the overall results in the meta-analysis (Figure S2).

3.3.3. Wheat Allergy for SPT Positive

A total of 51,656 participants were recruited for clinical examination, and the number of patients with SPT positive was 172. The point prevalence of SPT positive was 0.22% (95% CI: 0.07–0.65%) (Figure 4). On account of all participants being children, the comparison between the prevalence in children and in adults could not be achieved. The prevalence in regions with developed economic condition (0.28% (95%CI: 0–1.00%)) was higher than in regions with developing economic conditions (0.19% (95%CI:0.07–0.49%)). Moreover, the prevalence of wheat allergy in regions of Americas (1.05% (95%CI: 0.57–1.75%)) was the highest, followed by European regions (0.71% (95%CI: 0.32–1.24%)), South-East Asia regions (0.35% (95%CI: 0–1.35%)), African regions (0.22% (95%CI: 0.13–0.34%)), and Western Pacific regions (0.04% (95%CI: 0.02–0.10%)), while Eastern Mediterranean regions had no data. Furthermore, the analysis showed that the prevalence of wheat allergy decreased over time (0.32% (95%CI: 0.14–0.71%) in timespan 1 versus 0.19% (95%CI: 0.05–0.74%) in timespan 3). The results of prevalence were stable according to sensitivity analysis, since no single study would influence the overall results in the meta-analysis. (Figure S3).

3.3.4. Wheat Allergy for sIgE Positive

Approximately 75,000 individuals were recruited for wheat allergens serology test, and the individuals with sIgE-positive were 2546. The point prevalence of wheat allergy for sIgE positive was 0.97% (95% CI: 0.43–2.20%) (Figure 5). The subgroup analysis showed that the prevalence of wheat allergy in children (2.16% (95%CI: 1.16–4.05%)) was higher than in adults (0.16% (95%CI: 0.05–0.57%). The prevalence in regions with developed economic conditions (0.95% (95%CI: 0.35–2.55%)) was higher than in regions with developing economic condition (0.88% (95%CI:0.12–6.40%)). Moreover, the prevalence of wheat allergy in regions of Americas (3.35% (95%CI: 0.63–17.77%)) was the highest, followed by Western Pacific regions (1.93% (95%CI: 0.84–4.43%)), European regions (0.76% (95%CI: 0.28–2.03%)), South-East Asia regions (0.35% (95%CI: 0–1.35%)), while African regions and Eastern Mediterranean regions had no data. Furthermore, the analysis showed that the prevalence of wheat allergy decreased over time (2.67% (95%CI: 0.33–21.74%) in timespan 1 versus 0.85% (95%CI: 0.37–1.96%) in timespan 3. The results of prevalence were stable according to sensitivity analysis, since no single study would influence the overall results in the meta-analysis (Figure S4).

3.3.5. Wheat Allergy Confirmed by FC

More than 11,000 individuals were recruited for the challenge test, and there were three allergic individuals confirmed by FC. The point prevalence of wheat allergy confirmed by FC was 0.02% (95% CI: 0–0.05%) (Figure 6). The quantities of included studies were too small to perform subgroup analysis of age and basic economic condition. The prevalence of wheat allergy was 0.12% (95%CI: 0.63–17.77% in European regions and 0.01% (95%CI: 0–0.06%) in Western Pacific regions, while no data were available for the Americas, Southeast Asia, Africa, and the Eastern Mediterranean regions. Furthermore, the analysis showed that the prevalence of wheat allergy decreased over time (0.12% (95%CI: 0.01–0.35%) in timespan 2 versus 0.01% (95%CI: 0–0.06%) in timespan 3. The results of prevalence were stable according to sensitivity analysis, since no single study would influence the overall results in the meta-analysis (Figure S5).

4. Discussion

This meta-analysis is indeed the first study to estimate the global prevalence of wheat allergy, even though Zuidmeer and colleagues systematically reviewed the world-wide prevalence of plant allergy, but they did not report the result of wheat allergy [73]. In this meta-analysis, we discussed the prevalence of wheat allergy under five diagnostic methods, which are SR, SRPD, SPT, sIgE, and FC. The results showed that the prevalence of wheat allergy for sIgE positive (0.97% (95%CI: 0.43–2.20%)) was the highest, followed by SRPD wheat allergy (0.70% (95% CI: 0.18–1.22%)), SR wheat allergy (0.63% (95% CI: 0.43–0.87%)), SPT positive (0.22% (95% CI: 0.07–0.65%)), and wheat allergy confirmed by FC (0.02% (95% CI: 0–0.05%)). It is notable that, in this manuscript, only three included studies were designated as FC (two in UK and one in Australia), and the FC can be largely subjective, and more prevalence data from other countries are needed to serve for the global analysis. Therefore, the prevalence of wheat allergy confirmed by FC reported in this analysis may be not entirely trustworthy. In general, the results of age subgroup analysis showed that the prevalence of wheat allergy in adults was higher than in children, except for wheat allergy for sIgE positive people (the prevalence in children was higher than in adults). However, no difference (p > 0.05) was found in the age subgroup of SR wheat allergy, while it was found for others. The results of basic economic condition subgroup analysis also indicated that there were more individuals suffering from wheat allergy in regions with developed economic condition than in regions with developing economic condition, but the pattern was reversed for sIgE-positive wheat allergic individuals. Additionally, the significant difference (p < 0.05) was only found in subgroup analysis of SR wheat allergy. When analyzing the prevalence in different geographical regions of the world, the prevalence of SR wheat allergy in African regions was the highest, while SRPD wheat allergy or wheat allergy confirmed by FC in European region was the highest, and wheat allergy for SPT or sIgE positive for regions of Americas was the highest. Moreover, subgroup analysis of timespan revealed that the prevalence of wheat allergy decreased overtime, and only the prevalence of SRPD wheat allergy was decreased significantly (p < 0.05).
In this meta-analysis, all steps of the literature search, screening, and comprehensive analysis followed rigorous criteria to estimate the worldwide prevalence of wheat allergy. An amount of 56 of 71 studies were eligible for inclusion in the meta-analysis after risk-of-bias assessment. Some prevalence studies included selection bias because the population for investigation came from the allergy clinic. In this meta-analysis, the design of included studies has been carefully reviewed, and the research that investigated the prevalence among patients with allergic disease was excluded to minimize the selection bias. Moreover, the language of publications was restricted to English and Chinese, and this kind of selection bias was hard to avoid due to the authors’ language skill. It is worthwhile to note that, in the survey practice, many factors would affect the findings of the prevalence of wheat allergy. As for the prevalence of SR wheat allergy, the knowledge of wheat allergy among individuals would influence the prevalence because they may misunderstand the intolerance or toxicities for allergy. Additionally, in an era when gluten-free diets remain popular, individuals with wheat allergy can avoid wheat and its products intentionally, which could lead to a bias in the prevalence of wheat allergy. However, the cross-contact of gluten during the processing of pre-packaged food could induce an unintended wheat allergy, preventing consumers from realizing the cause of allergic reaction. Thus, the prevalence of SR wheat allergy would be misleading. Wheat allergy for SPT or sIgE positive would also sometimes be affected due to the inaccuracy of self-reported clinical history. Additionally, diagnostic criteria in the included studies were inconsistent when making the diagnosis of wheat allergy, such as the size of the wheal for SPT or the cut-off value of sIgE for blood test, hence the point prevalence of wheat allergy in this study needs to be interpreted with caution. Additionally, the cross-reaction between wheat and grass or other cereals would lead to a SPT or sIgE false positive result for wheat allergy [74]. Moreover, the WHO/FAO ad hoc joint expert group divided the quality of IgE-mediated food allergy prevalence data into three grades [75], and GRADE 1 was the combination of clinical reaction, evidence of sensitization, and food challenge. GRADE 2 was adverse symptoms, together with the evidence of biomarkers, such as sensitization identified by SPT or sIgE; GRADE 3 came from the data about self-reported results alone, as well as only evidence of IgE data to identify food allergy, and patients with allergy were identified by retrospective review of medical records. Therefore, FC is the most convincing method to diagnose wheat allergy. Although DBPCFC is the “Golden Standard” for diagnosing, open FC or single blind FC is also an appropriate method, since there were still many challenges and limitations in DBPCFC practice.
Better awareness of the characteristics would be achieved by subgroup analysis. In general, the results of age subgroup analysis showed that the prevalence of wheat allergy in adults’ subgroup was higher than in children, except for wheat allergy for those that are sIgE positive. However, no difference (p > 0.05) was found in the age subgroup of SR wheat allergy, while others were found. Siripipattanamongkol, N et al. [76]. found that the proportion of wheat-tolerant children increased over time. Christensen, MJ et al. [77]. showed that the vast majority of younger children can develop tolerance, whereas elder children and adults rarely develop tolerance, which would explain the higher prevalence of wheat allergy in adults in this analysis. According to criteria for quality evaluation of prevalence data recommended by ad hoc joint FAO/WHO expert consultation, low quality prevalence data (SR or SRPD) in this meta-analysis indicated a higher prevalence of wheat allergy in adults than in children, and medium quality prevalence data (sIgE or SPT with clinical history) indicated a higher prevalence in children than in adults. Therefore, high quality of prevalence data (FC) is needed to investigate the real situation of wheat allergy. Moreover, the reasons for such a difference deserve further investigation.
The results of subgroup analysis also indicated that there were more individuals suffering from wheat allergy in regions with developed economic condition than in regions with developing economic condition. Additionally, only the prevalence of SR in regions with developed economic condition was significantly higher (p < 0.05) than in regions with developing economic condition. Although the present analysis based on reported data suggested a lower prevalence of wheat allergy in countries with developing economic conditions, fewer studies about countries with developing economic condition were included for analysis than studies about countries with developed economic condition, so the results need to be treated with caution. Lee, KS et al. [78]. found that high socioeconomic status was a risk factor for allergic diseases in Korean adolescents, and people with high socioeconomic status had access to better medical care, which not only increased the diagnosis of allergic diseases, but may also influence the prevalence of allergic diseases due to various immunizations.
When analyzing the prevalence in different geographical regions of the world, the prevalence of SR wheat allergy in African regions was the highest, while SRPD wheat allergy or wheat allergy confirmed by FC in European region was the highest, wheat allergy for SPT or sIgE positive for regions of Americas was the highest, and significant difference (p < 0.05) was only found in subgroup analysis of SRPD wheat allergy and wheat allergy for SPT positive. The low altitude of the European region, its high latitude in the Northern Hemisphere, and the fact that the diet is mostly Mediterranean, where grains would be the main source of daily food, could be potential reasons for the higher prevalence.
Moreover, subgroup analysis of timespan revealed that the prevalence of wheat allergy decreased overtime, but no significant difference (p > 0.05) was found, except for SRPD wheat allergy. Compared to the prevalence of wheat allergy in Europe reported by Nwaru, B.I., et al. [79], the prevalence summarized in this meta-analysis was lower from the perspective of SR, SRPD, SPT, and sIgE. The reason for this difference may be the basic economic condition, geographical location, genetic factor, etc. As is shown in this manuscript, the prevalence of wheat allergy decreased overtime, and this is probably because people are more cautious in recognizing allergies with the popularization of knowledge about allergies in recent years, and the clinical diagnosis became more standard. Moreover, the study design, as well as characteristics of population and diagnostic criteria, may also influence the result of prevalence in different time.

5. Conclusions

The present meta-analysis indicated the prevalence of wheat allergy was about 0.63% for SR, 0.70% for SRPD, 0.22% for SPT positive to wheat allergens, 0.97% for sIgE positive, and 0.04% for FC-confirmed. The age, basic economic condition, or geographical region could be the factors that influence the prevalence of wheat allergy, and they are worthwhile for further investigation. The DBPCFC is the ‘Gold Standard’ for diagnosing food allergy [80]. The included studies in this meta-analysis were rarely used for food challenges to diagnose wheat allergy, and they would lead to the prevalence of wheat allergies in this analysis, deviating from the real world. Future studies about the prevalence of wheat allergy should promote multi-regional or multi-national collaborative research through consistent criteria and diagnostic methods, which can reduce the bias caused by study designs or diagnostic methods. Investigating the prevalence of wheat allergies in the real world as accurately as possible will contribute to the prevention, management, and risk assessment of wheat allergy.

Supplementary Materials

The following supporting information can be downloaded at: https://www.mdpi.com/article/10.3390/nu15071564/s1, Figure S1: Sensitivity analysis of studies for self-reported wheat allergy, Figure S2: Sensitivity analysis of studies for self-reported physician-diagnosed wheat allergy, Figure S3: Sensitivity analysis of studies of wheat allergy for SPT positive to wheat allergens, Figure S4: Sensitivity analysis of studies of wheat allergy for sIgE positive to wheat allergens, Figure S5: Sensitivity analysis of studies for food challenge confirmed wheat allergy, Table S1: Joanna Briggs Institute Critical Appraisal Checklist for Studies Reporting Prevalence Data, Table S2: The results of risk bias assessment (Y: Yes; N: No;).

Author Contributions

Conceived and designed the experiments: H.C. and J.G. Performed the experiments: W.L., Z.W. and J.W. Analyzed the data: W.L., Z.W., J.W. and Y.W. Wrote the paper: W.L. Revised the manuscript: H.C. and J.Y. All authors have read and agreed to the published version of the manuscript.

Funding

This work was funded by National Natural Science Foundation of China [grant numbers 31872887] and State Key Laboratory of Food Science and Technology, Nanchang University Open Fund Project [grant numbers SKLF-KF-202220].

Institutional Review Board Statement

Not applicable.

Informed Consent Statement

Not applicable.

Data Availability Statement

Data is contained within the article or supplementary material.

Acknowledgments

We acknowledge great appreciation for the Joanna Briggs Institute for developing a critical appraisal checklist for studies reporting prevalence data and granting that we can use this checklist.

Conflicts of Interest

The authors declare that the research was conducted in the absence of any commercial or financial relationships that could be construed as potential conflict of interest.

References

  1. Warren, C.M.; Jiang, J.; Gupta, R.S. Epidemiology and Burden of Food Allergy. Curr. Allergy Asthma Rep. 2020, 20, 6. [Google Scholar] [CrossRef]
  2. Cianferoni, A. Wheat allergy: Diagnosis and management. J. Asthma Allergy 2016, 13, 13–25. [Google Scholar] [CrossRef] [Green Version]
  3. Piboonpocanun, S.; Thongngarm, T.; Wongsa, C.; Pacharn, P.; Reamtong, O.; Sompornrattanaphan, M. Omega-5 and Gamma Gliadin are the Major Allergens in Adult-Onset IgE-Mediated Wheat Allergy: Results from Thai Cohort with Oral Food Challenge. J. Asthma Allergy 2021, 14, 907–917. [Google Scholar] [CrossRef] [PubMed]
  4. Lu, Y.; Ji, H.; Chen, Y.; Li, Z.; Timira, V. A systematic review on the recent advances of wheat allergen detection by mass spectrometry: Future prospects. Crit. Rev. Food Sci. Nutr. 2022, 1–17. [Google Scholar] [CrossRef] [PubMed]
  5. Morita, E.; Matsuo, H.; Kohno, K.; Yokooji, T.; Yano, H.; Endo, T. A Narrative Mini Review on Current Status of Hypoallergenic Wheat Development for IgE-Mediated Wheat Allergy, Wheat-Dependent Exercise-Induced Anaphylaxis. Foods 2023, 12, 954. [Google Scholar] [CrossRef] [PubMed]
  6. Kraft, M.; Doelle-Bierke, S.; Renaudin, J.-M.; Rueff, F.; Scherer Hofmeier, K.; Treudler, R.; Pfoehler, C.; Hawranek, T.; Poziomkowska-Gesicka, I.; Jappe, U.; et al. Wheat Anaphylaxis in Adults Differs from Reactions to Other Types of Food. J. Allergy Clin. Immunol.-Pract. 2021, 9, 2844–2852. [Google Scholar] [CrossRef]
  7. Jiang, N.; Yin, J.; Wen, L.; Li, H. Characteristics of Anaphylaxis in 907 Chinese Patients Referred to a Tertiary Allergy Center: A Retrospective Study of 1,952 Episodes. Allergy Asthma Immunol. Res. 2016, 8, 353–361. [Google Scholar] [CrossRef] [Green Version]
  8. Ricci, G.; Andreozzi, L.; Cipriani, F.; Giannetti, A.; Gallucci, M.; Caffarelli, C. Wheat Allergy in Children: A Comprehensive Update. Medicina 2019, 55, 400. [Google Scholar] [CrossRef] [Green Version]
  9. Anvari, S.; Miller, J.; Yeh, C.-Y.; Davis, C.M. IgE-Mediated Food Allergy. Clin. Rev. Allergy Immunol. 2019, 57, 244–260. [Google Scholar] [CrossRef] [Green Version]
  10. FAO/WHO. Review and Validation of CODEX Priority Allergen List through Risk Assessment; Food & Agriculture Org.: Rome, Italy, 2020. [Google Scholar]
  11. Cabanillas, B. Gluten-related disorders: Celiac disease, wheat allergy, and nonceliac gluten sensitivity. Crit. Rev. Food Sci. Nutr. 2020, 60, 2606–2621. [Google Scholar] [CrossRef]
  12. Rona, R.J.; Keil, T.; Summers, C.; Gislason, D.; Zuidmeer, L.; Sodergren, E.; Sigurdardottir, S.T.; Lindner, T.; Goldhahn, K.; Dahlstrom, J.; et al. The prevalence of food allergy: A meta-analysis. J. Allergy Clin. Immunol. 2007, 120, 638–646. [Google Scholar] [CrossRef]
  13. Country Classification. Available online: https://www.un.org/en/development/desa/policy/wesp/wesp_current/2014wesp_country_classification.pdf (accessed on 6 February 2023).
  14. WHO Regional Offices. Available online: https://www.who.int/about/who-we-are/regional-offices (accessed on 27 January 2023).
  15. Munn, Z.; Moola, S.; Lisy, K.; Riitano, D.; Tufanaru, C. Methodological guidance for systematic reviews of observational epidemiological studies reporting prevalence and cumulative incidence data. JBI Evid. Implement. 2015, 13, 147–153. [Google Scholar] [CrossRef] [PubMed]
  16. Team, R.C. R: A Language and Environment for Statistical Computing; R Foundation for Statistical Computing: Vienna, Austria, 2022. [Google Scholar]
  17. Al-Hammadi, S.; Al-Maskari, F.; Bernsen, R. Prevalence of Food Allergy among Children in Al-Ain City, United Arab Emirates. Int. Arch. Allergy Immunol. 2010, 151, 336–342. [Google Scholar] [CrossRef] [PubMed]
  18. Ali, F. A Survey of Self-Reported Food Allergy and Food-Related Anaphylaxis among Young Adult Students at Kuwait University, Kuwait. Med. Princ. Pract. 2017, 26, 229–234. [Google Scholar] [CrossRef] [PubMed]
  19. Althumiri, N.A.; Basyouni, M.H.; AlMousa, N.; AlJuwaysim, M.F.; BinDhim, N.F.; Alqahtani, S.A. Prevalence of Self-Reported Food Allergies and Their Association with Other Health Conditions among Adults in Saudi Arabia. Int. J. Environ. Res. Public Health 2021, 18, 347. [Google Scholar] [CrossRef] [PubMed]
  20. Basera, W.; Botha, M.; Gray, C.L.; Lunjani, N.; Watkins, A.S.; Venter, C.; Allen, K.J.; Hlela, C.; Zar, H.J.; Levin, M.E. The South African Food Sensitisation and Food Allergy population-based study of IgE-mediated food allergy: Validity, safety, and acceptability. Ann. Allergy Asthma. Immunol. 2015, 115, 113–119. [Google Scholar] [CrossRef]
  21. Beltrán-Cárdenas, C.E.; Granda-Restrepo, D.M.; Franco-Aguilar, A.; Lopez-Teros, V.; Arvizu-Flores, A.A.; Cárdenas-Torres, F.I.; Ontiveros, N.; Cabrera-Chávez, F.; Arámburo-Gálvez, J.G. Prevalence of Food-Hypersensitivity and Food-Dependent Anaphylaxis in Colombian Schoolchildren by Parent-Report. Medicina 2021, 57, 146. [Google Scholar] [CrossRef] [PubMed]
  22. Botha, M.; Basera, W.; Facey-Thomas, H.E.; Gaunt, B.; Gray, C.L.; Ramjith, J.; Watkins, A.; Levin, M.E. Rural and urban food allergy prevalence from the South African Food Allergy (SAFFA) study. J. Allergy Clin. Immunol. 2019, 143, 662–668.e2. [Google Scholar] [CrossRef] [PubMed]
  23. Da, S.C.J.A.; Antunes, A.A.; Taborda-Barata, L.; Boechat, J.L.; Sarinho, E.S.C. Prevalence of reported food allergies in Brazilian preschoolers living in a small Brazilian city. Allergy Asthma. Clin. Immunol. 2022, 18, 74. [Google Scholar]
  24. Dean, T.; Venter, C.; Pereira, B.; Arshad, S.H.; Grundy, J.; Clayton, C.B.; Higgins, B. Patterns of sensitization to food and aeroallergens in the first 3 years of life. J. Allergy Clin. Immunol. 2007, 120, 1166–1171. [Google Scholar] [CrossRef]
  25. Dogruel, D.; Bingol, G.; Altintas, D.U.; Yilmaz, M.; Kendirli, S.G. Clinical Features of Food Allergy during the 1st Year of Life: The ADAPAR Birth Cohort Study. Int. Arch. Allergy Immunol. 2016, 169, 171–180. [Google Scholar] [CrossRef]
  26. Gaspar-Marques, J.; Carreiro-Martins, P.; Papoila, A.L.; Caires, I.; Pedro, C.; Araújo-Martins, J.; Virella, D.; Rosado-Pinto, J.; Leiria-Pinto, P.; Neuparth, N. Food allergy and anaphylaxis in infants and preschool-age children. Clin. Pediatr. 2014, 53, 652–657. [Google Scholar] [CrossRef] [PubMed]
  27. Goncalves, L.C.P.; Guimaraes, T.C.P.; Silva, R.M.; Cheik, M.F.A.; Napolis, A.C.D.R.; Silva, G.B.E.; Segundo, G.R.S. Prevalence of food allergy in infants and pre-schoolers in Brazil. Allergol. Et. Immunopathol. 2016, 44, 497–503. [Google Scholar] [CrossRef] [PubMed]
  28. Grabenhenrich, L.; Trendelenburg, V.; Bellach, J.; Yürek, S.; Reich, A.; Fiandor, A.; Rivero, D.; Sigurdardottir, S.; Clausen, M.; Papadopoulos, N.G.; et al. Frequency of food allergy in school-aged children in eight European countries-The EuroPrevall-iFAAM birth cohort. Allergy 2020, 75, 2294–2308. [Google Scholar] [CrossRef] [PubMed]
  29. Grimshaw, K.E.; Bryant, T.; Oliver, E.M.; Martin, J.; Maskell, J.; Kemp, T.; Clare Mills, E.N.; Foote, K.D.; Margetts, B.M.; Beyer, K.; et al. Incidence and risk factors for food hypersensitivity in UK infants: Results from a birth cohort study. Clin. Transl. Allergy 2015, 6, 1. [Google Scholar] [CrossRef] [PubMed] [Green Version]
  30. Gupta, R.S.; Springston, E.E.; Warrier, M.R.; Smith, B.; Kumar, R.; Pongracic, J.; Holl, J.L. The Prevalence, Severity, and Distribution of Childhood Food Allergy in the United States. Pediatrics 2011, 128, E9–E17. [Google Scholar] [CrossRef] [Green Version]
  31. Gupta, R.S.; Warren, C.M.; Smith, B.M.; Jiang, J.; Blumenstock, J.A.; Davis, M.M.; Schleimer, R.P.; Nadeau, K.C. Prevalence and Severity of Food Allergies Among US Adults. JAMA Netw. Open 2019, 2, e185630. [Google Scholar] [CrossRef] [Green Version]
  32. Hoyos-Bachiloglu, R.; Ivanovic-Zuvic, D.; Álvarez, J.; Linn, K.; Thöne, N.; de los Ángeles Paul, M.; Borzutzky, A. Prevalence of parent-reported immediate hypersensitivity food allergy in Chilean school-aged children. Allergol Immunopathol. 2014, 42, 527–532. [Google Scholar] [CrossRef]
  33. Hu, Y.; Chen, J.; Li, H. Comparison of food allergy prevalence among Chinese infants in Chongqing, 2009 versus 1999. Pediatr. Int. 2010, 52, 820–824. [Google Scholar] [CrossRef]
  34. Irani, C.; Maalouly, G. Prevalence of Self-Reported Food Allergy in Lebanon: A Middle-Eastern Taste. Int. Sch. Res. Not. 2015, 2015, 639796. [Google Scholar] [CrossRef]
  35. Kim, M.; Lee, J.Y.; Jeon, H.Y.; Yang, H.K.; Lee, K.J.; Han, Y.; Kim, Y.H.; Kim, J.; Ahn, K. Prevalence of Immediate-Type Food Allergy in Korean Schoolchildren in 2015: A Nationwide, Population-based Study. Allergy Asthma. Immunol. Res. 2017, 9, 410–416. [Google Scholar] [CrossRef] [PubMed] [Green Version]
  36. Lao-araya, M.; Trakultivakorn, M. Prevalence of food allergy among preschool children in northern Thailand. Pediatr. Int. 2012, 54, 238–243. [Google Scholar] [CrossRef] [PubMed]
  37. Le, T.T.K.; Nguyen, D.H.; Vu, A.T.L.; Ruethers, T.; Taki, A.C.; Lopata, A.L. A cross-sectional, population-based study on the prevalence of food allergies among children in two different socio-economic regions of Vietnam. Pediatr. Allergy Immunol. 2019, 30, 348–355. [Google Scholar] [CrossRef] [PubMed]
  38. Li, J.; Ogorodova, L.M.; Mahesh, P.A.; Wang, M.H.; Fedorova, O.S.; Leung, T.F.; Fernandez-Rivas, M.; Mills, E.N.C.; Potts, J.; Kummeling, I.; et al. Comparative Study of Food Allergies in Children from China, India, and Russia: The EuroPrevall-INCO Surveys. J. Allergy Clin. Immunol. Pract. 2020, 8, 1349–1358. [Google Scholar] [CrossRef]
  39. Lyons, S.A.; Burney, P.G.J.; Ballmer-Weber, B.K.; Fernandez-Rivas, M.; Barreales, L.; Clausen, M.; Dubakiene, R.; Fernandez-Perez, C.; Fritsche, P.; Jedrzejczak-Czechowicz, M.; et al. Food Allergy in Adults: Substantial Variation in Prevalence and Causative Foods Across Europe. J. Allergy Clin. Immunol. Pract. 2019, 7, 1920–1928.e11. [Google Scholar] [CrossRef]
  40. Mahesh, P.A.; Wong, G.W.; Ogorodova, L.; Potts, J.; Leung, T.F.; Fedorova, O.; Holla, A.D.; Fernandez-Rivas, M.; Clare Mills, E.N.; Kummeling, I.; et al. Prevalence of food sensitization and probable food allergy among adults in India: The EuroPrevall INCO study. Allergy 2016, 71, 1010–1019. [Google Scholar] [CrossRef]
  41. Matsyura, O.; Besh, L.; Borysiuk, O.; Gutor, T.; Malska, A.; Kovalska, O.; Besh, O.; Sorokopud, O.; Vari, S.G. Food Hypersensitivity in Children Aged 0-3 Years of the Lviv Region in Ukraine: A Cross-Sectional Study. Front Pediatr. 2021, 9, 800331. [Google Scholar] [CrossRef]
  42. McGowan, E.C.; Keet, C.A. Prevalence of self-reported food allergy in the National Health and Nutrition Examination Survey (NHANES) 2007–2010. J. Allergy Clin. Immunol. 2013, 132, 1216–1219. [Google Scholar] [CrossRef] [Green Version]
  43. Morillo-Argudo, D.A.; Andrade Tenesaca, D.S.; Rodas-Espinoza, C.R.; Perkin, M.R.; Gebreegziabher, T.L.; Zuniga, G.A.; Andrade Munoz, D.D.; Ramirez, P.L.; Garcia Garcia, A.A.; Ochoa-Aviles, A.M. Food allergy, airborne allergies, and allergic sensitisation among adolescents living in two disparate socioeconomic regions in Ecuador: A cross-sectional study. World Allergy Organ. J. 2020, 13, 100478. [Google Scholar] [CrossRef]
  44. Nachshon, L.; Schwartz, N.; Elizur, A.; Schon, Y.; Cheryomukhin, M.; Katz, Y.; Goldberg, M.R. The Prevalence of Food Allergy in Young Israeli Adults. J. Allergy Clin. Immunol. Pract. 2019, 7, 2782–2789. [Google Scholar] [CrossRef]
  45. Okada, Y.; Yamashita, T.; Kumagai, H.; Morikawa, Y.; Akasawa, A. Accurate Determination of Childhood Food Allergy Prevalence and Correction of Unnecessary Avoidance. Allergy Asthma Immunol. Res. 2017, 9, 322–328. [Google Scholar] [CrossRef] [PubMed] [Green Version]
  46. Ontiveros, N.; Emilio Real-Delor, R.; Antonio Mora-Melgem, J.; Eduardo Beltran-Cardenas, C.; Gerardo Figueroa-Salcido, O.; de Jesus Vergara-Jimenez, M.; Isidro Cardenas-Torres, F.; Karem Flores-Mendoza, L.; Gilberto Aramburo-Galvez, J.; Cabrera-Chavez, F. Prevalence of Wheat/Gluten-Related Disorders and Gluten-Free Diet in Paraguay: An Online Survey-Based Study. Nutrients 2021, 13, 396. [Google Scholar] [CrossRef] [PubMed]
  47. Ontiveros, N.; Valdez-Meza, E.E.; Vergara-Jimenez, M.J.; Canizalez-Roman, A.; Borzutzky, A.; Cabrera-Chavez, F. Parent-reported prevalence of food allergy in Mexican schoolchildren: A population-based study. Allergol. Et. Immunopathol. 2016, 44, 563–570. [Google Scholar] [CrossRef] [PubMed]
  48. Ostblom, E.; Lilja, G.; Ahlstedt, S.; van Hage, M.; Wickman, M. Patterns of quantitative food-specific IgE-antibodies and reported food hypersensitivity in 4-year-old children. Allergy 2008, 63, 418–424. [Google Scholar] [CrossRef]
  49. Ostblom, E.; Wickman, M.; van Hage, M.; Lilja, G. Reported symptoms of food hypersensitivity and sensitization to common foods in 4-year-old children. Acta. Paediatr. 2008, 97, 85–90. [Google Scholar] [CrossRef]
  50. Osterballe, M.; Mortz, C.G.; Hansen, T.K.; Andersen, K.E.; Bindslev-Jensen, C. The Prevalence of food hypersensitivity in young adults. Pediatr. Allergy Immunol. 2009, 20, 686–692. [Google Scholar] [CrossRef]
  51. Pyrhonen, K.; Nayha, S.; Kaila, M.; Hiltunen, L.; Laara, E. Occurrence of parent-reported food hypersensitivities and food allergies among children aged 1–4 years. Pediatr. Allergy Immunol. 2009, 20, 328–338. [Google Scholar] [CrossRef]
  52. Sasaki, M.; Koplin, J.J.; Dharmage, S.C.; Field, M.J.; Sawyer, S.M.; McWilliam, V.; Peters, R.L.; Gurrin, L.C.; Vuillermin, P.J.; Douglass, J.; et al. Prevalence of clinic-defined food allergy in early adolescence: The SchoolNuts study. J. Allergy Clin. Immunol. 2018, 141, 391–398. [Google Scholar] [CrossRef] [Green Version]
  53. Schmitz, R.; Ellert, U.; Kalcklösch, M.; Dahm, S.; Thamm, M. Patterns of sensitization to inhalant and food allergens—findings from the German Health Interview and Examination Survey for Children and Adolescents. Int. Arch. Allergy Immunol. 2013, 162, 263–270. [Google Scholar] [CrossRef]
  54. Sha, L.; Shao, M.; Liu, C.; Wu, Y.; Chen, Y. A cross-sectional study of the prevalence of food allergies among children younger than ages 14 years in a Beijing urban region. Allergy Asthma Proc. 2019, 40, E1–E7. [Google Scholar] [CrossRef]
  55. Soller, L.; Ben-Shoshan, M.; Harrington, D.W.; Fragapane, J.; Joseph, L.; St Pierre, Y.; Godefroy, S.B.; La Vieille, S.; Elliott, S.J.; Clarke, A.E. Overall prevalence of self-reported food allergy in Canada. J. Allergy Clin. Immunol. 2012, 130, 986–988. [Google Scholar] [CrossRef]
  56. Soller, L.; Ben-Shoshan, M.; Harrington, D.W.; Knoll, M.; Fragapane, J.; Joseph, L.; St Pierre, Y.; La Vieille, S.; Wilson, K.; Elliott, S.J.; et al. Adjusting for nonresponse bias corrects overestimates of food allergy prevalence. J. Allergy Clin. Immunol. Pract. 2015, 3, 291–293. [Google Scholar] [CrossRef] [PubMed]
  57. Strinnholm, A.; Winberg, A.; West, C.; Hedman, L.; Ronmark, E. Food hypersensitivity is common in Swedish schoolchildren, especially oral reactions to fruit and gastrointestinal reactions to milk. Acta. Paediatr. 2014, 103, 1290–1296. [Google Scholar] [CrossRef]
  58. Tsai, H.J.; Kumar, R.; Pongracic, J.; Liu, X.; Story, R.; Yu, Y.; Caruso, D.; Costello, J.; Schroeder, A.; Fang, Y.; et al. Familial aggregation of food allergy and sensitization to food allergens: A family-based study. Clin. Exp. Allergy 2009, 39, 101–109. [Google Scholar] [CrossRef] [Green Version]
  59. Venkataraman, D.; Erlewyn-Lajeunesse, M.; Kurukulaaratchy, R.J.; Potter, S.; Roberts, G.; Matthews, S.; Arshad, S.H. Prevalence and longitudinal trends of food allergy during childhood and adolescence: Results of the Isle of Wight Birth Cohort study. Clin. Exp. Allergy 2018, 48, 394–402. [Google Scholar] [CrossRef] [PubMed] [Green Version]
  60. Venter, C.; Maslin, K.; Arshad, S.H.; Patil, V.; Grundy, J.; Glasbey, G.; Twiselton, R.; Dean, T. Very low prevalence of IgE mediated wheat allergy and high levels of cross-sensitisation between grass and wheat in a UK birth cohort. Clin. Transl. Allergy 2016, 6, 22. [Google Scholar] [CrossRef] [PubMed] [Green Version]
  61. Venter, C.; Maslin, K.; Zhang, H.; Kaushal, A.; Terry, W.; Patil, V.K.; Dean, T.; Arshad, S.H. Use of cluster analysis to characterize patterns of sensitization in childhood allergy. Pediatr. Allergy Immunol. 2018, 29, 644–648. [Google Scholar] [CrossRef] [PubMed] [Green Version]
  62. Verrill, L.; Bruns, R.; Luccioli, S. Prevalence of self reported food allergy in US adults: 2001, 2006, and 2010. Allergy Asthma Proc. 2015, 36, 458–467. [Google Scholar] [CrossRef] [Green Version]
  63. Vierk, K.A.; Koehler, K.M.; Fein, S.B.; Street, D.A. Prevalence of self-reported food allergy in American adults and use of food labels. J. Allergy Clin. Immunol. 2007, 119, 1504–1510. [Google Scholar] [CrossRef]
  64. Wickman, M.; Asarnoj, A.; Tillander, H.; Andersson, N.; Bergstrom, A.; Kull, I.; Melen, E.; Pershagen, G.; Ahlstedt, S.; Lilja, G.; et al. Childhood-to-adolescence evolution of IgE antibodies to pollens and plant foods in the BAMSE cohort. J. Allergy Clin. Immunol. 2014, 133, 580–582. [Google Scholar] [CrossRef]
  65. Wilson, J.M.; Workman, L.; Schuyler, A.J.; Rifas-Shiman, S.L.; McGowan, E.C.; Oken, E.; Gold, D.R.; Hamilton, R.G.; Platts-Mills, T.A.E. Allergen sensitization in a birth cohort at midchildhood: Focus on food component IgE and IgG(4) responses. J. Allergy Clin. Immunol. 2018, 141, 419–423. [Google Scholar] [CrossRef] [PubMed] [Green Version]
  66. Yakhlef, M.; Souiki, L. Contribution to the estimation of the prevalence of food allergy in schoolchildren in the city of Guelma (Algeria). Rev. Fr. D Allergol. 2021, 61, 573–578. [Google Scholar] [CrossRef]
  67. Yamamoto-Hanada, K.; Pak, K.; Saito-Abe, M.; Yang, L.; Sato, M.; Irahara, M.; Mezawa, H.; Sasaki, H.; Nishizato, M.; Ishitsuka, K.; et al. Allergy and immunology in young children of Japan: The JECS cohort. World Allergy Organ. J. 2020, 13, 100479. [Google Scholar] [CrossRef] [PubMed]
  68. Zeng, G.Q.; Luo, J.Y.; Huang, H.M.; Zheng, P.Y.; Luo, W.T.; Wei, N.L.; Sun, B.Q. Food allergy and related risk factors in 2540 preschool children: An epidemiological survey in Guangdong Province, southern China. World J. Pediatr. WJP 2015, 11, 219–225. [Google Scholar] [CrossRef] [PubMed]
  69. Kårhus, L.L.; Skaaby, T.; Madsen, A.L.; Thuesen, B.H.; Schwarz, P.; Rumessen, J.J.; Linneberg, A. The association of celiac disease and allergic disease in a general adult population. United Eur. Gastroenterol. J. 2019, 7, 78–89. [Google Scholar] [CrossRef] [Green Version]
  70. Palmu, S.; Heikkilä, P.; Uski, V.; Niitty, S.; Kurikka, S.; Korppi, M. National allergy programme had little impact on parent-reported food allergies in children aged 6–7 years. Acta. Paediatr. 2018, 107, 121–125. [Google Scholar] [CrossRef] [Green Version]
  71. Wang, M.; He, M.; Shen, X.; Wu, X.; Yu, X.; He, F.; Li, M. Prevalence and influencing factors of food hypersensitivity in infants reported by parents in Chengdu City. Wei Sheng Yan Jiu = J. Hyg. Res. 2019, 48, 594–600. [Google Scholar]
  72. Zhang, Y.; Chen, Y.; Zhao, A.; Li, H.; Mu, Z.; Zhang, Y.; Wang, P. Prevalence of self-reported food allergy and food intolerance and their associated factors in 3–12 year-old children in 9 areas in China. Wei Sheng Yan Jiu = J. Hyg. Res. 2015, 44, 226–231. [Google Scholar]
  73. Zuidmeer, L.; Goldhahn, K.; Rona, R.J.; Gislason, D.; Madsen, C.; Summers, C.; Sodergren, E.; Dahlstrom, J.; Lindner, T.; Sigurdardottir, S.T.; et al. The prevalence of plant food allergies: A systematic review. J. Allergy Clin. Immunol. 2008, 121, 1210–1218.e4. [Google Scholar] [CrossRef]
  74. Quirce, S.; Boyano-Martínez, T.; Díaz-Perales, A. Clinical presentation, allergens, and management of wheat allergy. Expert Rev. Clin. Immunol. 2016, 12, 563–572. [Google Scholar] [CrossRef] [Green Version]
  75. FAO/WHO. Risk Assessment of Food Allergens. Part 1—Review and Validation of Codex Alimentarius Priority Allergen List through Risk Assessment; Food & Agriculture Org.: Rome, Italy, 2022. [Google Scholar]
  76. Siripipattanamongkol, N.; Vichyanond, P.; Jirapongsananuruk, O.; Veskitkul, J.; Visitsunthorn, N.; Pacharn, P. Age of resolution from IgE-mediated wheat allergy. Asian Pac. J. Allergy Immunol. 2017, 35, 113–117. [Google Scholar]
  77. Christensen, M.J.; Eller, E.; Mortz, C.G.; Bindslev-Jensen, C. Patterns of suspected wheat-related allergy: A retrospective single-centre case note review in 156 patients. Clin. Transl. Allergy 2014, 4, 39. [Google Scholar] [CrossRef] [PubMed] [Green Version]
  78. Lee, K.-S.; Rha, Y.-H.; Oh, I.-H.; Choi, Y.-S.; Choi, S.-H. Socioeconomic and sociodemographic factors related to allergic diseases in Korean adolescents based on the Seventh Korea Youth Risk Behavior Web-based Survey: A cross-sectional study. BMC Pediatr. 2016, 16, 19. [Google Scholar] [CrossRef] [PubMed] [Green Version]
  79. Nwaru, B.I.; Hickstein, L.; Panesar, S.S.; Roberts, G.; Muraro, A.; Sheikh, A. Prevalence of common food allergies in Europe: A systematic review and meta-analysis. Allergy 2014, 69, 992–1007. [Google Scholar] [CrossRef] [PubMed]
  80. Weger, W.W.; Sprikkelman, A.B.; Herpertz, C.E.M.; Meulen, G.N.; Vonk, J.M.; Kamps, A.W.A.; Koppelman, G.H. The dilemma of open or double-blind food challenges in diagnosing food allergy in children: Design of the ALDORADO trial. Pediatr. Allergy Immunol. 2022, 33, e13654. [Google Scholar] [CrossRef] [PubMed]
Figure 1. Flowchart for studies on the prevalence of wheat allergy, 1 January 2007–1 September 2022.
Nutrients 15 01564 g001
Figure 2. The prevalence of self-reported wheat allergy; (A): the subgroup analysis for age; (B): the subgroup analysis for economy; (C): the subgroup analysis for region, (D): the subgroup analysis for timespan [18,19,21,23,26,27,28,30,31,32,34,35,36,37,41,42,44,46,47,49,50,51,54,55,56,57,59,62,63,66,67,68,70,71,72].
Nutrients 15 01564 g002aNutrients 15 01564 g002bNutrients 15 01564 g002cNutrients 15 01564 g002d
Figure 3. The prevalence of self-reported physician diagnosed wheat allergy; (A): the subgroup analysis for age; (B): the subgroup analysis for economy; (C): the subgroup analysis for region, (D): the subgroup analysis for timespan [17,18,27,37,51,56,63].
Nutrients 15 01564 g003
Figure 4. The prevalence of wheat allergy for skin prick test positive; (A): the subgroup analysis for economy; (B): the subgroup analysis for region, (C): the subgroup analysis for timespan [20,22,24,25,38,43,52,61].
Nutrients 15 01564 g004
Figure 5. The prevalence of wheat allergy for sIgE positive; (A): the subgroup analysis for age; (B): the subgroup analysis for economy; (C): the subgroup analysis for region, (D): the subgroup analysis for timespan [25,38,39,40,45,48,53,58,64,65,69].
Nutrients 15 01564 g005
Figure 6. The prevalence of wheat allergy confirmed by food challenge (A): the subgroup analysis for region, (B): the subgroup analysis for timespan [29,52,60].
Nutrients 15 01564 g006
Table 1. Summary of the characteristics of 56 included articles.
NoFirst Author, Published YearStudy DesignStudy Period (Year, or Year and Month)Sample SizeCountryAge of PopulationDiagnostic Method *
1S. Al-Hammadi., 2010 [17]Cross-sectional studyDecember 2006397The United Arab EmiratesChildrenSRPD
2Ali, F., 2017 [18]Cross-sectional studyMay 2015–January 2015865KuwaitOtherSR
SRPD
3Nora A. Althumiri., 2021 [19]Cross-sectional studyJanuary 20204709Saudi ArabiaAdultsSR
4Basera, W., 2015 [20]Cross-sectional studyFebruary 2013–December 2014512South AfricaChildrenSPT
5Beltrán-Cárdenas, C.E., 2021 [21]Cross-sectional studyAugust 2019–September 2019969ColombiaChildrenSR
6Botha, M., 2019 [22]Cross-sectional studyFebruary 2013–December 20161583South AfricaChildrenSPT
7da, S. Correia, J.A., 2009 [23]Cross-sectional study2019–2020412BrazilChildrenSR
8Dean, T., 2007 [24]Cohort studySeptember 2001–August 2002807UKChildrenSPT
9Dogruel, D., 2016 [25]Cohort studyFebruary 2010–February 20111377TurkeyChildrenSPT
sIgE
10Gaspar-Marques, J., 2014 [26]Cross-sectional studyNA1217PortugalChildrenSR
11Goncalves, L.C.P., 2016 [27]Cross-sectional studyMarch 2012–September 20139265BrazilOtherSR
SRPD
12Grabenhenrich, L., 2020 [28]Cohort study2013–20171341
1140
976
1570
1513
1556
1387
Iceland
UK
Netherland
Germany
Poland
Lithuania
Spain
ChildrenSR
13Grimshaw, K.E., 2016 [29]Cohort study2006–2008823UKChildrenFC
14Gupta, Ruchi S., 2011 [30]Cross-sectional studyJune 2009–February 201038,480USChildrenSR
15Gupta, Ruchi S., 2019 [31]Cross-sectional studyOctober 2015–September 201640,443USAdultsSR
16Hoyos-Bachiloglu, R., 2014 [32]Cross-sectional studySeptember 2011–December 2012455ChileChildrenSR
17Yan, H., 2010 [33]Well health check2009382ChinaChildrenSPT
18Irani, C., 2015 [34]Cross-sectional studyJuly 2014 + 7 weeks506LebanonOtherSR
19Kim, M., 2017 [35]Cross-sectional studySeptember 201529,842KoreaChildrenSR
20Lao-araya, M., 2012 [36]Cross-sectional study2010446ThailandChildrenSR
21Le, Thu T.K., 2019 [37]Cross-sectional study20168620VietnamChildrenSR
SRPD
22Jing, L., 2020 [38]Cross-sectional studySeptember 2009–June 20166194
5139
12,997
5677
China
China
Russia
India
ChildrenSPT
sIgE
23Lyons, S.A., 2019 [39]Cross-sectional study2005–20092229
935
2078
1497
Sweden
Spain
Iceland
Poland
AdultssIgE
24Mahesh, P.A., 2016 [40]Cross-sectional study2005–200910,931IndiaAdultssIgE
25Matsyura, O., 2021 [41]Cross-sectional study2016–2017935UkrineChildrenSR
26McGowan, Emily C., 2013 [42]Cross-sectional study2007–20102078USOtherSR
27Morillo-Argudo, D.A., 2020 [43]Cross-sectional studyJuly 2013–July 20141497EcuadorChildrenSPT
28Nachshon, L., 2019 [44]Cross-sectional studyMay-October 201612,592IsraelChildrenSR
29Okada, Y., 2017 [45]Cross-sectional studyJuly 2014–February 2015374JapanChildrensIgE
30Ontiveros, N., 2021 [46]Cross-sectional studyOctober 20201058ParaguayanAdultsSR
31Ontiveros, N., 2016 [47]Cross-sectional studySeptember 2014–August 20151049MexicoChildrenSR
32Ostblom, E., 2008 [48]Cohort study1994–19963742SwedenChildrensIgE
33Ostblom, E., 2008 [49]Cohort study1994–19963742SwedenChildrenSR
34Osterballe, M., 2009 [50]Cross-sectional studyNA1094DenmarkAdultsSR
35Pyrhonen, K., 2009 [51]Cross-sectional studyApril 2001–March 20053308FinlandChildrenSR
SRPD
36Sasaki, M., 2018 [52]Cross-sectional study2011–20149663AustraliaChildrenFC
37Schmitz, R., 2013 [53]Cross-sectional studyMay 2003–May 200612,998GermanyChildrensIgE
38Sha, L., 2019 [54]Cross-sectional study201013,073ChinaChildrenSR
39Soller, L., 2012 [55]Cross-sectional studyMay 2008–March 20099667CanadaOtherSR
40Soller, L., 2015 [56]Cross-sectional study2010–201115,022CanadaOtherSR
SRPD
41Strinnholm, A., 2014 [57]Cohort study2006–20102585SwedenChildrenSR
42Tsai, H.J., 2009 [58]Cross-sectional studyAugust 2005–May 20082004USOthersIgE
43Venkataraman, D., 2018 [59]Cohort study20071290UKAdultsSR
44Venter, C., 2016 [60]Cohort study2011–2012827UKChildrenFC
45Venter, C., 2018 [61]Cohort study2011–2012827UKChildrenSPT
46Verrill, L., 2015 [62]Cross-sectional study2007–201044,778USAdultsSR
SRPD
47Vierk, K.A., 2007 [63]Cross-sectional studyApril 2001–August 20114568USAdultsSR
SRPD
48Wickman, M., 2014 [64]Cohort study2010–20121699SwedenChildrensIgE
49Wilson, J.M., 2018 [65]Cohort study1999–20021279USChildrensIgE
50Yakhlef, M., 2021 [66]Cross-sectional study15 April 2018–29 April 2018528AlgeriaChildrenSR
51Yamamoto-Hanada, K., 2020 [67]Cross-sectional studyJanuary 2011–March 201492,945JapanChildrenSR
52Zeng, G.Q., 2015 [68]Cross-sectional studyJanuary 2013–December 20132540ChinaChildrenSR
53Karhus, L, L., 2019 [69]Cross-sectional studyJune 2006–June 20083405DenmarkAdultssIgE
54Palmu.S., 2018 [70]Cross-sectional studyMay 2016–September 20161937FinlandChildrenSR
55Maolin, W., 2019 [71]Cross-sectional studyMarch 2014–March 2015923ChinaChildrenSR
56Yarong, Z., 2015 [72]Cross-sectional studyNovember 2011–April 20121792ChinaChildrenSR
* SR: self-reported; SRPD: self-reported physician diagnosed; SPT: skin prick test; sIgE: specific immunoglobulin-E; FC: food challenge; DBPCFC: double-blind placebo-controlled food challenge.
Disclaimer/Publisher’s Note: The statements, opinions and data contained in all publications are solely those of the individual author(s) and contributor(s) and not of MDPI and/or the editor(s). MDPI and/or the editor(s) disclaim responsibility for any injury to people or property resulting from any ideas, methods, instructions or products referred to in the content.

