
Longitudinal Analysis of the Intestinal Microbiota among a Cohort of Children in Rural and Urban Areas of Pakistan

 , , ,
, , ,
Abstract
1. Introduction
2. Materials and Methods
2.1. Study Design and Participants
2.2. Fecal Sample Collection, DNA Extraction, Amplicon Generation, and 16S rRNA Sequencing
2.3. Computational and Bioinformatics Analyses
2.4. Statistical Analysis
3. Results
3.1. Clinical
3.2. Gut Microbiota
4. Discussion
Supplementary Materials
Author Contributions
Funding
Institutional Review Board Statement
Informed Consent Statement
Data Availability Statement
Acknowledgments
Conflicts of Interest
References
- Black, R.E.; Liu, L.; Hartwig, F.P.; Villavicencio, F.; Rodriguez-Martinez, A.; Vidaletti, L.P.; Perin, J.; Black, M.M.; Blencowe, H.; You, D.; et al. Health and development from preconception to 20 years of age and human capital. Lancet 2022, 399, 1730–1740. [Google Scholar] [CrossRef]
- Investigators, M.-E.N. Relationship between growth and illness, enteropathogens and dietary intakes in the first 2 years of life: Findings from the MAL-ED birth cohort study. BMJ Glob. Health 2017, 2, e000370. [Google Scholar] [CrossRef] [PubMed]
- Bhattacharjee, A.; Burr, A.H.; Overacre-Delgoffe, A.E.; Tometich, J.T.; Yang, D.; Huckestein, B.R.; Linehan, J.L.; Spencer, S.P.; Hall, J.A.; Harrison, O.J.; et al. Environmental enteric dysfunction induces regulatory T cells that inhibit local CD4+ T cell responses and impair oral vaccine efficacy. Immunity 2021, 54, 1745–1757.e7. [Google Scholar] [CrossRef] [PubMed]
- Kane, A.V.; Dinh, D.M.; Ward, H.D. Childhood malnutrition and the intestinal microbiome. Pediatr. Res. 2014, 77, 256–262. [Google Scholar] [CrossRef] [PubMed]
- Barratt, M.J.; Ahmed, T.; Gordon, J.I. Gut microbiome development and childhood undernutrition. Cell Host Microbe 2022, 30, 617–626. [Google Scholar] [CrossRef]
- Velly, H.; Britton, R.A.; Preidis, G.A. Mechanisms of cross-talk between the diet, the intestinal microbiome, and the undernourished host. Gut Microbes 2016, 8, 98–112. [Google Scholar] [CrossRef]
- Iddrisu, I.; Monteagudo-Mera, A.; Poveda, C.; Pyle, S.; Shahzad, M.; Andrews, S.; Walton, G. Malnutrition and Gut Microbiota in Children. Nutrients 2021, 13, 2727. [Google Scholar] [CrossRef]
- Gómez-Gallego, C.; García-Mantrana, I.; Martínez-Costa, C.; Salminen, S.; Isolauri, E.; Collado, M.C. The Microbiota and Malnutrition: Impact of Nutritional Status During Early Life. Annu. Rev. Nutr. 2019, 39, 267–290. [Google Scholar] [CrossRef]
- Vaivada, T.; Gaffey, M.F.; Das, J.K.; Bhutta, Z.A. Evidence-based interventions for improvement of maternal and child nutrition in low-income settings: What’s new? Curr. Opin. Clin. Nutr. Metab. Care 2017, 20, 204–210. [Google Scholar] [CrossRef]
- Gordon, J.I.; Dewey, K.G.; Mills, D.A.; Medzhitov, R.M. The Human Gut Microbiota and Undernutrition. Sci. Transl. Med. 2012, 4, 137ps12. [Google Scholar] [CrossRef]
- Durda-Masny, M.; Ciomborowska-Basheer, J.; Makałowska, I.; Szwed, A. The Mediating Role of the Gut Microbiota in the Physical Growth of Children. Life 2022, 12, 152. [Google Scholar] [CrossRef] [PubMed]
- Chen, R.Y.; Ahmed, T.; Gordon, J.I. Duodenal Microbiota in Stunted Undernourished Children with Enteropathy. Reply. N. Engl. J. Med. 2021, 384, 1778. [Google Scholar] [PubMed]
- Barratt, M.J.; Nuzhat, S.; Ahsan, K.; Frese, S.A.; Arzamasov, A.A.; Alam Sarker, S.; Islam, M.M.; Palit, P.; Islam, R.; Hibberd, M.C.; et al. Bifidobacterium infantis treatment promotes weight gain in Bangladeshi infants with severe acute malnutrition. Sci. Transl. Med. 2022, 14, eabk1107. [Google Scholar] [CrossRef] [PubMed]
- Nabwera, H.M.; Espinoza, J.L.; Worwui, A.; Betts, M.; Okoi, C.; Sesay, A.K.; Bancroft, R.; Agbla, S.C.; Jarju, S.; Bradbury, R.S.; et al. Interactions between fecal gut microbiome, enteric pathogens, and energy regulating hormones among acutely malnourished rural Gambian children. Ebiomedicine 2021, 73, 103644. [Google Scholar] [CrossRef]
- Subramanian, S.; Huq, S.; Yatsunenko, T.; Haque, R.; Mahfuz, M.; Alam, M.A.; Benezra, A.; DeStefano, J.; Meier, M.F.; Muegge, B.D.; et al. Persistent gut microbiota immaturity in malnourished Bangladeshi children. Nature 2014, 510, 417–421. [Google Scholar] [CrossRef]
- Castro-Mejía, J.L.; O’Ferrall, S.; Krych, Ł.; O’Mahony, E.; Namusoke, H.; Lanyero, B.; Kot, W.; Nabukeera-Barungi, N.; Michaelsen, E.F.; Mølgaard, C.; et al. Restitution of gut microbiota in Ugandan children administered with probiotics (Lactobacillus rhamnosus GG and Bifidobacterium animalis subsp. lactis BB-12) during treatment for severe acute malnutrition. Gut Microbes 2020, 11, 855–867. [Google Scholar] [CrossRef]
- Gehrig, J.L.; Venkatesh, S.; Chang, H.-W.; Hibberd, M.C.; Kung, V.L.; Cheng, J.; Chen, R.Y.; Subramanian, S.; Cowardin, C.A.; Meier, M.; et al. Effects of microbiota-directed foods in gnotobiotic animals and undernourished children. Science 2019, 365, eaau4732. [Google Scholar] [CrossRef]
- Kristensen, K.H.S.; Wiese, M.; Rytter, M.J.H.; Özçam, M.; Hansen, L.H.; Namusoke, H.; Friis, H.; Nielsen, D.S. Gut Microbiota in Children Hospitalized with Oedematous and Non-Oedematous Severe Acute Malnutrition in Uganda. PLoS Neglected Trop. Dis. 2016, 10, e0004369. [Google Scholar] [CrossRef]
- Camara, A.; Konate, S.; Alou, M.T.; Kodio, A.; Togo, A.H.; Cortaredona, S.; Henrissat, B.; Thera, M.A.; Doumbo, O.K.; Raoult, D.; et al. Clinical evidence of the role of Methanobrevibacter smithii in severe acute malnutrition. Sci. Rep. 2021, 11, 5426. [Google Scholar] [CrossRef]
- Balasubramaniam, C.; Mallappa, R.H.; Singh, D.K.; Chaudhary, P.; Bharti, B.; Muniyappa, S.K.; Grover, S. Gut bacterial profile in Indian children of varying nutritional status: A comparative pilot study. Eur. J. Nutr. 2021, 60, 3971–3985. [Google Scholar] [CrossRef]
- Tidjani Alou, M.; Million, M.; Traore, S.I.; Mouelhi, D.; Khelaifia, S.; Bachar, D.; Caputo, A.; Delerce, J.; Brah, S.; Alhousseini, D.; et al. Gut Bacteria Missing in Severe Acute Malnutrition, Can We Identify Potential Probiotics by Culturomics? Front. Microbiol. 2017, 8, 899. [Google Scholar] [CrossRef] [PubMed]
- Dinh, D.M.; Ramadass, B.; Kattula, D.; Sarkar, R.; Braunstein, P.; Tai, A.; Wanke, C.A.; Hassoun, S.; Kane, A.V.; Naumova, E.N.; et al. Longitudinal Analysis of the Intestinal Microbiota in Persistently Stunted Young Children in South India. PLoS ONE 2016, 11, e0155405. [Google Scholar] [CrossRef] [PubMed]
- Collard, J.-M.; Andrianonimiadana, L.; Habib, A.; Rakotondrainipiana, M.; Andriantsalama, P.; Randriamparany, R.; Rabenandrasana, M.A.N.; Weill, F.-X.; Sauvonnet, N.; Randremanana, R.V.; et al. High prevalence of small intestine bacteria overgrowth and asymptomatic carriage of enteric pathogens in stunted children in Antananarivo, Madagascar. PLoS Neglected Trop. Dis. 2022, 16, e0009849. [Google Scholar] [CrossRef] [PubMed]
- Chen, R.Y.; Kung, V.L.; Das, S.; Hossain, M.S.; Hibberd, M.C.; Guruge, J.; Mahfuz, M.; Begum, S.K.N.; Rahman, M.M.; Fahim, S.M.; et al. Duodenal Microbiota in Stunted Undernourished Children with Enteropathy. N. Engl. J. Med. 2020, 383, 321–333. [Google Scholar] [CrossRef] [PubMed]
- Perin, J.; Burrowes, V.; Almeida, M.; Ahmed, S.; Haque, R.; Parvin, T.; Biswas, S.; Azmi, I.J.; Bhuyian, S.I.; Talukder, K.A.; et al. A Retrospective Case-Control Study of the Relationship between the Gut Microbiota, Enteropathy, and Child Growth. Am. J. Trop. Med. Hyg. 2020, 103, 520–527. [Google Scholar] [CrossRef]
- Soofi, S.; Cousens, S.; Iqbal, S.P.; Akhund, T.; Khan, J.; Ahmed, I.; Zaidi, A.K.; Bhutta, Z.A. Effect of provision of daily zinc and iron with several micronutrients on growth and morbidity among young children in Pakistan: A cluster-randomised trial. Lancet 2013, 382, 29–40. [Google Scholar] [CrossRef]
- Popovic, A.; Bourdon, C.; Wang, P.W.; Guttman, D.S.; Soofi, S.; Bhutta, Z.A.; Bandsma, R.H.J.; Parkinson, J.; Pell, L.G. Micronutrient supplements can promote disruptive protozoan and fungal communities in the developing infant gut. Nat. Commun. 2021, 12, 6729. [Google Scholar] [CrossRef]
- Hamady, M.; Walker, J.J.; Harris, J.; Gold, N.J.; Knight, R.T. Error-correcting barcoded primers for pyrosequencing hundreds of samples in multiplex. Nat. Methods 2008, 5, 235–237. [Google Scholar] [CrossRef]
- Caporaso, J.G.; Kuczynski, J.; Stombaugh, J.; Bittinger, K.; Bushman, F.D.; Costello, E.K.; Fierer, N.; Gonzalez Peña, A.; Goodrich, J.K.; Gordon, J.I.; et al. QIIME allows analysis of high-throughput community sequencing data. Nat. Methods 2010, 7, 335–336. [Google Scholar] [CrossRef]
- Edgar, R.C. Search and clustering orders of magnitude faster than BLAST. Bioinformatics 2010, 26, 2460–2461. [Google Scholar] [CrossRef]
- Wang, Q.; Garrity, G.M.; Tiedje, J.M.; Cole, J.R. Naive Bayesian classifier for rapid assignment of rRNA sequences into the new bacterial taxonomy. Appl. Environ. Microbiol. 2007, 73, 5261–5267. [Google Scholar] [CrossRef]
- Segata, N.; Izard, J.; Waldron, L.; Gevers, D.; Miropolsky, L.; Garrett, W.S.; Huttenhower, C. Metagenomic biomarker discovery and explanation. Genome Biol. 2011, 12, R60. [Google Scholar] [CrossRef] [PubMed]
- Rothman, K.J. No adjustments are needed for multiple comparisons. Epidemiology 1990, 1, 43–46. [Google Scholar] [CrossRef] [PubMed]
- Lozupone, C.; Knight, R. UniFrac: A New Phylogenetic Method for Comparing Microbial Communities. Appl. Environ. Microbiol. 2005, 71, 8228–8235. [Google Scholar] [CrossRef] [PubMed]
- Yatsunenko, T.; Rey, F.E.; Manary, M.J.; Trehan, I.; Dominguez-Bello, M.G.; Contreras, M.; Magris, M.; Hidalgo, G.; Baldassano, R.N.; Anokhin, A.P.; et al. Human gut microbiome viewed across age and geography. Nature 2012, 486, 222–227. [Google Scholar] [CrossRef] [PubMed]
- Bäckhed, F.; Roswall, J.; Peng, Y.; Feng, Q.; Jia, H.; Kovatcheva-Datchary, P.; Li, Y.; Xia, Y.; Xie, H.; Zhong, H.; et al. Dynamics and Stabilization of the Human Gut Microbiome during the First Year of Life. Cell Host Microbe 2015, 17, 690–703. [Google Scholar] [CrossRef]
- Palmer, C.; Bik, E.M.; DiGiulio, D.B.; Relman, D.A.; Brown, P.O. Development of the Human Infant Intestinal Microbiota. PLoS Biol. 2007, 5, 1556–1573. [Google Scholar] [CrossRef]
- Koenig, J.E.; Spor, A.; Scalfone, N.; Fricker, A.D.; Stombaugh, J.; Knight, R.; Angenent, L.T.; Ley, R.E. Succession of microbial consortia in the developing infant gut microbiome. Proc. Natl. Acad. Sci. USA 2011, 108 (Suppl. 1), 4578–4585. [Google Scholar] [CrossRef]
- Mostafa, I.; Fahim, S.M.; Das, S.; Gazi, A.; Hasan, M.; Saqeeb, K.N.; Mahfuz, M.; Lynn, H.B.; Barratt, M.J.; Gordon, J.I.; et al. Developing shelf-stable Microbiota Directed Complementary Food (MDCF) prototypes for malnourished children: Study protocol for a randomized, single-blinded, clinical study. BMC Pediatr. 2022, 22, 385. [Google Scholar] [CrossRef]
- Kamil, R.; Murdiati, A.; Juffrie, M.; Nakayama, J.; Rahayu, E. Gut Microbiota and Short-Chain Fatty Acid Profile between Normal and Moderate Malnutrition Children in Yogyakarta, Indonesia. Microorganisms 2021, 9, 127. [Google Scholar] [CrossRef]
- Calder, N.; Walsh, K.; Olupot-Olupot, P.; Ssenyondo, T.; Muhindo, R.; Mpoya, A.; Brignardello, J.; Wang, X.; McKay, E.; Morrison, D.; et al. Modifying gut integrity and microbiome in children with severe acute malnutrition using legume-based feeds (MIMBLE): A pilot trial. Cell Rep. Med. 2021, 2, 100280. [Google Scholar] [CrossRef] [PubMed]
- Kortekangas, E.; Kamng’Ona, A.W.; Fan, Y.; Cheung, Y.B.; Ashorn, U.; Matchado, A.; Poelman, B.; Maleta, K.; Dewey, K.G.; Ashorn, P. Environmental exposures and child and maternal gut microbiota in rural Malawi. Paediatr. Perinat. Epidemiol. 2020, 34, 161–170. [Google Scholar] [CrossRef] [PubMed]
- Huey, S.L.; Jiang, L.; Fedarko, M.W.; McDonald, D.; Martino, C.; Ali, F.; Russell, D.G.; Udipi, S.A.; Thorat, A.; Thakker, V.; et al. Nutrition and the Gut Microbiota in 10- to 18-Month-Old Children Living in Urban Slums of Mumbai, India. Msphere 2020, 5, 5. [Google Scholar] [CrossRef] [PubMed]
- Zambrana, L.E.; McKeen, S.; Ibrahim, H.; Zarei, I.; Borresen, E.C.; Doumbia, L.; Boré, A.; Cissoko, A.; Douyon, S.; Koné, K.; et al. Rice bran supplementation modulates growth, microbiota and metabolome in weaning infants: A clinical trial in Nicaragua and Mali. Sci. Rep. 2019, 9, 13919. [Google Scholar] [CrossRef] [PubMed]
- Méndez-Salazar, E.O.; Ortiz-López, M.G.; Granados-Silvestre, M.D.L.Á.; Palacios-González, B.; Menjivar, M. Altered Gut Microbiota and Compositional Changes in Firmicutes and Proteobacteria in Mexican Undernourished and Obese Children. Front. Microbiol. 2018, 9, 2494. [Google Scholar] [CrossRef]
- Pop, M.; Walker, A.W.; Paulson, J.; Lindsay, B.; Antonio, M.; Hossain, M.A.; Oundo, J.; Tamboura, B.; Mai, V.; Astrovskaya, I.; et al. Diarrhea in young children from low-income countries leads to large-scale alterations in intestinal microbiota composition. Genome Biol. 2014, 15, R76. [Google Scholar] [CrossRef]
- Grech, A.; Collins, C.E.; Holmes, A.; Lal, R.; Duncanson, K.; Taylor, R.; Gordon, A. Maternal exposures and the infant gut microbiome: A systematic review with meta-analysis. Gut Microbes 2021, 13, 1897210. [Google Scholar] [CrossRef]
- Gough, E.K.; Stephens, D.A.; Moodie, E.E.; Prendergast, A.J.; Stoltzfus, R.J.; Humphrey, J.H.; Manges, A.R. Linear growth faltering in infants is associated with Acidaminococcus sp. and community-level changes in the gut microbiota. Microbiome 2015, 3, 24. [Google Scholar] [CrossRef]
- Chen, X.; Jiang, Y.; Wang, Z.; Chen, Y.; Tang, S.; Wang, S.; Su, L.; Huang, X.; Long, D.; Wang, L.; et al. Alteration in Gut Microbiota Associated with Zinc Deficiency in School-Age Children. Nutrients 2022, 14, 2895. [Google Scholar] [CrossRef]


| Urban (n = 30) | Rural (n = 30) | p Value | |
|---|---|---|---|
| Median Age (days, range) | 101 (88–126) | 91 (40–121) | 0.0011 1 |
| Male (Number (percent) | 9/30 (30%) | 13/30 (43%) | 0.422 2 |
| Wasted (percent) | 13/30 (43%) | 11/30 (37%) | 0.7925 2 |
| Stunted (percent) | 6/30 (20%) | 7/30 (23%) | >0.999 2 |
| Underweight (percent) | 7/30 (23%) | 14/30 (47%) | 0.1033 2 |
| Median Age of Weaning (months, range) | 3 (1–4) | 3 (0–6) | 0.1075 1 |
| Parameter | Intervention Group | p-Value | Residence | p-Value | |||
|---|---|---|---|---|---|---|---|
| A (n = 20) | B (n = 20) | C (n = 20) | Urban (n = 30) | Rural (n = 30) | |||
| Weaning Age (months) | 4.0 (4.0, 5.0) | 5.0 (5.0, 6.0) | 5.0 (4.5, 5.5) | 0.058 | 5.0 (4.0, 5.0) | 5.0 (5.0, 6.0) | 0.140 |
| At Recruitment (3 months) | |||||||
| Breast Feeding | 19 (95.0) | 19 (95.0) | 19 (95.0) | 1.000 | 27 (90.0) | 30 (100.0) | 0.240 |
| Animal Milk intake | 2 (10.0) | 2 (10.0) | 5 (25.0) | 0.470 | 8 (26.7) | 1 (3.3) | 0.026 |
| Formula Milk intake | 5 (25.0) | 8 (40.0) | 7 (35.0) | 0.700 | 6 (20.0) | 14 (46.7) | 0.054 |
| Antibiotic Use | 3 (15.0) | 5 (25.0) | 8 (40.0) | 0.240 | 4 (13.3) | 12 (40.0) | 0.039 |
| Fever | 7 (35.0) | 8 (40.0) | 10 (50.0) | 0.720 | 8 (26.7) | 17 (56.7) | 0.035 |
| Fast Breathing | 5 (25.0) | 5 (25.0) | 1 (5.0) | 0.190 | 0 (0.0) | 11 (36.7) | <0.001 |
| Chest Indrawing | 2 (10.0) | 2 (10.0) | 0 (0.0) | 0.530 | 2 (6.7) | 2 (6.7) | 1.00 |
| At 6 months | |||||||
| Breast Feeding | 18 (90.0) | 19 (95.0) | 17 (85.0) | 0.860 | 26 (86.7) | 28 (93.3) | 0.670 |
| Animal Milk intake | 2 (10.0) | 2 (10.0) | 4 (20.0) | 0.710 | 7 (23.3) | 1 (3.3) | 0.052 |
| Formula Milk intake | 8 (40.0) | 11 (55.0) | 10 (50.0) | 0.730 | 10 (33.3) | 19 (63.3) | 0.038 |
| Weening food intake | 17 (85.0) | 18 (90.0) | 16 (80.0) | 0.900 | 28 (93.3) | 23 (76.7) | 0.150 |
| Antibiotic Use | 8 (40.0) | 5 (25.0) | 7 (35.0) | 0.700 | 10 (33.3) | 10 (33.3) | 1.000 |
| Fever | 11 (55.0) | 10 (50.0) | 12 (60.0) | 0.950 | 13 (43.3) | 20 (66.7) | 0.120 |
| Fast Breathing | 5 (25.0) | 7 (35.0) | 5 (25.0) | 0.820 | 5 (16.7) | 12 (40.0) | 0.084 |
| Chest Indrawing | 0 (0) | 0 (0) | 0 (0) | -- | 0 (0) | 0 (0) | -- |
| Antibiotic Use | 5 (25.0) | 8 (40.0) | 11 (55.0) | 0.170 | 8 (26.7) | 16 (53.3) | 0.064 |
| Fever | 5 (25.0) | 10 (50.0) | 11 (55.0) | 0.140 | 11 (36.7) | 15 (50.0) | 0.430 |
| Fast Breathing | 2 (10.0) | 4 (20.0) | 4 (20.0) | 0.750 | 0 (0.0) | 10 (33.3) | <0.001 |
| Chest Indrawing | 0 (0) | 0 (0) | 0 (0) | -- | 0 (0) | 0 (0) | -- |
| At 12 months | |||||||
| Antibiotic Use | 8 (40.0) | 4 (20.0) | 8 (40.0) | 0.340 | 5 (16.7) | 15 (50.0) | 0.013 |
| Fever | 9 (45.0) | 7 (35.0) | 12 (60.0) | 0.320 | 14 (46.7) | 14 (46.7) | 1.000 |
| Fast Breathing | 2 (10.0) | 4 (20.0) | 7 (35.0) | 0.190 | 4 (13.3) | 9 (30.0) | 0.210 |
| Chest Indrawing | 0 (0.0) | 1 (5.0) | 2 (10.0) | 0.770 | 0 (0.0) | 3 (10.0) | 0.240 |
| At 18 months | |||||||
| Antibiotic Use | 8 (40.0) | 4 (20.0) | 7 (35.0) | 0.470 | 9 (30.0) | 10 (33.3) | 1.000 |
| Fever | 9 (45.0) | 8 (40.0) | 12 (60.0) | 0.520 | 8 (26.7) | 21 (70.0) | 0.002 |
| Fast Breathing | 2 (10.0) | 7 (35.0) | 4 (20.0) | 0.190 | 2 (6.7) | 11 (36.7) | 0.010 |
| Chest Indrawing | 0 (0) | 0 (0) | 0 (0) | -- | 0 (0) | 0 (0) | -- |
| At 24 months | |||||||
| Antibiotic Use | 1 (5.0) | 1 (5.0) | 4 (20.0) | 0.34 | 2 (6.7) | 4 (13.3) | 0.67 |
| Fever | 1 (5.0) | 3 (15.0) | 1 (5.0) | 0.60 | 2 (6.7) | 3 (10.0) | 1.00 |
| Fast Breathing | 0 (0.0) | 1 (5.0) | 0 (0.0) | 1.00 | 0 (0.0) | 1 (3.3) | 1.00 |
| Chest Indrawing | 0 (0) | 0 (0) | 0 (0) | -- | 0 (0) | 0 (0) | -- |
| Index | Age-Specific Effect * (SE) | LCI | UCI | p Value |
|---|---|---|---|---|
| Chao | 60.627 (4.674) | 51.462 | 69.792 | <0.0001 |
| Equitability | 0.024 (0.0015) | 0.018 | 0.027 | <0.0001 |
| Shannon | 0.081 (0.005) | 0.069 | 0.092 | <0.0001 |
| PD | 2.427 (0.195) | 2.046 | 2.811 | <0.0001 |
| Relative Abundance | Age-Specific Effect * (SE) | LCI | UCI | p Value |
|---|---|---|---|---|
| Actinobacteria | −0.039 (0.003) | −0.048 | −0.033 | <0.0001 |
| Bacteroidetes | 0.015 (0.0015) | 0.012 | 0.018 | <0.0001 |
| Firmicutes | 0.030 (0.003) | 0.024 | 0.039 | <0.0001 |
| Proteobacteria | −0.015 (0.003) | −0.021 | −0.006 | 0.0001 |
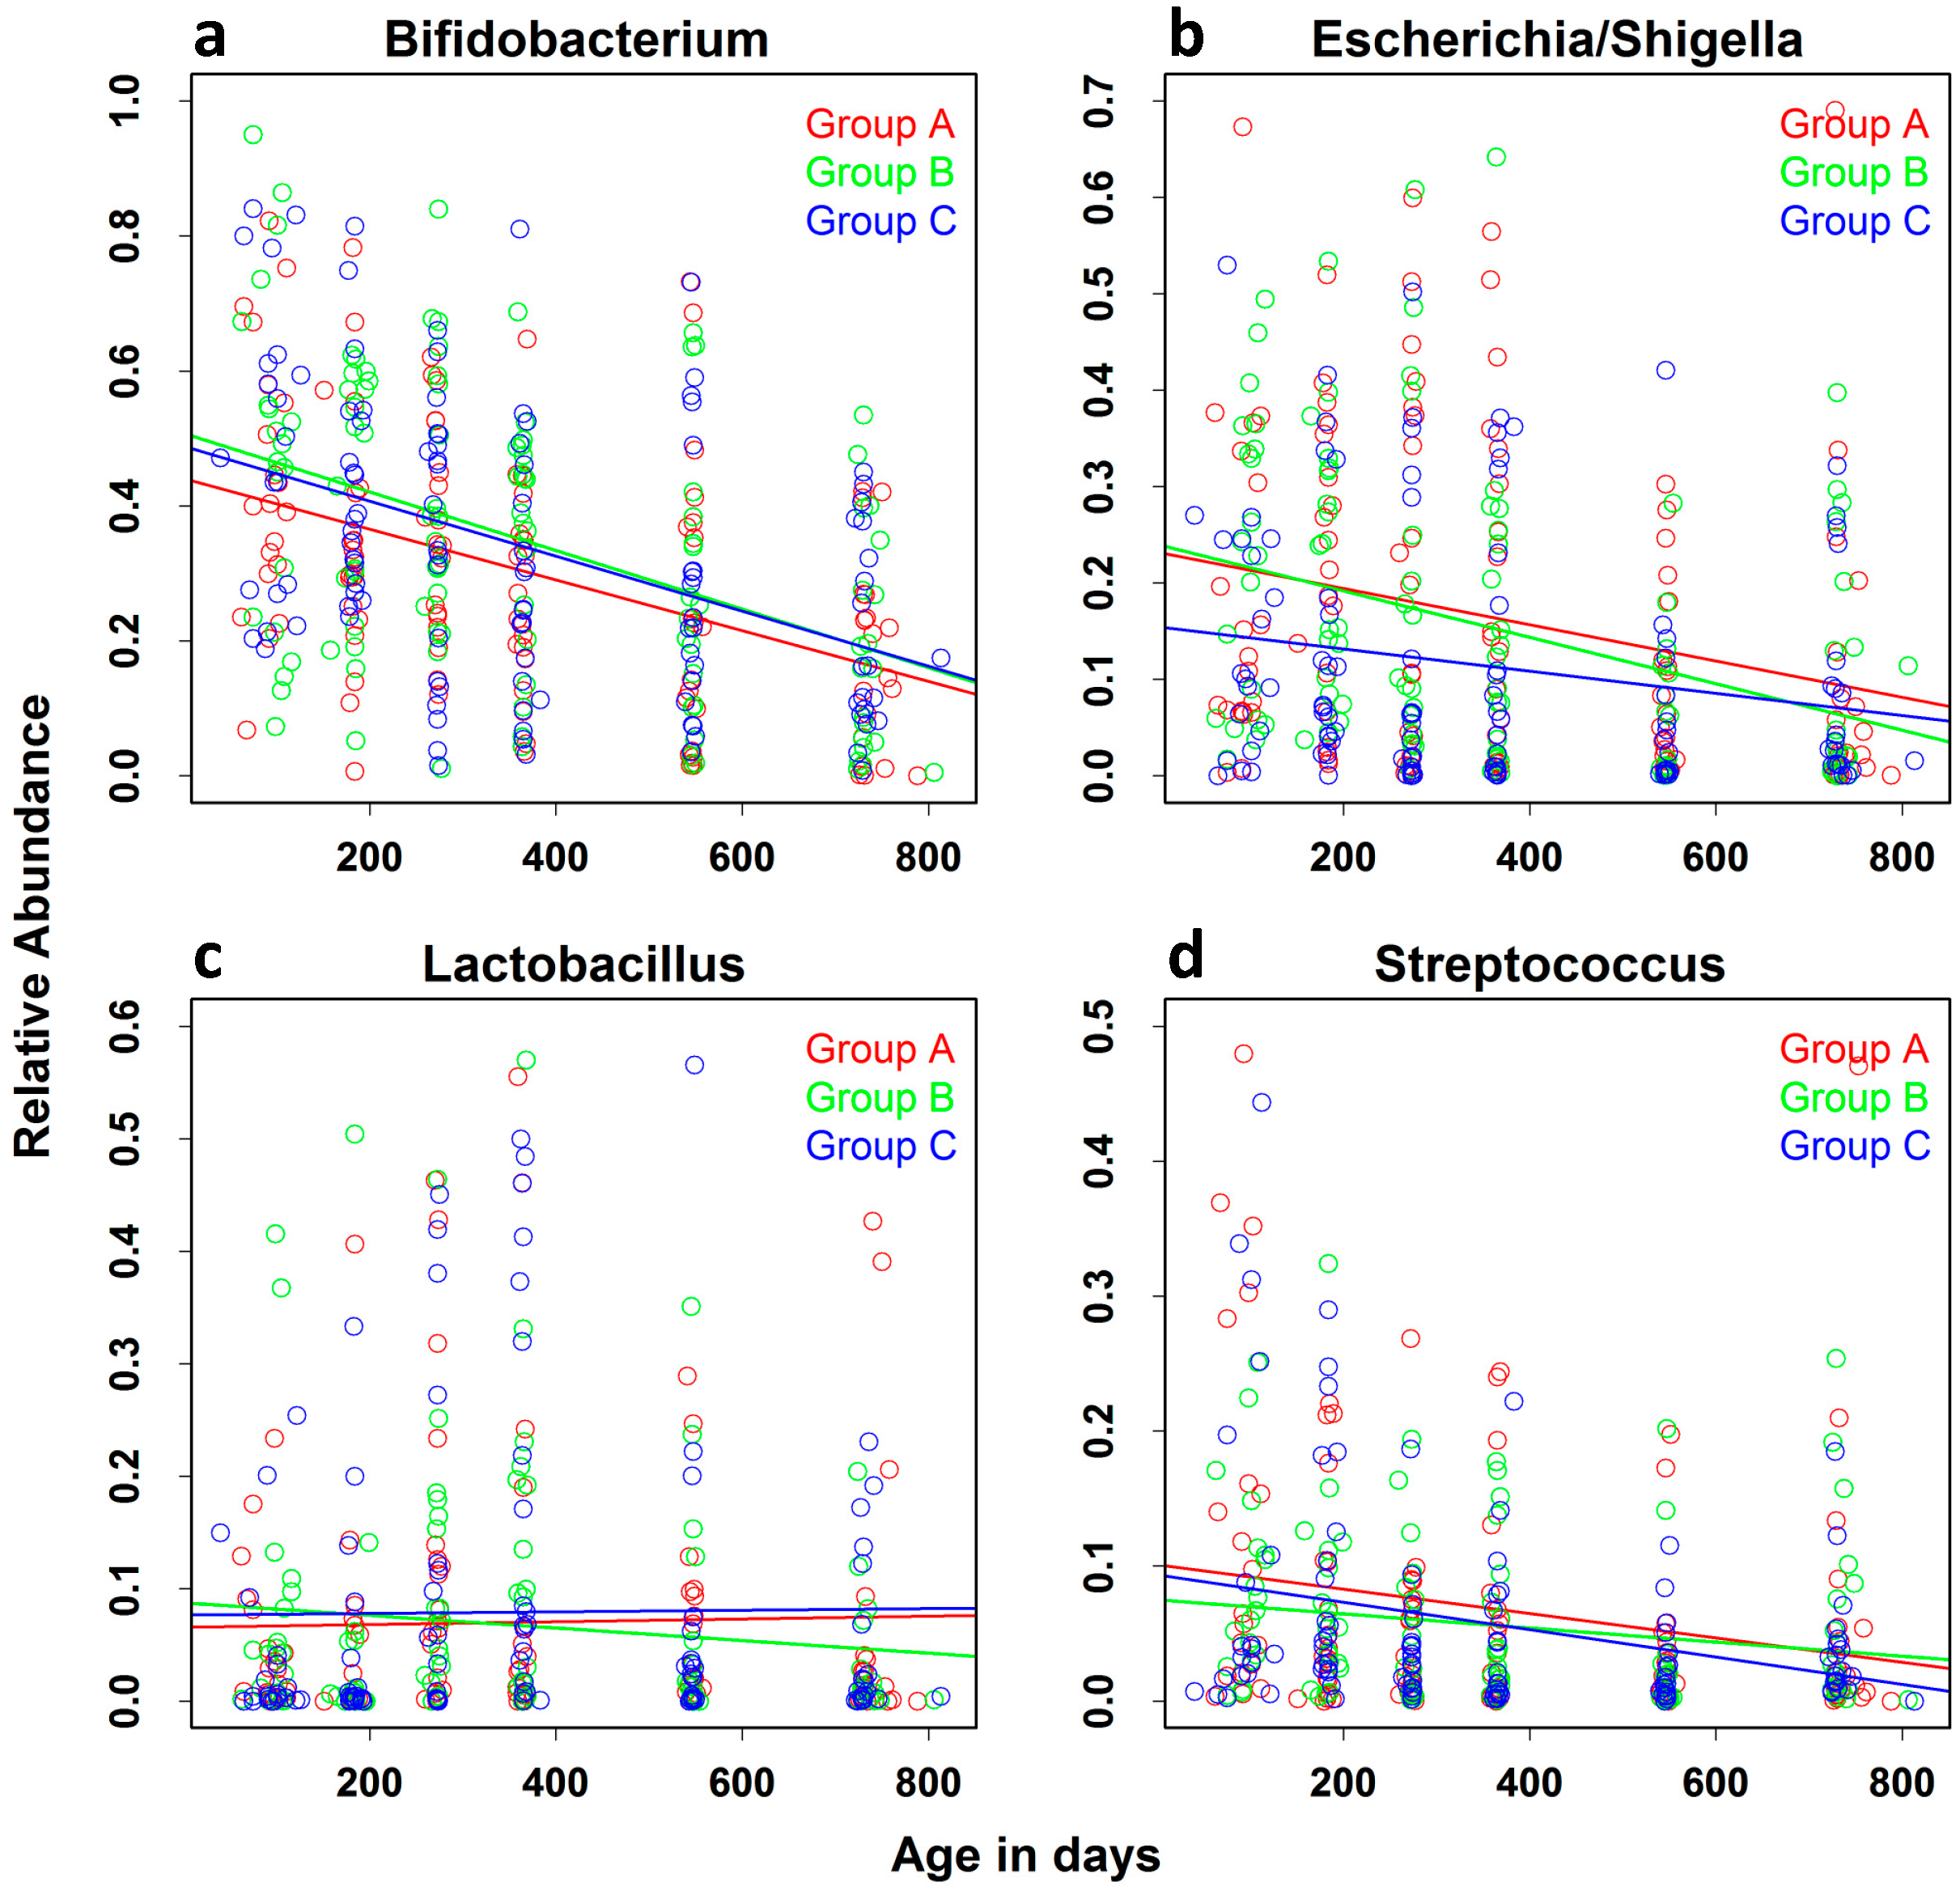
| Relative Abundance | Age-Specific Effect * (SE) | LCI | UCI | p Value |
|---|---|---|---|---|
| Bifidobacterium | −0.0372 (0.0041) | −0.0454 | −0.0291 | <0.0001 |
| Shigella/Escherichia | −0.0157 (0.0032) | −0.0221 | −0.0095 | <0.0001 |
| Lactobacillus | −0.0006 (0.0025) | −0.0057 | 0.0043 | 0.7950 |
| Streptococcus | −0.0077 (0.0021) | −0.0119 | −0.0035 | 0.0003 |
Disclaimer/Publisher’s Note: The statements, opinions and data contained in all publications are solely those of the individual author(s) and contributor(s) and not of MDPI and/or the editor(s). MDPI and/or the editor(s) disclaim responsibility for any injury to people or property resulting from any ideas, methods, instructions or products referred to in the content. |
© 2023 by the authors. Licensee MDPI, Basel, Switzerland. This article is an open access article distributed under the terms and conditions of the Creative Commons Attribution (CC BY) license (https://creativecommons.org/licenses/by/4.0/).
Share and Cite
Balaji, V.; Dinh, D.M.; Kane, A.V.; Soofi, S.; Ahmed, I.; Rizvi, A.; Chatterjee, M.; Babji, S.; Duara, J.; Moy, J.; et al. Longitudinal Analysis of the Intestinal Microbiota among a Cohort of Children in Rural and Urban Areas of Pakistan. Nutrients 2023, 15, 1213. https://doi.org/10.3390/nu15051213
Balaji V, Dinh DM, Kane AV, Soofi S, Ahmed I, Rizvi A, Chatterjee M, Babji S, Duara J, Moy J, et al. Longitudinal Analysis of the Intestinal Microbiota among a Cohort of Children in Rural and Urban Areas of Pakistan. Nutrients. 2023; 15(5):1213. https://doi.org/10.3390/nu15051213
Chicago/Turabian StyleBalaji, Veeraraghavan, Duy M. Dinh, Anne V. Kane, Sajid Soofi, Imran Ahmed, Arjumand Rizvi, Meera Chatterjee, Sudhir Babji, Joanne Duara, Joy Moy, and et al. 2023. "Longitudinal Analysis of the Intestinal Microbiota among a Cohort of Children in Rural and Urban Areas of Pakistan" Nutrients 15, no. 5: 1213. https://doi.org/10.3390/nu15051213
APA StyleBalaji, V., Dinh, D. M., Kane, A. V., Soofi, S., Ahmed, I., Rizvi, A., Chatterjee, M., Babji, S., Duara, J., Moy, J., Naumova, E. N., Wanke, C. A., Ward, H. D., & Bhutta, Z. A. (2023). Longitudinal Analysis of the Intestinal Microbiota among a Cohort of Children in Rural and Urban Areas of Pakistan. Nutrients, 15(5), 1213. https://doi.org/10.3390/nu15051213