
Vitamin D Deficiency Prevalence in Hospitalized Patients with COVID-19 Significantly Decreased during the Pandemic in Slovakia from 2020 to 2022 Which Was Associated with Decreasing Mortality

 , , ,
, , ,
Abstract
1. Introduction
2. Materials and Methods
- COVID-19 pneumonia was the primary diagnosis upon admission;
- A severe COVID-19 infection was present;
- The presence of SARS-CoV-2 was detected by a reverse transcriptase–polymerase chain reaction (RT–PCR) using a nasopharyngeal swab;
- Serum 25(OH)D levels were obtained precisely at admission.
3. Results
4. Discussion
5. Conclusions
Author Contributions
Funding
Institutional Review Board Statement
Informed Consent Statement
Data Availability Statement
Conflicts of Interest
References
- Zhou, P.; Yang, X.L.; Wang, X.G.; Hu, B.; Zhang, L.; Zhang, W.; Si, H.R.; Zhu, Y.; Li, B.; Huang, C.L.; et al. A pneumonia outbreak associated with a new coronavirus of probable bat origin. Nature 2020, 579, 270–273, Erratum in Nature 2020, 588, E6. [Google Scholar] [CrossRef] [PubMed]
- World Health Organization Coronavirus Disease (COVID-19) Situation Report 51. Available online: https://www.who.int/publications/m/item/situation-report---51 (accessed on 21 November 2022).
- Ammar, A.; Brach, M.; Trabelsi, K.; Chtourou, H.; Boukhris, O.; Masmoudi, L.; Bouaziz, B.; Bentlage, E.; How, D.; Ahmed, M.; et al. Effects of COVID-19 Home Confinement on Eating Behaviour and Physical Activity: Results of the ECLB-COVID19 International Online Survey. Nutrients 2020, 12, 1583. [Google Scholar] [CrossRef] [PubMed]
- Bogataj Jontez, N.; Novak, K.; Kenig, S.; Petelin, A.; Jenko Pražnikar, Z.; Mohorko, N. The Impact of COVID-19-Related Lockdown on Diet and Serum Markers in Healthy Adults. Nutrients 2021, 13, 1082. [Google Scholar] [CrossRef] [PubMed]
- Subramanian, S.; Griffin, G.; Hewison, M.; Hopkin, J.; Kenny, R.A.; Laird, E.; Quinton, R.; Thickett, D.; Rhodes, J.M. Vitamin D and COVID-19-Revisited. J. Intern. Med. 2022, 292, 604–626. [Google Scholar] [CrossRef]
- Holick, M.F.; Chen, T.C.; Lu, Z.; Sauter, E. Vitamin D and skin physiology: A D-lightful story. J Bone Miner. Res. 2007, 22 (Suppl. S2), V28–V33. [Google Scholar] [CrossRef]
- Moozhipurath, R.K.; Kraft, L. Association of lockdowns with the protective role of ultraviolet-B (UVB) radiation in reducing COVID-19 deaths. Sci. Rep. 2021, 11, 22851. [Google Scholar] [CrossRef]
- Yu, L.; Ke, H.J.; Che, D.; Luo, S.L.; Guo, Y.; Wu, J.L. Effect of Pandemic-Related Confinement on Vitamin D Status Among Children Aged 0–6 Years in Guangzhou, China: A Cross-Sectional Study. Risk Manag. Healthc. Policy 2020, 13, 2669–2675. [Google Scholar] [CrossRef]
- Rustecka, A.; Maret, J.; Drab, A.; Leszczyńska, M.; Tomaszewska, A.; Lipińska-Opałka, A.; Będzichowska, A.; Kalicki, B.; Kubiak, J.Z. The Impact of COVID-19 Pandemic during 2020–2021 on the Vitamin D Serum Levels in the Paediatric Population in Warsaw, Poland. Nutrients 2021, 13, 1990. [Google Scholar] [CrossRef]
- Meoli, M.; Muggli, F.; Lava, S.A.G.; Bianchetti, M.G.; Agostoni, C.; Kocher, C.; Bührer, T.W.; Ciliberti, L.; Simonetti, G.D.; Milani, G.P. Vitamin D Status in Adolescents during COVID-19 Pandemic: A Cross-Sectional Comparative Study. Nutrients 2021, 13, 1467. [Google Scholar] [CrossRef]
- Somagutta, M.R.; Hange, N.; Wadagale, A.; Hamdan, A.H.Y.; Jain, M.S.; Bobba, S.H.; Batti, E.; Emuze, B. Impact of the Coronavirus Disease on Micronutrient Search Trends and Interest in Global Population: A Worldwide Google Trend Analysis. Electron. J. Gen. Med. 2022, 19, em372. [Google Scholar] [CrossRef]
- Smaha, J.; Kužma, M.; Jackuliak, P.; Nachtmann, S.; Max, F.; Tibenská, E.; Binkley, N.; Payer, J. Serum 25-hydroxyvitamin D Concentration Significantly Decreases in Patients with COVID-19 Pneumonia during the First 48 h after Hospital Admission. Nutrients 2022, 14, 2362. [Google Scholar] [CrossRef] [PubMed]
- Alhazzani, W.; Møller, M.H.; Arabi, Y.M.; Loeb, M.; Gong, M.N.; Fan, E.; Oczkowski, S.; Levy, M.M.; Derde, L.; Dzierba, A.; et al. Surviving Sepsis Campaign: Guidelines on the Management of Critically Ill Adults with Coronavirus Disease 2019 (COVID-19). Crit. Care Med. 2020, 48, e440–e469. [Google Scholar] [CrossRef] [PubMed]
- Rusňáková, D.; Sedláčková, T.; Radvák, P.; Böhmer, M.; Mišenko, P.; Budiš, J.; Bokorová, S.; Lipková, N.; Forgáčová-Jakúbková, M.; Sládeček, T.; et al. Systematic Genomic Surveillance of SARS-CoV-2 Virus on Illumina Sequencing Platforms in the Slovak Republic-One Year Experience. Viruses 2022, 14, 2432. [Google Scholar] [CrossRef] [PubMed]
- Roche Diagnostics. Available online: https://diagnostics.roche.com/be/en/products/params/elecsys-vitamin-d-total-ii.html (accessed on 12 February 2023).
- Medirex Group. Available online: https://www.medirex.sk/lekar/o-nas/manazment-kvality/manazment-kvality-medirex (accessed on 14 February 2023).
- Holick, M.F.; Binkley, N.C.; Bischoff-Ferrari, H.A.; Gordon, C.M.; Hanley, D.A.; Heaney, R.P.; Murad, M.H.; Weaver, C.M.; Endocrine Society. Evaluation, treatment, and prevention of vitamin D deficiency: An Endocrine Society clinical practice guideline. J. Clin. Endocrinol. Metab. 2011, 96, 1911–1930, Erratum in J. Clin. Endocrinol. Metab. 2011, 96, 3908. [Google Scholar] [CrossRef] [PubMed]
- Muscogiuri, G.; Barrea, L.; Somma, C.D.; Laudisio, D.; Salzano, C.; Pugliese, G.; de Alteriis, G.; Colao, A.; Savastano, S. Sex Differences of Vitamin D Status across BMI Classes: An Observational Prospective Cohort Study. Nutrients 2019, 11, 3034. [Google Scholar] [CrossRef] [PubMed]
- Singh, S.; Bajorek, B. Defining ‘elderly’ in clinical practice guidelines for pharmacotherapy. Pharm. Pract. 2014, 12, 489. [Google Scholar] [CrossRef] [PubMed]
- Bouillon, R. Current vitamin D status in European and Middle East countries and strategies to prevent vitamin D deficiency: A position statement of the European Calcified Tissue Society. Eur. J. Endocrinol. 2019, 180, P23–P54. [Google Scholar] [CrossRef]
- Beyazgül, G.; Bağ, Ö.; Yurtseven, İ.; Coşkunol, F.; Başer, S.; Çiçek, D.; Kanberoğlu, G.İ.; Çelik, F.; Nalbantoğlu, Ö.; Özkan, B. How Vitamin D Levels of Children Changed during COVID-19 Pandemic: A Comparison of Pre-pandemic and Pandemic Periods. J. Clin. Res. Pediatr. Endocrinol. 2022, 14, 188–195. [Google Scholar] [CrossRef]
- Kang, H.M.; Jeong, D.C.; Suh, B.K.; Ahn, M.B. The Impact of the Coronavirus Disease-2019 Pandemic on Childhood Obesity and Vitamin D Status. J. Korean Med. Sci. 2021, 36, e21. [Google Scholar] [CrossRef]
- Cui, X.; Zhai, Y.; Wang, S.; Ding, K.; Yang, Z.; Tian, Y.; Huo, T. Effect of the COVID-19 Pandemic on Serum Vitamin D Levels in People under Age 18 Years: A Systematic Review and Meta-Analysis. Med. Sci. Monit. 2022, 28, e935823. [Google Scholar] [CrossRef]
- Ferrari, D.; Locatelli, M.; Faraldi, M.; Lombardi, G. Changes in 25-(OH) Vitamin D Levels during the SARS-CoV-2 Outbreak: Lockdown-Related Effects and First-to-Second Wave Difference—An Observational Study from Northern Italy. Biology 2021, 10, 237. [Google Scholar] [CrossRef] [PubMed]
- Lippi, G.; Ferrari, A.; Targher, G. Is COVID-19 lockdown associated with vitamin D deficiency? Eur. J. Public Health 2021, 31, 278–279. [Google Scholar] [CrossRef] [PubMed]
- Kwon, J.Y.; Kang, S.G. Changes in Vitamin D Status in Korean Adults during the COVID-19 Pandemic. Nutrients 2022, 14, 4863. [Google Scholar] [CrossRef] [PubMed]
- Grant, W.B.; Lahore, H.; McDonnell, S.L.; Baggerly, C.A.; French, C.B.; Aliano, J.L.; Bhattoa, H.P. Evidence that Vitamin D Supplementation Could Reduce Risk of Influenza and COVID-19 Infections and Deaths. Nutrients 2020, 12, 988. [Google Scholar] [CrossRef]
- Pereira, M.; Dantas Damascena, A.; Galvão Azevedo, L.M.; de Almeida Oliveira, T.; da Mota Santana, J. Vitamin D deficiency aggravates COVID-19: Systematic review and meta-analysis. Crit. Rev. Food Sci. Nutr. 2022, 62, 1308–1316, Update in Crit. Rev. Food Sci. Nutr. 2021, 63, 1–6. [Google Scholar] [CrossRef]
- Dissanayake, H.A.; de Silva, N.L.; Sumanatilleke, M.; de Silva, S.D.N.; Gamage, K.K.K.; Dematapitiya, C.; Kuruppu, D.C.; Ranasinghe, P.; Pathmanathan, S.; Katulanda, P. Prognostic and Therapeutic Role of Vitamin D in COVID-19: Systematic Review and Meta-analysis. J. Clin. Endocrinol. Metab. 2022, 107, 1484–1502. [Google Scholar] [CrossRef]
- Wimalawansa, S.J. Rapidly Increasing Serum 25(OH)D Boosts the Immune System, against Infections-Sepsis and COVID-19. Nutrients 2022, 14, 2997. [Google Scholar] [CrossRef]
- National Institute for Health and Care Excellence (NICE). COVID-19 Rapid Guideline: Vitamin D; National Institute for Health and Care Excellence (NICE): London, UK, 2020. [Google Scholar]
- McKenna, M.J.; Lyons, O.C.; Flynn, M.A.; Crowley, R.K.; Twomey, P.J.; Kilbane, M.T. COVID-19 pandemic and vitamin D: Rising trends in status and in daily amounts of vitamin D provided by supplements. BMJ Open 2022, 12, e059477. [Google Scholar] [CrossRef]
- Martineau, A.R.; Jolliffe, D.A.; Hooper, R.L.; Greenberg, L.; Aloia, J.F.; Bergman, P.; Dubnov-Raz, G.; Esposito, S.; Ganmaa, D.; Ginde, A.A.; et al. Vitamin D supplementation to prevent acute respiratory tract infections: Systematic review and meta-analysis of individual participant data. BMJ 2017, 356, i6583. [Google Scholar] [CrossRef]
- Jolliffe, D.A.; Camargo, C.A., Jr.; Sluyter, J.D.; Aglipay, M.; Aloia, J.F.; Ganmaa, D.; Bergman, P.; Bischoff-Ferrari, H.A.; Borzutzky, A.; Damsgaard, C.T.; et al. Vitamin D supplementation to prevent acute respiratory infections: A systematic review and meta-analysis of aggregate data from randomised controlled trials. Lancet Diabetes Endocrinol. 2021, 9, 276–292. [Google Scholar] [CrossRef]
- D’Ecclesiis, O.; Gavioli, C.; Martinoli, C.; Raimondi, S.; Chiocca, S.; Miccolo, C.; Bossi, P.; Cortinovis, D.; Chiaradonna, F.; Palorini, R.; et al. Vitamin D and SARS-CoV2 infection, severity and mortality: A systematic review and meta-analysis. PLoS ONE 2022, 17, e0268396. [Google Scholar] [CrossRef] [PubMed]
- Tentolouris, N.; Samakidou, G.; Eleftheriadou, I.; Tentolouris, A.; Jude, E.B. The effect of vitamin D supplementation on mortality and intensive care unit admission of COVID-19 patients. A systematic review, meta-analysis and meta-regression. Diabetes Metab. Res. Rev. 2022, 38, e3517. [Google Scholar] [CrossRef] [PubMed]
- Hosseini, B.; El Abd, A.; Ducharme, F.M. Effects of Vitamin D Supplementation on COVID-19 Related Outcomes: A Systematic Review and Meta-Analysis. Nutrients 2022, 14, 2134. [Google Scholar] [CrossRef] [PubMed]
- Kümmel, L.S.; Krumbein, H.; Fragkou, P.C.; Hünerbein, B.L.; Reiter, R.; Papathanasiou, K.A.; Thölken, C.; Weiss, S.T.; Renz, H.; Skevaki, C. Vitamin D supplementation for the treatment of COVID-19: A systematic review and meta-analysis of randomized controlled trials. Front. Immunol. 2022, 13, 1023903. [Google Scholar] [CrossRef] [PubMed]
- Giustina, A.; Adler, R.A.; Binkley, N.; Bollerslev, J.; Bouillon, R.; Dawson-Hughes, B.; Ebeling, P.R.; Feldman, D.; Formenti, A.M.; Lazaretti-Castro, M.; et al. Consensus statement from 2nd International Conference on Controversies in Vitamin D. Rev. Endocr. Metab. Disord. 2020, 21, 89–116. [Google Scholar] [CrossRef] [PubMed]
- Gibbons, J.B.; Norton, E.C.; McCullough, J.S.; Meltzer, D.O.; Lavigne, J.; Fiedler, V.C.; Gibbons, R.D. Association between vitamin D supplementation and COVID-19 infection and mortality. Sci. Rep. 2022, 12, 19397. [Google Scholar] [CrossRef]
- Jain, A.; Chaurasia, R.; Sengar, N.S.; Singh, M.; Mahor, S.; Narain, S. Analysis of vitamin D level among asymptomatic and critically ill COVID-19 patients and its correlation with inflammatory markers. Sci. Rep. 2020, 10, 20191. [Google Scholar] [CrossRef]
- Huțanu, A.; Georgescu, A.M.; Voidăzan, S.; Andrejkovits, A.V.; Negrea, V.; Dobreanu, M. Low Serum Vitamin D in COVID-19 Patients Is Not Related to Inflammatory Markers and Patients’ Outcomes—A Single-Center Experience and a Brief Review of the Literature. Nutrients 2022, 14, 1998. [Google Scholar] [CrossRef]
- Kreutz, M.; Andreesen, R. Induction of human monocyte to macrophage maturation in vitro by 1,25-dihydroxyvitamin D3. Blood 1990, 76, 2457–2461. [Google Scholar] [CrossRef]
- Gayan-Ramirez, G.; Janssens, W. Vitamin D Actions: The Lung Is a Major Target for Vitamin D, FGF23, and Klotho. JBMR Plus 2021, 5, e10569. [Google Scholar] [CrossRef]
- Knoll, R.; Schultze, J.L.; Schulte-Schrepping, J. Monocytes and Macrophages in COVID-19. Front. Immunol. 2021, 12, 720109. [Google Scholar] [CrossRef] [PubMed]
- Meidaninikjeh, S.; Sabouni, N.; Marzouni, H.Z.; Bengar, S.; Khalili, A.; Jafari, R. Monocytes and macrophages in COVID-19: Friends and foes. Life Sci. 2021, 269, 119010. [Google Scholar] [CrossRef] [PubMed]
- Bertoldo, F.; Pancheri, S.; Zenari, S.; Boldini, S.; Giovanazzi, B.; Zanatta, M.; Valenti, M.T.; Dalle Carbonare, L.; Lo Cascio, V. Serum 25-hydroxyvitamin D levels modulate the acute-phase response associated with the first nitrogen-containing bisphosphonate infusion. J. Bone Miner. Res. 2010, 25, 447–454. [Google Scholar] [CrossRef] [PubMed]
- Krishnan, A.; Ochola, J.; Mundy, J.; Jones, M.; Kruger, P.; Duncan, E.; Venkatesh, B. Acute fluid shifts influence the assessment of serum vitamin D status in critically ill patients. Crit. Care 2010, 14, R216. [Google Scholar] [CrossRef] [PubMed]
- Waldron, J.L.; Ashby, H.L.; Cornes, M.P.; Bechervaise, J.; Razavi, C.; Thomas, O.L.; Chugh, S.; Deshpande, S.; Ford, C.; Gama, R. Vitamin D: A negative acute phase reactant. J. Clin. Pathol. 2013, 66, 620–622. [Google Scholar] [CrossRef] [PubMed]
- Smolders, J.; van den Ouweland, J.; Geven, C.; Pickkers, P.; Kox, M. Letter to the Editor: Vitamin D deficiency in COVID-19: Mixing up cause and consequence. Metabolism 2021, 115, 154434. [Google Scholar] [CrossRef] [PubMed]
- Neely, S.R.; Eldredge, C.; Ersing, R.; Remington, C. Vaccine Hesitancy and Exposure to Misinformation: A Survey Analysis. J. Gen. Intern. Med. 2022, 37, 179–187. [Google Scholar] [CrossRef]
- Quinn, E.K.; Fenton, S.; Ford-Sahibzada, C.A.; Harper, A.; Marcon, A.R.; Caulfield, T.; Fazel, S.S.; Peters, C.E. COVID-19 and Vitamin D Misinformation on YouTube: Content Analysis. JMIR Infodemiology 2022, 2, e32452. [Google Scholar] [CrossRef]
- Our World in Data. Available online: https://ourworldindata.org/coronavirus#explore-the-global-situation (accessed on 15 February 2023).
- Shaw, N.M.; Hakam, N.; Lui, J.; Abbasi, B.; Sudhakar, A.; Leapman, M.S.; Breyer, B.N. COVID-19 Misinformation and Social Network Crowdfunding: Cross-sectional Study of Alternative Treatments and Antivaccine Mandates. J. Med. Internet Res. 2022, 24, e38395. [Google Scholar] [CrossRef]
- Rachul, C.; Marcon, A.R.; Collins, B.; Caulfield, T. COVID-19 and ‘immune boosting’ on the internet: A content analysis of Google search results. BMJ Open 2020, 10, e040989. [Google Scholar] [CrossRef]
- Mason, R.S.; Rybchyn, M.S.; Abboud, M.; Brennan-Speranza, T.C.; Fraser, D.R. The Role of Skeletal Muscle in Maintaining Vitamin D Status in Winter. Curr. Dev. Nutr. 2019, 3, nzz087. [Google Scholar] [CrossRef] [PubMed]
- Kim, C.S.; Kim, S.W. Vitamin D and chronic kidney disease. Korean J. Intern. Med. 2014, 29, 416–427. [Google Scholar] [CrossRef] [PubMed]
- Hilpert, J.; Wogensen, L.; Thykjaer, T.; Wellner, M.; Schlichting, U.; Orntoft, T.F.; Bachmann, S.; Nykjaer, A.; Willnow, T.E. Expression profiling confirms the role of endocytic receptor megalin in renal vitamin D3 metabolism. Kidney Int. 2002, 62, 1672–1681. [Google Scholar] [CrossRef] [PubMed]
- Franca Gois, P.H.; Wolley, M.; Ranganathan, D.; Seguro, A.C. Vitamin D Deficiency in Chronic Kidney Disease: Recent Evidence and Controversies. Int. J. Environ. Res. Public Health 2018, 15, 1773. [Google Scholar] [CrossRef] [PubMed]


| Variable | Group 1 (n = 101) | Group 2 (n = 101) | p Value |
|---|---|---|---|
| Age (years) | 70 ± 14 | 70 ± 14 | N/A |
| Males/females, n (%) | 61 (60%)/40 (40%) | 61 (60%)/40 (40%) | N/A |
| Survivors/Non-survivors, n (%) | 57 (56%)/44 (44%) | 63 (62%)/38 (38%) | 0.58 |
| BMI (kg/m2) | 29 ± 5.8 | 29 ± 6.7 | 0.96 |
| Vitamin D supplementation before hospitalization, n (%) Duration of dyspnea before hospitalization (days) | 18 (18%) | 44 (44%) | <0.0001 |
| 25(OH)D (ng/mL) | 17.8 ± 9.7 | 25.2 ± 12.6 | <0.0001 |
| Vitamin D sufficiency, n (%) * | 10 (10%) | 34 (34%) | <0.0001 |
| Vitamin D insufficiency, n (%) | 8 (85%) | 13 (12%) | <0.0001 |
| Vitamin D deficiency, n (%) | 83 (82%) | 54 (54%) | <0.0001 |
| Arterial hypertension, n (%) | 73 (72%) | 75 (74%) | 0.87 |
| Diabetes mellitus, n (%) | 42 (42%) | 41 (41%) | 0.91 |
| Chronic heart failure, n (%) | 15 (15%) | 25 (25%) | 0.11 |
| Chronic pulmonary disease, n (%) | 14 (14%) | 18 (18%) | 0.37 |
| Concomitant pulmonary embolism, n (%) | 10 (10%) | 13 (13%) | 0.43 |
| Anemia, n (%) | 23 (23%) | 25 (25%) | 0.62 |
| Dementia, n (%) | 13 (13%) | 28 (28%) | 0.01 |
| Cirrhosis, n (%) | 1 (1%) | 3 (3%) | 0.32 |
| Chronic kidney disease, n (%) | 35 (35%) | 13 (13%) | 0.001 |
| High flow oxygen, n (%) | 45 (45%) | 63 (63%) | 0.07 |
| Invasive mechanical ventilation, n (%) | 5 (5%) | 8 (8%) | 0.41 |
| Leukocytes (10 × 9/L) | 9.1 ± 4.7 | 11 ± 6.5 | 0.04 |
| Neutrophils (10 × 9/L) | 8.4 ± 8.7 | 10 ± 12 | 0.24 |
| Lymphocytes (10 × 9/L) | 1.1 ± 1.3 | 0.6 ± 0.5 | <0.0001 |
| Monocytes (10 × 9/L) | 0.6 ± 1.1 | 1.1 ± 0.6 | <0.0001 |
| C-reactive protein (mg/L) | 124 ± 84 | 139 ± 90 | 0.22 |
| Variable | Group 1 | Group 2 | p Value |
|---|---|---|---|
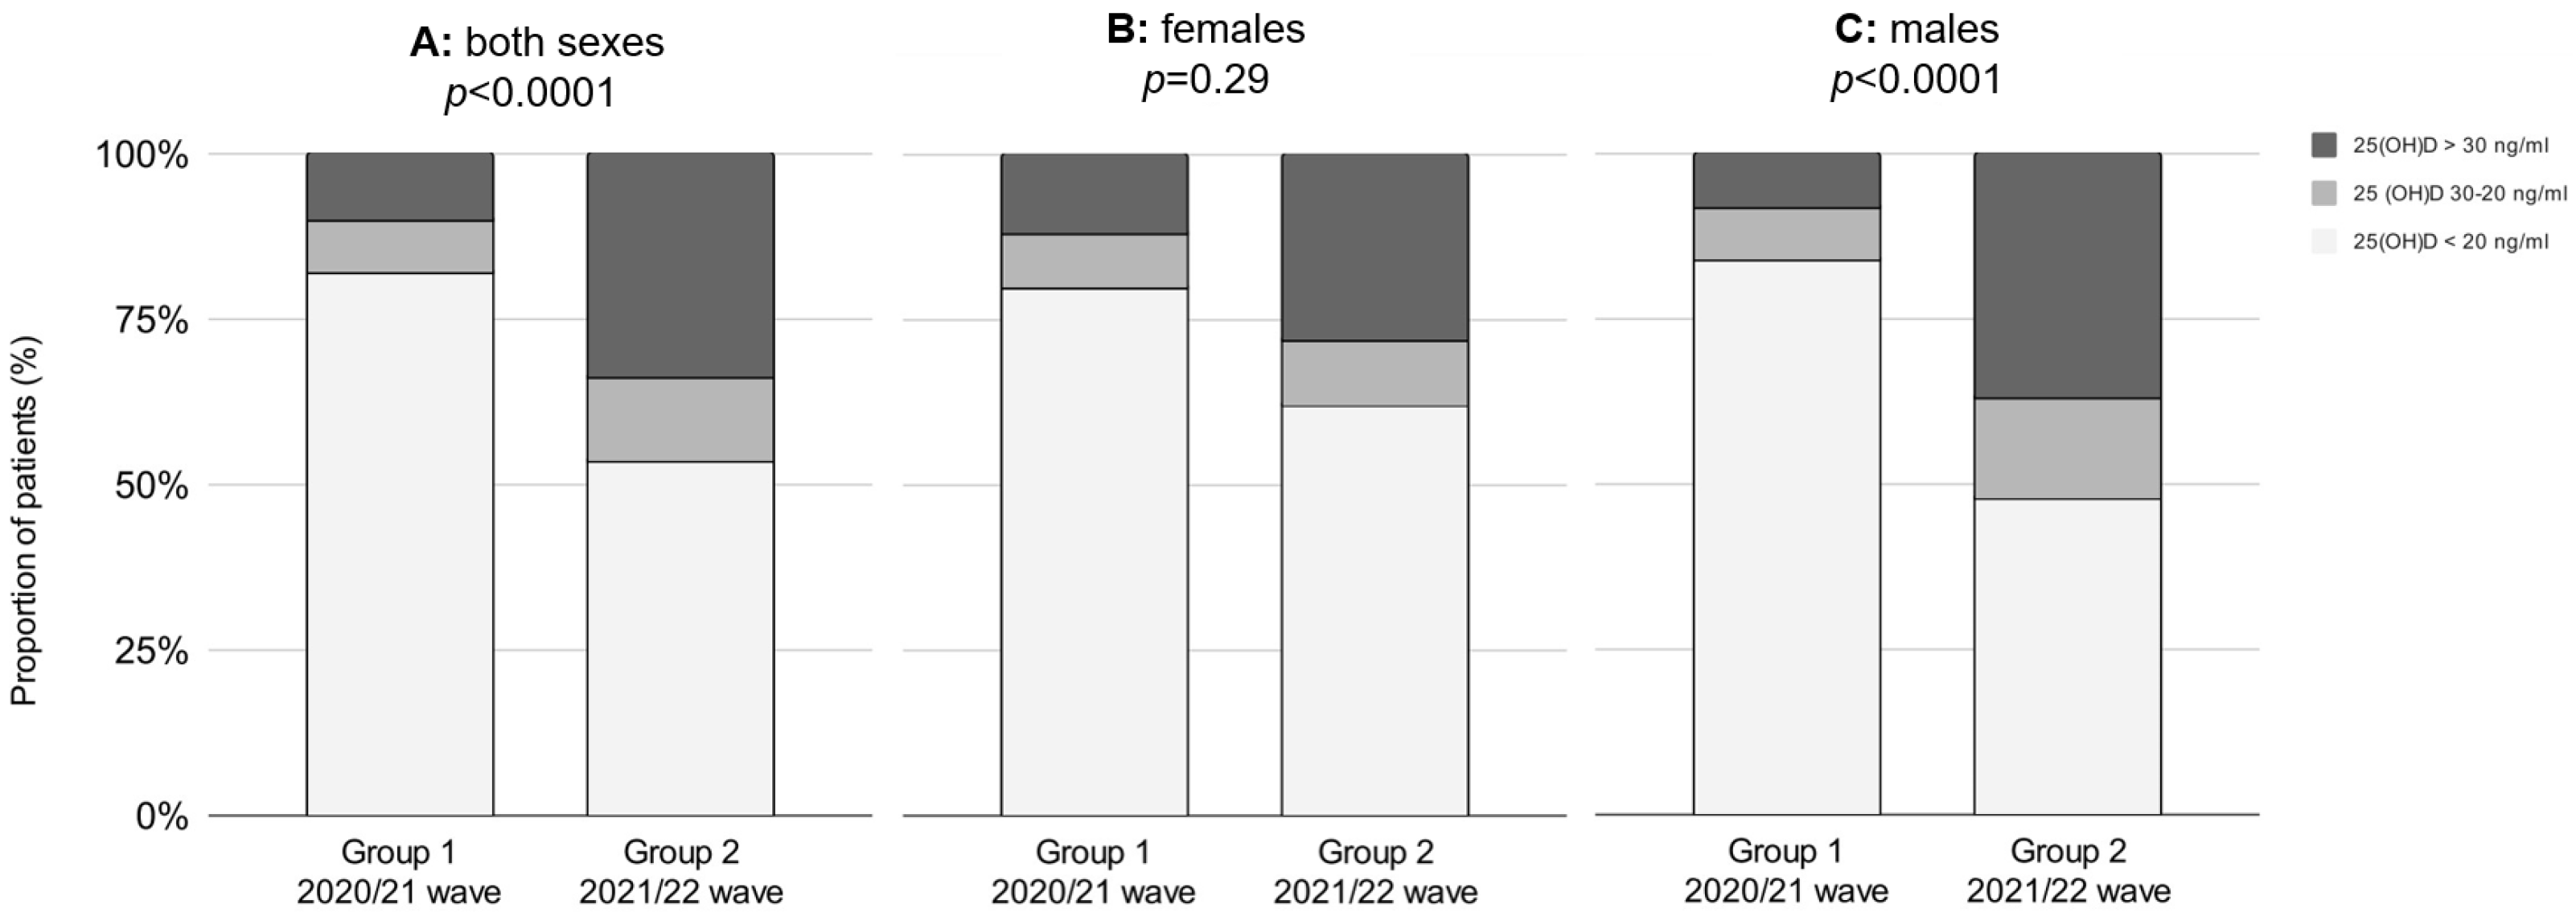
| Men | N = 61 | N = 61 | |
| 25(OH)D (ng/mL) | 17.2 ± 8.6 | 26.3 ± 12.8 | <0.0001 |
| Vitamin D sufficiency, n (%) * | 5 (8%) | 23 (37%) | |
| Vitamin D insufficiency, n (%) | 5 (8%) | 9 (15%) | <0.0001 |
| Vitamin D deficiency, n (%) | 51 (84%) | 30 (48%) | |
| Women | N = 40 | N = 40 | |
| 25(OH)D (ng/mL) | 18.7 ± 11.3 | 23.5 ± 12.4 | 0.07 |
| Vitamin D sufficiency, n (%) * | 5 (13%) | 11 (28%) | 0.29 |
| Vitamin D insufficiency, n (%) | 3 (7%) | 4 (10%) | |
| Vitamin D deficiency, n (%) | 32 (80%) | 24 (62%) |
| Sex | Age Group | Vitamin D Status | Group 1 | Group 2 | p Value |
|---|---|---|---|---|---|
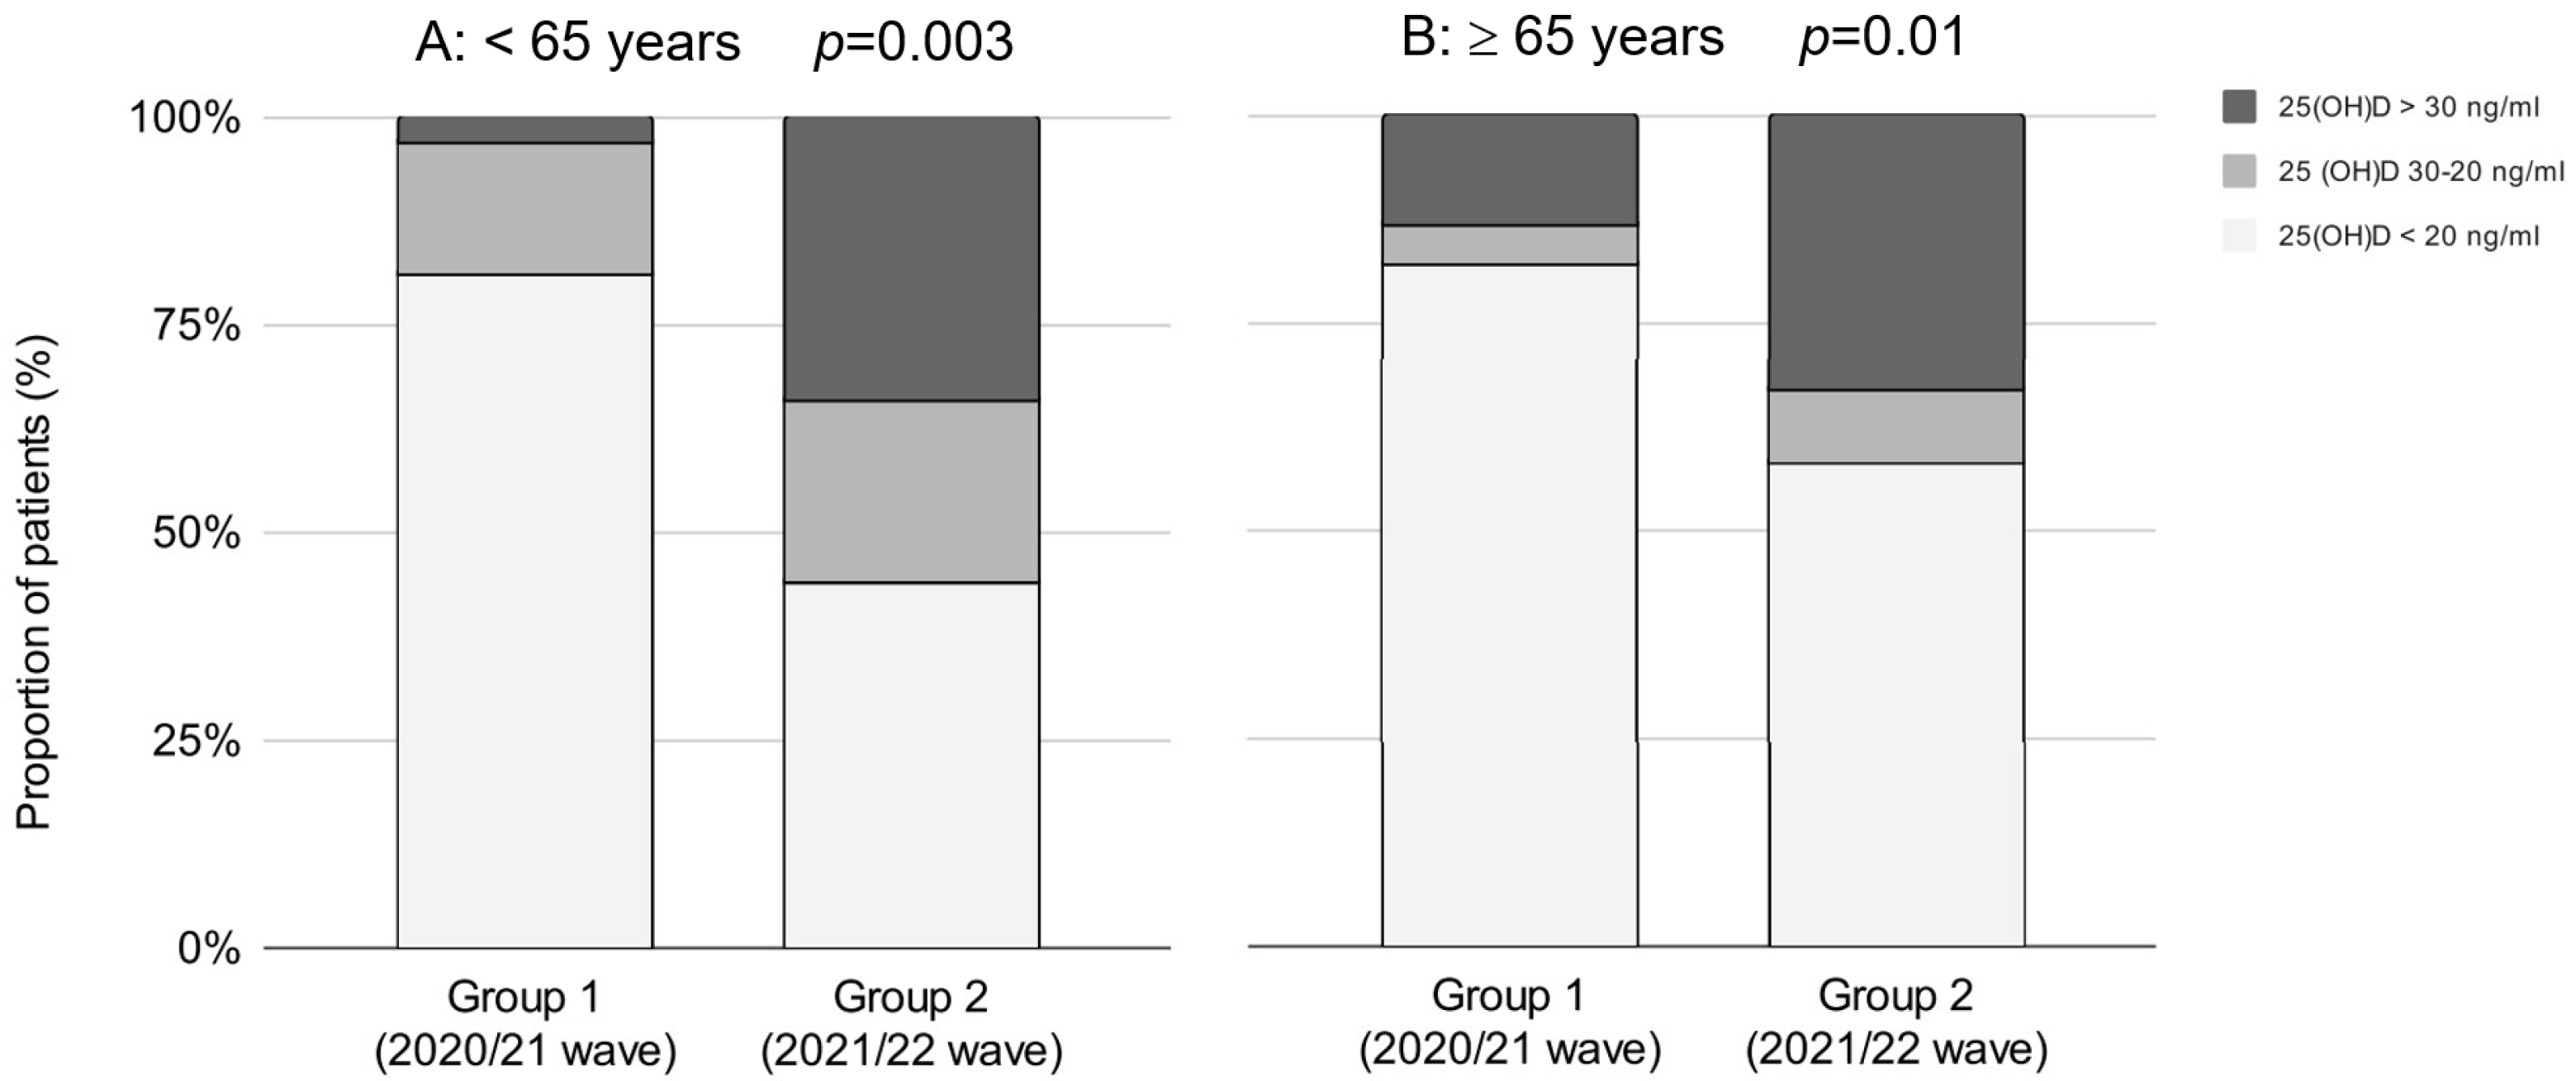
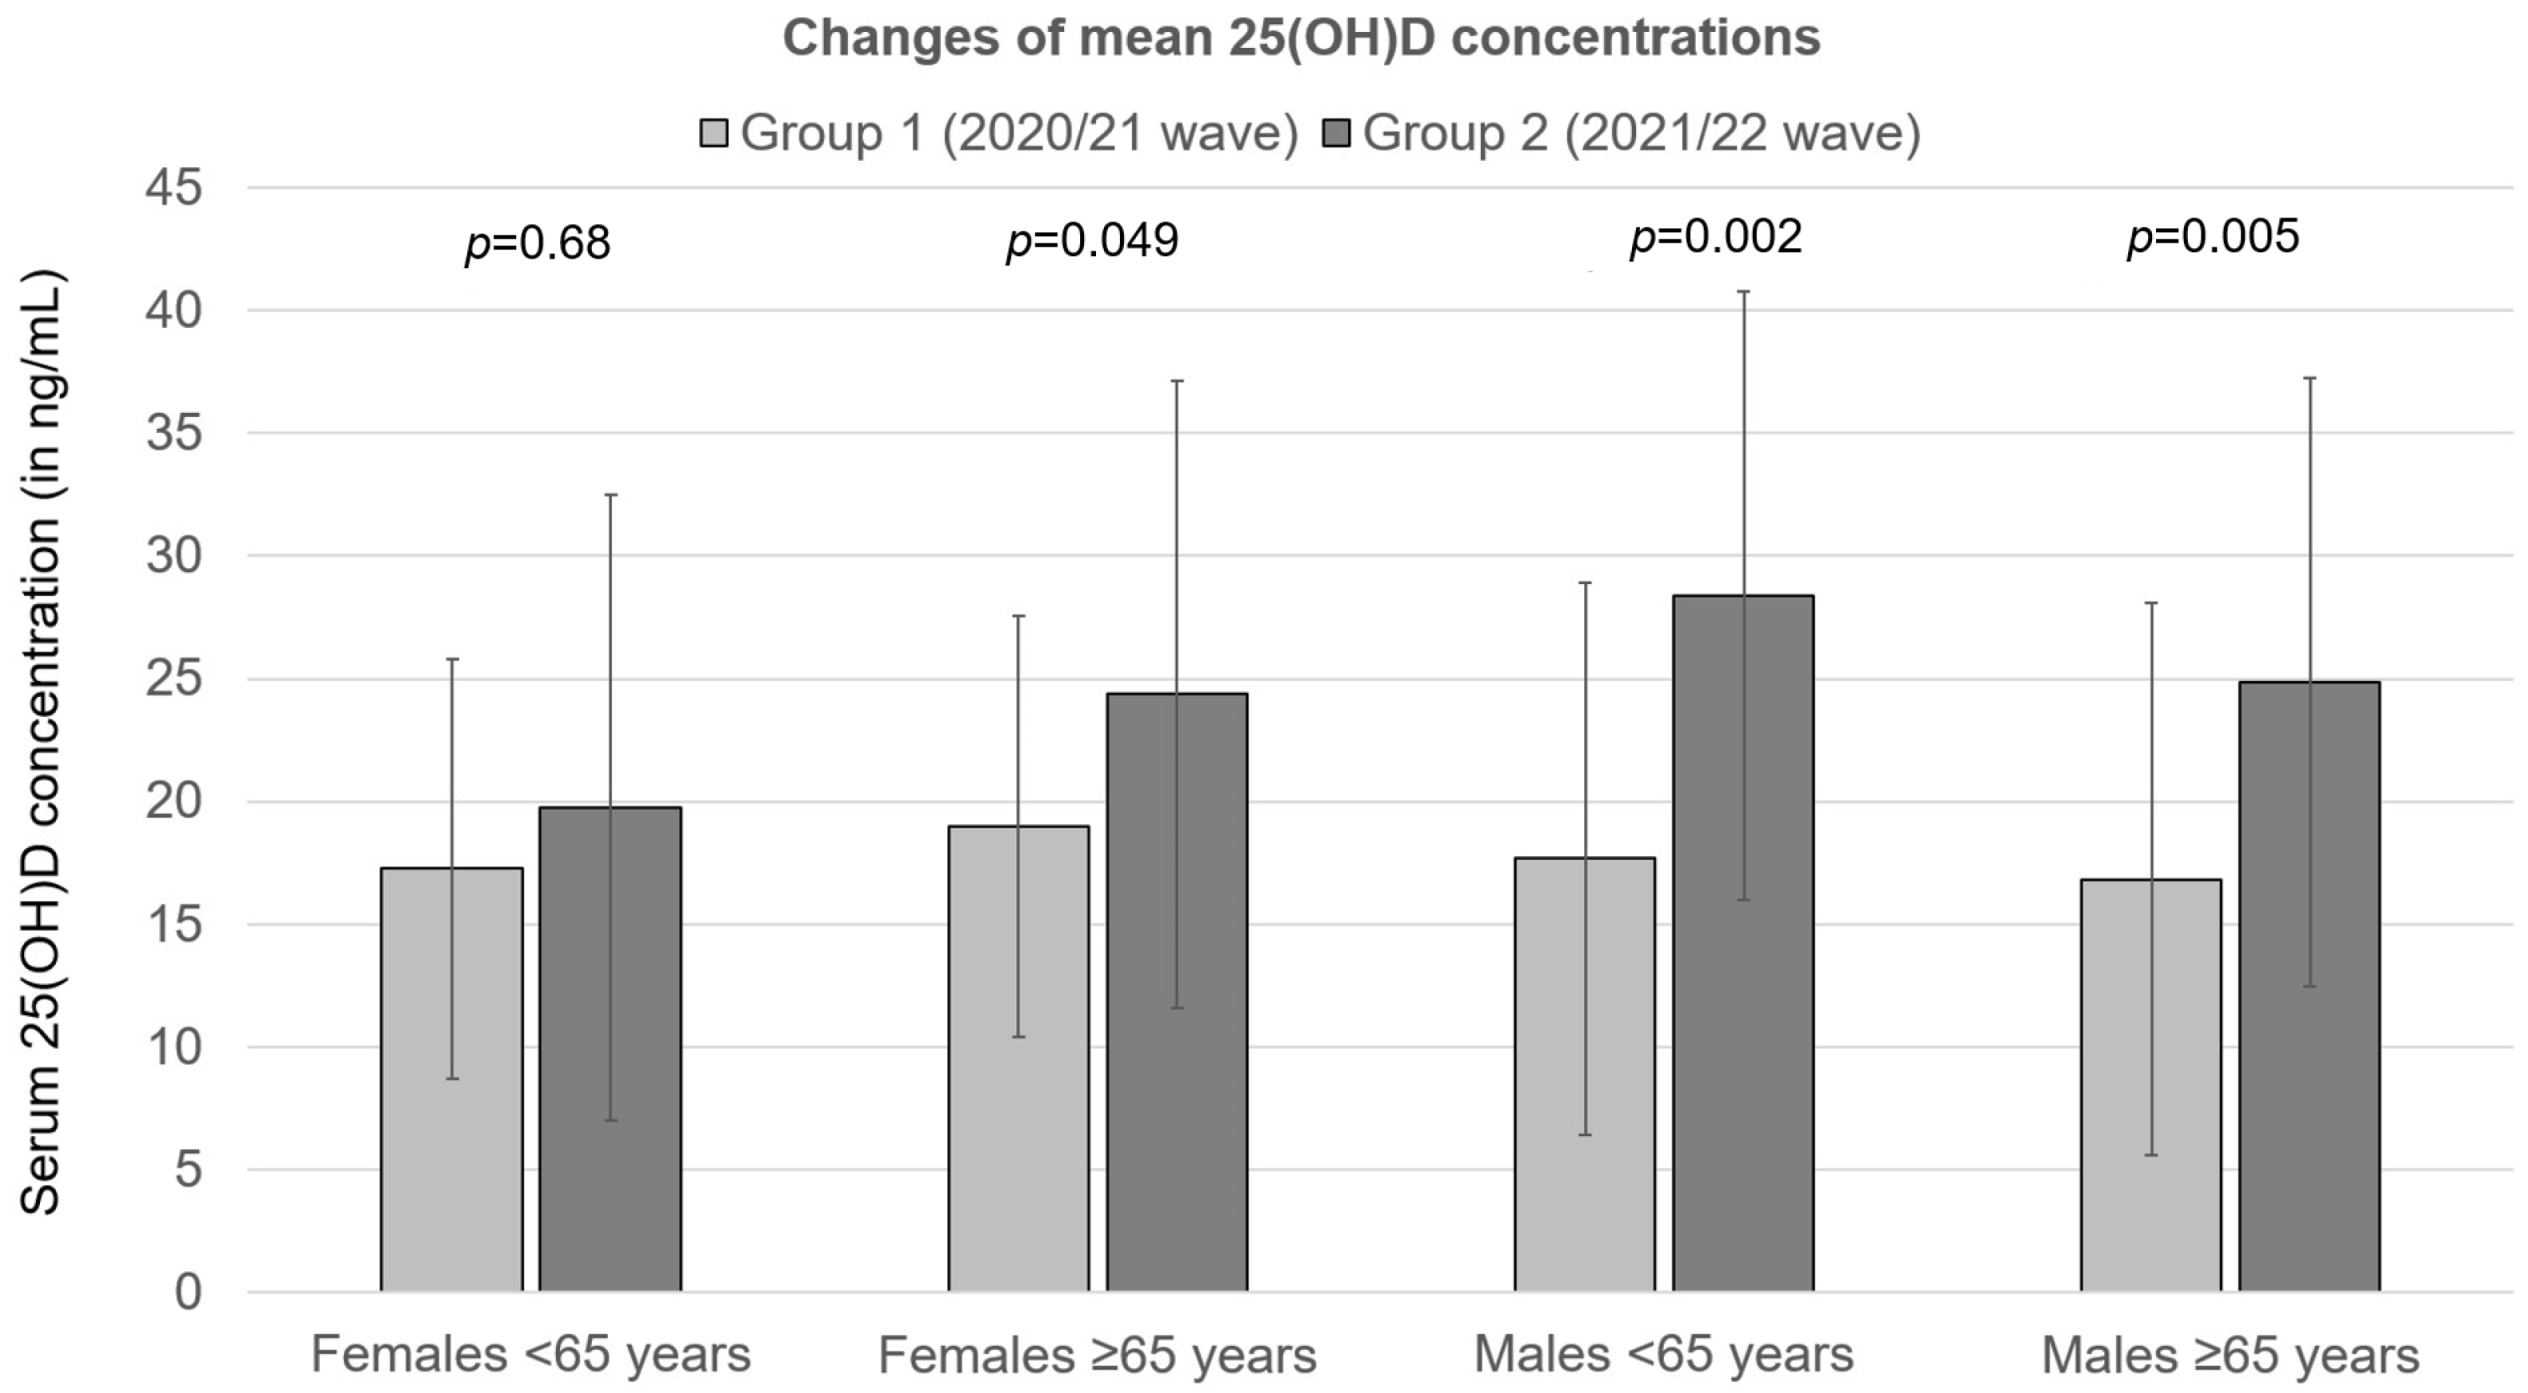
| Females | <65 years | 25(OH)D (ng/mL) | 17.3 ± 8.6 | 19.8 ± 12.8 | 0.68 |
| Vitamin D sufficiency, n (%) * | 0 (0%) | 1 (14%) | 0.68 | ||
| Vitamin D insufficiency, n (%) | 1 (14%) | 1 (14%) | |||
| Vitamin D deficiency, n (%) | 6 (86%) | 5 (72%) | |||
| ≥65 years | 25(OH)D (ng/mL) | 19 ± 8.6 | 24.4 ± 12.8 | 0.049 | |
| Vitamin D sufficiency, n (%) | 5 (15%) | 10 (31%) | 0.056 | ||
| Vitamin D insufficiency, n (%) | 2 (6%) | 3 (9%) | |||
| Vitamin D deficiency, n (%) | 26 (79%) | 19 (60%) | |||
| Males | <65 years | 25(OH)D (ng/mL) | 17.7 ± 11.3 | 28.4 ± 12.4 | 0.002 |
| Vitamin D sufficiency, n (%) | 1 (4%) | 10 (40%) | 0.001 | ||
| Vitamin D insufficiency, n (%) | 4 (16%) | 6 (24%) | |||
| Vitamin D deficiency, n (%) | 20 (80%) | 9 (36%) | |||
| ≥65 years | 25(OH)D (ng/mL) | 16.8 ± 11.3 | 24.8 ± 12.4 | 0.005 | |
| Vitamin D sufficiency, n (%) | 4 (11%) | 13 (35%) | 0.002 | ||
| Vitamin D insufficiency, n (%) | 1 (3%) | 3 (8%) | |||
| Vitamin D deficiency, n (%) | 31 (86%) | 21 (57%) |
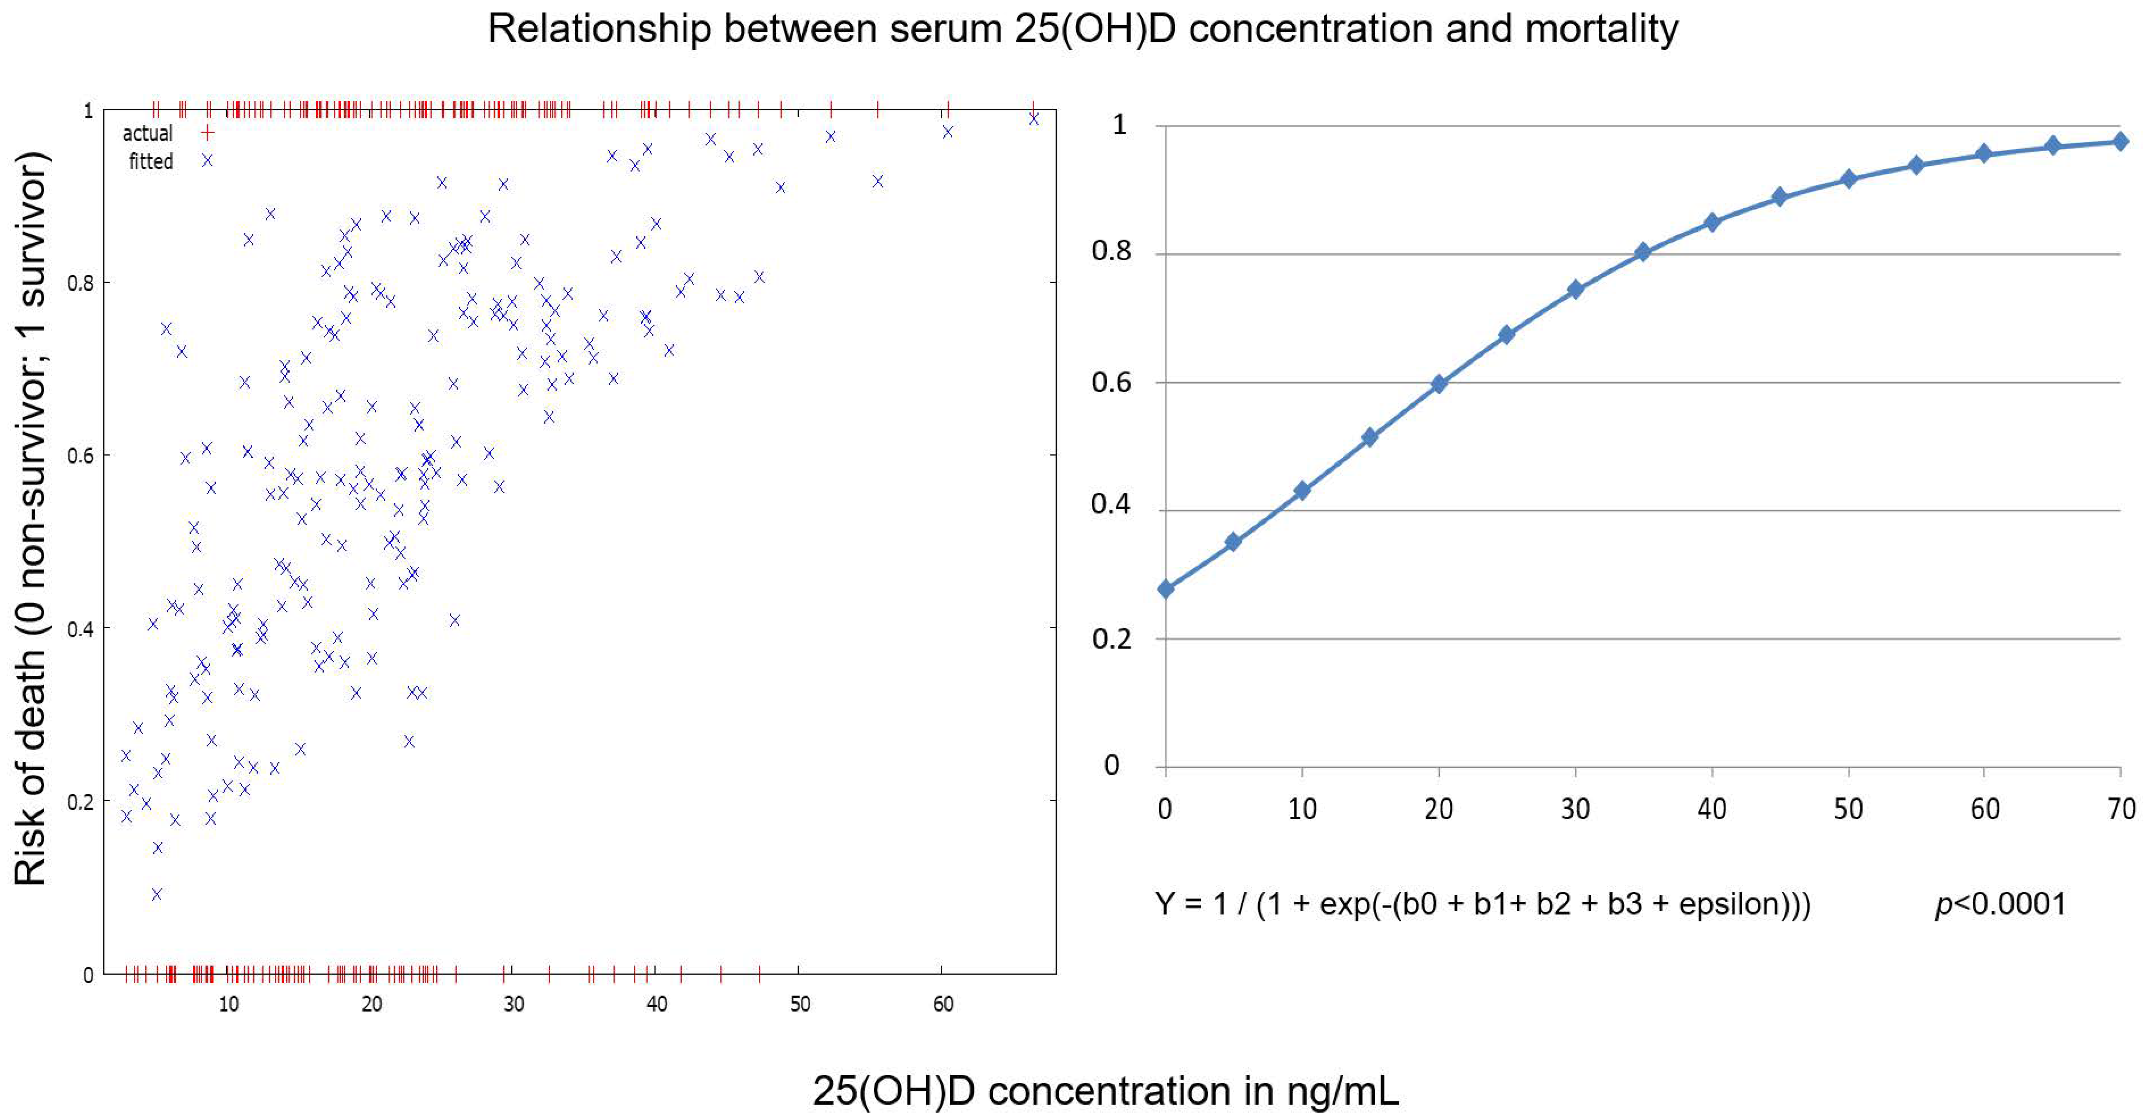
| Variable | Coefficient | Standard Error | t | p Value |
|---|---|---|---|---|
| Constant | −0.457 | 0.437 | −1.045 | 0.29 |
| Age | −0.052 | 0.013 | −4.050 | <0.0001 |
| Sex | −0.414 | 0.336 | −1.230 | 0.22 |
| 25(OH)D (ng/mL) | 0.067 | 0.017 | 4.023 | <0.0001 |
Disclaimer/Publisher’s Note: The statements, opinions and data contained in all publications are solely those of the individual author(s) and contributor(s) and not of MDPI and/or the editor(s). MDPI and/or the editor(s) disclaim responsibility for any injury to people or property resulting from any ideas, methods, instructions or products referred to in the content. |
© 2023 by the authors. Licensee MDPI, Basel, Switzerland. This article is an open access article distributed under the terms and conditions of the Creative Commons Attribution (CC BY) license (https://creativecommons.org/licenses/by/4.0/).
Share and Cite
Smaha, J.; Jackuliak, P.; Kužma, M.; Max, F.; Binkley, N.; Payer, J. Vitamin D Deficiency Prevalence in Hospitalized Patients with COVID-19 Significantly Decreased during the Pandemic in Slovakia from 2020 to 2022 Which Was Associated with Decreasing Mortality. Nutrients 2023, 15, 1132. https://doi.org/10.3390/nu15051132
Smaha J, Jackuliak P, Kužma M, Max F, Binkley N, Payer J. Vitamin D Deficiency Prevalence in Hospitalized Patients with COVID-19 Significantly Decreased during the Pandemic in Slovakia from 2020 to 2022 Which Was Associated with Decreasing Mortality. Nutrients. 2023; 15(5):1132. https://doi.org/10.3390/nu15051132
Chicago/Turabian StyleSmaha, Juraj, Peter Jackuliak, Martin Kužma, Filip Max, Neil Binkley, and Juraj Payer. 2023. "Vitamin D Deficiency Prevalence in Hospitalized Patients with COVID-19 Significantly Decreased during the Pandemic in Slovakia from 2020 to 2022 Which Was Associated with Decreasing Mortality" Nutrients 15, no. 5: 1132. https://doi.org/10.3390/nu15051132
APA StyleSmaha, J., Jackuliak, P., Kužma, M., Max, F., Binkley, N., & Payer, J. (2023). Vitamin D Deficiency Prevalence in Hospitalized Patients with COVID-19 Significantly Decreased during the Pandemic in Slovakia from 2020 to 2022 Which Was Associated with Decreasing Mortality. Nutrients, 15(5), 1132. https://doi.org/10.3390/nu15051132