
Oral Temperature and pH Influence Dietary Nitrate Metabolism in Healthy Adults


 ,
, 
Abstract
1. Introduction
2. Materials and Methods
2.1. Participant Characteristics
2.2. Experimental Design
2.3. Data Collection Procedures
2.4. [NO2−] and [NO3−] Analysis
2.5. Statistics
3. Results
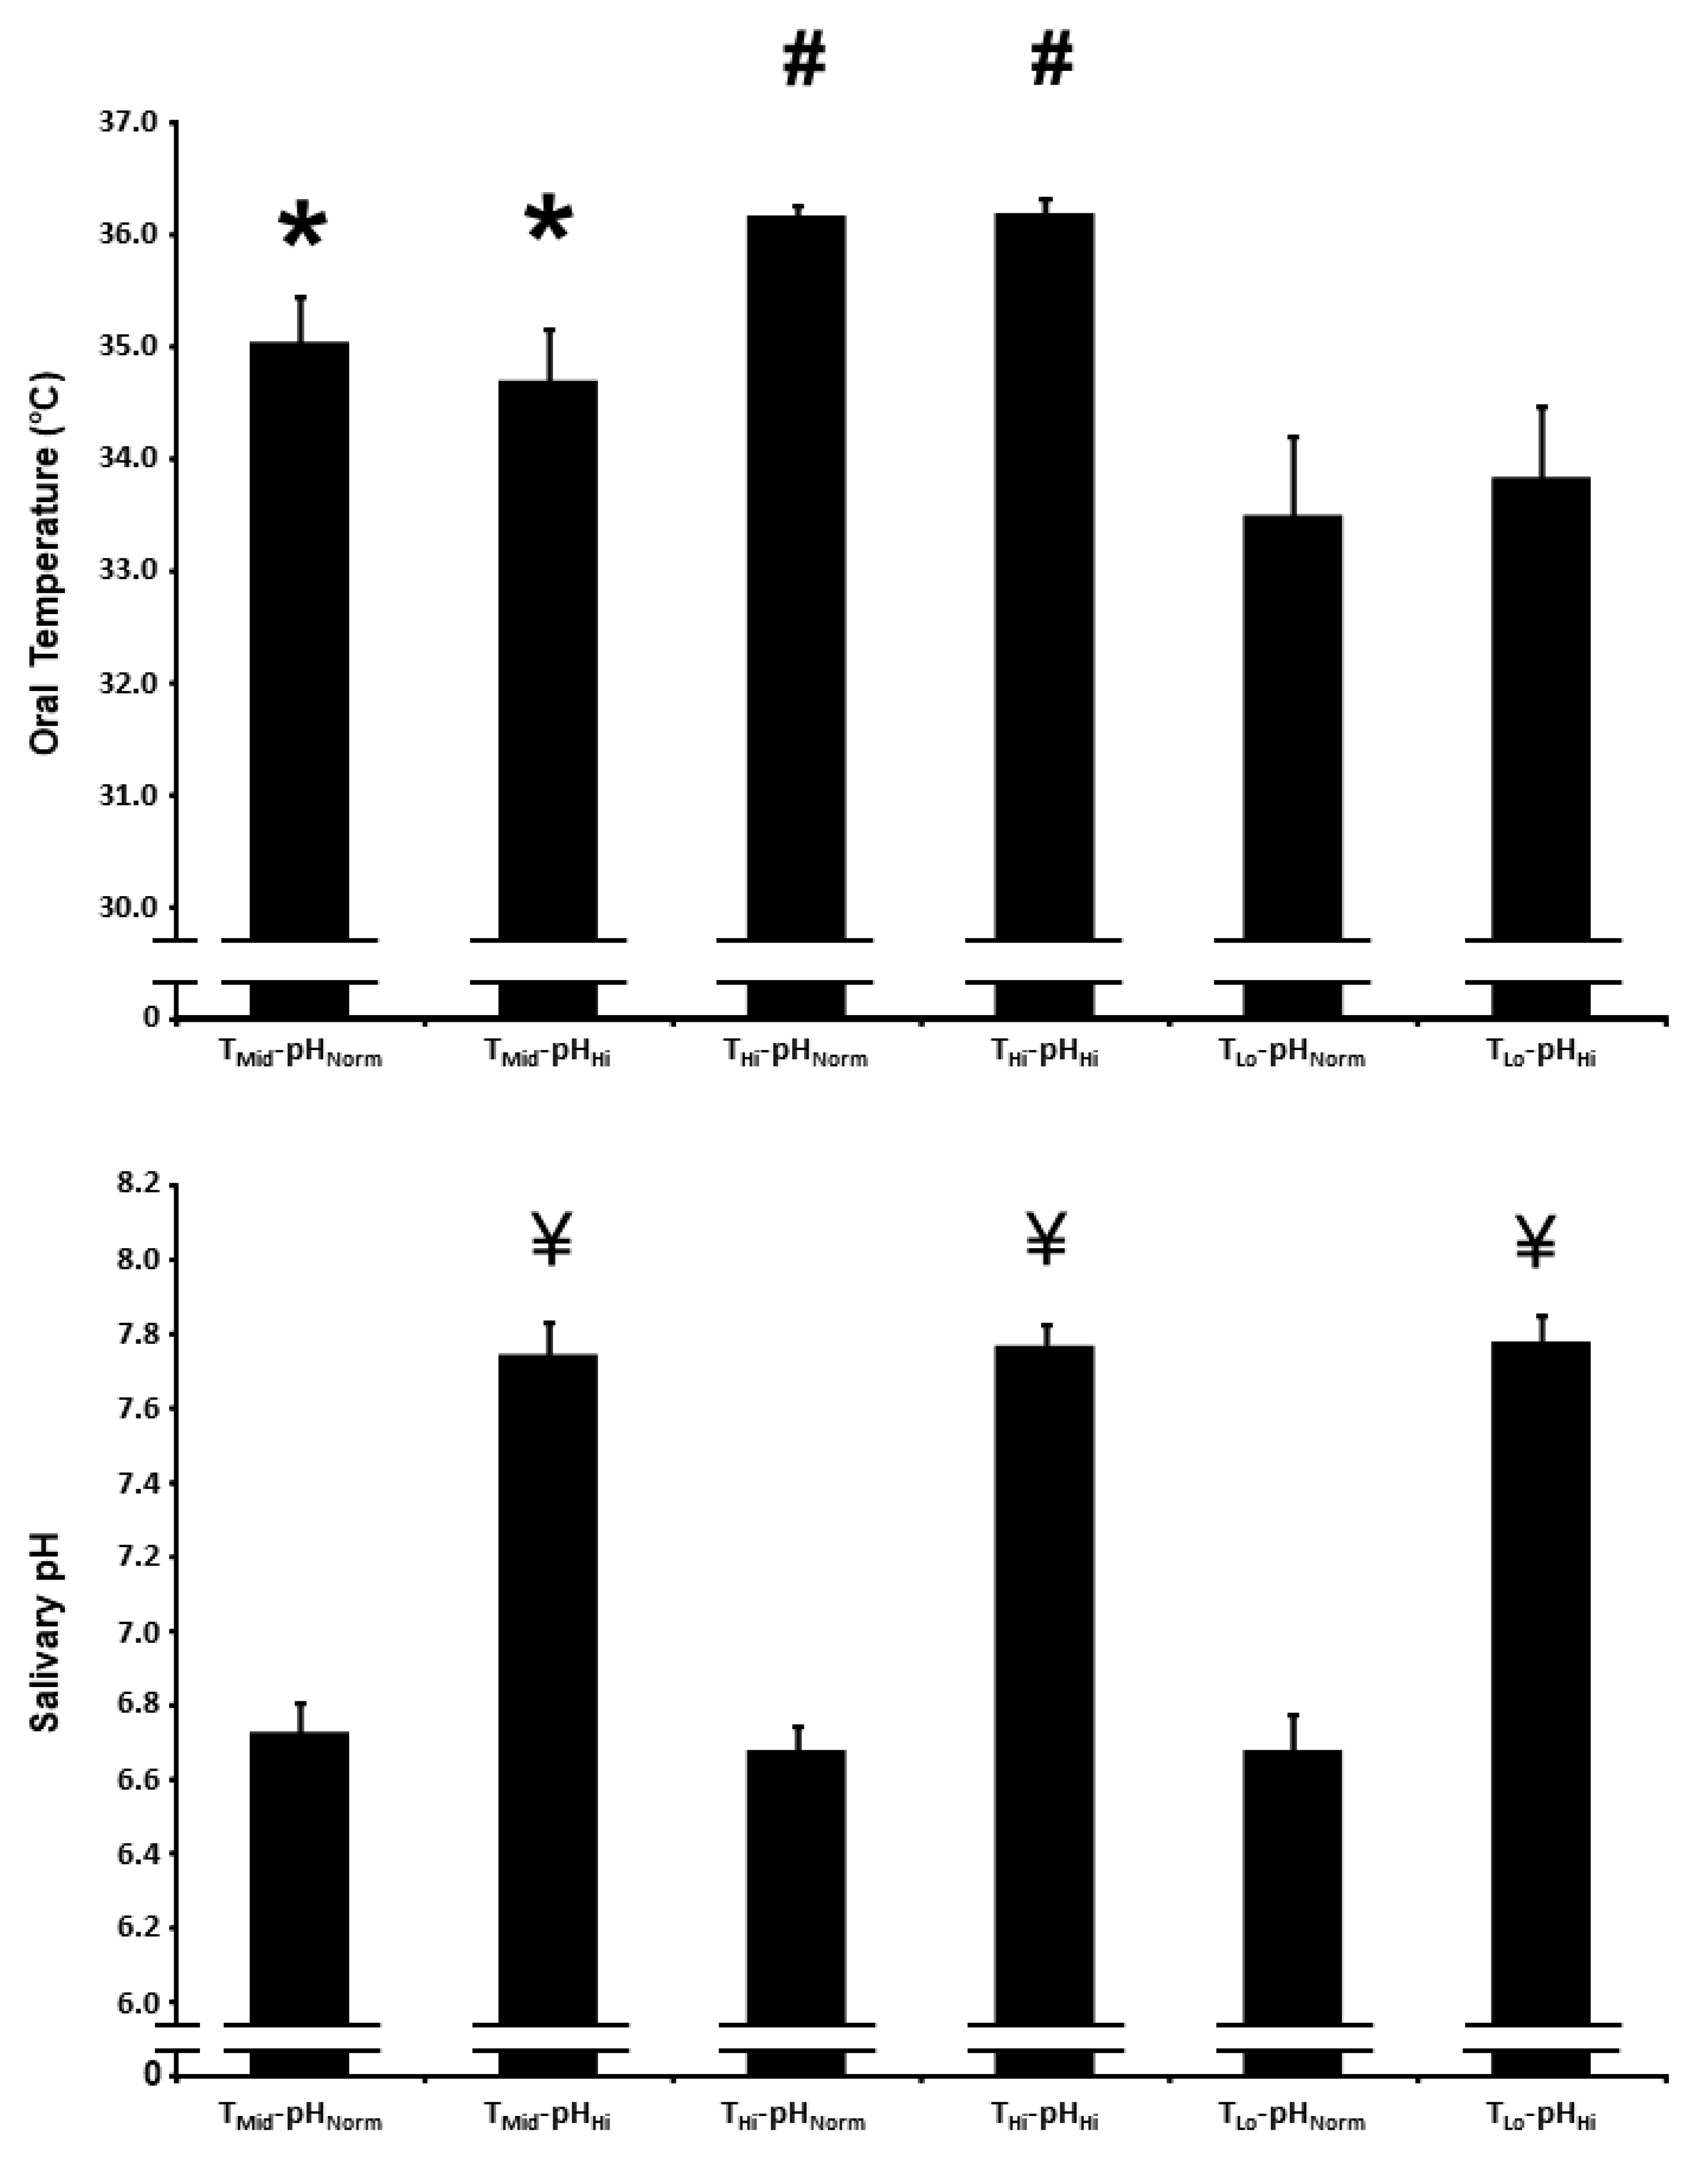
3.1. Oral Temperature
3.2. Salivary pH
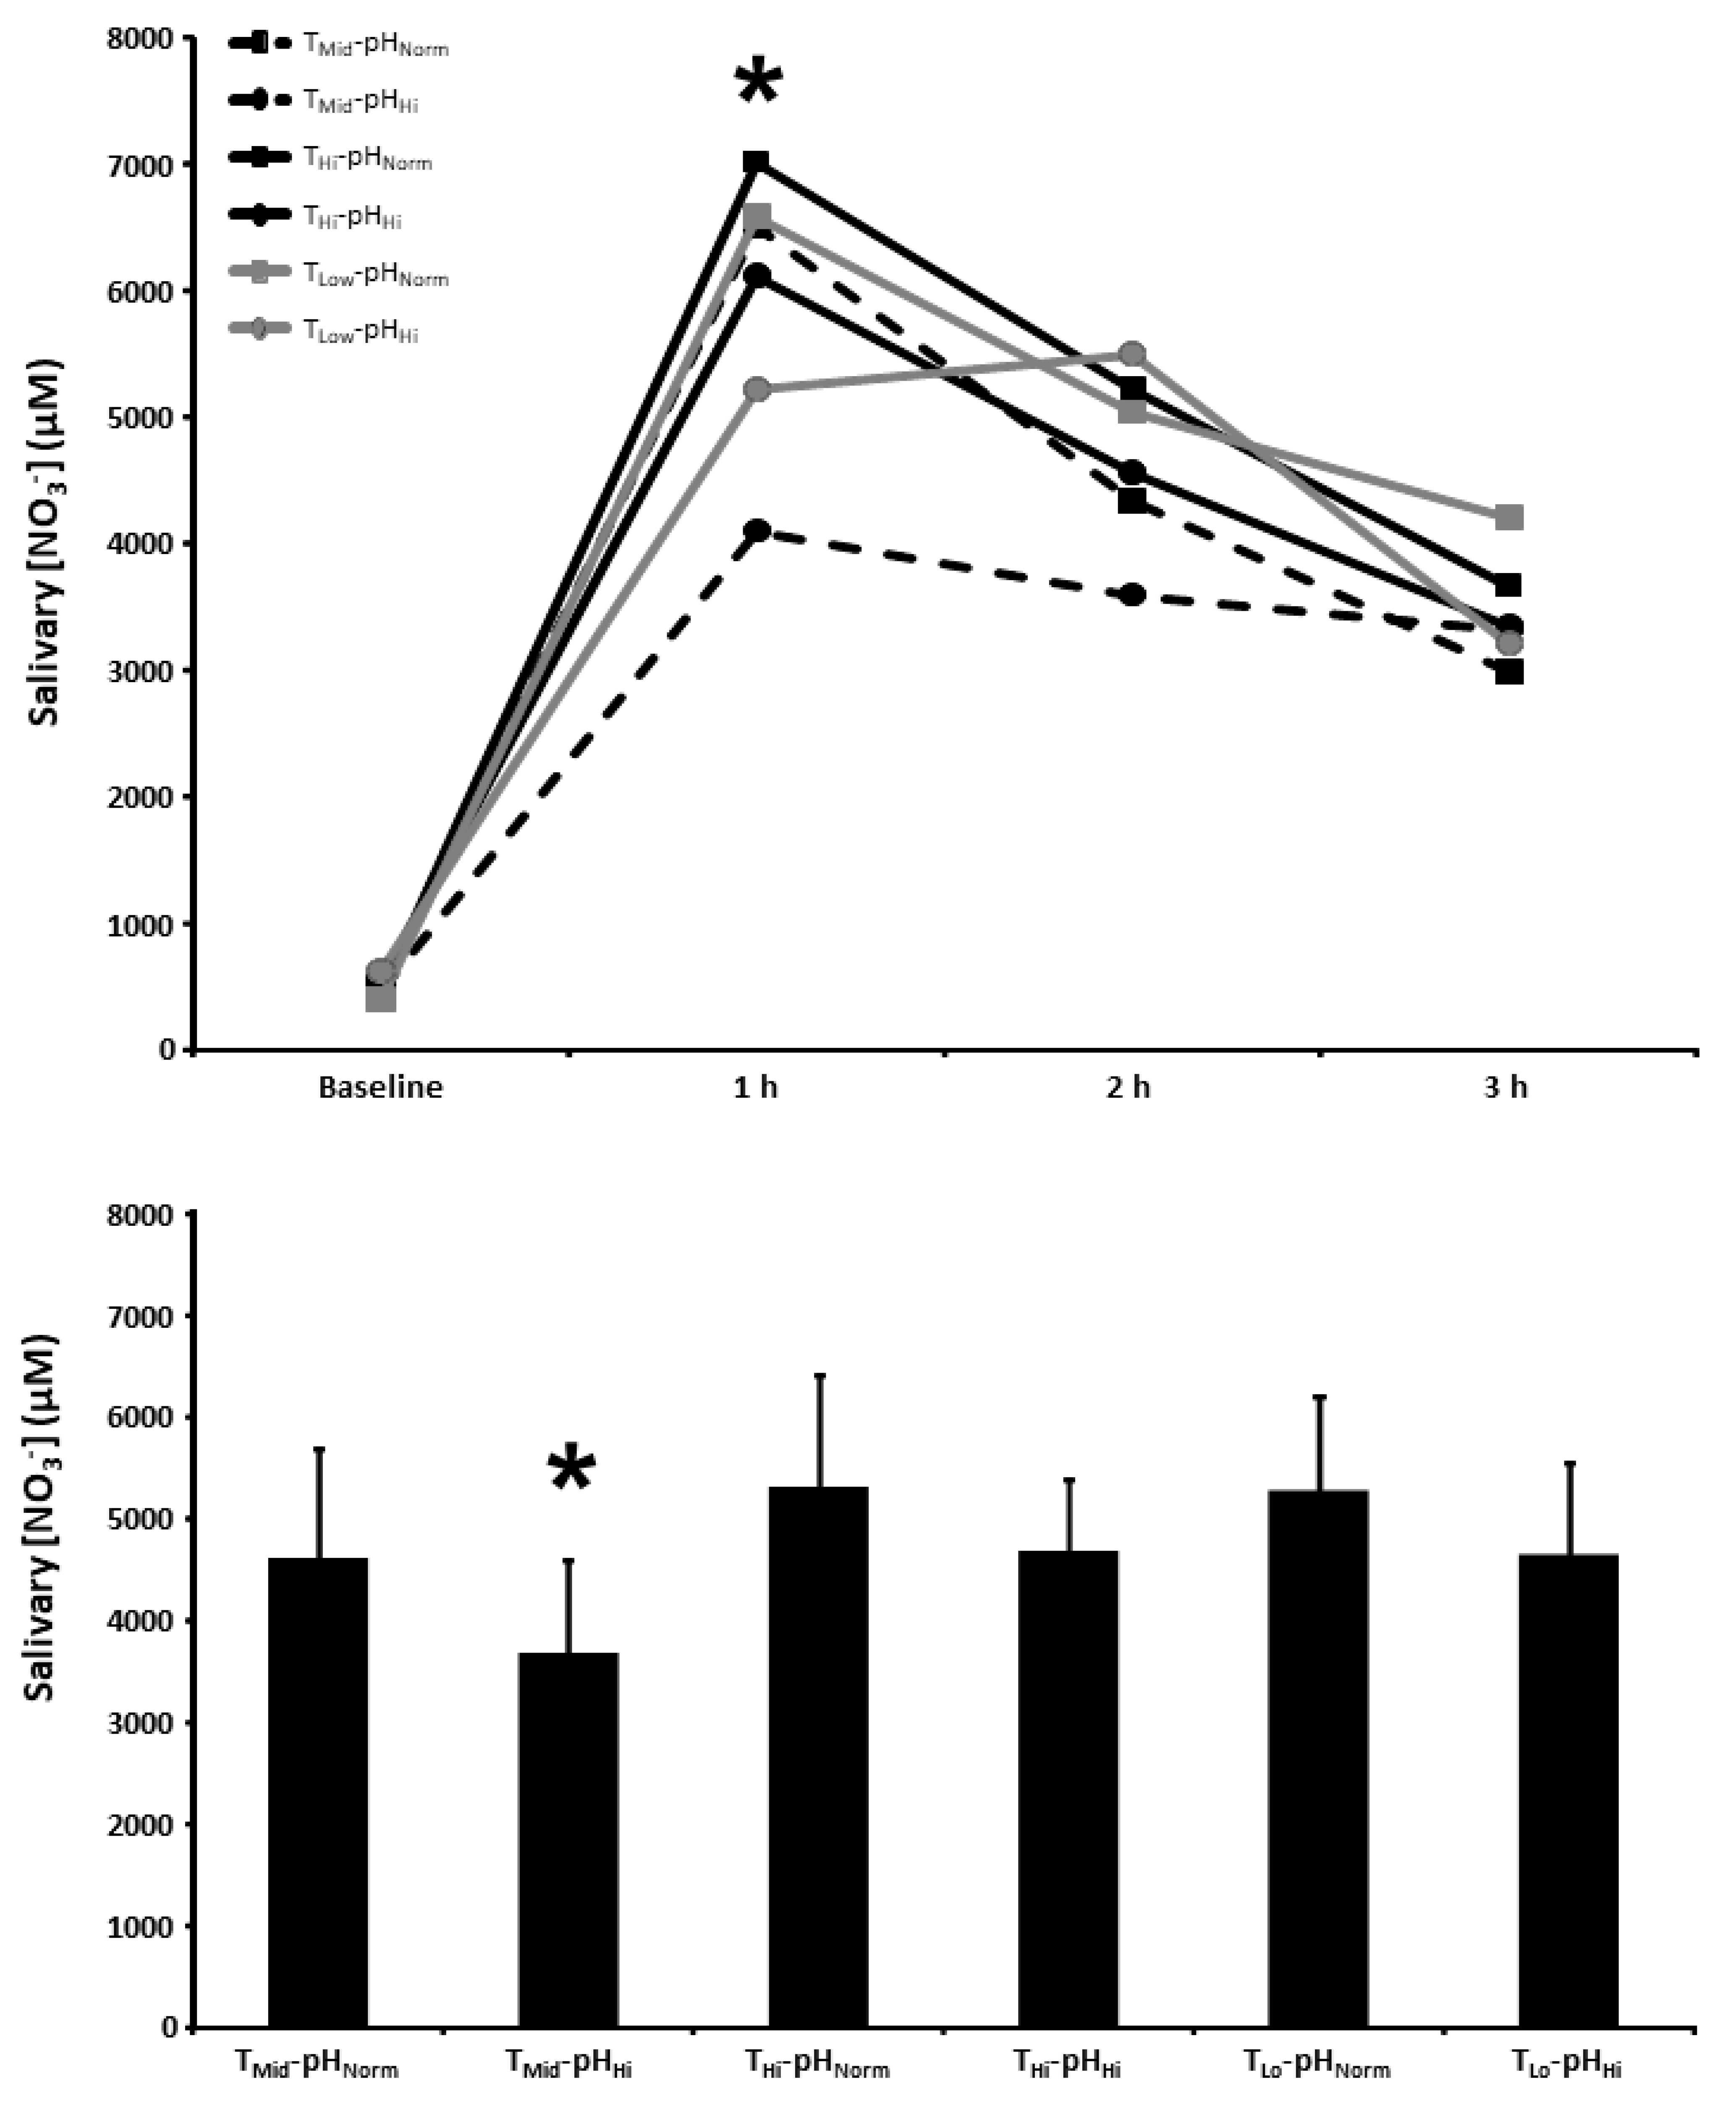
3.3. Salivary [NO3−]
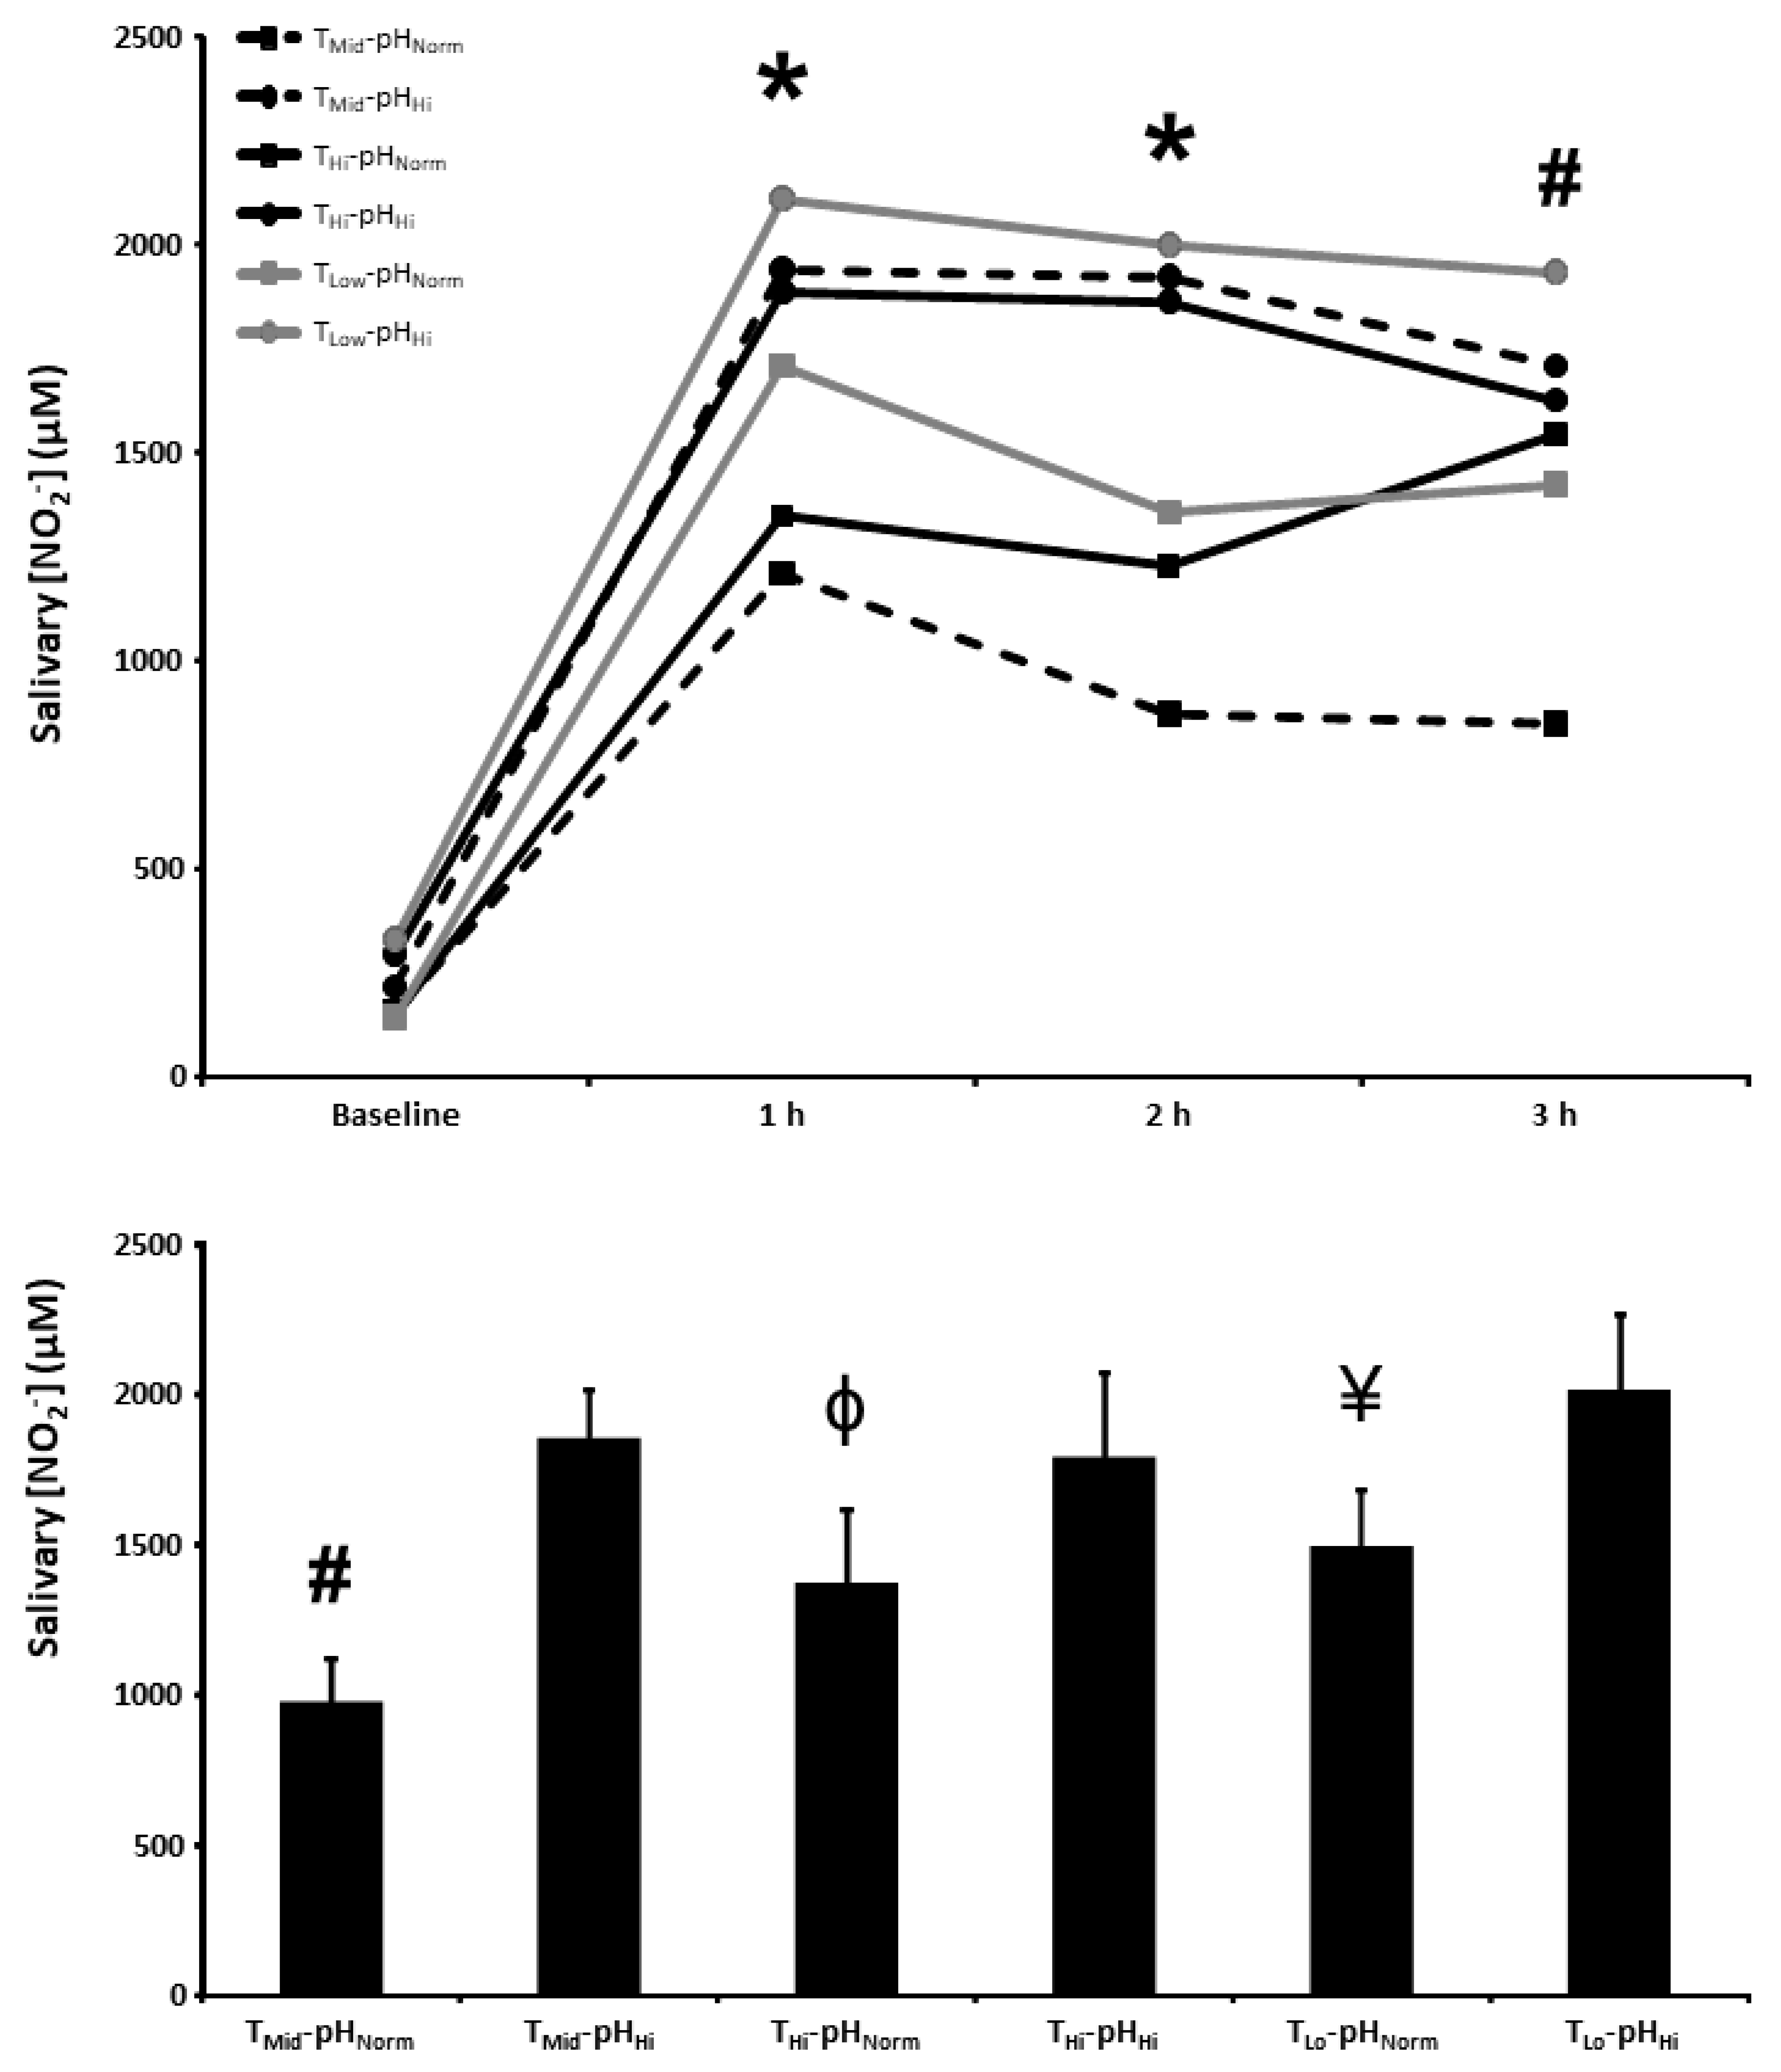
3.4. Salivary [NO2−]
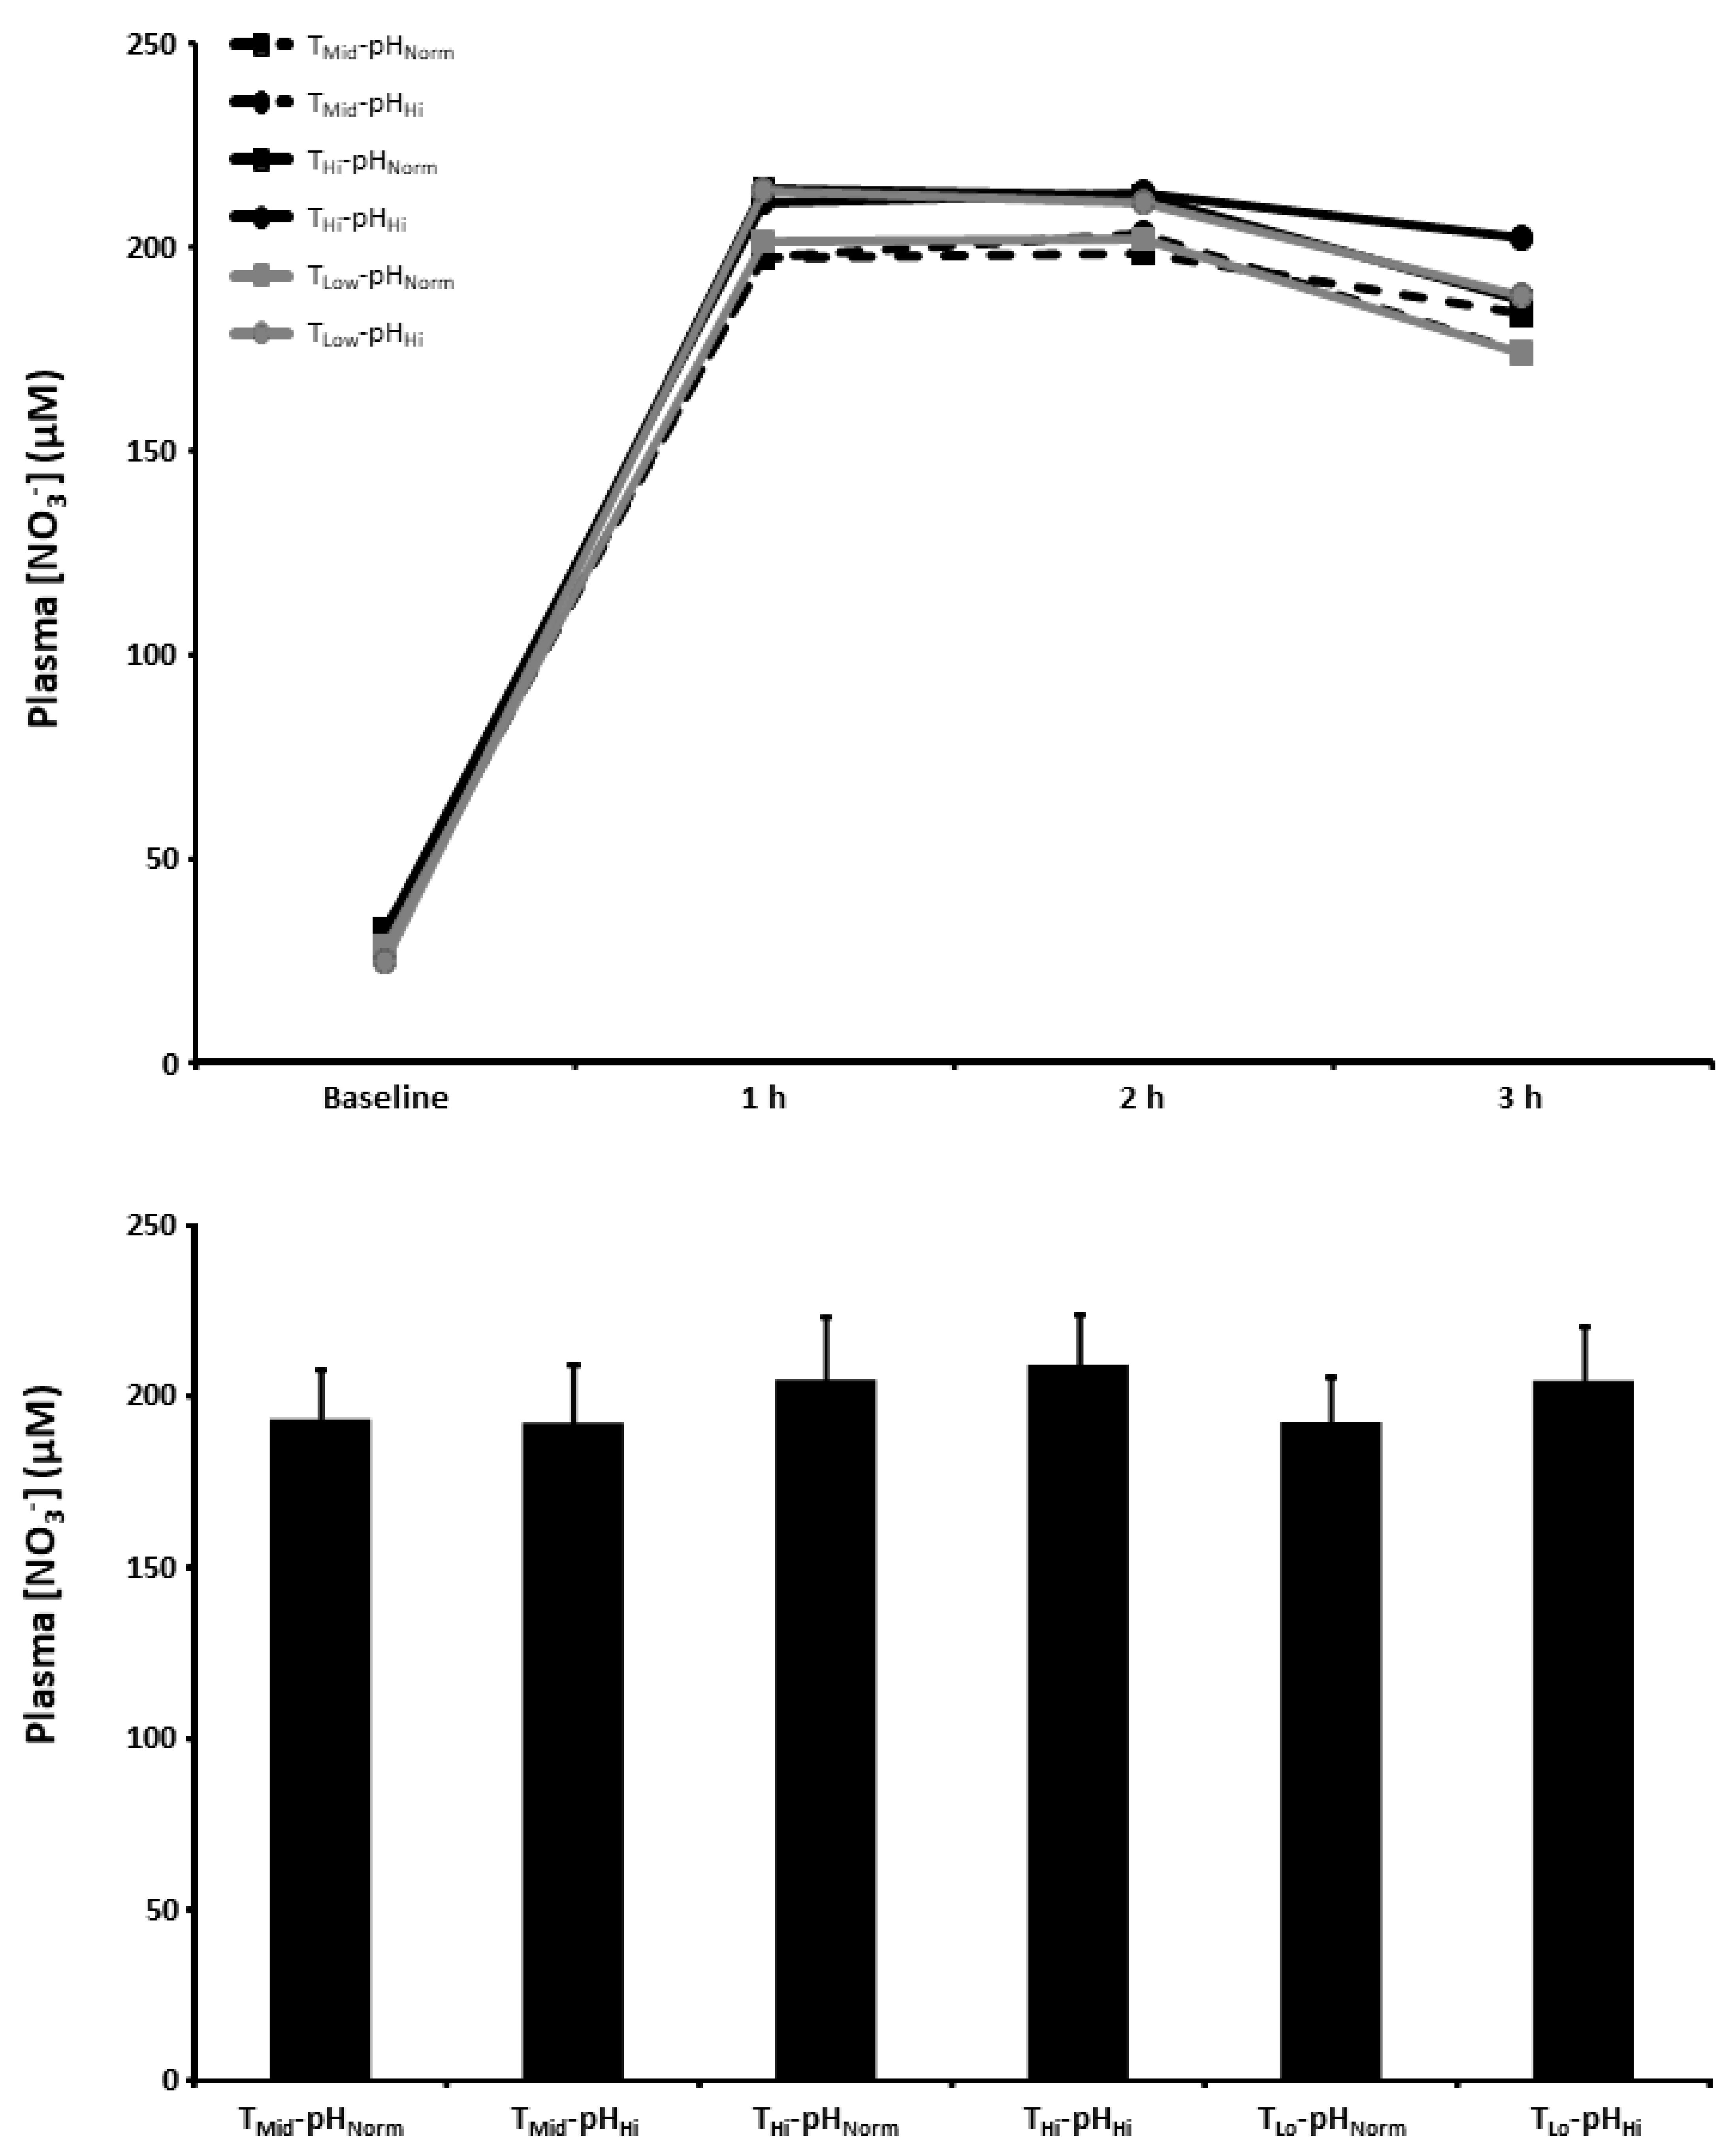
3.5. Plasma [NO3−]
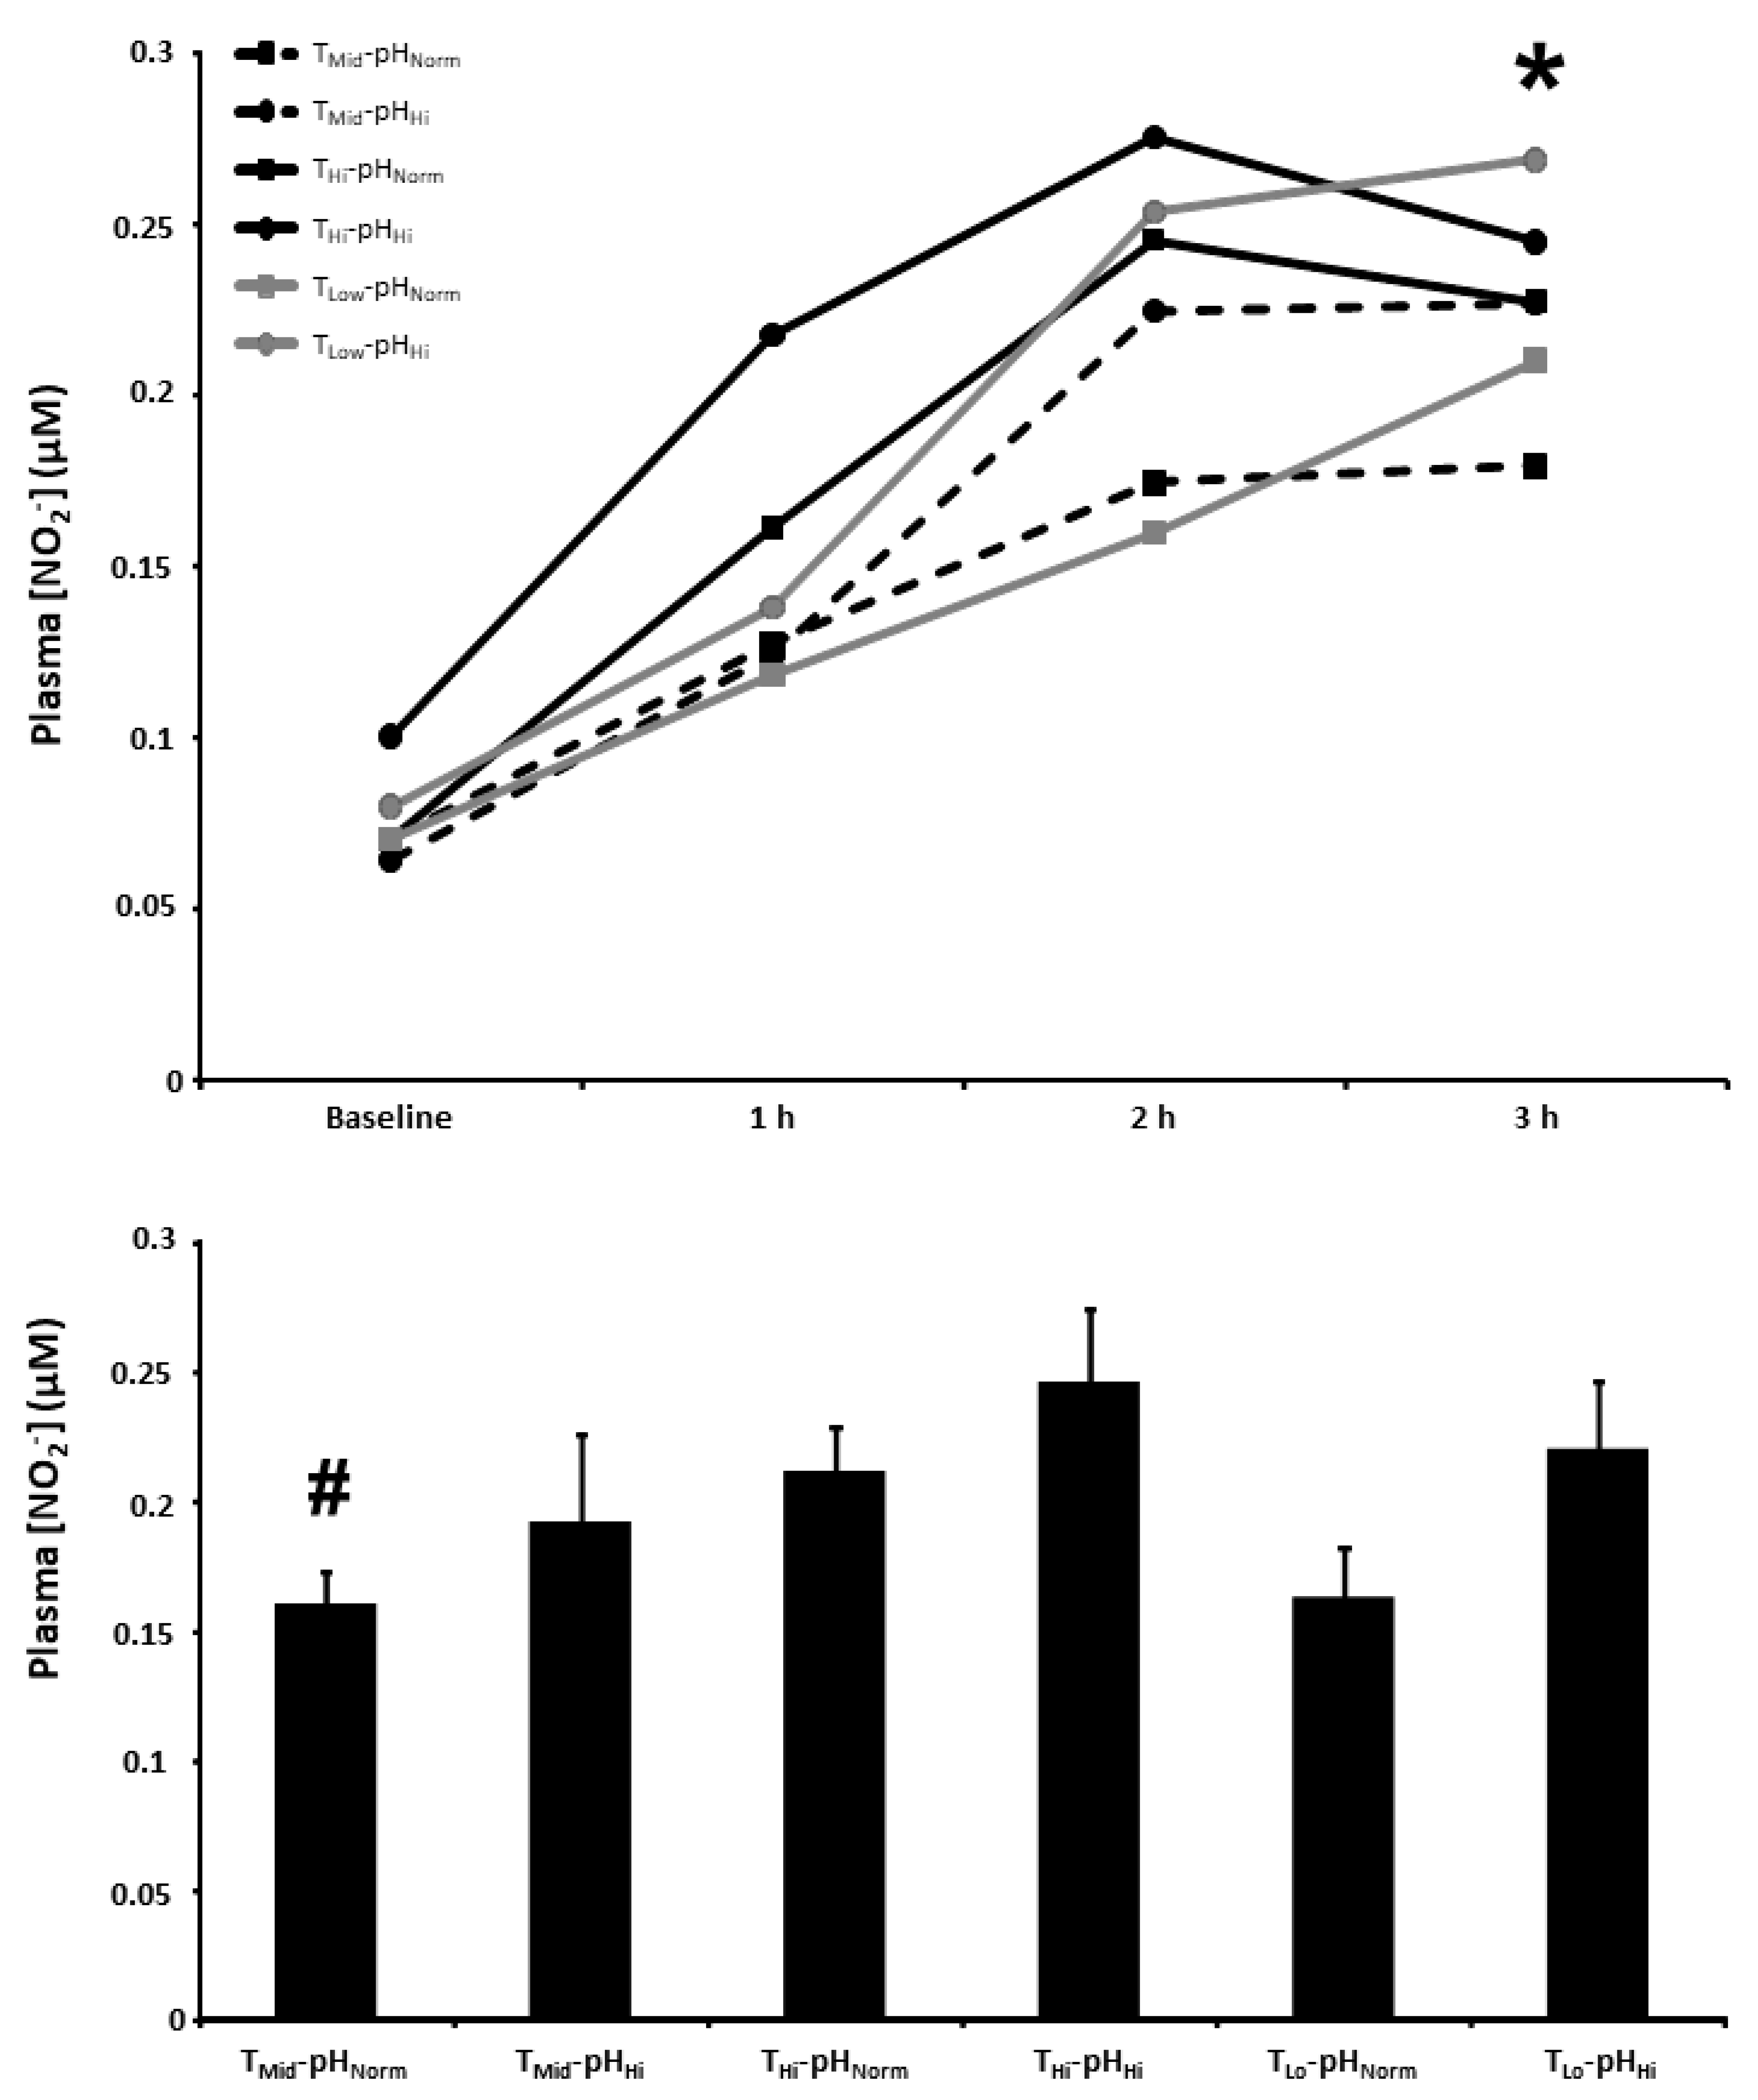
3.6. Plasma [NO2−]
4. Discussion
5. Conclusions
Author Contributions
Funding
Institutional Review Board Statement
Informed Consent Statement
Data Availability Statement
Conflicts of Interest
References
- Lundberg, J.O.; Weitzberg, E.; Gladwin, M.T. The nitrate-nitrite-nitric oxide pathway in physiology and therapeutics. Nat. Rev. Drug Discov. 2008, 7, 156–167. [Google Scholar] [CrossRef]
- Kapil, V.; Khambata, R.S.; Jones, D.A.; Rathod, K.; Primus, C.; Massimo, G.; Fukuto, J.M.; Ahluwalia, A. The Noncanonical Pathway for In Vivo Nitric Oxide Generation: The Nitrate-Nitrite-Nitric Oxide Pathway. Pharmacol. Rev. 2020, 72, 692–766. [Google Scholar]
- Jones, A.M.; Vanhatalo, A.; Seals, D.R.; Rossman, M.J.; Piknova, B.; Jonvik, K.L. Dietary Nitrate and Nitric Oxide Metabolism: Mouth, Circulation, Skeletal Muscle, and Exercise Performance. Med. Sci. Sports Exerc. 2021, 53, 280–294. [Google Scholar]
- Wagner, D.A.; Young, V.R.; Tannenbaum, S.R.; Schultz, D.S.; Deen, W.M. Mammalian nitrate biochemistry: Metabolism and endogenous synthesis. IARC Sci. Publ. 1984, 57, 247–253. [Google Scholar]
- Spiegelhalder, B.; Eisenbrand, G.; Preussmann, R. Influence of dietary nitrate on nitrite content of human saliva: Possible relevance to in vivo formation of N-nitroso compounds. Food Cosmet. Toxicol. 1976, 14, 545–548. [Google Scholar] [CrossRef] [PubMed]
- Qin, L.; Liu, X.; Sun, Q.; Fan, Z.; Xia, D.; Ding, G.; Ong, H.L.; Adams, D.; Gahl, W.A.; Zheng, C.; et al. Sialin (SLC17A5) functions as a nitrate transporter in the plasma membrane. Proc. Natl. Acad. Sci. USA 2012, 109, 13434–13439. [Google Scholar] [CrossRef] [PubMed]
- Lundberg, J.O.; Govoni, M. Inorganic nitrate is a possible source for systemic generation of nitric oxide. Free Radic. Biol. Med. 2004, 37, 395–400. [Google Scholar] [CrossRef] [PubMed]
- Burleigh, M.C.; Liddle, L.; Monaghan, C.; Muggeridge, D.J.; Sculthorpe, N.; Butcher, J.P.; Henriquez, F.L.; Allen, J.D.; Easton, C. Salivary nitrite production is elevated in individuals with a higher abundance of oral nitrate-reducing bacteria. Free Radic. Biol. Med. 2018, 120, 80–88. [Google Scholar] [CrossRef] [PubMed]
- Hyde, E.R.; Andrade, F.; Vaksman, Z.; Parthasarathy, K.; Jiang, H.; Parthasarathy, D.K.; Torregrossa, A.C.; Tribble, G.; Kaplan, H.B.; Petrosino, J.F.; et al. Metagenomic analysis of nitrate-reducing bacteria in the oral cavity: Implications for nitric oxide homeostasis. PLoS ONE 2014, 9, e88645. [Google Scholar] [CrossRef]
- Vanhatalo, A.; Blackwell, J.R.; L’Heureux, J.E.; Williams, D.W.; Smith, A.; van der Giezen, M.; Winyard, P.G.; Kelly, J.; Jones, A.M. Nitrate-responsive oral microbiome modulates nitric oxide homeostasis and blood pressure in humans. Free Radic. Biol. Med. 2018, 124, 21–30. [Google Scholar] [CrossRef]
- Lundberg, J.O.; Weitzberg, E.; Cole, J.A.; Benjamin, N. Nitrate, bacteria and human health. Nat. Rev. Microbiol. 2004, 2, 593–602. [Google Scholar] [CrossRef]
- Wylie, L.J.; Kelly, J.; Bailey, S.J.; Blackwell, J.R.; Skiba, P.F.; Winyard, P.G.; Jeukendrup, A.E.; Vanhatalo, A.; Jones, A.M. Beetroot juice and exercise: Pharmacodynamic and dose-response relationships. J. Appl. Physiol. 2013, 115, 325–336. [Google Scholar] [CrossRef] [PubMed]
- Bender, D.; Schwarz, G. Nitrite-dependent nitric oxide synthesis by molybdenum enzymes. FEBS Lett. 2018, 592, 2126–2139. [Google Scholar] [CrossRef]
- van Faassen, E.E.; Bahrami, S.; Feelisch, M.; Hogg, N.; Kelm, M.; Kim-Shapiro, D.B.; Kozlov, A.V.; Li, H.; Lundberg, J.O.; Mason, R.; et al. Nitrite as regulator of hypoxic signaling in mammalian physiology. Med. Res. Rev. 2009, 29, 683–741. [Google Scholar] [CrossRef] [PubMed]
- Kapil, V.; Haydar, S.M.; Pearl, V.; Lundberg, J.O.; Weitzberg, E.; Ahluwalia, A. Physiological role for nitrate-reducing oral bacteria in blood pressure control. Free Radic. Biol. Med. 2013, 55, 93–100. [Google Scholar] [CrossRef]
- Kapil, V.; Milsom, A.B.; Okorie, M.; Maleki-Toyserkani, S.; Akram, F.; Rehman, F.; Arghandawi, S.; Pearl, V.; Benjamin, N.; Loukogeorgakis, S.; et al. Inorganic nitrate supplementation lowers blood pressure in humans: Role for nitrite-derived NO. Hypertension 2010, 56, 274–281. [Google Scholar] [CrossRef] [PubMed]
- Thomas, B.; Smallwood, S.; Cutler, C.; Bescos, R. The oral nitrate-reducing capacity correlates with peak power output and peak oxygen uptake in healthy humans. Nitric Oxide 2019, 87, 43–51. [Google Scholar] [CrossRef]
- Jansson, E.A.; Huang, L.; Malkey, R.; Govoni, M.; Nihlén, C.; Olsson, A.; Stensdotter, M.; Petersson, J.; Holm, L.; Weitzberg, E.; et al. A mammalian functional nitrate reductase that regulates nitrite and nitric oxide homeostasis. Nat. Chem. Biol. 2008, 4, 411–417. [Google Scholar] [CrossRef]
- Piknova, B.; Park, J.W.; Swanson, K.M.; Dey, S.; Noguchi, C.T.; Schechter, A.N. Skeletal muscle as an endogenous nitrate reservoir. Nitric Oxide 2015, 47, 10–16. [Google Scholar] [CrossRef]
- Hezel, M.P.; Weitzberg, E. The oral microbiome and nitric oxide homoeostasis. Oral Dis. 2015, 21, 7–16. [Google Scholar] [CrossRef]
- Brookes, Z.L.S.; Belfield, L.A.; Ashworth, A.; Casas-Agustench, P.; Raja, M.; Pollard, A.J.; Bescos, R. Effects of chlorhexidine mouthwash on the oral microbiome. J. Dent. 2021, 113, 103768. [Google Scholar] [CrossRef]
- Cutler, C.; Kiernan, M.; Willis, J.R.; Gallardo-Alfaro, L.; Casas-Agustench, P.; White, D.; Hickson, M.; Gabaldon, T.; Bescos, R. Post-exercise hypotension and skeletal muscle oxygenation is regulated by nitrate-reducing activity of oral bacteria. Free Radic. Biol. Med. 2019, 143, 252–259. [Google Scholar] [CrossRef] [PubMed]
- Govoni, M.; Jansson, E.A.; Weitzberg, E.; Lundberg, J.O. The increase in plasma nitrite after a dietary nitrate load is markedly attenuated by an antibacterial mouthwash. Nitric Oxide 2008, 19, 333–337. [Google Scholar] [CrossRef] [PubMed]
- McDonagh, S.T.; Wylie, L.J.; Winyard, P.G.; Vanhatalo, A.; Jones, A.M. The Effects of Chronic Nitrate Supplementation and the Use of Strong and Weak Antibacterial Agents on Plasma Nitrite Concentration and Exercise Blood Pressure. Int. J. Sports Med. 2015, 36, 1177–1185. [Google Scholar] [CrossRef]
- Woessner, M.; Smoliga, J.M.; Tarzia, B.; Stabler, T.; Van Bruggen, M.; Allen, J.D. A stepwise reduction in plasma and salivary nitrite with increasing strengths of mouthwash following a dietary nitrate load. Nitric Oxide 2016, 54, 1–7. [Google Scholar] [CrossRef] [PubMed]
- Bojić, D.V.; Bojić, A.L.; Perović, J.M. The effects of dietary nitrate, pH and temperature on nitrate reduction in the human oral cavity. Facta Univ.—Ser. Phys. Chem. Technol. 2004, 3, 53–60. [Google Scholar] [CrossRef]
- van Maanen, J.M.; van Geel, A.A.; Kleinjans, J.C. Modulation of nitrate-nitrite conversion in the oral cavity. Cancer Detect. Prev. 1996, 20, 590–596. [Google Scholar]
- Xu, J.; Xu, X.; Verstraete, W. Quantitative measurement of the nitrate reductase activity in the human oral cavity. Food Chem. Toxicol. 2001, 39, 393–400. [Google Scholar] [CrossRef]
- Bailey, S.J.; Blackwell, J.R.; Wylie, L.J.; Holland, T.; Winyard, P.G.; Jones, A.M. Improvement in blood pressure after short-term inorganic nitrate supplementation is attenuated in cigarette smokers compared to non-smoking controls. Nitric Oxide 2016, 61, 29–37. [Google Scholar] [CrossRef]
- Bailey, S.J.; Blackwell, J.R.; Wylie, L.J.; Emery, A.; Taylor, E.; Winyard, P.G.; Jones, A.M. Influence of iodide ingestion on nitrate metabolism and blood pressure following short-term dietary nitrate supplementation in healthy normotensive adults. Nitric Oxide 2017, 63, 13–20. [Google Scholar] [CrossRef]
- Dewhurst-Trigg, R.; Yeates, T.; Blackwell, J.R.; Thompson, C.; Linoby, A.; Morgan, P.T.; Clarke, I.; Connolly, L.J.; Wylie, L.J.; Winyard, P.G.; et al. Lowering of blood pressure after nitrate-rich vegetable consumption is abolished with the co-ingestion of thiocyanate-rich vegetables in healthy normotensive males. Nitric Oxide 2018, 74, 39–46. [Google Scholar] [CrossRef] [PubMed]
- Dawes, C.; O’Connor, A.M.; Aspen, J.M. The effect on human salivary flow rate of the temperature of a gustatory stimulus. Arch. Oral Biol. 2000, 45, 957–961. [Google Scholar] [CrossRef] [PubMed]
- Humphrey, S.P.; Williamson, R.T. A review of saliva: Normal composition, flow, and function. J. Prosthet. Dent. 2001, 85, 162–169. [Google Scholar] [CrossRef]
- Ligtenberg, A.J.M.; Meuffels, M.; Veerman, E.C.I. Effects of environmental temperature on saliva flow rate and secretion of protein, amylase and mucin 5B. Arch. Oral Biol. 2020, 109, 104593. [Google Scholar] [CrossRef]
- Rosier, B.T.; Moya-Gonzalvez, E.M.; Corell-Escuin, P.; Mira, A. Isolation and Characterization of Nitrate-Reducing Bacteria as Potential Probiotics for Oral and Systemic Health. Front. Microbiol. 2020, 11, 555465. [Google Scholar] [CrossRef]
- Rosier, B.T.; Buetas, E.; Moya-Gonzalvez, E.M.; Artacho, A.; Mira, A. Nitrate as a potential prebiotic for the oral microbiome. Sci. Rep. 2020, 10, 12895. [Google Scholar] [CrossRef]
- Rosier, B.T.; Palazón, C.; García-Esteban, S.; Artacho, A.; Galiana, A.; Mira, A. A Single Dose of Nitrate Increases Resilience Against Acidification Derived From Sugar Fermentation by the Oral Microbiome. Front. Cell. Infect. Microbiol. 2021, 11, 692883. [Google Scholar] [CrossRef]
- Zaura, E.; Brandt, B.W.; Prodan, A.; de Mattos, M.J.T.; Imangaliyev, S.; Kool, J.; Buijs, M.J.; Jagers, F.L.; Hennequin-Hoenderdos, N.L.; Slot, D.E.; et al. On the ecosystemic network of saliva in healthy young adults. ISME J. 2017, 11, 1218–1231. [Google Scholar] [CrossRef] [PubMed]
- Webb, A.J.; Patel, N.; Loukogeorgakis, S.; Okorie, M.; Aboud, Z.; Misra, S.; Rashid, R.; Miall, P.; Deanfield, J.; Benjamin, N.; et al. Acute blood pressure lowering, vasoprotective, and antiplatelet properties of dietary nitrate via bioconversion to nitrite. Hypertension 2008, 51, 784–790. [Google Scholar] [CrossRef]
- Hoekstra, S.P.; Bishop, N.C.; Faulkner, S.H.; Bailey, S.J.; Leicht, C.A. Acute and chronic effects of hot water immersion on inflammation and metabolism in sedentary, overweight adults. J. Appl. Physiol. 2018, 125, 2008–2018. [Google Scholar] [CrossRef] [PubMed]
- Hoekstra, S.P.; Ogawa, T.; Dos Santos, M.; Handsley, G.; Bailey, S.J.; Goosey-Tolfrey, V.L.; Tajima, F.; Cheng, J.L.; Leicht, C.A. The effects of local versus systemic passive heating on the acute inflammatory, vascular and glycaemic response. Appl. Physiol. Nutr. Metab. 2021, 46, 808–818. [Google Scholar] [CrossRef] [PubMed]
- Pinheiro, L.C.; Amaral, J.H.; Ferreira, G.C.; Portella, R.L.; Ceron, C.S.; Montenegro, M.F.; Toledo, J.C., Jr.; Tanus-Santos, J.E. Gastric S-nitrosothiol formation drives the antihypertensive effects of oral sodium nitrite and nitrate in a rat model of renovascular hypertension. Free Radic. Biol. Med. 2015, 87, 252–262. [Google Scholar] [CrossRef] [PubMed]


Disclaimer/Publisher’s Note: The statements, opinions and data contained in all publications are solely those of the individual author(s) and contributor(s) and not of MDPI and/or the editor(s). MDPI and/or the editor(s) disclaim responsibility for any injury to people or property resulting from any ideas, methods, instructions or products referred to in the content. |
© 2023 by the authors. Licensee MDPI, Basel, Switzerland. This article is an open access article distributed under the terms and conditions of the Creative Commons Attribution (CC BY) license (https://creativecommons.org/licenses/by/4.0/).
Share and Cite
Cocksedge, S.P.; Causer, A.J.; Winyard, P.G.; Jones, A.M.; Bailey, S.J. Oral Temperature and pH Influence Dietary Nitrate Metabolism in Healthy Adults. Nutrients 2023, 15, 784. https://doi.org/10.3390/nu15030784
Cocksedge SP, Causer AJ, Winyard PG, Jones AM, Bailey SJ. Oral Temperature and pH Influence Dietary Nitrate Metabolism in Healthy Adults. Nutrients. 2023; 15(3):784. https://doi.org/10.3390/nu15030784
Chicago/Turabian StyleCocksedge, Stuart P., Adam J. Causer, Paul G. Winyard, Andrew M. Jones, and Stephen J. Bailey. 2023. "Oral Temperature and pH Influence Dietary Nitrate Metabolism in Healthy Adults" Nutrients 15, no. 3: 784. https://doi.org/10.3390/nu15030784
APA StyleCocksedge, S. P., Causer, A. J., Winyard, P. G., Jones, A. M., & Bailey, S. J. (2023). Oral Temperature and pH Influence Dietary Nitrate Metabolism in Healthy Adults. Nutrients, 15(3), 784. https://doi.org/10.3390/nu15030784