
The Health Effects of Low Glycemic Index and Low Glycemic Load Interventions on Prediabetes and Type 2 Diabetes Mellitus: A Literature Review of RCTs

 , and
, and 
Abstract
:1. Introduction
2. Methods
2.1. Search Strategy
2.2. Study Selection
3. Results
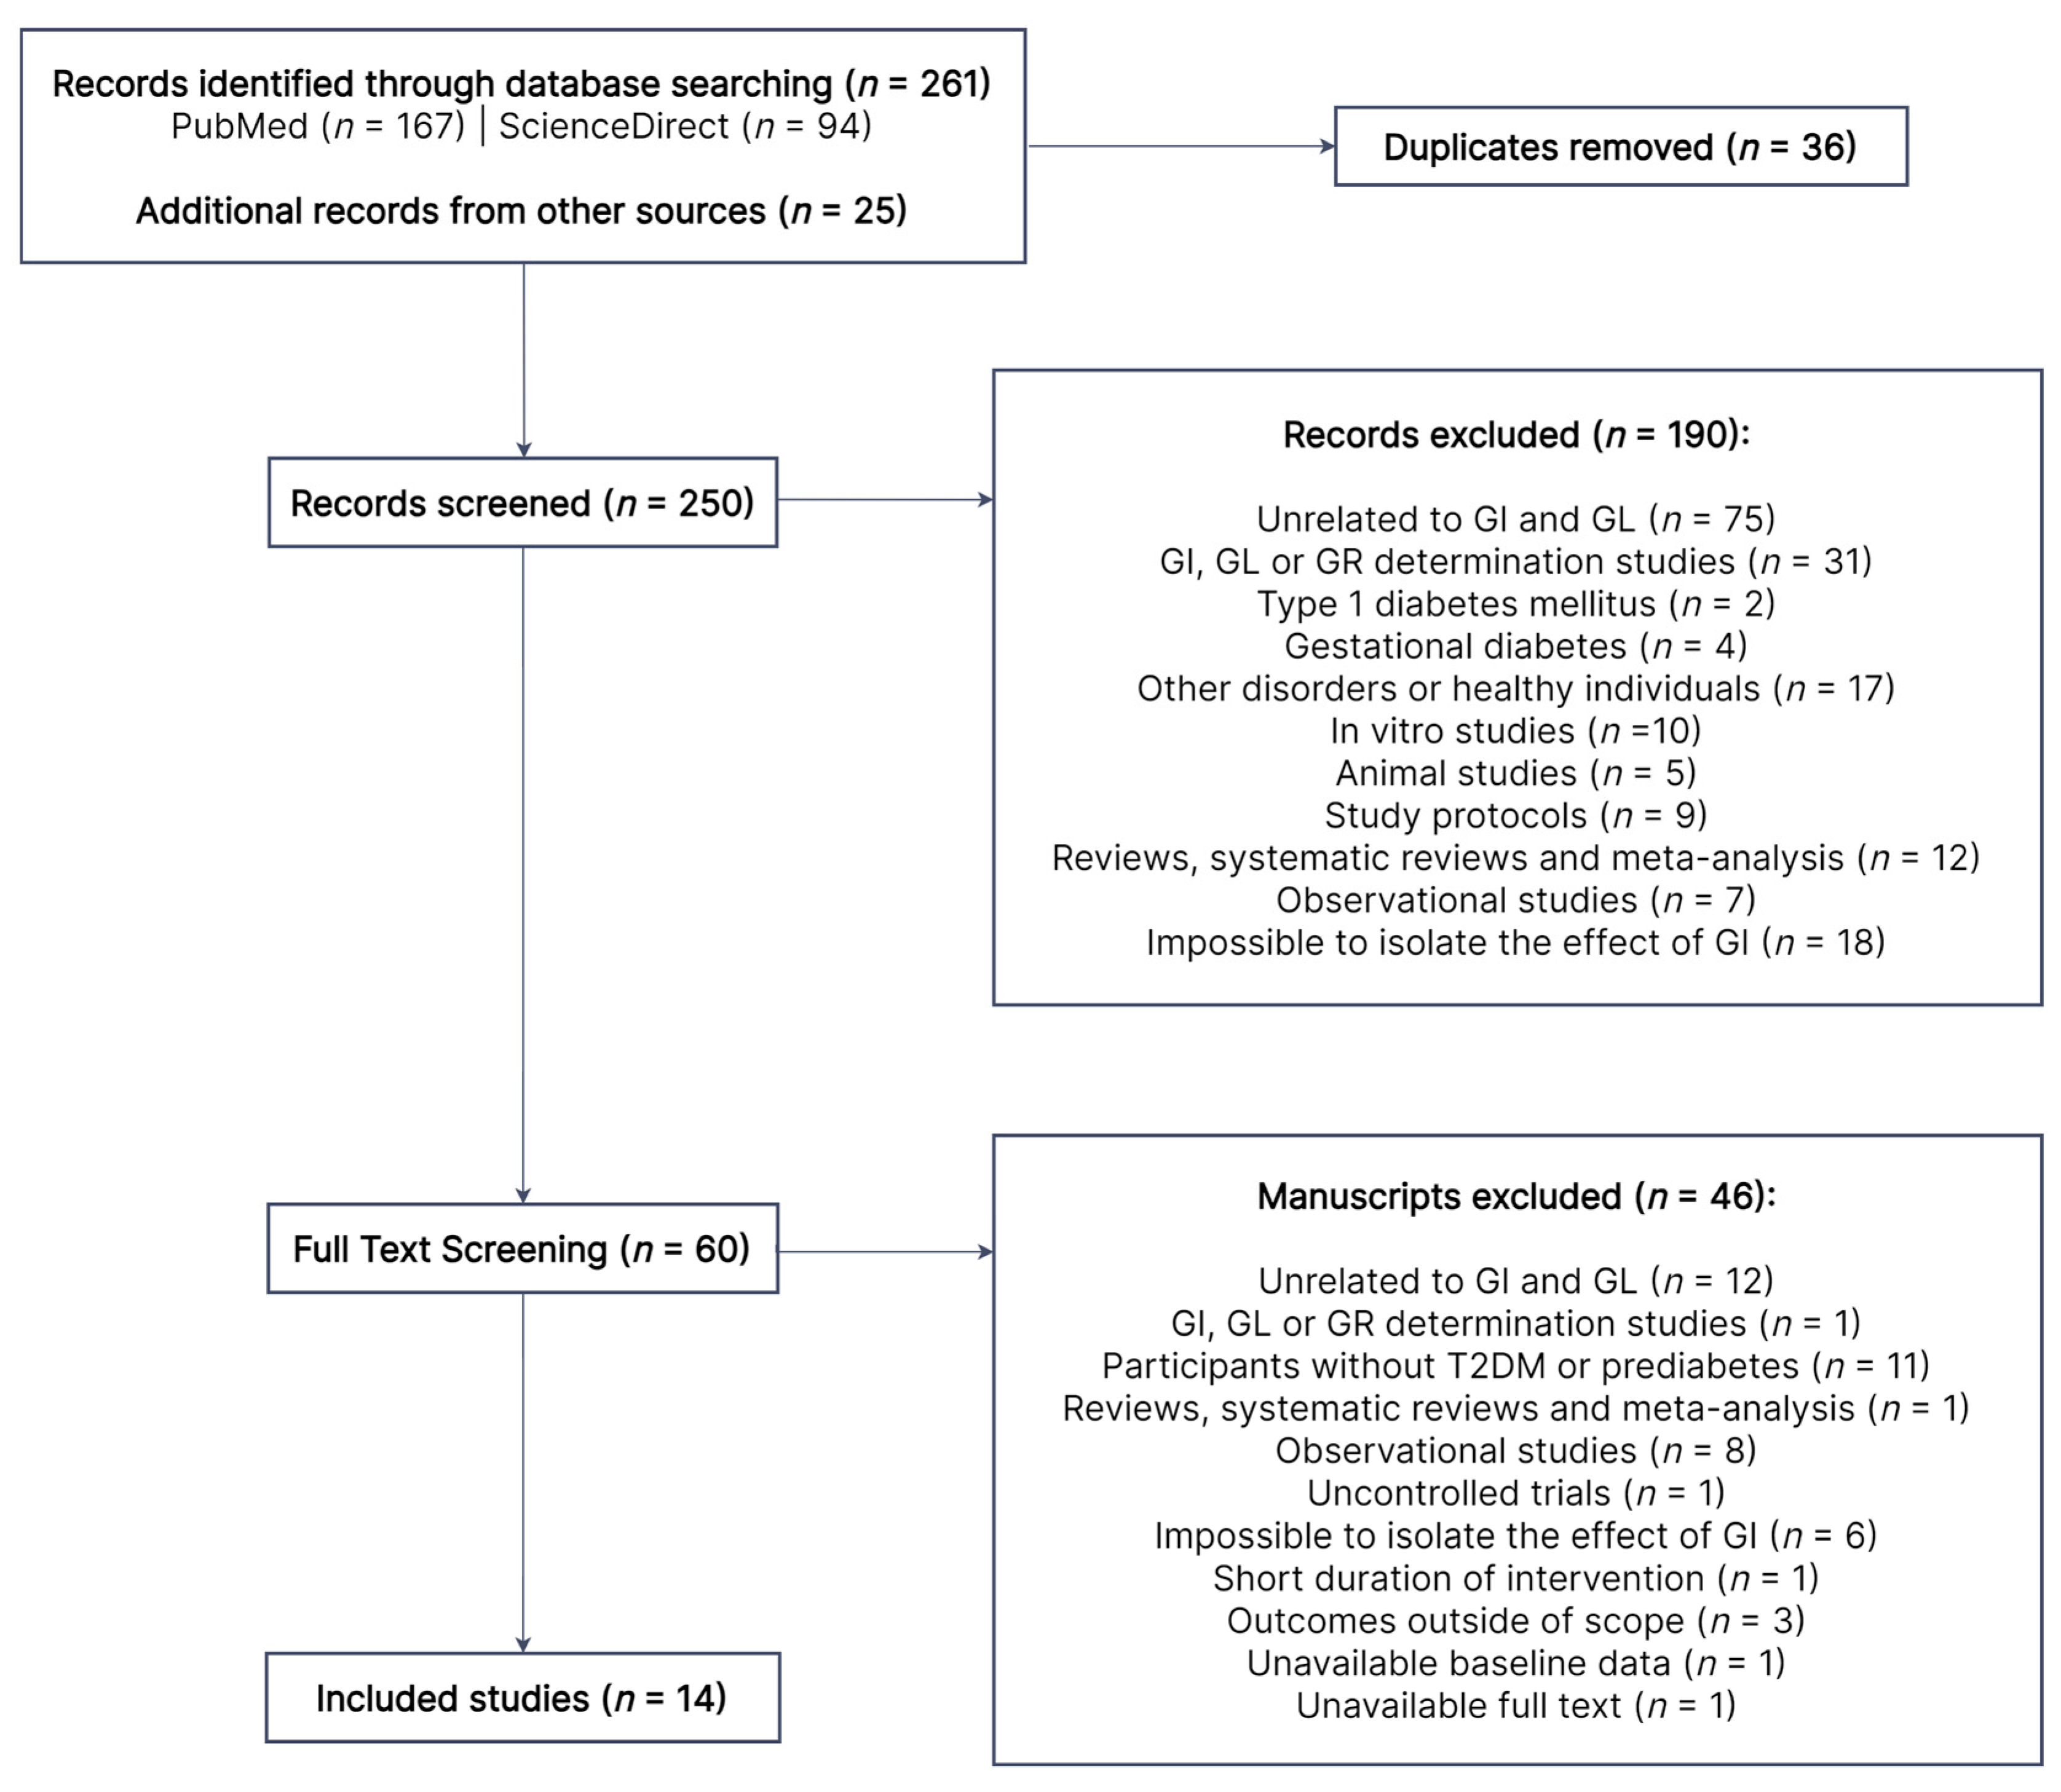
3.1. Search Results and Study Selection
3.2. Study Characteristics
3.3. Glycemic Control
3.4. Anthropometry, Body Composition and Nutritional Status
3.5. Lipid Profile
3.6. Blood Pressure
3.7. CVD Risk
3.8. Inflammatory Markers
3.9. Hormones
3.10. Hepatic and Renal Function
3.11. Intestinal Microbiota
3.12. Quality of Life
3.13. Dietary Intake
4. Discussion
5. Conclusions
Author Contributions
Funding
Institutional Review Board Statement
Informed Consent Statement
Conflicts of Interest
References
- Galicia-Garcia, U.; Benito-Vicente, A.; Jebari, S.; Larrea-Sebal, A.; Siddiqi, H.; Uribe, K.B.; Ostolaza, H.; Martín, C. Pathophysiology of Type 2 Diabetes Mellitus. Int. J. Mol. Sci. 2020, 21, 6275. [Google Scholar] [CrossRef]
- Safiri, S.; Karamzad, N.; Kaufman, J.S.; Bell, A.W.; Nejadghaderi, S.A.; Sullman, M.J.M.; Moradi-Lakeh, M.; Collins, G.; Kolahi, A.-A. Prevalence, Deaths and Disability-Adjusted-Life-Years (DALYs) Due to Type 2 Diabetes and Its Attributable Risk Factors in 204 Countries and Territories, 1990–2019: Results from the Global Burden of Disease Study 2019. Front. Endocrinol. 2022, 13, 838027. [Google Scholar] [CrossRef] [PubMed]
- Institute for Health Metrics and Evaluation. GBD 2019 Cause and Risk Summary: Diabetes Mellitus Type 2—Level 4 Cause; Institute for Health Metrics and Evaluation: Seattle, WA, USA, 2020. [Google Scholar]
- World Health Organization. Disability-Adjusted Life Years (DALYs). Available online: https://www.who.int/data/gho/indicator-metadata-registry/imr-details/158 (accessed on 12 May 2023).
- Ali, M.K.; Pearson-Stuttard, J.; Selvin, E.; Gregg, E.W. Interpreting Global Trends in Type 2 Diabetes Complications and Mortality. Diabetologia 2022, 65, 3–13. [Google Scholar] [CrossRef] [PubMed]
- Chatterjee, S.; Khunti, K.; Davies, M.J. Type 2 Diabetes. Lancet 2017, 389, 2239–2251. [Google Scholar] [CrossRef] [PubMed]
- Zheng, Y.; Ley, S.H.; Hu, F.B. Global Aetiology and Epidemiology of Type 2 Diabetes Mellitus and Its Complications. Nat. Rev. Endocrinol. 2018, 14, 88–98. [Google Scholar] [CrossRef] [PubMed]
- Cosentino, F.; Grant, P.J.; Aboyans, V.; Bailey, C.J.; Ceriello, A.; Delgado, V.; Federici, M.; Filippatos, G.; Grobbee, D.E.; Hansen, T.B.; et al. 2019 ESC Guidelines on Diabetes, Pre-Diabetes, and Cardiovascular Diseases Developed in Collaboration with the EASD. Eur. Heart J. 2020, 41, 255–323. [Google Scholar] [CrossRef]
- Echouffo-Tcheugui, J.B.; Selvin, E. Prediabetes and What It Means: The Epidemiological Evidence. Annu. Rev. Public Health 2021, 42, 59–77. [Google Scholar] [CrossRef]
- Bellou, V.; Belbasis, L.; Tzoulaki, I.; Evangelou, E. Risk Factors for Type 2 Diabetes Mellitus: An Exposure-Wide Umbrella Review of Meta-Analyses. PLoS ONE 2018, 13, e0194127. [Google Scholar] [CrossRef]
- Goldberg, R.B.; Orchard, T.J.; Crandall, J.P.; Boyko, E.J.; Budoff, M.; Dabelea, D.; Gadde, K.M.; Knowler, W.C.; Lee, C.G.; Nathan, D.M.; et al. Effects of Long-Term Metformin and Lifestyle Interventions on Cardiovascular Events in the Diabetes Prevention Program and Its Outcome Study. Circulation 2022, 145, 1632–1641. [Google Scholar] [CrossRef]
- Gong, Q.; Zhang, P.; Wang, J.; Ma, J.; An, Y.; Chen, Y.; Zhang, B.; Feng, X.; Li, H.; Chen, X.; et al. Morbidity and Mortality after Lifestyle Intervention for People with Impaired Glucose Tolerance: 30-Year Results of the Da Qing Diabetes Prevention Outcome Study. Lancet Diabetes Endocrinol. 2019, 7, 452–461. [Google Scholar] [CrossRef]
- Lindström, J.; Peltonen, M.; Eriksson, J.G.; Ilanne-Parikka, P.; Aunola, S.; Keinänen-Kiukaanniemi, S.; Uusitupa, M.; Tuomilehto, J. Improved Lifestyle and Decreased Diabetes Risk over 13 Years: Long-Term Follow-up of the Randomised Finnish Diabetes Prevention Study (DPS). Diabetologia 2013, 56, 284–293. [Google Scholar] [CrossRef] [PubMed]
- Zhang, Y.; Pan, X.-F.; Chen, J.; Xia, L.; Cao, A.; Zhang, Y.; Wang, J.; Li, H.; Yang, K.; Guo, K.; et al. Combined Lifestyle Factors and Risk of Incident Type 2 Diabetes and Prognosis among Individuals with Type 2 Diabetes: A Systematic Review and Meta-Analysis of Prospective Cohort Studies. Diabetologia 2020, 63, 21–33. [Google Scholar] [CrossRef] [PubMed]
- Han, H.; Cao, Y.; Feng, C.; Zheng, Y.; Dhana, K.; Zhu, S.; Shang, C.; Yuan, C.; Zong, G. Association of a Healthy Lifestyle with All-Cause and Cause-Specific Mortality Among Individuals with Type 2 Diabetes: A Prospective Study in UK Biobank. Diabetes Care 2022, 45, 319–329. [Google Scholar] [CrossRef]
- Diabetes UK 2018 Nutrition Working Group. Evidence-Based Nutrition Guidelines for the Prevention and Management of Diabetes; Diabetes UK 2018 Nutrition Working Group: London, UK, 2018. [Google Scholar]
- Evert, A.B.; Dennison, M.; Gardner, C.D.; Garvey, W.T.; Lau, K.H.K.; MacLeod, J.; Mitri, J.; Pereira, R.F.; Rawlings, K.; Robinson, S.; et al. Nutrition Therapy for Adults with Diabetes or Prediabetes: A Consensus Report. Diabetes Care 2019, 42, 731–754. [Google Scholar] [CrossRef] [PubMed]
- Jenkins, D.J.A.; Wolever, T.M.S.; Taylor, R.H.; Barker, H.; Fielden, H.; Baldwin, J.M.; Bowling, A.C.; Newman, H.C.; Jenkins, A.L.; Goff, D.V. Glycemic Index of Foods: A Physiological Basis for Carbohydrate Exchange. Am. J. Clin. Nutr. 1981, 34, 362–366. [Google Scholar] [CrossRef]
- ISO 26642:2010; Food Products—Determination of the Glycaemic Index (GI) and Recommendation for Food Classification. ISO: Geneva, Switzerland, 2010.
- Augustin, L.S.A.; Kendall, C.W.C.; Jenkins, D.J.A.; Willett, W.C.; Astrup, A.; Barclay, A.W.; Björck, I.; Brand-Miller, J.C.; Brighenti, F.; Buyken, A.E.; et al. Glycemic Index, Glycemic Load and Glycemic Response: An International Scientific Consensus Summit from the International Carbohydrate Quality Consortium (ICQC). Nutr. Metab. Cardiovasc. Dis. 2015, 25, 795–815. [Google Scholar] [CrossRef]
- Sievenpiper, J.L.; Chan, C.B.; Dworatzek, P.D.; Freeze, C.; Williams, S.L. Nutrition Therapy. Can. J. Diabetes 2018, 42 (Suppl. S1), S64–S79. [Google Scholar] [CrossRef]
- Bao, J.; Atkinson, F.; Petocz, P.; Willett, W.C.; Brand-Miller, J.C. Prediction of Postprandial Glycemia and Insulinemia in Lean, Young, Healthy Adults: Glycemic Load Compared with Carbohydrate Content Alone. Am. J. Clin. Nutr. 2011, 93, 984–996. [Google Scholar] [CrossRef]
- Kim, D. Glycemic Index. In Obesity; Elsevier: Amsterdam, The Netherlands, 2020; pp. 183–189. ISBN 9780128188392. [Google Scholar]
- Jayedi, A.; Soltani, S.; Jenkins, D.; Sievenpiper, J.; Shab-Bidar, S. Dietary Glycemic Index, Glycemic Load, and Chronic Disease: An Umbrella Review of Meta-Analyses of Prospective Cohort Studies. Crit. Rev. Food Sci. Nutr. 2022, 62, 2460–2469. [Google Scholar] [CrossRef]
- Livesey, G.; Taylor, R.; Livesey, H.F.; Buyken, A.E.; Jenkins, D.J.A.; Augustin, L.S.A.; Sievenpiper, J.L.; Barclay, A.W.; Liu, S.; Wolever, T.M.S.; et al. Dietary Glycemic Index and Load and the Risk of Type 2 Diabetes: Assessment of Causal Relations. Nutrients 2019, 11, 1436. [Google Scholar] [CrossRef]
- Zafar, M.I.; Mills, K.E.; Zheng, J.; Regmi, A.; Hu, S.Q.; Gou, L.; Chen, L.-L. Low-Glycemic Index Diets as an Intervention for Diabetes: A Systematic Review and Meta-Analysis. Am. J. Clin. Nutr. 2019, 110, 891–902. [Google Scholar] [CrossRef]
- Chiavaroli, L.; Lee, D.; Ahmed, A.; Cheung, A.; Khan, T.; Mejia, S.B.; Mirrahimi, A.; Jenkins, D.; Livesey, G.; Wolever, T.; et al. Low Glycemic Index/Load Dietary Patterns and Glycemia and Cardiometabolic Risk Factors in Diabetes: A Systematic Review and Meta-Analysis of Randomized Controlled Trials. Curr. Dev. Nutr. 2021, 5, 1018. [Google Scholar] [CrossRef]
- Jönsson, T.; Granfeldt, Y.; Lindeberg, S.; Hallberg, A.C. Subjective Satiety and Other Experiences of a Paleolithic Diet Compared to a Diabetes Diet in Patients with Type 2 Diabetes. Nutr. J. 2013, 12, 105. [Google Scholar] [CrossRef]
- Lamport, D.J.; Chadwick, H.K.; Dye, L.; Mansfield, M.W.; Lawton, C.L. A Low Glycaemic Load Breakfast Can Attenuate Cognitive Impairments Observed in Middle Aged Obese Females with Impaired Glucose Tolerance. Nutr. Metab. Cardiovasc. Dis. 2014, 24, 1128–1136. [Google Scholar] [CrossRef]
- Lamport, D.J.; Lawton, C.L.; Mansfield, M.W.; Moulin, C.A.J.; Dye, L. Type 2 Diabetes and Impaired Glucose Tolerance Are Associated with Word Memory Source Monitoring Recollection Deficits but Not Simple Recognition Familiarity Deficits Following Water, Low Glycaemic Load, and High Glycaemic Load Breakfasts. Physiol. Behav. 2014, 124, 54–60. [Google Scholar] [CrossRef]
- Alalwan, T.A.; Perna, S.; Mandeel, Q.A.; Abdulhadi, A.; Alsayyad, A.S.; D’Antona, G.; Negro, M.; Riva, A.; Petrangolini, G.; Allegrini, P.; et al. Effects of Daily Low-Dose Date Consumption on Glycemic Control, Lipid Profile, and Quality of Life in Adults with Pre- and Type 2 Diabetes: A Randomized Controlled Trial. Nutrients 2020, 12, 217. [Google Scholar] [CrossRef] [PubMed]
- Argiana, V.; Kanellos, P.Τ.; Makrilakis, K.; Eleftheriadou, I.; Tsitsinakis, G.; Kokkinos, A.; Perrea, D.; Tentolouris, N. The Effect of Consumption of Low-Glycemic-Index and Low-Glycemic-Load Desserts on Anthropometric Parameters and Inflammatory Markers in Patients with Type 2 Diabetes Mellitus. Eur. J. Nutr. 2015, 54, 1173–1180. [Google Scholar] [CrossRef] [PubMed]
- Pavithran, N.; Kumar, H.; Menon, A.S.; Pillai, G.K.; Sundaram, K.R.; Ojo, O. South Indian Cuisine with Low Glycemic Index Ingredients Reduces Cardiovascular Risk Factors in Subjects with Type 2 Diabetes. Int. J. Environ. Res. Public Health 2020, 17, 6232. [Google Scholar] [CrossRef]
- Pavithran, N.; Kumar, H.; Menon, A.S.; Pillai, G.K.; Sundaram, K.R.; Ojo, O. The Effect of a Low GI Diet on Truncal Fat Mass and Glycated Hemoglobin in South Indians with Type 2 Diabetes—A Single Centre Randomized Prospective Study. Nutrients 2020, 12, 179. [Google Scholar] [CrossRef] [PubMed]
- Sipe, A.T.; Neuhouser, M.L.; Breymeyer, K.L.; Utzschneider, K.M. Effect of Dietary Glycemic Index on β-Cell Function in Prediabetes: A Randomized Controlled Feeding Study. Nutrients 2022, 14, 887. [Google Scholar] [CrossRef] [PubMed]
- Ward, N.C.; Mori, T.A.; Beilin, L.J.; Johnson, S.; Williams, C.; Gan, S.K.; Puddey, I.B.; Woodman, R.; Phillips, M.; Connolly, E.; et al. The Effect of Regular Consumption of Lupin-Containing Foods on Glycaemic Control and Blood Pressure in People with Type 2 Diabetes Mellitus. Food Funct. 2020, 11, 741–747. [Google Scholar] [CrossRef] [PubMed]
- Boonyavarakul, A.; Leelawattana, R.; Pongchaiyakul, C.; Buranapin, S.; Phanachet, P.; Pramyothin, P. Effects of Meal Replacement Therapy on Metabolic Outcomes in Thai Patients with Type 2 Diabetes: A Randomized Controlled Trial. Nutr. Health 2018, 24, 261–268. [Google Scholar] [CrossRef] [PubMed]
- Cai, X.; Wang, L.; Wang, X.; Liu, S. Effect of High Dietary Fiber Low Glycemic Index Diet on Intestinal Flora, Blood Glucose and Inflammatory Response in T2DM Patients. Biomed. Res. 2017, 28, 9371–9375. [Google Scholar]
- Gomes, J.M.G.; Fabrini, S.P.; Alfenas, R. de C.G. Low Glycemic Index Diet Reduces Body Fat and Attenuates Inflammatory and Metabolic Responses in Patients with Type 2 Diabetes. Arch. Endocrinol. Metab. 2017, 61, 137–144. [Google Scholar] [CrossRef] [PubMed]
- Ha, V.; Viguiliouk, E.; Kendall, C.W.C.; Balachandran, B.; Jenkins, D.J.A.; Kavsak, P.A.; Sievenpiper, J.L. Effect of a Low Glycemic Index Diet versus a High-Cereal Fibre Diet on Markers of Subclinical Cardiac Injury in Healthy Individuals with Type 2 Diabetes Mellitus: An Exploratory Analysis of a Randomized Dietary Trial. Clin. Biochem. 2017, 50, 1104–1109. [Google Scholar] [CrossRef]
- Jenkins, D.J.A.; Chiavaroli, L.; Mirrahimi, A.; Mitchell, S.; Faulkner, D.; Sahye-Pudaruth, S.; Paquette, M.; Coveney, J.; Olowoyeye, O.; Patel, D.; et al. Glycemic Index Versus Wheat Fiber on Arterial Wall Damage in Diabetes: A Randomized Controlled Trial. Diabetes Care 2022, 45, 2862–2870. [Google Scholar] [CrossRef]
- König, D.; Kookhan, S.; Schaffner, D.; Deibert, P.; Berg, A. A Meal Replacement Regimen Improves Blood Glucose Levels in Prediabetic Healthy Individuals with Impaired Fasting Glucose. Nutrition 2014, 30, 1306–1309. [Google Scholar] [CrossRef]
- Li, D.; Zhang, P.; Guo, H.; Ling, W. Taking a Low Glycemic Index Multi-Nutrient Supplement as Breakfast Improves Glycemic Control in Patients with Type 2 Diabetes Mellitus: A Randomized Controlled Trial. Nutrients 2014, 6, 5740–5755. [Google Scholar] [CrossRef]
- Mateo-Gallego, R.; Pérez-Calahorra, S.; Lamiquiz-Moneo, I.; Marco-Benedí, V.; Bea, A.M.; Fumanal, A.J.; Prieto-Martín, A.; Laclaustra, M.; Cenarro, A.; Civeira, F. Effect of an Alcohol-Free Beer Enriched with Isomaltulose and a Resistant Dextrin on Insulin Resistance in Diabetic Patients with Overweight or Obesity. Clin. Nutr. 2020, 39, 475–483. [Google Scholar] [CrossRef]
- Solomon, T.P.J.; Haus, J.M.; Kelly, K.R.; Cook, M.D.; Filion, J.; Rocco, M.; Kashyap, S.R.; Watanabe, R.M.; Barkoukis, H.; Kirwan, J.P. A Low-Glycemic Index Diet Combined with Exercise Reduces Insulin Resistance, Postprandial Hyperinsulinemia, and Glucose-Dependent Insulinotropic Polypeptide Responses in Obese, Prediabetic Humans. Am. J. Clin. Nutr. 2010, 92, 1359–1368. [Google Scholar] [CrossRef]
- Krasinski, A.; Chiu, B.; Spence, J.D.; Fenster, A.; Parraga, G. Three-Dimensional Ultrasound Quantification of Intensive Statin Treatment of Carotid Atherosclerosis. Ultrasound Med. Biol. 2009, 35, 1763–1772. [Google Scholar] [CrossRef] [PubMed]
- Schwingshackl, L.; Chaimani, A.; Schwedhelm, C.; Toledo, E.; Pünsch, M.; Hoffmann, G.; Boeing, H. Comparative Effects of Different Dietary Approaches on Blood Pressure in Hypertensive and Pre-Hypertensive Patients: A Systematic Review and Network Meta-Analysis. Crit. Rev. Food Sci. Nutr. 2019, 59, 2674–2687. [Google Scholar] [CrossRef] [PubMed]
- Silveira Rossi, J.L.; Barbalho, S.M.; Reverete de Araujo, R.; Bechara, M.D.; Sloan, K.P.; Sloan, L.A. Metabolic Syndrome and Cardiovascular Diseases: Going beyond Traditional Risk Factors. Diabetes. Metab. Res. Rev. 2022, 38, e3502. [Google Scholar] [CrossRef] [PubMed]
- Tang, M.; Cao, H.; Wei, X.-H.; Zhen, Q.; Liu, F.; Wang, Y.-F.; Fan, N.-G.; Peng, Y.-D. Association Between High-Sensitivity C-Reactive Protein and Diabetic Kidney Disease in Patients with Type 2 Diabetes Mellitus. Front. Endocrinol. 2022, 13, 885516. [Google Scholar] [CrossRef] [PubMed]
- Akash, M.S.H.; Rehman, K.; Liaqat, A. Tumor Necrosis Factor-Alpha: Role in Development of Insulin Resistance and Pathogenesis of Type 2 Diabetes Mellitus. J. Cell. Biochem. 2018, 119, 105–110. [Google Scholar] [CrossRef]
- Najjar, S.M.; Abdolahipour, R.; Ghadieh, H.E.; Jahromi, M.S.; Najjar, J.A.; Abuamreh, B.A.M.; Zaidi, S.; Kumarasamy, S.; Muturi, H.T. Regulation of Insulin Clearance by Non-Esterified Fatty Acids. Biomedicines 2022, 10, 1899. [Google Scholar] [CrossRef]
- Deslippe, A.L.; Soanes, A.; Bouchaud, C.C.; Beckenstein, H.; Slim, M.; Plourde, H.; Cohen, T.R. Barriers and Facilitators to Diet, Physical Activity and Lifestyle Behavior Intervention Adherence: A Qualitative Systematic Review of the Literature. Int. J. Behav. Nutr. Phys. Act. 2023, 20, 14. [Google Scholar] [CrossRef]
- Wibisono, C.; Probst, Y.; Neale, E.; Tapsell, L. Impact of Food Supplementation on Weight Loss in Randomised-Controlled Dietary Intervention Trials: A Systematic Review and Meta-Analysis. Br. J. Nutr. 2016, 115, 1406–1414. [Google Scholar] [CrossRef]


| Population | Individuals with T2DM or prediabetes |
| Intervention | Low-GI/GL food, meal or diet |
| Comparison | Higher-GI/GL food, meal or diet |
| Outcomes | Outcomes related to glycemic control, blood lipids, blood pressure, inflammation, adiposity, CVD and other outcomes considered useful |
| Study length | ≥3 weeks |
| Study | Country (Year) | Study Design | Type of Intervention | Study Length | Diagnosis | DM Medication | Gender (%F) | Group | n | Age (Years) | BMI (kg/m2) | HbA1c (%) | Intervention Description |
|---|---|---|---|---|---|---|---|---|---|---|---|---|---|
| [31] | Bahrain (2020) | Parallel | Low-GI food | 4 mo | T2DM | - | 61 | T | 100 | 20–65 | >22 | 6–10 | |
| I | 50 | 55.3 ± 2.7 | 28.5 ± 7.7 | 6.6 ± 0.8 | 3 dates consumed at breakfast | ||||||||
| C | 50 | 56.9 ± 4.4 | 29.9 ± 4.1 | 6.6 ± 0.7 | No date consumption | ||||||||
| [32] | Greece (2015) | Parallel | Low-GI/GL food | 3 mo | T2DM | No insulin | 53 | T | 58 | 40–65 | 25–40 | <8 | |
| I | 28 | 61.3 ± 1.4 | 32.7 ± 0.8 | 6.6 ± 0.1 | Hypocaloric diet + 4 weekly portions of low-GI/GL sweets | ||||||||
| C | 30 | 63.0 ± 1.3 | 32.4 ± 0.8 | 6.8 ± 0.2 | Hypocaloric diet + 1 weekly portion of favorite sweet | ||||||||
| [37] | Thailand (2018) | Parallel | Low-GI meal | 3 mo | T2DM | Any type | 65 | T | 110 | ≥18 | - | 7–9 | |
| I | 53 | 56.0 ± 8.9 | 27.9 ± 4.2 | 7.9 ± 0.7 | Low-GI meal replacement once per day with controlled diets | ||||||||
| C | 57 | 56.3 ± 10.0 | 27.7 ± 4.9 | 7.8 ± 0.6 | Controlled diets | ||||||||
| [38] | China (2017) | Parallel | Low-GI diet | 6 mo | T2DM | Oral medication | 46 | T | 130 | - | - | - | |
| I | 65 | 56.9 ± 3.9 | - | - | Low-GI high-fiber diet + exercise | ||||||||
| C | 65 | 56.4 ± 3.7 | - | - | High fiber diet + exercise | ||||||||
| [39] | Brazil (2017) | Parallel | Low-GI diet | 1 mo | T2DM | Metformin | 50 | T | 20 | 18–55 | - | - | |
| I | 10 | 44.3 ± 4.8 | 28.8 (22.5–33.9) | - | Low-GI diet + 2 daily low-GI test meals consumed in the lab | ||||||||
| C | 10 | 41.1 ± 3.2 | 28.6 (25.4–37.5) | - | High-GI diet + 2 daily high-GI test meals consumed in the lab | ||||||||
| [40] | Canada (2017) | Parallel | Low-GI diet | 6 mo | T2DM | No acarbose | 39 | T | 201 | - | - | 6.5–8 | |
| I | 102 | 60.2 ± 9.5 | 30.5 ± 6.1 | 7.2 ± 0.6 | Low-GI high-fiber diet | ||||||||
| C | 99 | 61.3 ± 8.7 | 31.0 ± 5.5 | 7.1 ± 0.5 | High-cereal fiber diet | ||||||||
| [41] | Canada (2022) | Parallel | Low-GI diet | 3 y | T2DM | No insulin | 39 | T | 169 | - | - | 6.5–8 | |
| I | 86 | 61 ± 9 | 30 ± 5 | 7.1 ± 0.6 | Low-GI diet | ||||||||
| C | 83 | 62 ± 6 | 29 ± 5 | 7.1 ± 0.5 | Wheat-fiber diet | ||||||||
| [42] | Germany (2014) | Parallel | Low-GI food | 6 wk | Pre-DM | None | 62 | T | 42 | 54 ± 8 | ≥25 | - | |
| I | 28 | - | 32.9 ± 3.2 | - | Hypocaloric diet + 2 daily low-GI meal replacements | ||||||||
| C | 14 | - | 32.8 ± 2.3 | - | Hypocaloric diet + healthy lifestyle | ||||||||
| [43] | China (2014) | Parallel | Low-GI meal | 3 mo | T2DM | No insulin | 39 | T | 54 | 18–75 | 18.5–35 | - | |
| I | 36 | 56.7 ± 8.6 | 24.6 ± 2.6 | 6.7 ± 0.9 | Breakfast replaced with a low-GI, multi-nutrient supplement | ||||||||
| C | 18 | 54.5 ± 10.1 | 23.7 ± 2.9 | 6.5 ± 0.6 | Healthy breakfast | ||||||||
| [44] | Spain (2020) | Crossover | Low-GI food | 10 wk | T2DM Pre-DM | - | 38 | T | 43 | 55.8 ± 7.4 | 31.9 ± 3.1 | 6.0 ± 0.6 | |
| I | 42 | - | - | - | 66 mL/day of alcohol-free beer with modified CHO content | ||||||||
| C | 43 | - | - | - | 66 mL/day of regular alcohol-free beer | ||||||||
| [34] | India (2020) | Parallel | Low-GI diet | 6 mo | T2DM | Any type | 42 | T | 36 | 35–65 | ≤35 | 7–10 | |
| I | 18 | 52 ± 7.7 | 26.8 ± 5.0 | 8.3 ± 0.9 | Kerala cuisine low-GI diet | ||||||||
| C | 18 | - | 27.3 ± 2.7 | 8.2 ± 1.0 | Usual diet | ||||||||
| [33] | India (2020) | Parallel | Low-GI diet | 6 mo | T2DM | Any type | 35 | T | 80 | 35–65 | - | 7–10 | |
| I | 40 | 54.4 ± 7.6 | 26.4 ± 3.0 | 8.4 ± 1.0 | Kerala cuisine low-GI diet | ||||||||
| C | 40 | 51.9 ± 7.4 | 26.8 ± 3.3 | 8.3 ± 1.0 | Usual diet | ||||||||
| [35] | USA (2022) | Parallel | Low-GI diet | 1 mo | Pre-DM | None | 49 | T | 35 | 18–65 | - | - | |
| I | 17 | 58.1 ± 1.5 | 32.5 ± 1.2 | 5.8 ± 0.1 | Low-GI diet | ||||||||
| C | 18 | 50.6 ± 2.4 | 32.4 ± 1.5 | 5.8 ± 0.1 | High-GI diet | ||||||||
| [36] | Australia (2020) | Crossover | Low-GL diet | 2 mo | T2DM | No insulin | 36 | T | 17 | 58.0 ± 6.6 | 29.9 ± 3.5 | 7.0 ± 0.9 | |
| I | 17 | - | - | - | 20% daily energy intake replaced with lupin-enriched foods | ||||||||
| C | 17 | - | - | - | 20% daily energy intake replaced with wheat-based control foods |
| Study Reference | [31] | [32] | [37] | [38] | [39] | [40] | [41] | [42] | [43] | [44] | [34] | [33] | [35] | [36] | |
|---|---|---|---|---|---|---|---|---|---|---|---|---|---|---|---|
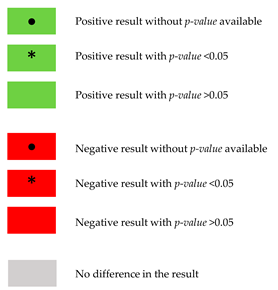
| Glycemic control | |||||||||||||||
| HbA1c | I | * | • | * | * | * | * | ||||||||
| C | * | • | * | • | |||||||||||
| p | >0.05 | >0.05 | >0.05 | <0.05 | >0.05 | <0.05 | <0.05 | <0.05 | <0.05 | ||||||
| HOMA-IR | I | * | * | * | * | ||||||||||
| C | * | ||||||||||||||
| p | >0.05 | <0.05 | <0.05 | <0.05 | |||||||||||
| Fasting glucose | I | * | • | * | * | • | |||||||||
| C | • | * | * | • | |||||||||||
| p | >0.05 | >0.05 | <0.05 | >0.05 | >0.05 | >0.05 | >0.05 | >0.05 | >0.05 | ||||||
| Fasting insulin | I | * | • | * | * | * | • | ||||||||
| C | • | • | |||||||||||||
| p | >0.05 | <0.05 | <0.05 | <0.05 | <0.05 | >0.05 | |||||||||
| C-peptide | I | ||||||||||||||
| C | |||||||||||||||
| p | >0.05 | ||||||||||||||
| Fructosamine | I | ||||||||||||||
| C | * | ||||||||||||||
| p | >0.05 | ||||||||||||||
| Glucose sensitivity | I | ||||||||||||||
| C | |||||||||||||||
| p | >0.05 | ||||||||||||||
| Anthropometry | |||||||||||||||
| Body weight | I | * | * | * | * | * | * | * | • | ||||||
| C | * | * | * | * | * | * | • | ||||||||
| p | >0.05 | >0.05 | >0.05 | <0.05 | >0.05 | >0.05 | <0.05 | <0.05 | >0.05 | ||||||
| BMI | I | * | * | * | * | • | |||||||||
| C | * | * | * | * | * | • | |||||||||
| p | >0.05 | >0.05 | >0.05 | >0.05 | >0.05 | <0.05 | <0.05 | <0.05 | |||||||
| Waist circumference | I | * | * | * | * | ||||||||||
| C | * | * | |||||||||||||
| p | >0.05 | >0.05 | >0.05 | <0.05 | >0.05 | >0.05 | >0.05 | ||||||||
| Hip circumference | I | * | |||||||||||||
| C | |||||||||||||||
| p | <0.05 | >0.05 | |||||||||||||
| Waist–hip ratio | I | * | |||||||||||||
| C | |||||||||||||||
| p | >0.05 | >0.05 | <0.05 | ||||||||||||
| Triceps skinfold | I | * | |||||||||||||
| C | |||||||||||||||
| p | <0.05 | ||||||||||||||
| Body composition | |||||||||||||||
| Fat mass | I | * | • | ||||||||||||
| C | * | • | |||||||||||||
| p | <0.05 | <0.05 | - | <0.05 | |||||||||||
| Fat free mass | I | • | |||||||||||||
| C | • | ||||||||||||||
| p | - | >0.05 | |||||||||||||
| Lipid profile | |||||||||||||||
| TC | I | * | * | * | * | • | |||||||||
| C | * | • | * | • | |||||||||||
| p | >0.05 | >0.05 | >0.05 | >0.05 | >0.05 | - | >0.05 | >0.05 | >0.05 | ||||||
| LDL-C | I | * | • | * | • | ||||||||||
| C | * | • | • | ||||||||||||
| p | >0.05 | >0.05 | <0.05 | >0.05 | >0.05 | >0.05 | >0.05 | ||||||||
| HDL-C | I | * | • | ||||||||||||
| C | * | * | * | • | |||||||||||
| p | >0.05 | <0.05 | >0.05 | >0.05 | <0.05 | >0.05 | >0.05 | >0.05 | >0.05 | ||||||
| VLDL | I | * | |||||||||||||
| C | • | ||||||||||||||
| p | >0.05 | >0.05 | |||||||||||||
| Triglycerides | I | * | * | • | |||||||||||
| C | * | • | * | • | |||||||||||
| p | >0.05 | >0.05 | >0.05 | >0.05 | <0.05 | - | >0.05 | <0.05 | >0.05 | ||||||
| LDL-C/HDL-C | I | ||||||||||||||
| C | * | ||||||||||||||
| p | >0.05 | >0.05 | |||||||||||||
| ApoB | I | * | |||||||||||||
| C | * | ||||||||||||||
| p | - | <0.05 | |||||||||||||
| Blood pressure | |||||||||||||||
| Systolic blood pressure | I | * | |||||||||||||
| C | * | * | |||||||||||||
| p | >0.05 | >0.05 | >0.05 | >0.05 | >0.05 | ||||||||||
| Diastolic blood pressure | I | * | * | * | |||||||||||
| C | * | * | * | ||||||||||||
| p | >0.05 | >0.05 | <0.05 | >0.05 | >0.05 | ||||||||||
| CVD risk | |||||||||||||||
| Vessel wall volume | I | ||||||||||||||
| C | * | ||||||||||||||
| p | >0.05 | ||||||||||||||
| Framingham risk score | I | ||||||||||||||
| C | |||||||||||||||
| p | >0.05 | ||||||||||||||
| Hs-cTnl | I | • | |||||||||||||
| C | • | ||||||||||||||
| p | >0.05 | ||||||||||||||
| Galectin-3 | I | • | |||||||||||||
| C | • | ||||||||||||||
| p | >0.05 | ||||||||||||||
| Inflammatory markers | |||||||||||||||
| C-reactive protein | I | * | |||||||||||||
| C | |||||||||||||||
| p | >0.05 | <0.05 | - | ||||||||||||
| High sensitivity C-reactive protein | I | * | • | * | |||||||||||
| C | • | ||||||||||||||
| p | <0.05 | <0.05 | <0.05 | ||||||||||||
| IL-6 | I | • | |||||||||||||
| C | • | ||||||||||||||
| p | >0.05 | <0.05 | - | ||||||||||||
| Hormones | |||||||||||||||
| Leptin | I | ||||||||||||||
| C | |||||||||||||||
| p | >0.05 | ||||||||||||||
| Adiponectin | I | ||||||||||||||
| C | |||||||||||||||
| p | >0.05 | >0.05 | |||||||||||||
| Hepatic function | |||||||||||||||
| AST | I | ||||||||||||||
| C | * | ||||||||||||||
| p | >0.05 | - | |||||||||||||
| ALT | I | ||||||||||||||
| C | |||||||||||||||
| p | >0.05 | - | |||||||||||||
| GGT | I | * | |||||||||||||
| C | |||||||||||||||
| p | >0.05 | - | |||||||||||||
| Uric acid | I | ||||||||||||||
| C | |||||||||||||||
| p | >0.05 | - | |||||||||||||
| Renal function | |||||||||||||||
| Urea | I | * | |||||||||||||
| C | * | ||||||||||||||
| p | >0.05 | ||||||||||||||
| Creatinine | I | ||||||||||||||
| C | * | ||||||||||||||
| p | <0.05 | ||||||||||||||
| eGFR | I | ||||||||||||||
| C | * | ||||||||||||||
| p | <0.05 | ||||||||||||||
| Intestinal microbiota | |||||||||||||||
| Enterococcus | I | • | |||||||||||||
| C | • | ||||||||||||||
| p | <0.05 | ||||||||||||||
| Escherichia coli | I | • | |||||||||||||
| C | • | ||||||||||||||
| p | <0.05 | ||||||||||||||
| Bifidobacterium | I | • | |||||||||||||
| C | • | ||||||||||||||
| p | <0.05 | ||||||||||||||
| Lactobacillus | I | • | |||||||||||||
| C | • | ||||||||||||||
| p | <0.05 | ||||||||||||||
| Quality of life | |||||||||||||||
| Total SF-36 score | I | * | |||||||||||||
| C | |||||||||||||||
| p | <0.05 | ||||||||||||||
| SF-36 mental health | I | * | |||||||||||||
| C | |||||||||||||||
| p | <0.05 | ||||||||||||||
 | |||||||||||||||
| Study | Dietary Intake Assessment | Group | Energy (kcal/Day) | CHO (E%) | Dietary Fiber (g/Day) | Diet GI | Diet GL | ||||||
|---|---|---|---|---|---|---|---|---|---|---|---|---|---|
| Baseline | End | Baseline | End | Baseline | End | Baseline | End | Baseline | End | ||||
| [31] | Food record | 5 days | I | 2233 ± 61 | 2230 ± 65 | 48.9 | 47.1 | 14.6 ± 3.1 | 11.6 ± 3.1 | - | - | - | - |
| Photo diary of meals | C | 2216 ± 55 | 2230 ± 65 | 64.4 | 52.5 | 14.3 ± 4.9 | 16.7 ± 3.1 | - | - | - | - | ||
| [32] | 24 h recall | 1 day | - | - | - | - | - | - | - | - | - | - | |
| Diary of sweets consumption | |||||||||||||
| [37] | Food record | - | I | 1350 ± 310 | - | 50 | - | - | - | - | - | - | - |
| C | 1210 ± 3730 | - | 50 | - | - | - | - | - | - | - | |||
| [39] | Food record | 3 days | I | 2218 ± 602 | 1998 ± 596 | 59.8 ± 9.3 | 57.0 ± 8.1 | 19.6 ± 7.6 | 21.4 ± 7.2 | 63 ± 6 | 54 ± 4 | 39.3 ± 12.4 | 32.5 ± 10.6 |
| C | 2432 ± 581 | 2013 ± 591 | 53.5 ± 8.4 | 57.9 ± 7.7 | 18.5 ± 5.4 | 20.6 ± 6.1 | 66 ± 4 | 72 ± 3 | 36.2 ± 10.1 | 39.3 ± 12.4 | |||
| [40] | Food record | 7 days | I | 1916 (1805–2026) | 1706 (1607–1805) | 42.2 (40.9–43.4) | 44.0 (42.4–45.6) | 26.6 | 31.9 | 80.8 (79.6–82.0) | 69.6 (67.7–71.4) | 161.6 (151.8–171.4) | 128.9 (120.5–137.3) |
| C | 1830 (1720–1940) | 1690 (1594–1786) | 45.4 (43.7–47.0) | 47.5 (45.8–49.1) | 25.8 | 26.5 | 81.5 (80.4–82.7) | 83.5 (82.4–84.7) | 169.0 (156.5–181.5) | 166.0 (155.5–176.4) | |||
| [41] | Food record | 7 days | I | 1757 ± 489 | 1529 ± 438 | 48.0 ± 8.1 | 49.2 ± 7.9 | 26.9 | 35.5 | 78.9 ± 5.6 | 67.3 ± 7.5 | 102 ± 32 | 73 ± 26 |
| C | 1765 ± 415 | 1533 ± 424 | 47.7 ± 8.0 | 49.3 ± 8.1 | 25.6 | 28.1 | 79.5 ± 6.9 | 81.3 ± 5.6 | 103 ± 29 | 93 ± 31 | |||
| [43] | 24 h recall | 3 days | I | 1567 ± 513 | 1446 ± 401 | 54.6 ± 8.1 | 45.6 ± 8.8 | - | - | - | - | - | - |
| C | 1426 ± 353 | 1523 ± 550 | 52.1 ± 9.4 | 42.7 ± 8.0 | - | - | - | - | - | - | |||
| [44] | Food record | 3 days | - | - | - | - | - | - | - | - | - | - | |
| [34] | 24 h recall * | 1 day | - | - | - | - | - | - | - | - | - | - | |
| FFQ | 59 items | ||||||||||||
| [33] | 24 h recall | 1 day | I | 1430 ± 182 | 1511 ± 138 | 64.6 ± 5.6 | 61.6 | - | - | - | - | - | - |
| FFQ | 60 items | C | 1555 ± 233 | 1450 ± 157 | 63.3 ± 6.0 | 65.7 | - | - | - | - | - | - | |
| [36] | Food record | 7 days | I | 995 ± 201 | - | 38.6 | - | 29 ± 6 | - | - | - | - | - |
| FFQ ** | - | C | 1117 ± 380 | - | 50.1 | - | 22 ± 6 | - | - | - | - | - | |
Disclaimer/Publisher’s Note: The statements, opinions and data contained in all publications are solely those of the individual author(s) and contributor(s) and not of MDPI and/or the editor(s). MDPI and/or the editor(s) disclaim responsibility for any injury to people or property resulting from any ideas, methods, instructions or products referred to in the content. |
© 2023 by the authors. Licensee MDPI, Basel, Switzerland. This article is an open access article distributed under the terms and conditions of the Creative Commons Attribution (CC BY) license (https://creativecommons.org/licenses/by/4.0/).
Share and Cite
Peres, M.; Costa, H.S.; Silva, M.A.; Albuquerque, T.G. The Health Effects of Low Glycemic Index and Low Glycemic Load Interventions on Prediabetes and Type 2 Diabetes Mellitus: A Literature Review of RCTs. Nutrients 2023, 15, 5060. https://doi.org/10.3390/nu15245060
Peres M, Costa HS, Silva MA, Albuquerque TG. The Health Effects of Low Glycemic Index and Low Glycemic Load Interventions on Prediabetes and Type 2 Diabetes Mellitus: A Literature Review of RCTs. Nutrients. 2023; 15(24):5060. https://doi.org/10.3390/nu15245060
Chicago/Turabian StylePeres, Maria, Helena S. Costa, Mafalda Alexandra Silva, and Tânia Gonçalves Albuquerque. 2023. "The Health Effects of Low Glycemic Index and Low Glycemic Load Interventions on Prediabetes and Type 2 Diabetes Mellitus: A Literature Review of RCTs" Nutrients 15, no. 24: 5060. https://doi.org/10.3390/nu15245060
APA StylePeres, M., Costa, H. S., Silva, M. A., & Albuquerque, T. G. (2023). The Health Effects of Low Glycemic Index and Low Glycemic Load Interventions on Prediabetes and Type 2 Diabetes Mellitus: A Literature Review of RCTs. Nutrients, 15(24), 5060. https://doi.org/10.3390/nu15245060