
Carbon Dioxide (CO2) Dietary Emissions Are Related to Oxidative and Inflammatory Status in Adult Population

 ,
,  , ,
, ,  , ,
, ,  and
and 
Abstract
:1. Introduction
2. Materials and Methods
2.1. Study Design
2.2. Anthropometric Measurements
2.3. Blood Collection and Analysis
2.4. Blood Samples Processing
2.5. Fatty Liver Index
2.6. Dietary Inflammatory Index
2.7. Assessment of Mediterranean Diet Adherence
2.8. Enzymatic Determinations
2.9. Malondialdehyde Assay
2.10. Polyphenols Determination
2.11. ROS Production in Neutrophils and PBMCs
2.12. Immunoassay Kits
2.13. Statistics
3. Results
4. Discussion
Strengths and Limitations
5. Conclusions
Author Contributions
Funding
Institutional Review Board Statement
Informed Consent Statement
Data Availability Statement
Acknowledgments
Conflicts of Interest
References
- Qiao, W.; Xu, S.; Liu, Z.; Fu, X.; Zhao, H.; Shi, S. Challenges and opportunities in C1-based biomanufacturing. Bioresour. Technol. 2022, 364, 128095. [Google Scholar] [CrossRef] [PubMed]
- United Nations (UN). Sustainable Development Goals. Available online: https://sdgs.un.org/es/goals (accessed on 10 May 2023).
- Tilman, D.; Clark, M. Global diets link environmental sustainability and human health. Nature 2014, 515, 518–522. [Google Scholar] [CrossRef] [PubMed]
- Food and Agriculture Organization of the United Nations. Food Systems Account for More Than One Third of Global Greenhouse Gas Emissions; FAO Publication: Rome, Italy, 2021. [Google Scholar]
- Willett, W.; Rockström, J.; Loken, B.; Springmann, M.; Lang, T.; Vermeulen, S.; Garnett, T.; Tilman, D.; DeClerck, F.; Wood, A.; et al. Food in the Anthropocene: The EAT-Lancet Commission on healthy diets from sustainable food systems. Lancet 2019, 393, 447–492. [Google Scholar] [CrossRef] [PubMed]
- Magkos, F.; Tetens, I.; Bügel, S.G.; Felby, C.; Schacht, S.R.; Hill, J.O.; Ravussin, E.; Astrup, A. The Environmental Foodprint of Obesity. Obesity 2020, 28, 73–79. [Google Scholar] [CrossRef] [PubMed]
- MacDiarmid, J.I. Is a healthy diet an environmentally sustainable diet? Proc. Nutr. Soc. 2013, 72, 13–20. [Google Scholar] [CrossRef] [PubMed]
- Biswas, T.; Garnett, S.P.; Pervin, S.; Rawal, L.B. The prevalence of underweight, overweight and obesity in Bangladeshi adults: Data from a national survey. PLoS ONE 2017, 12, e0177395. [Google Scholar] [CrossRef]
- Pahwa, R.; Adams-Huet, B.; Jialal, I. The effect of increasing body mass index on cardio-metabolic risk and biomarkers of oxidative stress and inflammation in nascent metabolic syndrome. J. Diabetes Complicat. 2017, 31, 810–813. [Google Scholar] [CrossRef]
- Jacobson, T.A.; Kler, J.S.; Hernke, M.T.; Braun, R.K.; Meyer, K.C.; Funk, W.E. Direct human health risks of increased atmospheric carbon dioxide. Nat. Sustain. 2019, 2, 691–701. [Google Scholar] [CrossRef]
- Beheshti, A.; Cekanaviciute, E.; Smith, D.J.; Costes, S.V. Global transcriptomic analysis suggests carbon dioxide as an environmental stressor in spaceflight: A systems biology GeneLab case study. Sci. Rep. 2018, 8, 4191. [Google Scholar] [CrossRef] [PubMed]
- García-Sánchez, A.; Gámez-Nava, J.I.; Díaz-de la Cruz, E.N.; Cardona-Muñoz, E.G.; Becerra-Alvarado, I.N.; Aceves-Aceves, J.A.; Sánchez-Rodríguez, E.N.; Miranda-Díaz, A.G. The Effect of Visceral Abdominal Fat Volume on Oxidative Stress and Proinflammatory Cytokines in Subjects with Normal Weight, Overweight and Obesity. Diabetes Metab. Syndr. Obes. Targets Ther. 2020, 13, 1077–1087. [Google Scholar] [CrossRef] [PubMed]
- Popko, K.; Gorska, E.; Stelmaszczyk-Emmel, A.; Plywaczewski, R.; Stoklosa, A.; Gorecka, D.; Pyrzak, B.; Demkow, U. Proinflammatory cytokines IL-6 and TNF-α and the development of inflammation in obese subjects. Eur. J. Med. Res. 2010, 15, 120–122. [Google Scholar] [CrossRef]
- Sheikhansari, G.; Soltani-Zangbar, M.S.; Pourmoghadam, Z.; Kamrani, A.; Azizi, R.; Aghebati-Maleki, L.; Danaii, S.; Koushaeian, L.; Hojat-Farsangi, M.; Yousefi, M. Oxidative stress, inflammatory settings, and microRNA regulation in the recurrent implantation failure patients with metabolic syndrome. Am. J. Reprod. Immunol. 2019, 82, e13170. [Google Scholar] [CrossRef] [PubMed]
- Savaş, E.M.; Oğuz, S.H.; Samadi, A.; Yılmaz Işıkhan, S.; Ünlütürk, U.; Lay, İ.; Gürlek, A. Apoptosis Inhibitor of Macrophage, Monocyte Chemotactic Protein-1, and C-Reactive Protein Levels Are Increased in Patients with Metabolic Syndrome: A Pilot Study. Metab. Syndr. Relat. Disord. 2020, 18, 197–205. [Google Scholar] [CrossRef] [PubMed]
- Quetglas-Llabrés, M.M.; Monserrat-Mesquida, M.; Bouzas, C.; Gómez, C.; Mateos, D.; Ripoll-Vera, T.; Tur, J.A.; Sureda, A. Inflammatory and Oxidative Stress Markers Related to Adherence to the Mediterranean Diet in Patients with Metabolic Syndrome. Antioxidants 2022, 11, 901. [Google Scholar] [CrossRef] [PubMed]
- Alberti, K.G.M.M.; Eckel, R.H.; Grundy, S.M.; Zimmet, P.Z.; Cleeman, J.I.; Donato, K.A.; Fruchart, J.C.; James, W.P.T.; Loria, C.M.; Smith, S.C. Harmonizing the metabolic syndrome: A joint interim statement of the international diabetes federation task force on epidemiology and prevention; National heart, lung, and blood institute; American heart association; World heart federation; International. Circulation 2009, 120, 1640–1645. [Google Scholar] [CrossRef]
- Martínez-González, M.A.; Buil-Cosiales, P.; Corella, D.; Bullo, M.; Fito, M.; Vioque, J.; Romaguera, D.; Martínez, J.A.; Wärnberg, J.; Lopez-Miranda, J.; et al. Cohort profile: Design and methods of the PREDIMED-Plus randomized trial. Int. J. Epidemiol. 2019, 48, 387–388o. [Google Scholar] [CrossRef] [PubMed]
- Hartikaiinen, H.; Pulkkinen, H. Summary of the Chosen Methodologies and Practices to Produce GHGE-Estimates for an Average European Diet; Natural Resources Institute Finland: Helsinki, Finland, 2016.
- Fernández-Ballart, J.D.; Piñol, J.L.; Zazpe, I.; Corella, D.; Carrasco, P.; Toledo, E.; Perez-Bauer, M.; Martínez-González, M.Á.; Salas-Salvadó, J.; Martín-Moreno, J.M. Relative validity of a semi-quantitative food-frequency questionnaire in an elderly Mediterranean population of Spain. Br. J. Nutr. 2010, 103, 1808–1816. [Google Scholar] [CrossRef] [PubMed]
- García, S.; Bouzas, C.; Mateos, D.; Pastor, R.; Álvarez, L.; Rubín, M.; Martínez-González, M.Á.; Salas-Salvadó, J.; Corella, D.; Goday, A.; et al. Carbon dioxide (CO2) emissions and adherence to Mediterranean diet in an adult population: The Mediterranean diet index as a pollution level index. Environ. Health 2023, 22, 1. [Google Scholar] [CrossRef]
- Levey, A.S.; Stevens, L.A.; Schmid, C.H.; Zhang, Y.; Castro, A.F.; Feldman, H.I.; Kusek, J.W.; Eggers, P.; Lente, F.V.; Greene, T.; et al. A new equation to estimate glomerular filtration rate. Ann. Intern. Med. 2009, 150, 604–612. [Google Scholar] [CrossRef]
- Bøyum, A. Separation of White Blood Cells. Nature 1964, 204, 793–794. [Google Scholar] [CrossRef]
- Monserrat-Mesquida, M.; Quetglas-Llabrés, M.; Capó, X.; Bouzas, C.; Mateos, D.; Pons, A.; Tur, J.A.; Sureda, A. Metabolic Syndrome is Associated with Oxidative Stress and Proinflammatory State. Antioxidants 2020, 9, 236. [Google Scholar] [CrossRef]
- Jäger, S.; Jacobs, S.; Kröger, J.; Stefan, N.; Fritsche, A.; Weikert, C.; Boeing, H.; Schulze, M.B. Association between the Fatty Liver Index and Risk of Type 2 Diabetes in the EPIC-Potsdam Study. PLoS ONE 2015, 10, e0124749. [Google Scholar] [CrossRef] [PubMed]
- Shivappa, N.; Steck, S.E.; Hurley, T.G.; Hussey, J.R.; Hébert, J.R. Designing and developing a literature-derived, population-based dietary inflammatory index. Public Health Nutr. 2014, 17, 1689–1696. [Google Scholar] [CrossRef] [PubMed]
- Bouzas, C.; Bibiloni, M.D.M.; Julibert, A.; Ruiz-canela, M.; Salas-salvadó, J.; Corella, D.; Zomeño, M.D.; Romaguera, D.; Vioque, J.; Alonso-gómez, Á.M.; et al. Adherence to the Mediterranean Lifestyle and Desired Body Weight Loss in a Mediterranean Adult Population with Overweight: A PREDIMED-Plus Study. Nutrients 2020, 12, 2114. [Google Scholar] [CrossRef]
- Aebi, H. Catalase in vitro. Methods Enzymol. 1984, 105, 121–126. [Google Scholar] [PubMed]
- Flohé, L.; Otting, F. Superoxide dismutase assays. Methods Enzymol. 1984, 105, 93–104. [Google Scholar] [PubMed]
- Medina-Remón, A.; Tresserra-Rimbau, A.; Pons, A.; Tur, J.A.; Martorell, M.; Ros, E.; Buil-Cosiales, P.; Sacanella, E.; Covas, M.I.; Corella, D.; et al. Effects of total dietary polyphenols on plasma nitric oxide and blood pressure in a high cardiovascular risk cohort. The PREDIMED randomized trial. Nutr. Metab. Cardiovasc. Dis. 2015, 25, 60–67. [Google Scholar] [CrossRef] [PubMed]
- Monserrat-Mesquida, M.; Quetglas-Llabrés, M.; Bouzas, C.; García, S.; Mateos, D.; Gómez, C.; Gámez, J.M.; Poulsen, H.E.; Tur, J.A.; Sureda, A. Effects of 2-Year Nutritional and Lifestyle Intervention on Oxidative and Inflammatory Statuses in Individuals of 55 Years of Age and over at High Cardiovascular Risk. Antioxidants 2022, 11, 1326. [Google Scholar] [CrossRef]
- Baker, P.; Machado, P.; Santos, T.; Sievert, K.; Backholer, K.; Hadjikakou, M.; Russell, C.; Huse, O.; Bell, C.; Scrinis, G.; et al. Ultra-processed foods and the nutrition transition: Global, regional and national trends, food systems transformations and political economy drivers. Obes. Rev. 2020, 21, e13126. [Google Scholar] [CrossRef]
- Fresán, U.; Martínez-Gonzalez, M.A.; Sabaté, J.; Bes-Rastrollo, M. The Mediterranean diet, an environmentally friendly option: Evidence from the Seguimiento Universidad de Navarra (SUN) cohort. Public Health Nutr. 2018, 21, 1573–1582. [Google Scholar] [CrossRef]
- Adnan, M.T.; Amin, M.N.; Uddin, M.G.; Hussain, M.S.; Sarwar, M.S.; Hossain, M.K.; Uddin, S.M.N.; Islam, M.S. Increased concentration of serum MDA, decreased antioxidants and altered trace elements and macro-minerals are linked to obesity among Bangladeshi population. Diabetes Metab. Syndr. Clin. Res. Rev. 2019, 13, 933–938. [Google Scholar] [CrossRef]
- Capó, X.; Martorell, M.; Busquets-Cortés, C.; Sureda, A.; Riera, J.; Drobnic, F.; Tur, J.A.; Pons, A. Effects of dietary almond- and olive oil-based docosahexaenoic acid- and Vitamin E-enriched beverage supplementation on athletic performance and oxidative stress markers. Food Funct. 2016, 7, 4920–4934. [Google Scholar] [CrossRef] [PubMed]
- Wu, S.-S.; Kor, C.-T.; Chen, T.-Y.; Liu, K.-H.; Shih, K.-L.; Su, W.-W.; Wu, H.-M. Relationships between Serum Uric Acid, Malondialdehyde Levels, and Carotid Intima-Media Thickness in the Patients with Metabolic Syndrome. Oxid. Med. Cell. Longev. 2019, 2019, 6859757. [Google Scholar] [CrossRef]
- Bahrami, A.; Nikoomanesh, F.; Khorasanchi, Z.; Mohamadian, M.; Ferns, G.A. The relationship between food quality score with inflammatory biomarkers, and antioxidant capacity in young women. Physiol. Rep. 2023, 11, e15590. [Google Scholar] [CrossRef] [PubMed]
- Åsgård, R.; Rytter, E.; Basu, S.; Abramsson-Zetterberg, L.; Möller, L.; Vessby, B. High intake of fruit and vegetables is related to low oxidative stress and inflammation in a group of patients with type 2 diabetes. Scand. J. Food Nutr. 2007, 51, 149. [Google Scholar] [CrossRef]
- Markoski, M.M.; Garavaglia, J.; Oliveira, A.; Olivaes, J.; Marcadenti, A. Molecular Properties of Red Wine Compounds and Cardiometabolic Benefits. Nutr. Metab. Insights 2016, 9, 51–57. [Google Scholar] [CrossRef] [PubMed]
- Delage, P.; Ségrestin, B.; Seyssel, K.; Chanon, S.; Vieille-Marchiset, A.; Durand, A.; Nemeth, A.; Métairon, S.; Charpagne, A.; Descombes, P.; et al. Adipose tissue angiogenesis genes are down-regulated by grape polyphenols supplementation during a human overfeeding trial. J. Nutr. Biochem. 2023, 117, 109334. [Google Scholar] [CrossRef] [PubMed]
- Versleijen, M.; Roelofs, H.; Preijers, F.; Roos, D.; Wanten, G. Parenteral lipids modulate leukocyte phenotypes in whole blood, depending on their fatty acid composition. Clin. Nutr. 2005, 24, 822–829. [Google Scholar] [CrossRef] [PubMed]
- Monserrat-Mesquida, M.; Quetglas-Llabrés, M.; Bouzas, C.; Capó, X.; Mateos, D.; Ugarriza, L.; Tur, J.A.; Sureda, A. Peripheral Blood Mononuclear Cells Oxidative Stress and Plasma Inflammatory Biomarkers in Adults with Normal Weight, Overweight and Obesity. Antioxidants 2021, 10, 813. [Google Scholar] [CrossRef]
- Mosaad, Y.O.; Hussein, M.A.; Ateyya, H.; Mohamed, A.H.; Ali, A.A.; Youssuf, A.R.; Wink, M.; El-Kholy, A.A. Vanin 1 Gene Role in Modulation of iNOS/MCP-1/TGF-β1 Signaling Pathway in Obese Diabetic Patients. J. Inflamm. Res. 2022, 15, 6745–6759. [Google Scholar] [CrossRef]
- Newsholme, P.; Cruzat, V.F.; Keane, K.N.; Carlessi, R.; De Bittencourt, P.I.H. Molecular mechanisms of ROS production and oxidative stress in diabetes. Biochem. J. 2016, 473, 4527–4550. [Google Scholar] [CrossRef]
- Liu, Y.; Li, Z.; Wang, Y.; Cai, Q.; Liu, H.; Xu, C.; Zhang, F. IL-15 Participates in the Pathogenesis of Polycystic Ovary Syndrome by Affecting the Activity of Granulosa Cells. Front. Endocrinol. 2022, 3, 7878763. [Google Scholar] [CrossRef] [PubMed]
- Azzini, E.; Peluso, I.; Intorre, F.; Barnaba, L.; Venneria, E.; Foddai, M.S.; Ciarapica, D.; Maiani, F.; Raguzzini, A.; Polito, A. Total and Plant Protein Consumption: The Role of Inflammation and Risk of Non-Communicable Disease. Int. J. Mol. Sci. 2022, 23, 8008. [Google Scholar] [CrossRef] [PubMed]
- Senior, A.M.; Solon-Biet, S.M.; Cogger, V.C.; Le Couteur, D.G.; Nakagawa, S.; Raubenheimer, D.; Simpson, S.J. Dietary macronutrient content, age-specific mortality and lifespan. Proc. R. Soc. B Biol. Sci. 2019, 286, 20190393. [Google Scholar] [CrossRef]
- Malesza, I.J.; Malesza, M.; Walkowiak, J.; Mussin, N.; Walkowiak, D.; Aringazina, R.; Bartkowiak-Wieczorek, J.; Mądry, E. High-Fat, Western-Style Diet, Systemic Inflammation, and Gut Microbiota: A Narrative Review. Cells 2021, 10, 3164. [Google Scholar] [CrossRef] [PubMed]
- Sankhla, M.; Sharma, T.K.; Mathur, K.; Rathor, J.S.; Butolia, V.; Gadhok, A.K.; Vardey, S.K.; Sinha, M.; Kaushik, G.G. Relationship of oxidative stress with obesity and its role in obesity induced metabolic syndrome. Clin. Lab. 2012, 58, 385–392. [Google Scholar] [PubMed]
- Boccardi, V.; Mancinetti, F.; Baroni, M.; Cecchetti, R.; Bastiani, P.; Ruggiero, C.; Mecocci, P. Metabolic Score for Insulin Resistance (METS-IR) and Circulating Cytokines in Older Persons: The Role of Gender and Body Mass Index. Nutrients 2022, 14, 3228. [Google Scholar] [CrossRef]
- Steppan, C.M.; Bailey, S.T.; Bhat, S.; Brown, E.J.; Banerjee, R.R.; Wright, C.M.; Patel, H.R.; Ahima, R.S.; Lazar, M.A. The hormone resistin links obesity to diabetes. Nature 2001, 409, 307–312. [Google Scholar] [CrossRef]
- Kim, K.H.; Lee, K.; Moon, Y.S.; Sul, H.S. A cysteine-rich adipose tissue-specific secretory factor inhibits adipocyte differentiation. J. Biol. Chem. 2001, 276, 11252–11256. [Google Scholar] [CrossRef]
- Filková, M.; Haluzík, M.; Gay, S.; Šenolt, L. The role of resistin as a regulator of inflammation: Implications for various human pathologies. Clin. Immunol. 2009, 133, 157–170. [Google Scholar] [CrossRef]
- Silswal, N.; Singh, A.K.; Aruna, B.; Mukhopadhyay, S.; Ghosh, S.; Ehtesham, N.Z. Human resistin stimulates the pro-inflammatory cytokines TNF-alpha and IL-12 in macrophages by NF-kappaB-dependent pathway. Biochem. Biophys. Res. Commun. 2005, 334, 1092–1101. [Google Scholar] [CrossRef] [PubMed]
- Taouis, M.; Benomar, Y. Is resistin the master link between inflammation and inflammation-related chronic diseases? Mol. Cell. Endocrinol. 2021, 533, 111341. [Google Scholar] [CrossRef] [PubMed]
- Zhang, F.; Chen, Y.; Heiman, M.; DiMarchi, R. Leptin: Structure, function and biology. Vitam. Horm. 2005, 71, 345–372. [Google Scholar] [PubMed]
- DiNicolantonio, J.J.; Lucan, S.C.; O’Keefe, J.H. The Evidence for Saturated Fat and for Sugar Related to Coronary Heart Disease. Prog. Cardiovasc. Dis. 2016, 58, 464–472. [Google Scholar] [CrossRef] [PubMed]


| ≤2.6 kg CO2/day n = 50 | >2.6 kg CO2/day n = 50 | p-Value | |
|---|---|---|---|
| Mean (SD) | Mean (SD) | ||
| Weight (kg) | 87.4 (13.9) | 87.8 (13.5) | 0.794 |
| Height (cm) | 162.6 (9.0) | 163.0 (9.6) | 0.720 |
| BMI (kg/m2) | 32.9 (3.6) | 32.9 (3.6) | 0.936 |
| WHtR | 0.687 (0.6) | 0.681 (0.5) | 0.368 |
| Abdominal obesity (cm) | 111.1 (10.2) | 111.4 (10.1) | 0.786 |
| Systolic blood pressure (mmHg) | 138.6 (15.9) | 138.9 (18.1) | 0.907 |
| Diastolic blood pressure (mmHg) | 80.3 (9.9) | 80.6 (9.5) | 0.908 |
| Glucose (mg/dL) | 118.3 (36.2) | 117.8 (35.7) | 0.896 |
| HbA1c (%) | 6.19 (1.1) | 6.25 (1.21) | 0.689 |
| Triglycerides (mg/dL) | 148.5 (70.4) | 154.0 (73.6) | 0.531 |
| HDL-cholesterol (mg/dL) | 44.2 (10.9) | 44.2 (9.9) | 0.971 |
| LDL-cholesterol (mg/dL) | 117.6 (34.8) | 120.9 (35.0) | 0.445 |
| Total cholesterol (mg/dL) | 184.1 (38.1) | 186.0 (38.8) | 0.692 |
| AST (U/L) | 20.3 (5.1) | 20.1 (6.4) | 0.798 |
| ALT (U/L) | 22.7 (11.8) | 22.1 (9.8) | 0.652 |
| GGT (U/L) | 31.9 (22.9) | 33.4 (24.3) | 0.611 |
| FLI | 79.0 (18.1) | 80.8 (16.3) | 0.389 |
| DII | −0.17 (2.2) | 0.82 (2.0) | <0.001 |
| ADM | 7.92 (2.6) | 7.07 (2.3) | 0.004 |
| ≤2.6 kg CO2/day n = 50 | >2.6 kg CO2/day n = 50 | p-Value | |
|---|---|---|---|
| Mean (SD) | Mean (SD) | ||
| Hematocrit (%) | 42.9 (4.1) | 43.1 (3.9) | 0.688 |
| Erythrocytes (106/mm3) | 4.79 (0.5) | 4.78 (0.5) | 0.962 |
| Leukocytes (103/mm3) | 7.31 (1.7) | 7.40 (1.8) | 0.664 |
| Neutrophils (103/mm3) | 4.34 (2.8) | 4.41 (4.1) | 0.870 |
| Lymphocytes (103/mm3) | 2.59 (2.3) | 2.42 (0.8) | 0.411 |
| Monocytes (103/mm3) | 0.68 (0.6) | 0.73 (0.8) | 0.574 |
| Eosinophils (103/mm3) | 0.24 (0.5) | 0.29 (0.4) | 0.340 |
| Basophils (103/mm3) | 0.05 (0.1) | 0.09 (0.4) | 0.277 |
| Hemoglobin (g/dL) | 14.5 (1.4) | 14.5 (1.5) | 0.913 |
| Medium corpuscular volume | 89.9 (5.4) | 90.4 (4.6) | 0.476 |
| Platelets | 218.0 (57.2) | 224.6 (56.6) | 0.344 |
| Uric acid (mg/dL) | 6.33 (1.4) | 6.14 (1.3) | 0.269 |
| Creatinine in serum (mg/dL) | 0.83 (0.2) | 0.84 (0.2) | 0.648 |
| Urine albumin (mg/dL) | 19.4 (23.1) | 21.4 (27.6) | 0.594 |
| Urine creatinine (mg/dL) | 95.2 (53.9) | 102.8 (50.7) | 0.242 |
| Albumin/creatinine ratio in mg/g creatinine (uACR) | 22.4 (29.7) | 24.3 (32.2) | 0.315 |
| eGFR (mL/min per 1.73 m2) | 81.3 (19.1) | 84.0 (17.2) | 0.234 |
| ≤2.6 kg CO2/day n = 50 | >2.6 kg CO2/day n = 50 | p-Value | |
|---|---|---|---|
| Mean (SD) | Mean (SD) | ||
| Plasma enzymes | |||
| CAT (kat/L blood) | 49.6 (23.6) | 53.4 (24.3) | 0.336 |
| SOD (pkat/L blood) | 153.9 (64.3) | 164.7 (88.8) | 0.421 |
| Oxidative damage | |||
| MDA plasma (nM) | 1.08 (0.55) | 1.36 (0.58) | 0.003 |
| MDA urine/creatinine (mM/mM) | 80.9 (45.7) | 115.2 (98.9) | 0.005 |
| Polyphenols plasma (mg/mL) | 0.06 (0.02) | 0.05 (0.01) | 0.029 |
| Polyphenols urine/creatinine (g/L/mM) | 15.6 (12.6) | 12.6 (8.2) | 0.079 |
| ROS production | |||
| PBMCs Zym (RLU/min·103 cells) | 3024 (1519) | 3737 (2081) | 0.002 |
| PBMCs LPS (RLU/min·103 cells) | 1190 (670) | 1444 (943) | 0.010 |
| Neutrophils Zym (RLU/min·103 cells) | 10,538 (5679) | 11,831 (5818) | 0.056 |
| Neutrophils LPS (RLU/min·103 cells) | 2994 (1414) | 3612 (1912) | 0.016 |
| Variables | ≤2.6 kg CO2/day n = 50 | >2.6 kg CO2/day n = 50 | p-Value |
|---|---|---|---|
| OR (95% CI) | OR (95% CI) | ||
| CAT plasma | 1.00 (ref.) | 1.18 (0.606–2.296) | 0.628 |
| SOD plasma | 1.00 (ref.) | 0.70 (0.338–1.464) | 0.348 |
| MDA plasma | 1.00 (ref.) | 1.45 (0.761–2.774) | 0.258 |
| MDA urine/creatinine | 1.00 (ref.) | 0.96 (0.342–2.657) | 0.927 |
| Polyphenols plasma | 1.00 (ref.) | 1.15 (0.681–1.943) | 0.601 |
| Polyphenols urine/creatinine | 1.00 (ref.) | 0.92 (0.429–1.964) | 0.826 |
| ROS PBMCs Zym | 1.00 (ref.) | 3.75 (2.166–6.491) | <0.001 |
| ROS PBMCs LPS | 1.00 (ref.) | 1.27 (0.783–2.071) | 0.330 |
| ROS neutrophils Zym | 1.00 (ref.) | 1.75 (1.093–2.809) | 0.020 |
| ROS neutrophils LPS | 1.00 (ref.) | 1.09 (0.664–1.782) | 0.738 |
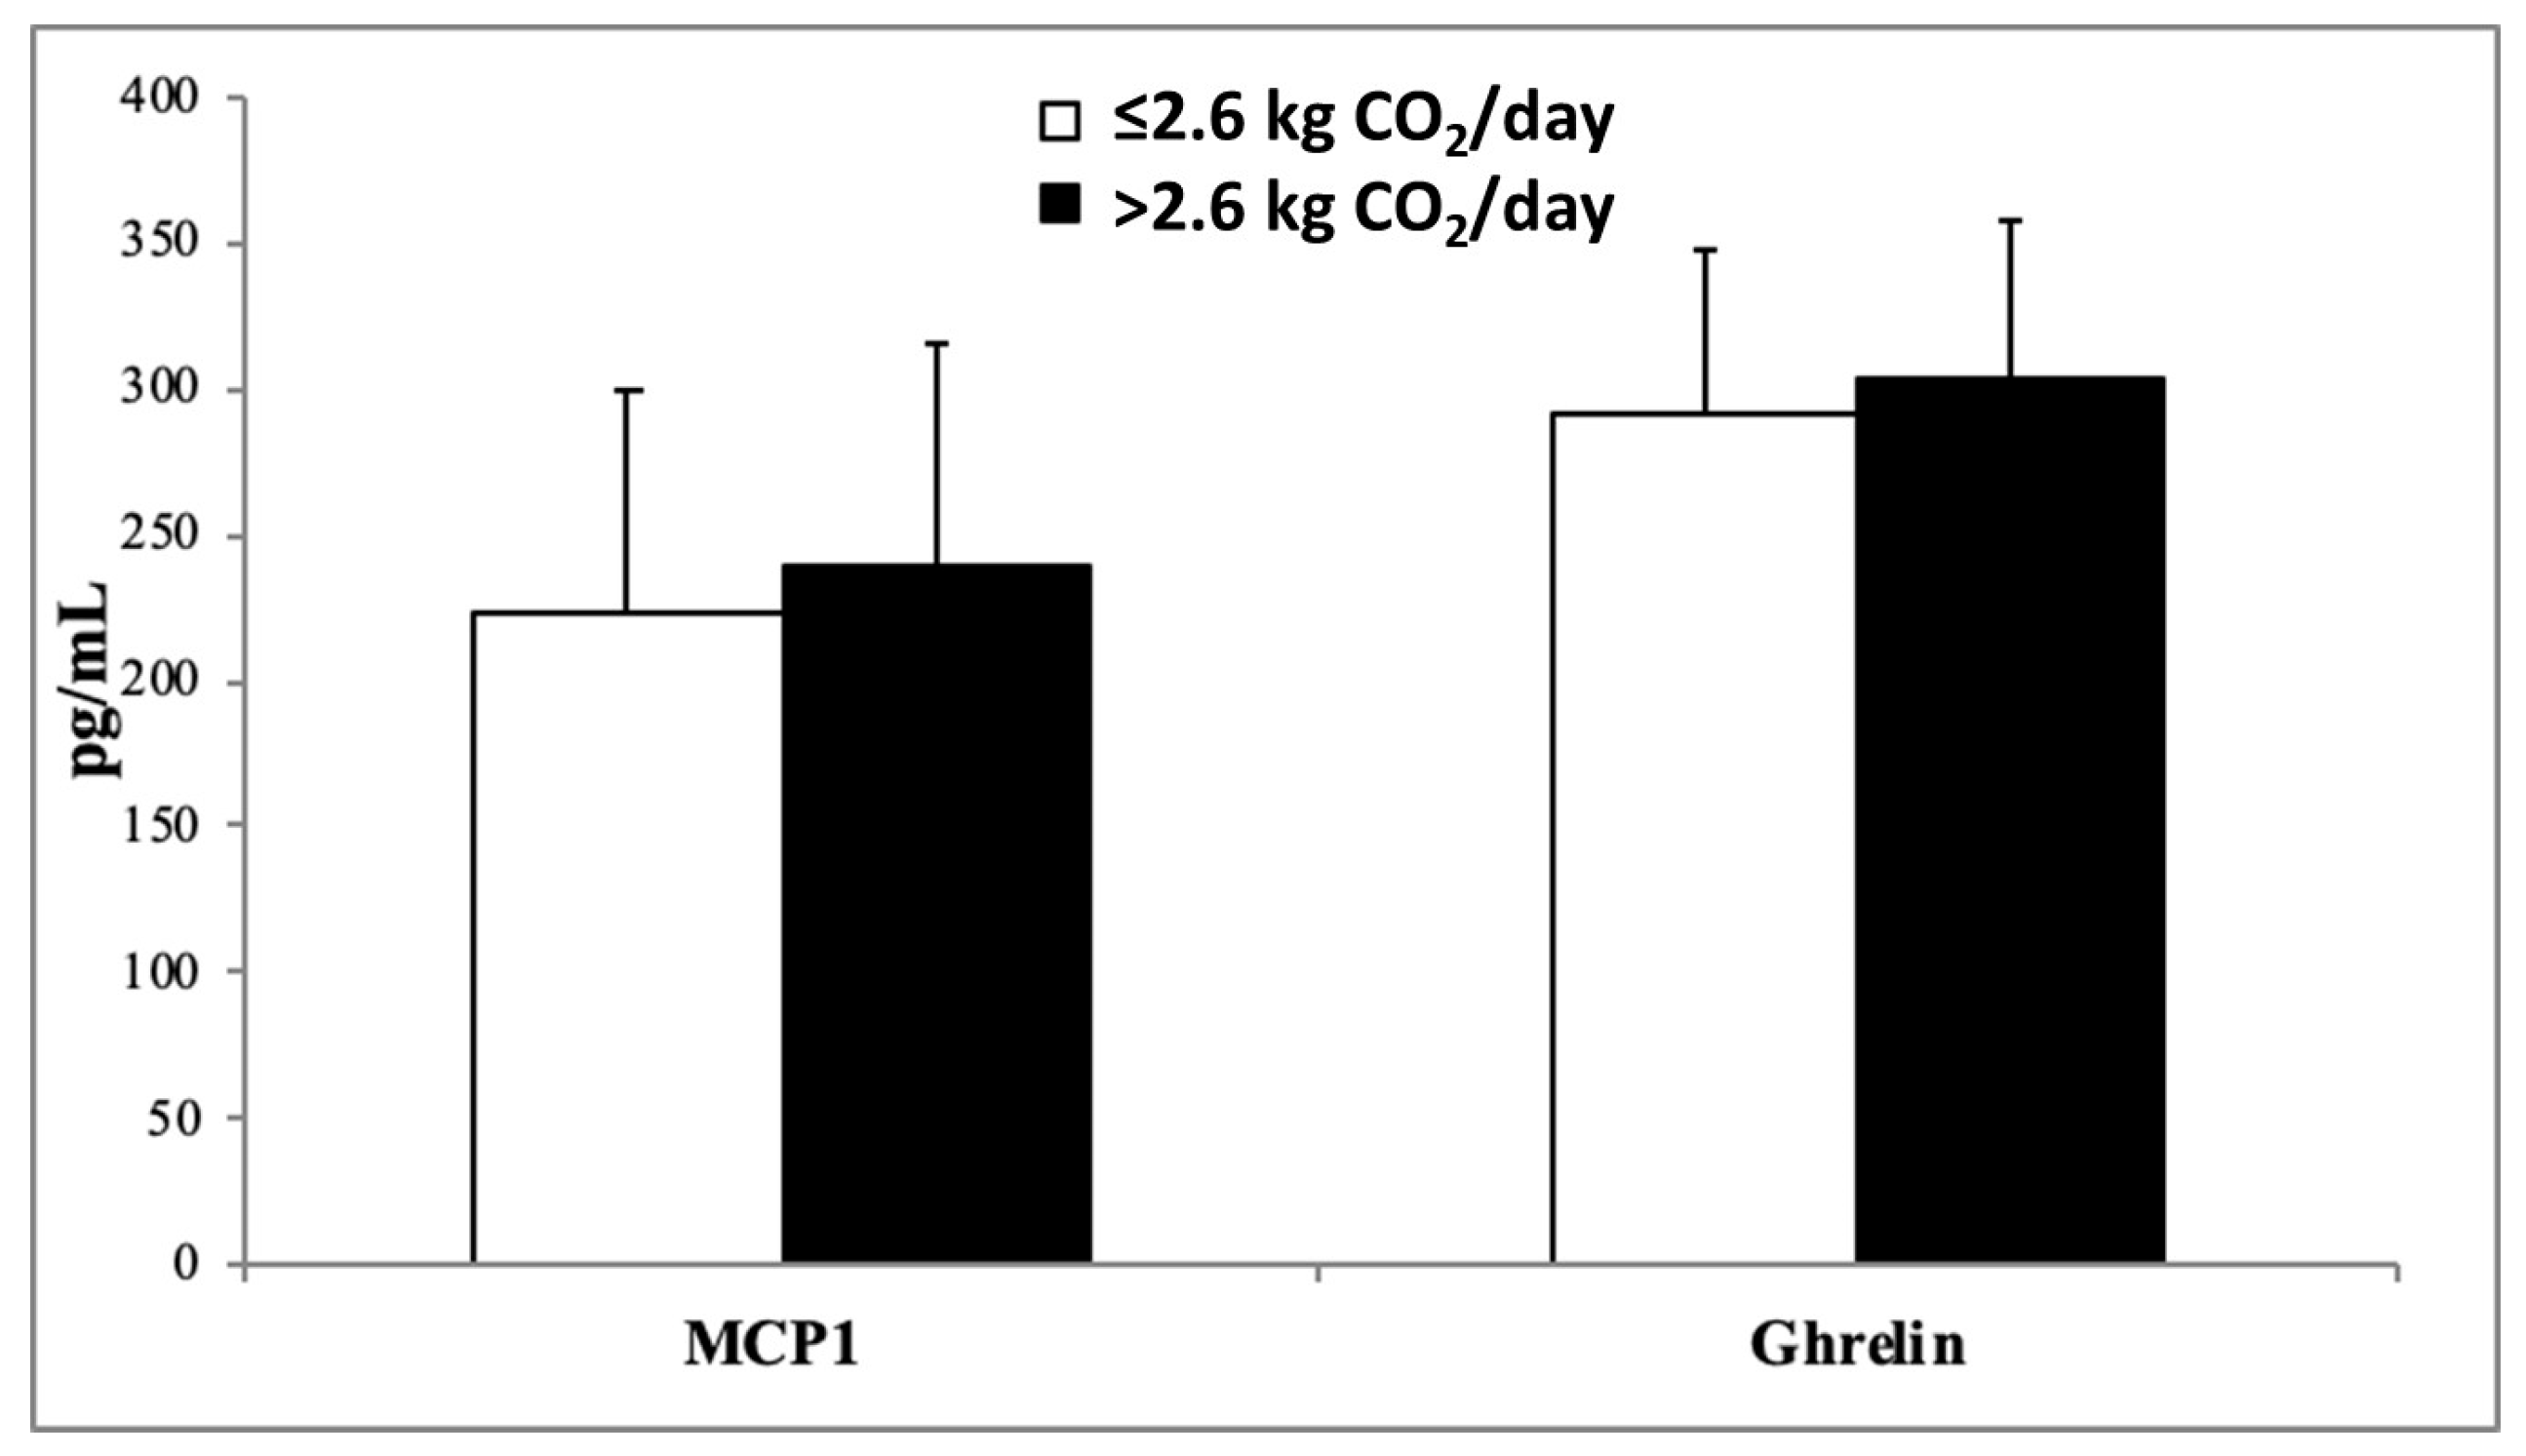
| MCP-1 | 1.00 (ref.) | 1.13 (0.604–2.082) | 0.716 |
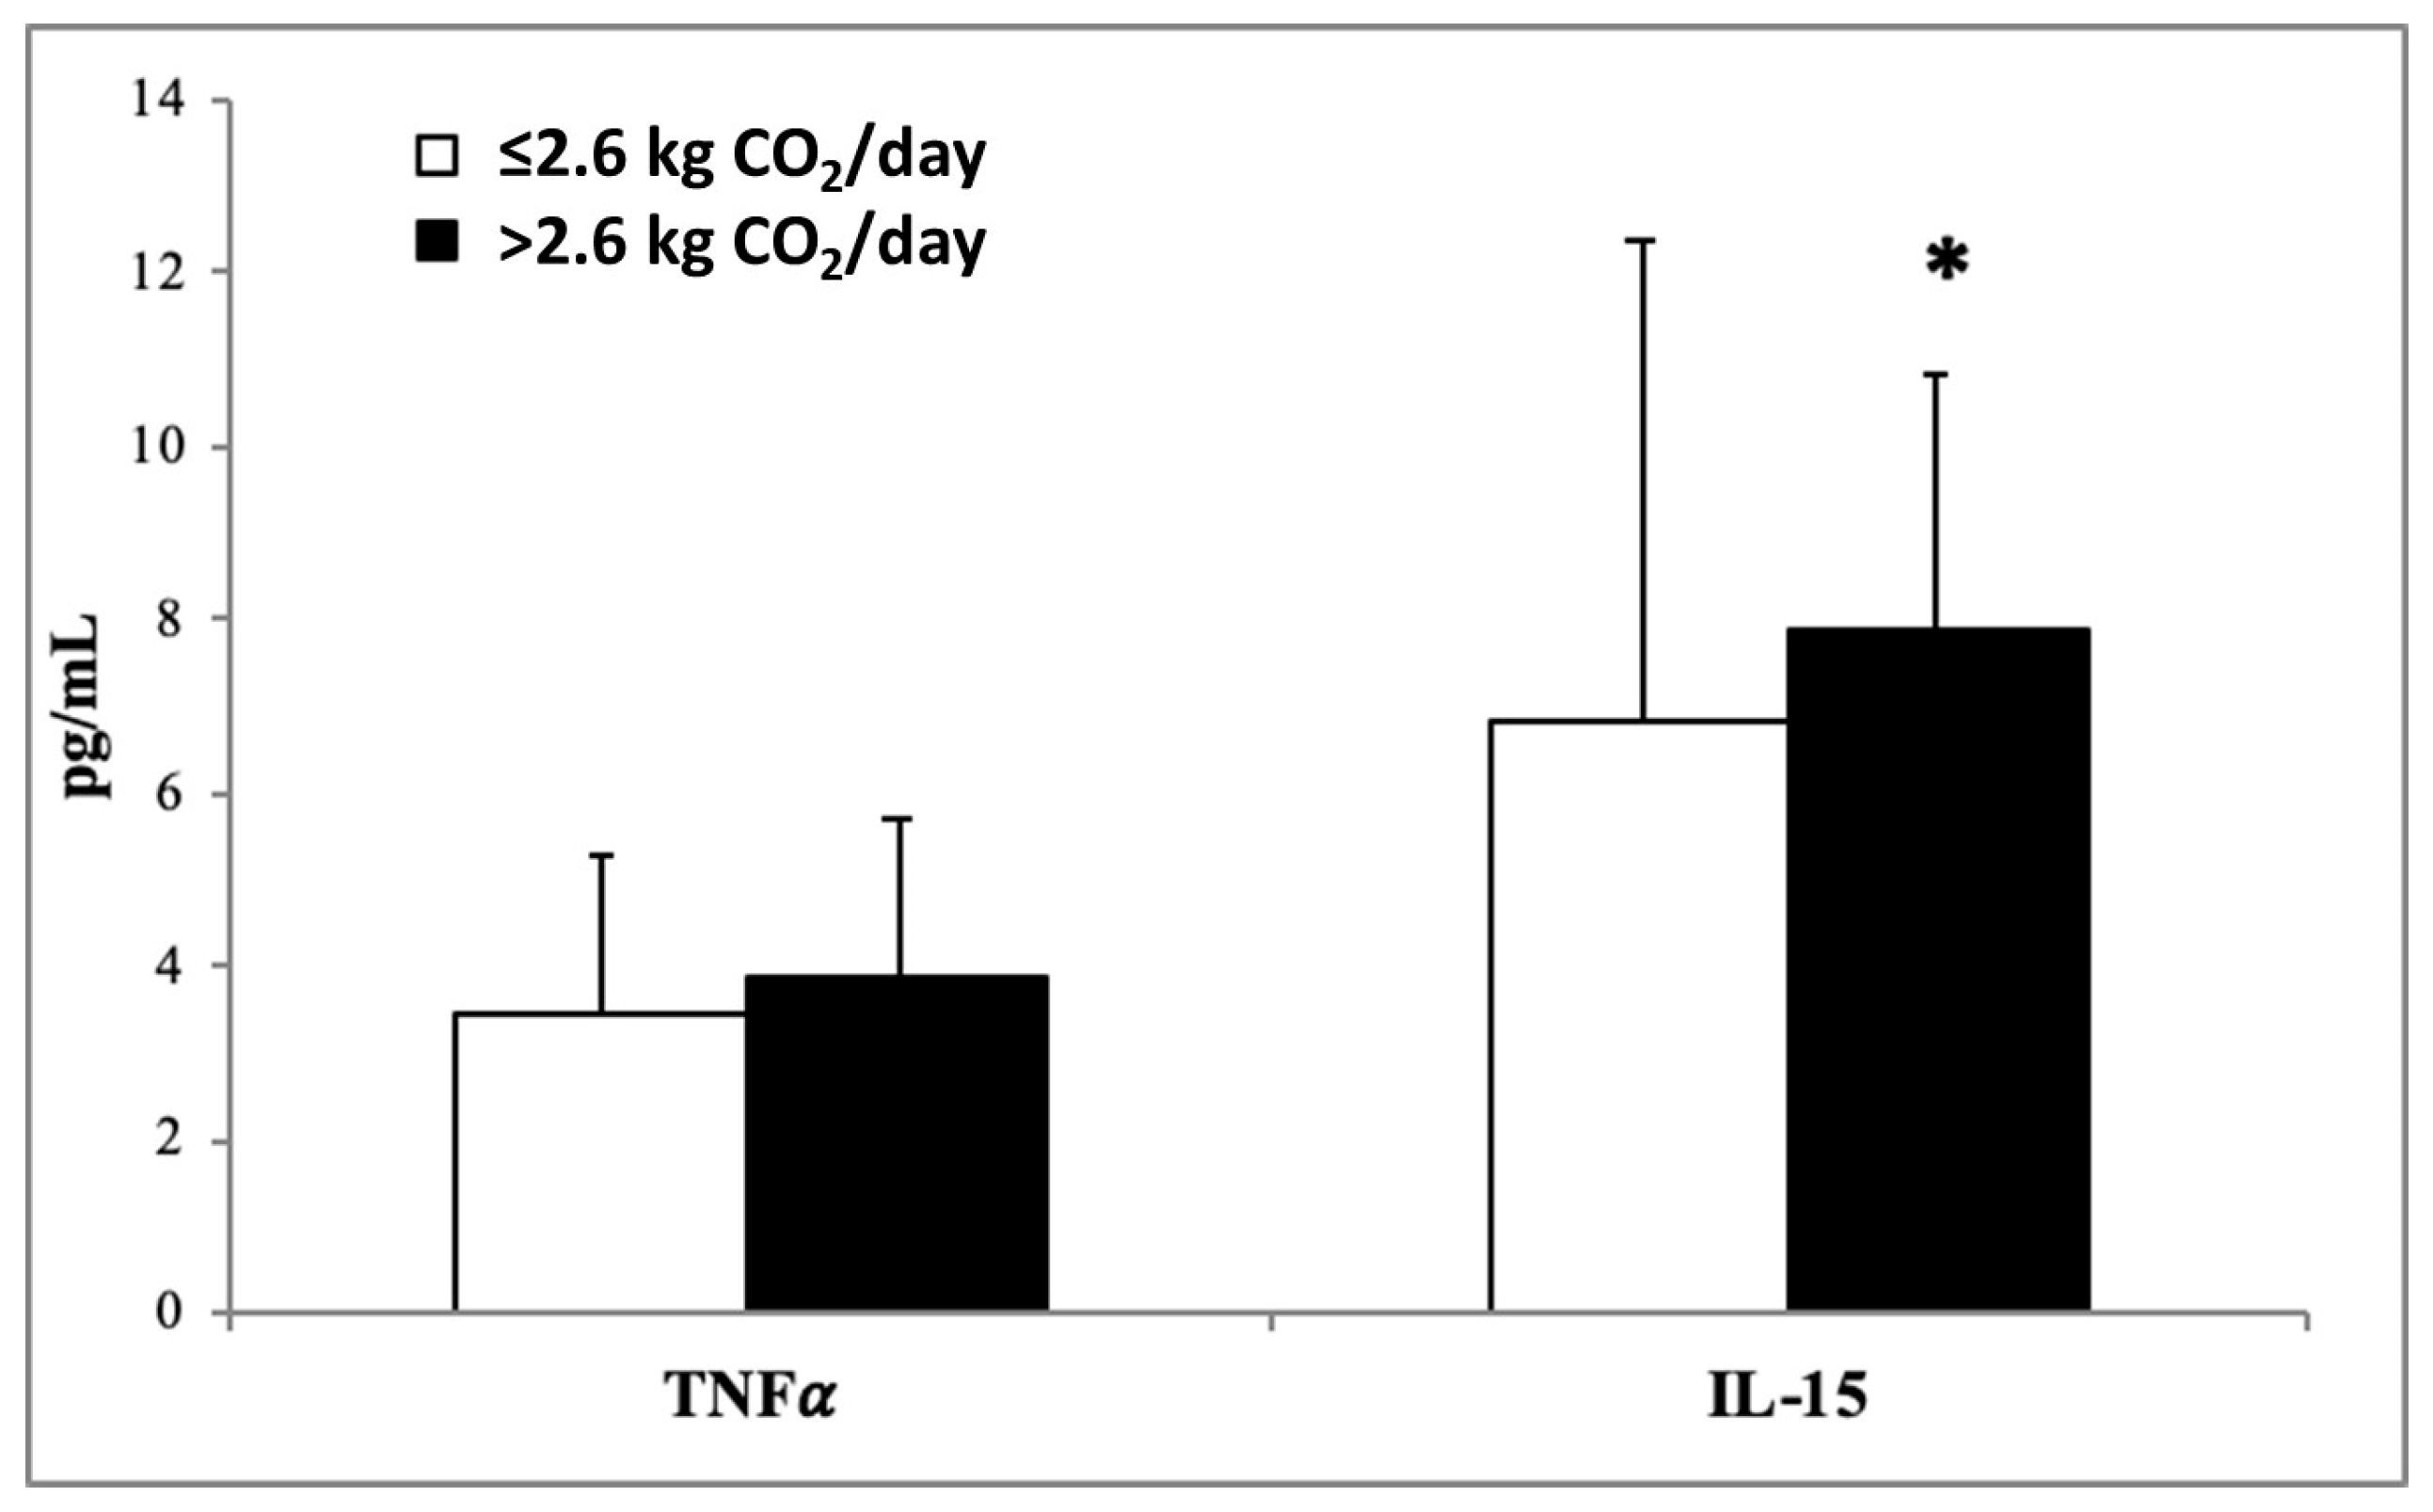
| TNFα | 1.00 (ref.) | 1.84 (0.828–4.089) | 0.134 |
| IL-15 | 1.00 (ref.) | 2.34 (0.999–5.482) | 0.050 |
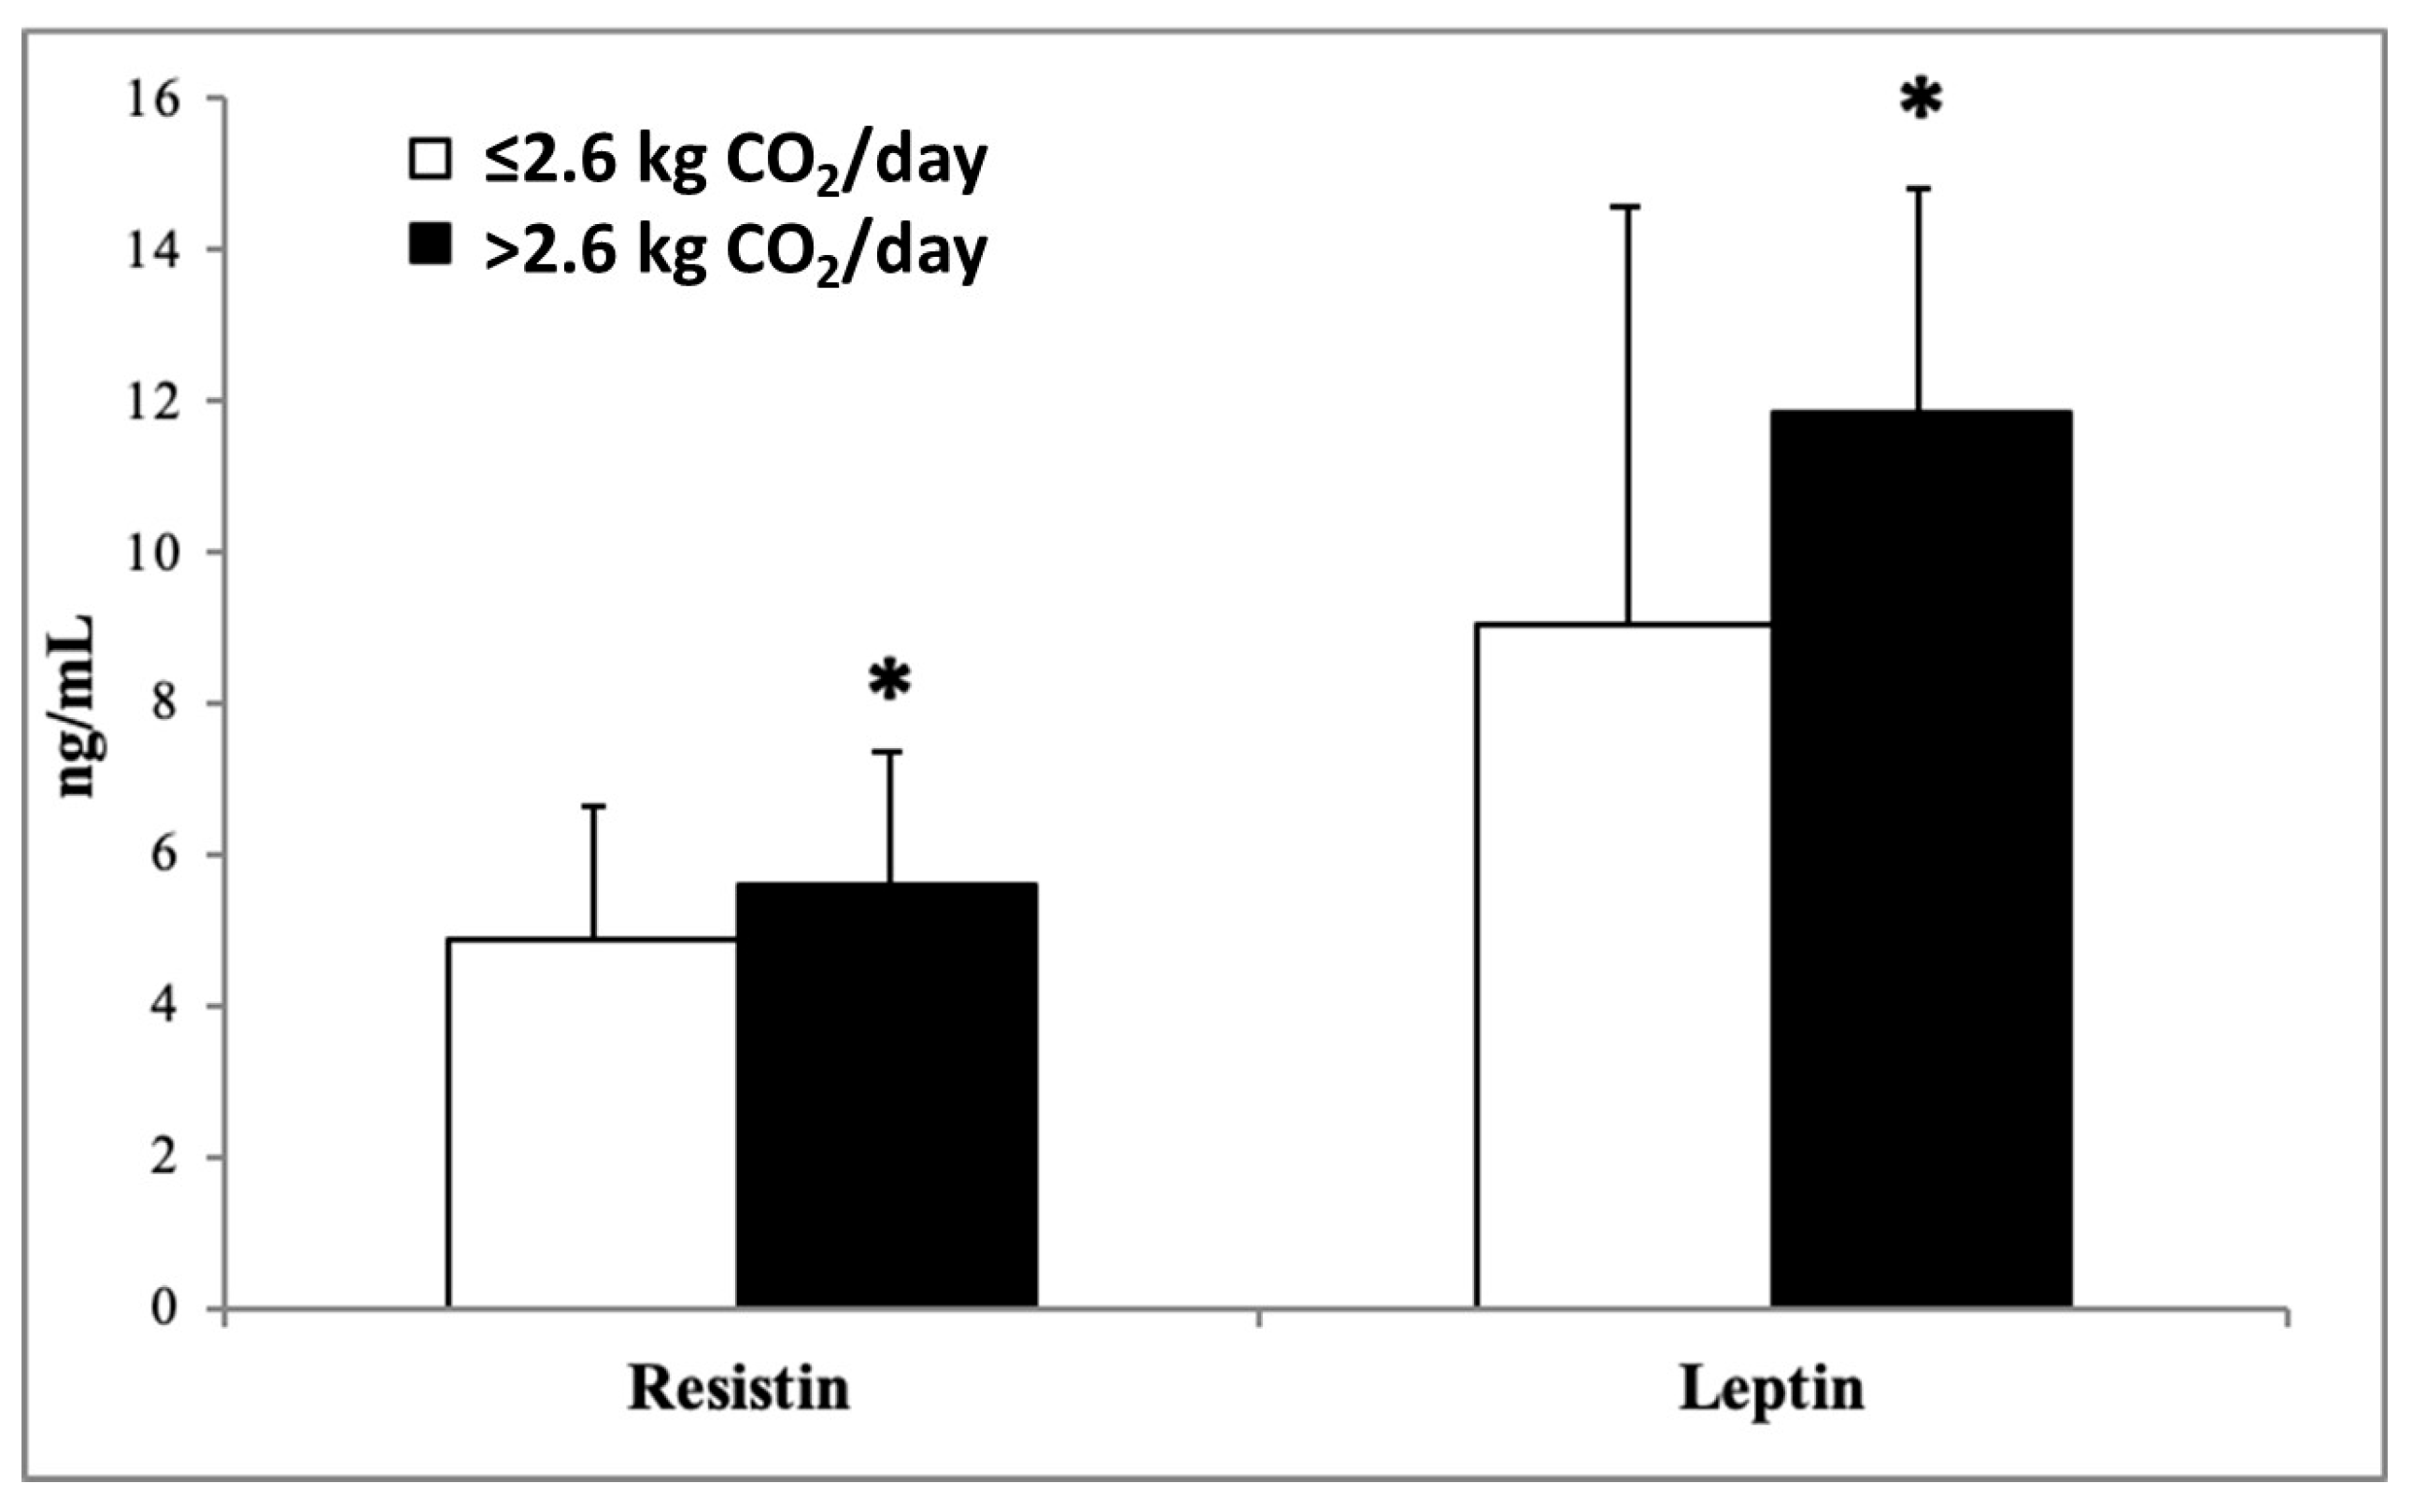
| Resistin | 1.00 (ref.) | 3.06 (1.392–6.706) | 0.005 |
| Ghrelin | 1.00 (ref.) | 1.66 (0.779–3.528) | 0.190 |
| Leptin | 1.00 (ref.) | 1.86 (0.764–4.522) | 0.172 |
Disclaimer/Publisher’s Note: The statements, opinions and data contained in all publications are solely those of the individual author(s) and contributor(s) and not of MDPI and/or the editor(s). MDPI and/or the editor(s) disclaim responsibility for any injury to people or property resulting from any ideas, methods, instructions or products referred to in the content. |
© 2023 by the authors. Licensee MDPI, Basel, Switzerland. This article is an open access article distributed under the terms and conditions of the Creative Commons Attribution (CC BY) license (https://creativecommons.org/licenses/by/4.0/).
Share and Cite
Monserrat-Mesquida, M.; Bouzas, C.; García, S.; Quetglas-Llabrés, M.M.; Mateos, D.; Ugarriza, L.; Gómez, C.; Sureda, A.; Tur, J.A. Carbon Dioxide (CO2) Dietary Emissions Are Related to Oxidative and Inflammatory Status in Adult Population. Nutrients 2023, 15, 5050. https://doi.org/10.3390/nu15245050
Monserrat-Mesquida M, Bouzas C, García S, Quetglas-Llabrés MM, Mateos D, Ugarriza L, Gómez C, Sureda A, Tur JA. Carbon Dioxide (CO2) Dietary Emissions Are Related to Oxidative and Inflammatory Status in Adult Population. Nutrients. 2023; 15(24):5050. https://doi.org/10.3390/nu15245050
Chicago/Turabian StyleMonserrat-Mesquida, Margalida, Cristina Bouzas, Silvia García, Maria Magdalena Quetglas-Llabrés, David Mateos, Lucía Ugarriza, Cristina Gómez, Antoni Sureda, and Josep A. Tur. 2023. "Carbon Dioxide (CO2) Dietary Emissions Are Related to Oxidative and Inflammatory Status in Adult Population" Nutrients 15, no. 24: 5050. https://doi.org/10.3390/nu15245050
APA StyleMonserrat-Mesquida, M., Bouzas, C., García, S., Quetglas-Llabrés, M. M., Mateos, D., Ugarriza, L., Gómez, C., Sureda, A., & Tur, J. A. (2023). Carbon Dioxide (CO2) Dietary Emissions Are Related to Oxidative and Inflammatory Status in Adult Population. Nutrients, 15(24), 5050. https://doi.org/10.3390/nu15245050