Article

Sodium Content in Pre-Packaged Foods in China: A Food Label Analysis

1
Institute of Nutrition and Health, School of Public Health, Qingdao University, Qingdao 266071, China
2
National Institute for Nutrition and Health, Chinese Center for Disease Control and Prevention, Beijing 100050, China
3
Department of Nutrition and Food Hygiene, School of Public Health, Tongji Medical College, Huazhong University of Science and Technology, Wuhan 430030, China
4
Chinese Nutrition Society, Beijing 100053, China
5
Laboratory of Trace Element Nutrition of National Health Commission, Beijing 100050, China
*
Author to whom correspondence should be addressed.
Nutrients 2023, 15(23), 4862; https://doi.org/10.3390/nu15234862
Submission received: 8 November 2023 / Revised: 20 November 2023 / Accepted: 20 November 2023 / Published: 21 November 2023
(This article belongs to the Special Issue Reducing Dietary Sodium and Improving Human Health 2.0)

Abstract

:
Sodium intake from pre-packaged foods is increasing in China and is well above the WHO recommendation of 5 g per day. The purpose of this study is to analyze the sodium content of pre-packaged foods collected by the National Institute for Nutrition and Health, Chinese Center for Disease Control and Prevention (NINH, China CDC) in 20 provinces of China from 2017 to 2022. The proportion of pre-packaged foods that meet or exceed the low-sodium, medium-sodium, and high-sodium classifications were analyzed. The proportion of pre-packaged foods that meet and do not meet the WHO global sodium benchmarks and the difference in sodium content between these foods was also calculated. High-sodium foods include sauces, dips, and dressings (3896 mg/100 g), convenience foods (1578 mg/100 g), processed fish products (1470 mg/100 g), processed meat products (1323 mg/100 g), processed poultry products (1240 mg/100 g), snack foods (750 mg/100 g), processed egg products (741 mg/100 g), and fine dried noodles (602 mg/100 g). A large number of pre-packaged foods currently collected in China have a sodium content above sodium benchmarks. This study provided data to support the assessment of sodium intake from pre-packaged foods in the Chinese population and the implementation of comprehensive salt reduction strategies.

1. Introduction

High sodium intake is an important risk factor for high blood pressure [1,2], cardiovascular disease [3], stroke [4], stomach cancer [5], and premature mortality [6]. High sodium intake has led to 1.9 million deaths globally [7]. The World Health Organization (WHO) recommends a sodium intake for adults of less than 2 g/day (i.e., 5 g/day of salt) [8]. However, the current Chinese adult’s average salt intake is estimated to be 9.3 g/day per person [9], which is 86% higher than the WHO’s recommendation [8]. The consumption of pre-packaged foods in China continues to increase [10,11].
WHO makes sodium reduction a global priority and “best buy” [12,13]. In 96 national salt reduction initiatives, 89 countries combined two or more implementation strategies, including interventions in settings, food reformulation, consumer education, front-of-pack labelling (FOPL), and salt taxation [14]. The UK [15], the USA [16], and Canada [17] set voluntary salt reduction targets for pre-packaged foods; the South African government set maximum sodium content in various categories of processed foods [18]; Chile, Peru, and Uruguay adopted a front-of-pack warning label (FOPWL) [19,20]; and Fiji and Mexico adopted taxes on foods high in salt [14].
China implemented the Standard on Nutrition Labelling of Pre-packaged Foods (GB 28050–2011) in 2013 and made it mandatory to label the sodium content of pre-packaged foods [21]. The Healthy China 2030 Plan, the Healthy China Initiative (2019–2030), and the National Nutrition Plan (2017–2030) are the signature national Chinese population health policies that clarify specific measures to reduce salt, including promoting salt reduction in pre-packaged foods, revising the Standard on Nutrition Labelling of Pre-packaged Foods, and promoting the establishment of a food nutrition standards system. The National Institute for Nutrition and Health, Chinese Center for Disease Control and Prevention (NINH, China CDC) and the Chinese Nutrition Society jointly issued Guidelines for Salt Reduction in Chinese Food Industry in 2019 and proposed targets for 2025 and 2030 for the phased reduction of salt in pre-packaged foods [22].
Understanding the sodium content of pre-packaged foods on nutrition labels is essential for implementing comprehensive salt reduction strategies. Currently, there are insufficient data on the sodium content of pre-packaged foods in China, so the purpose of this study is to analyze the sodium content of pre-packaged foods collected by NINH, China CDC in 20 provinces of China from 2017 to 2022. And the proportion of pre-packaged foods that meet or exceed the low-sodium, medium-sodium, and high-sodium were analyzed. We also calculated the proportion of pre-packaged foods that meet and do not meet the WHO global sodium benchmarks, as well as the difference in sodium content of the corresponding foods. This study provided data to support the assessment of sodium intake from pre-packaged foods in the Chinese population and the implementation of comprehensive salt reduction strategies to help reduce sodium intake among the Chinese population and further reduce diet-related noncommunicable diseases (NCDs).

2. Materials and Methods

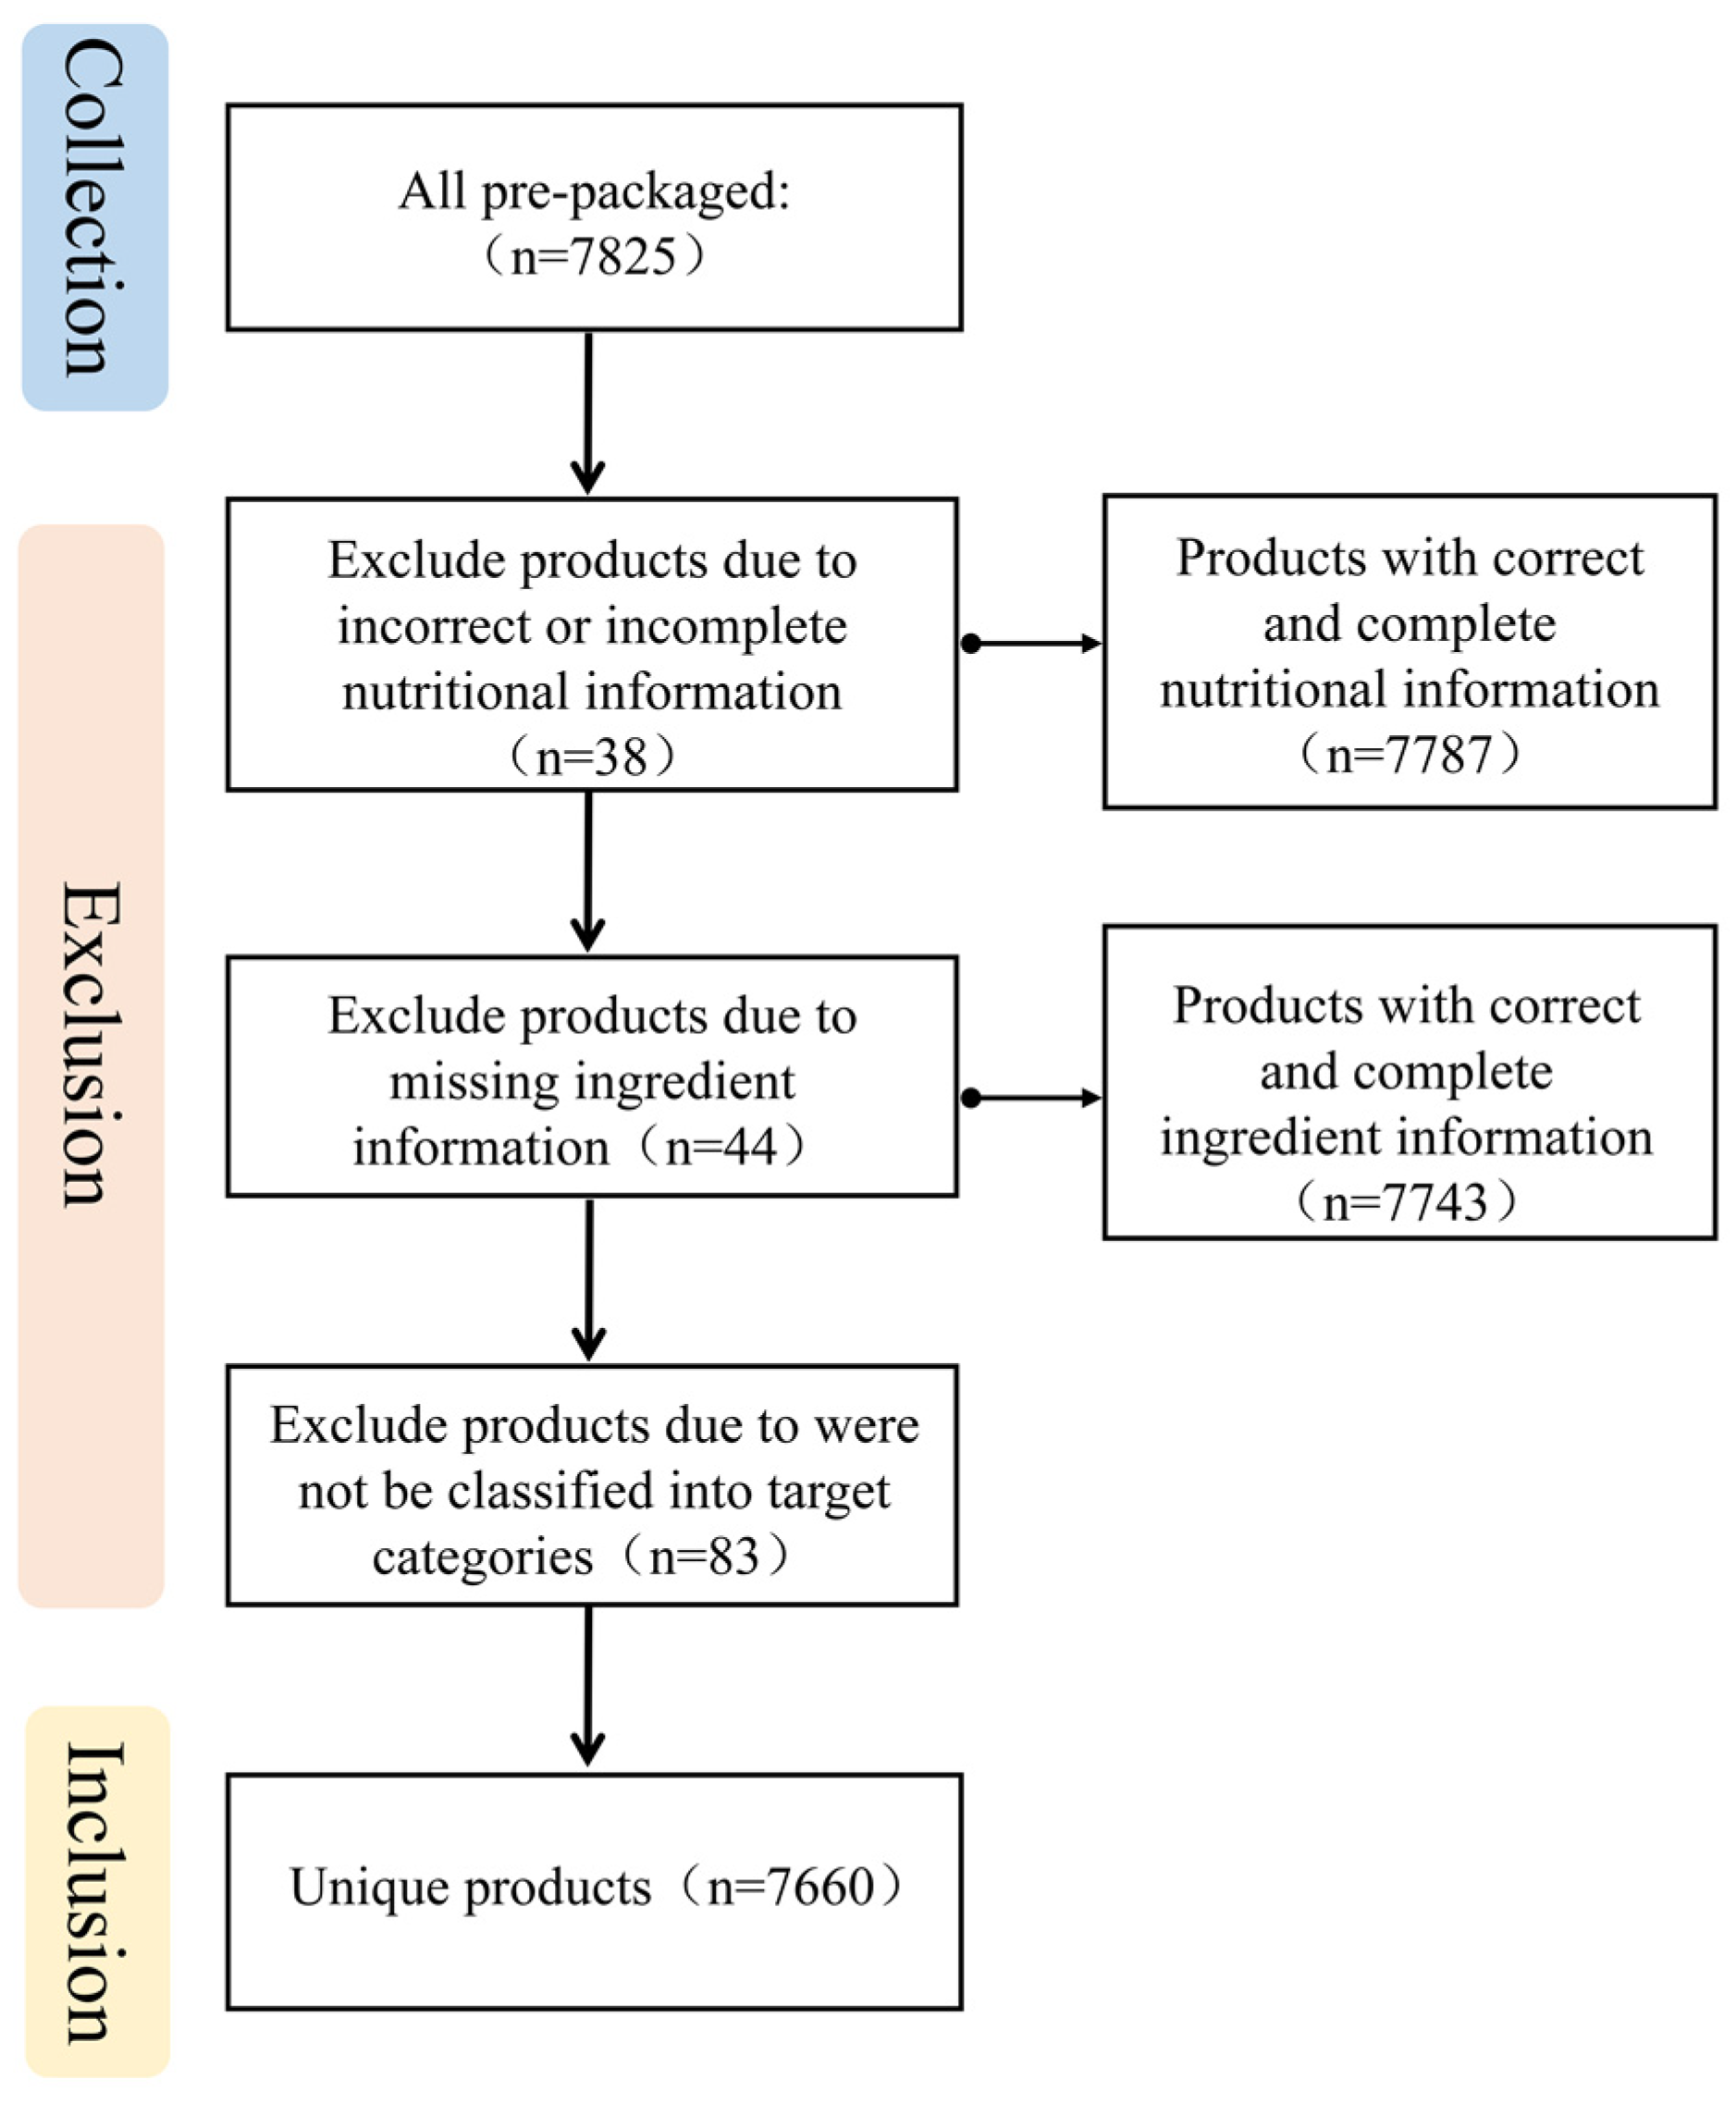
2.1. Data Collection for Chinese Pre-Packaged Foods

NINH, China CDC collected information on nutrition labelling of major pre-packaged foods from 20 provinces in 2017–2022. The collection provinces cover seven major geographical regions of China: Northeast China (Heilongjiang Province, Jilin Province, Liaoning Province); East China (Jiangsu Province, Zhejiang Province, Jiangxi Province, Shandong Province); North China (Beijing, Hebei Province, Inner Mongolia Autonomous Region); Central China (Henan Province); South China (Guangdong Province, Hainan Province); Southwest China (Guizhou Province, Chongqing Municipality, Xizang Autonomous Region); and Northwest China (Gansu Province, Qinghai Province, Ningxia Hui Autonomous Region, Xinjiang Uygur Autonomous Region). These regions include regions with high population density and economic correlation in China (Guangdong Province, Jiangsu Province, Shandong Province, Zhejiang Province, Henan Province, Hebei Province, Beijing, Chongqing, Inner Mongolia Autonomous Region) and regions with low population density and economic correlation (Xizang Autonomous Region, Qinghai Province, Hainan Province, Gansu Province, Jilin Province, Heilongjiang Province, Xinjiang Uygur Autonomous Region, Guizhou Province).
The staff photographed all sides of the pre-packaged food and captured all information from the product packaging (e.g., product name, brand, nutrition information panels (NIPs), and ingredients) and uploaded this information into the China Standardized Database for the Composition of Pre-packaged Food. The principle of collecting pre-packaged foods is that the pre-packaged food is within the shelf life, the food information on the pre-packaged food is clear, and the total energy converted from fat, carbohydrates, and protein on the label does not exceed the energy value on the label. Nutrient content in products was standardized to volumes per 100 g or 100 mL by the staff of NINH, China CDC.

2.2. Data Classification

According to the Standard on Nutrition Labelling of Pre-packaged Foods (GB 28050-2011) [21], the Standards for Uses of Food Additive (GB 2760-2014) [23], Regulation of Food Composition Data Expression (WS/T 464-2015) [24], as well as various national standards, group standards, and industry standards for food published by the Chinese government (Supplementary Table S1), with full consideration of the characteristics of pre-packaged foods, their processing technologies, formulation, and Chinese dietary habits, pre-packaged foods have been classified step by step. The specific number and distribution of various pre-packaged foods are shown in Table 1 and Figure 1.

2.3. Data Inclusion and Exclusion Criteria

Pre-packaged foods with complete NIPs and ingredients were included. The Standard on Nutrition Labelling of Pre-packaged Foods (GB 28050-2011) specifies mandatory rules for nutrition labelling by manufacturers to provide quantitative information on energy, protein, fat, carbohydrate, and sodium content of foods and their contributions to the Nutrient Reference Value (NRV). Foods with incorrect or incomplete nutrition information and foods that were missing ingredient information or could not be classified into target categories were excluded from the analysis.

2.4. Data Analysis

Data for sodium (mg/100 g) for each subcategory of pre-packaged foods are presented as median, proportion, range, and IQR means interquartile range.
According to the Standard on Nutrition Labelling of Pre-packaged Foods (GB 28050-2011), foods with a sodium content not higher than 120 mg/100 g were classified into low-sodium foods [21]. According to the recommendation of Dietary Guidelines for Chinese (2022), sodium content that exceeds 30% of NRV is high; thus, foods with sodium content higher than 600 mg/100 g were classified as high-sodium foods [9]. The foods with sodium content between 120 and 600 mg/100 g were classified as medium-sodium foods. These are shown as green, yellow, and red according to a horizontal bar chart to indicate the percentage of low-sodium, medium-sodium, and high-sodium foods.
The proportion of pre-packaged foods meeting and not meeting WHO global sodium benchmarks and the difference in sodium content of the corresponding products was calculated and presented as median and IQR. The analyses were conducted using IBM SPSS V.26.0.

3. Results

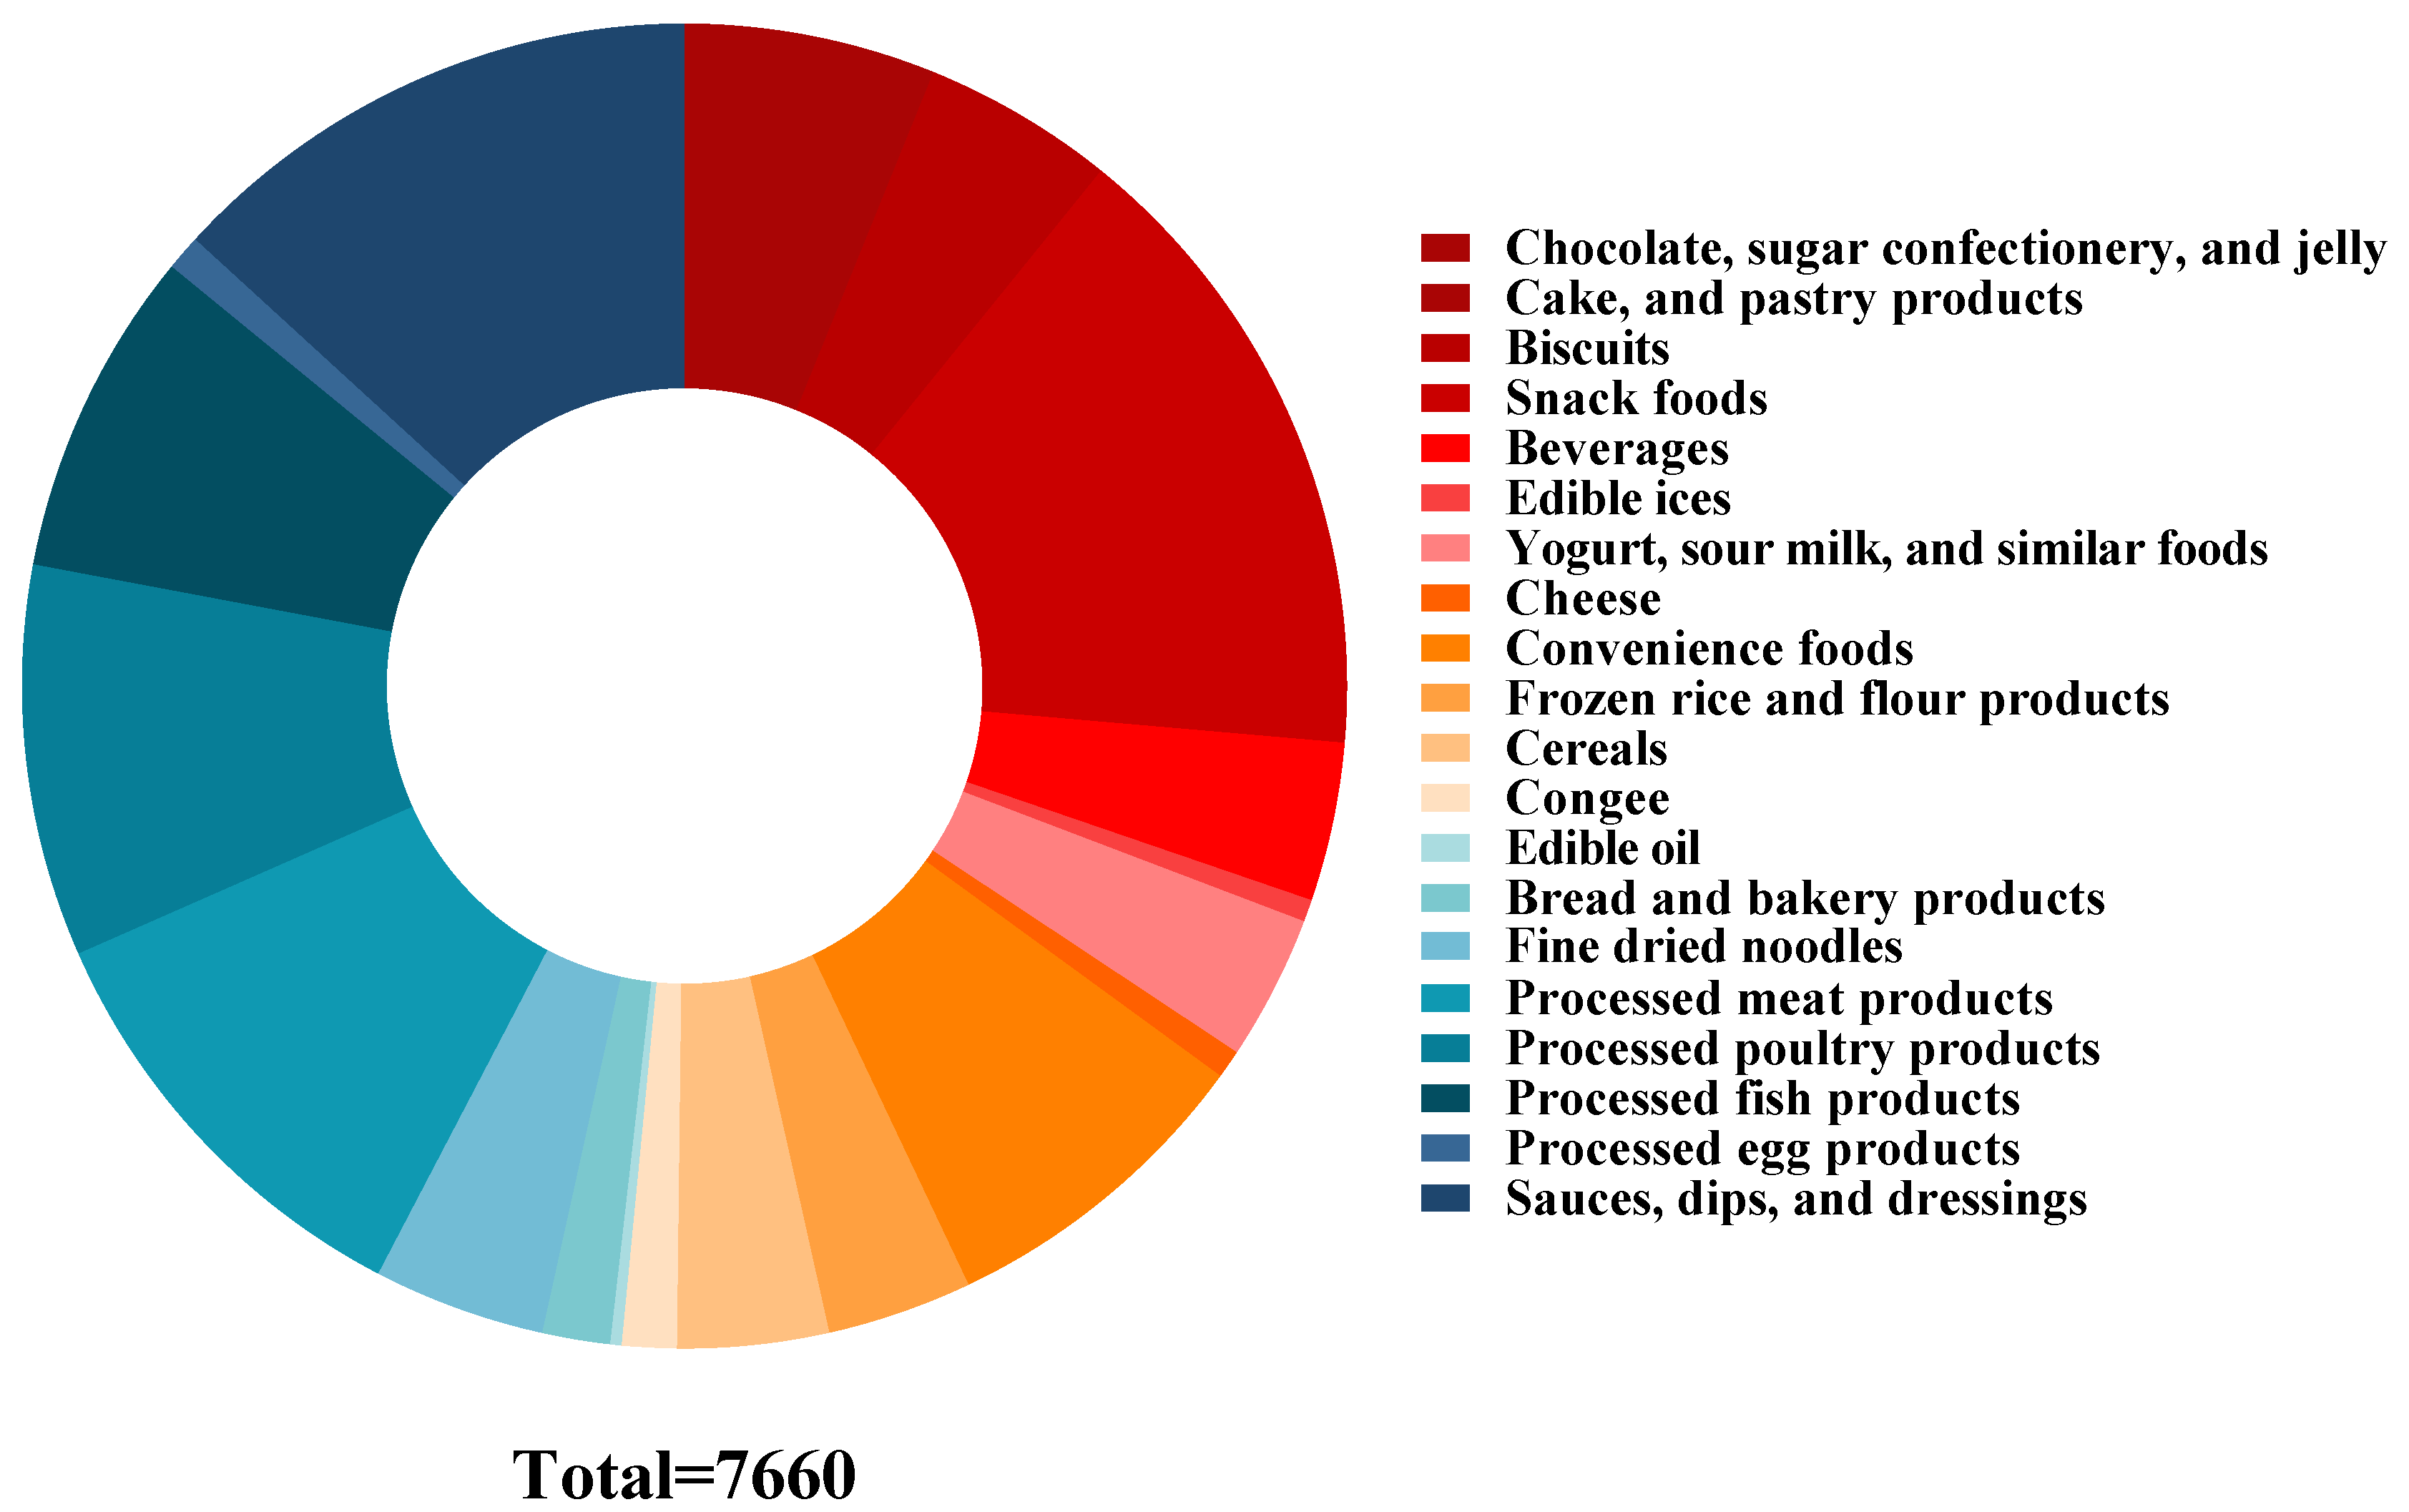
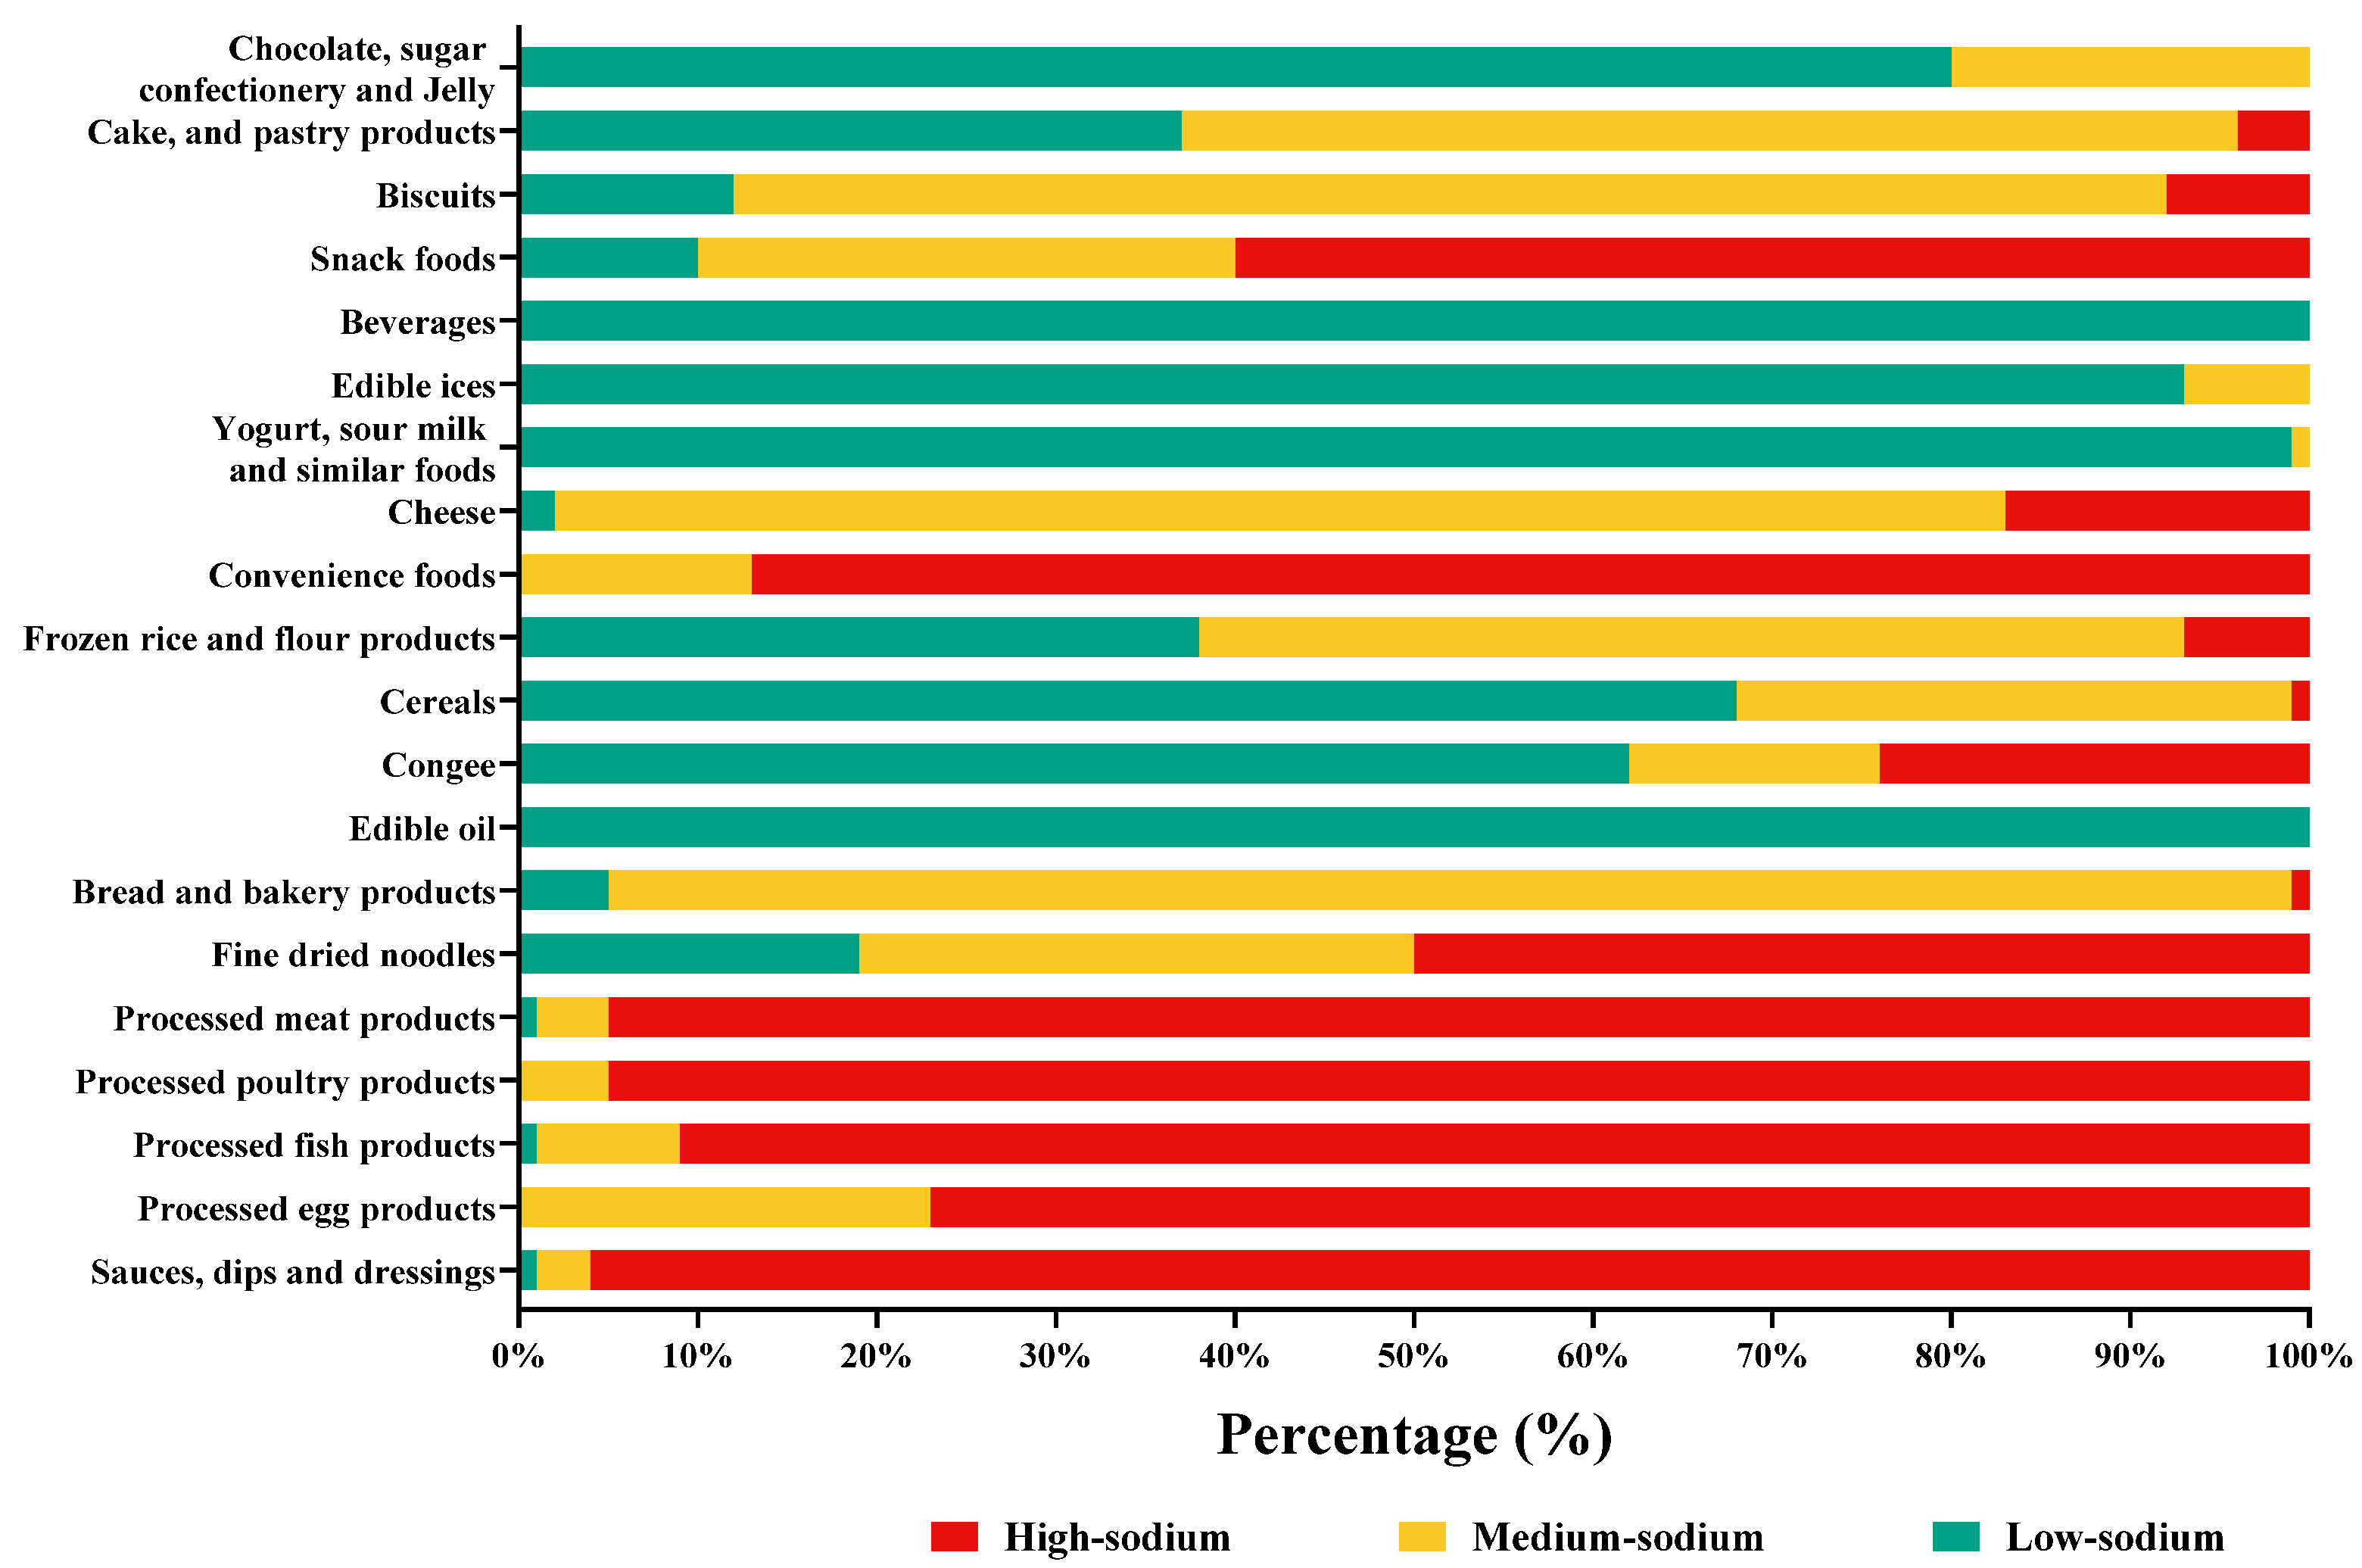
3.1. The Sodium Content for Chinese Pre-Packaged Foods

From a total of 7825 pre-packaged foods collected from China, 38 were excluded due to incorrect or incomplete nutrition information, 44 were excluded due to missing ingredient information, and 83 were excluded due to not being classified into target categories (Figure 2). Finally, this study included a total of 7660 products. Chinese pre-packaged foods were classified into 20 categories and 38 subcategories (Table 1).
The highest median sodium levels per 100 g were among sauces, dips, and dressings (3896 mg/100 g, IQR: 2059 to 6523 mg/100 g), convenience foods (1578 mg/100 g, IQR: 798 to 2073 mg/100 g), processed fish products (1470 mg/100 g, IQR: 994 to 1800 mg/100 g), processed meat products (1323 mg/100 g, IQR: 990 to 1681 mg/100 g), processed poultry products (1240 mg/100 g, IQR: 980 to 1573 mg/100 g), snack foods (750 mg/100 g, IQR: 386 to 1346 mg/100 g), processed egg products (741 mg/100 g, IQR: 618 to 907 mg/100 g), and fine dried noodles (602 mg/100 g, IQR: 250 to 658 mg/100 g). Cake and pastry products (179 mg/100 g, IQR: 60 to 280 mg/100 g), biscuits (280 mg/100 g, IQR: 185 to 414 mg/100 g), cheese (363 mg/100 g, IQR: 243 to 515 mg/100 g), frozen rice and flour products (310 mg/100 g, IQR: 54 to 435 mg/100 g), and bread and bakery products (250 mg/100 g, IQR: 205 to 320 mg/100 g) were next in sodium content. Categories with relatively low sodium content included beverages (24 mg/100 g, IQR: 13 to 43 mg/100 g), edible ices (72 mg/100 g, IQR: 54 to 86 mg/100 g), yogurt, sour milk, and similar foods (60 mg/100 g, IQR: 50 to 69 mg/100 g), cereals (67 mg/100 g, IQR: 8 to 150 mg/100 g), congee (50 mg/100 g, IQR: 22 to 512 mg/100 g), and edible oil (0 mg/100 g, IQR: 0 to 0 mg/100 g) (Table 1).
It can be seen from Table 1 that sodium content varied significantly within certain food subcategories: cake and pastry products (47 mg/100 g in moon cakes to 238 mg/100 g in western-style pastries), biscuits (107 mg/100 g in egg roll to 480 mg/100 g in soda biscuits), snack foods (59 mg/100 g in dried fruit to 2590 mg/100 g in extruded flavouring noodles), processed meat products (458 mg/100 g in prepared meat products to 1987 mg/100 g in cured meat products), processed poultry products (693 mg/100 g in prepared poultry products to 1536 mg/100 g in dried poultry products), processed fish products (701 mg/100 g in other fish products to 1561 mg/100 g in cooked fish and seafood products), and sauces, dips, and dressings (2000 mg/100 g in pickled vegetables to 6600 mg/100 g in soy sauces). Among the subcategories of bread and bakery products, the difference in sodium content was relatively small.

3.2. Proportion of Chinese Pre-Packaged Foods Meeting Low-Sodium, Medium-Sodium, and High-Sodium Content

The highest proportion of high-sodium foods included products within the categories of sauces, dips, and dressings (96.6%), processed meat products (95.6%), processed poultry products (94.8%), processed fish products (91.3%), convenience foods (86.7%), processed egg products (77.3%), snack foods (60.0%), and fine dried noodles (50.3%). Bread and bakery products, cheese, biscuits, cake and pastry products, and frozen rice and flour products had a relatively high proportion of medium-sodium products. Chocolate, sugar confectionery and jelly, beverages, edible ices, yogurt, sour milk, and similar foods, and edible oil had relatively low sodium content, ranging from 0 mg/100 g to 72 mg/100 g (Figure 3).

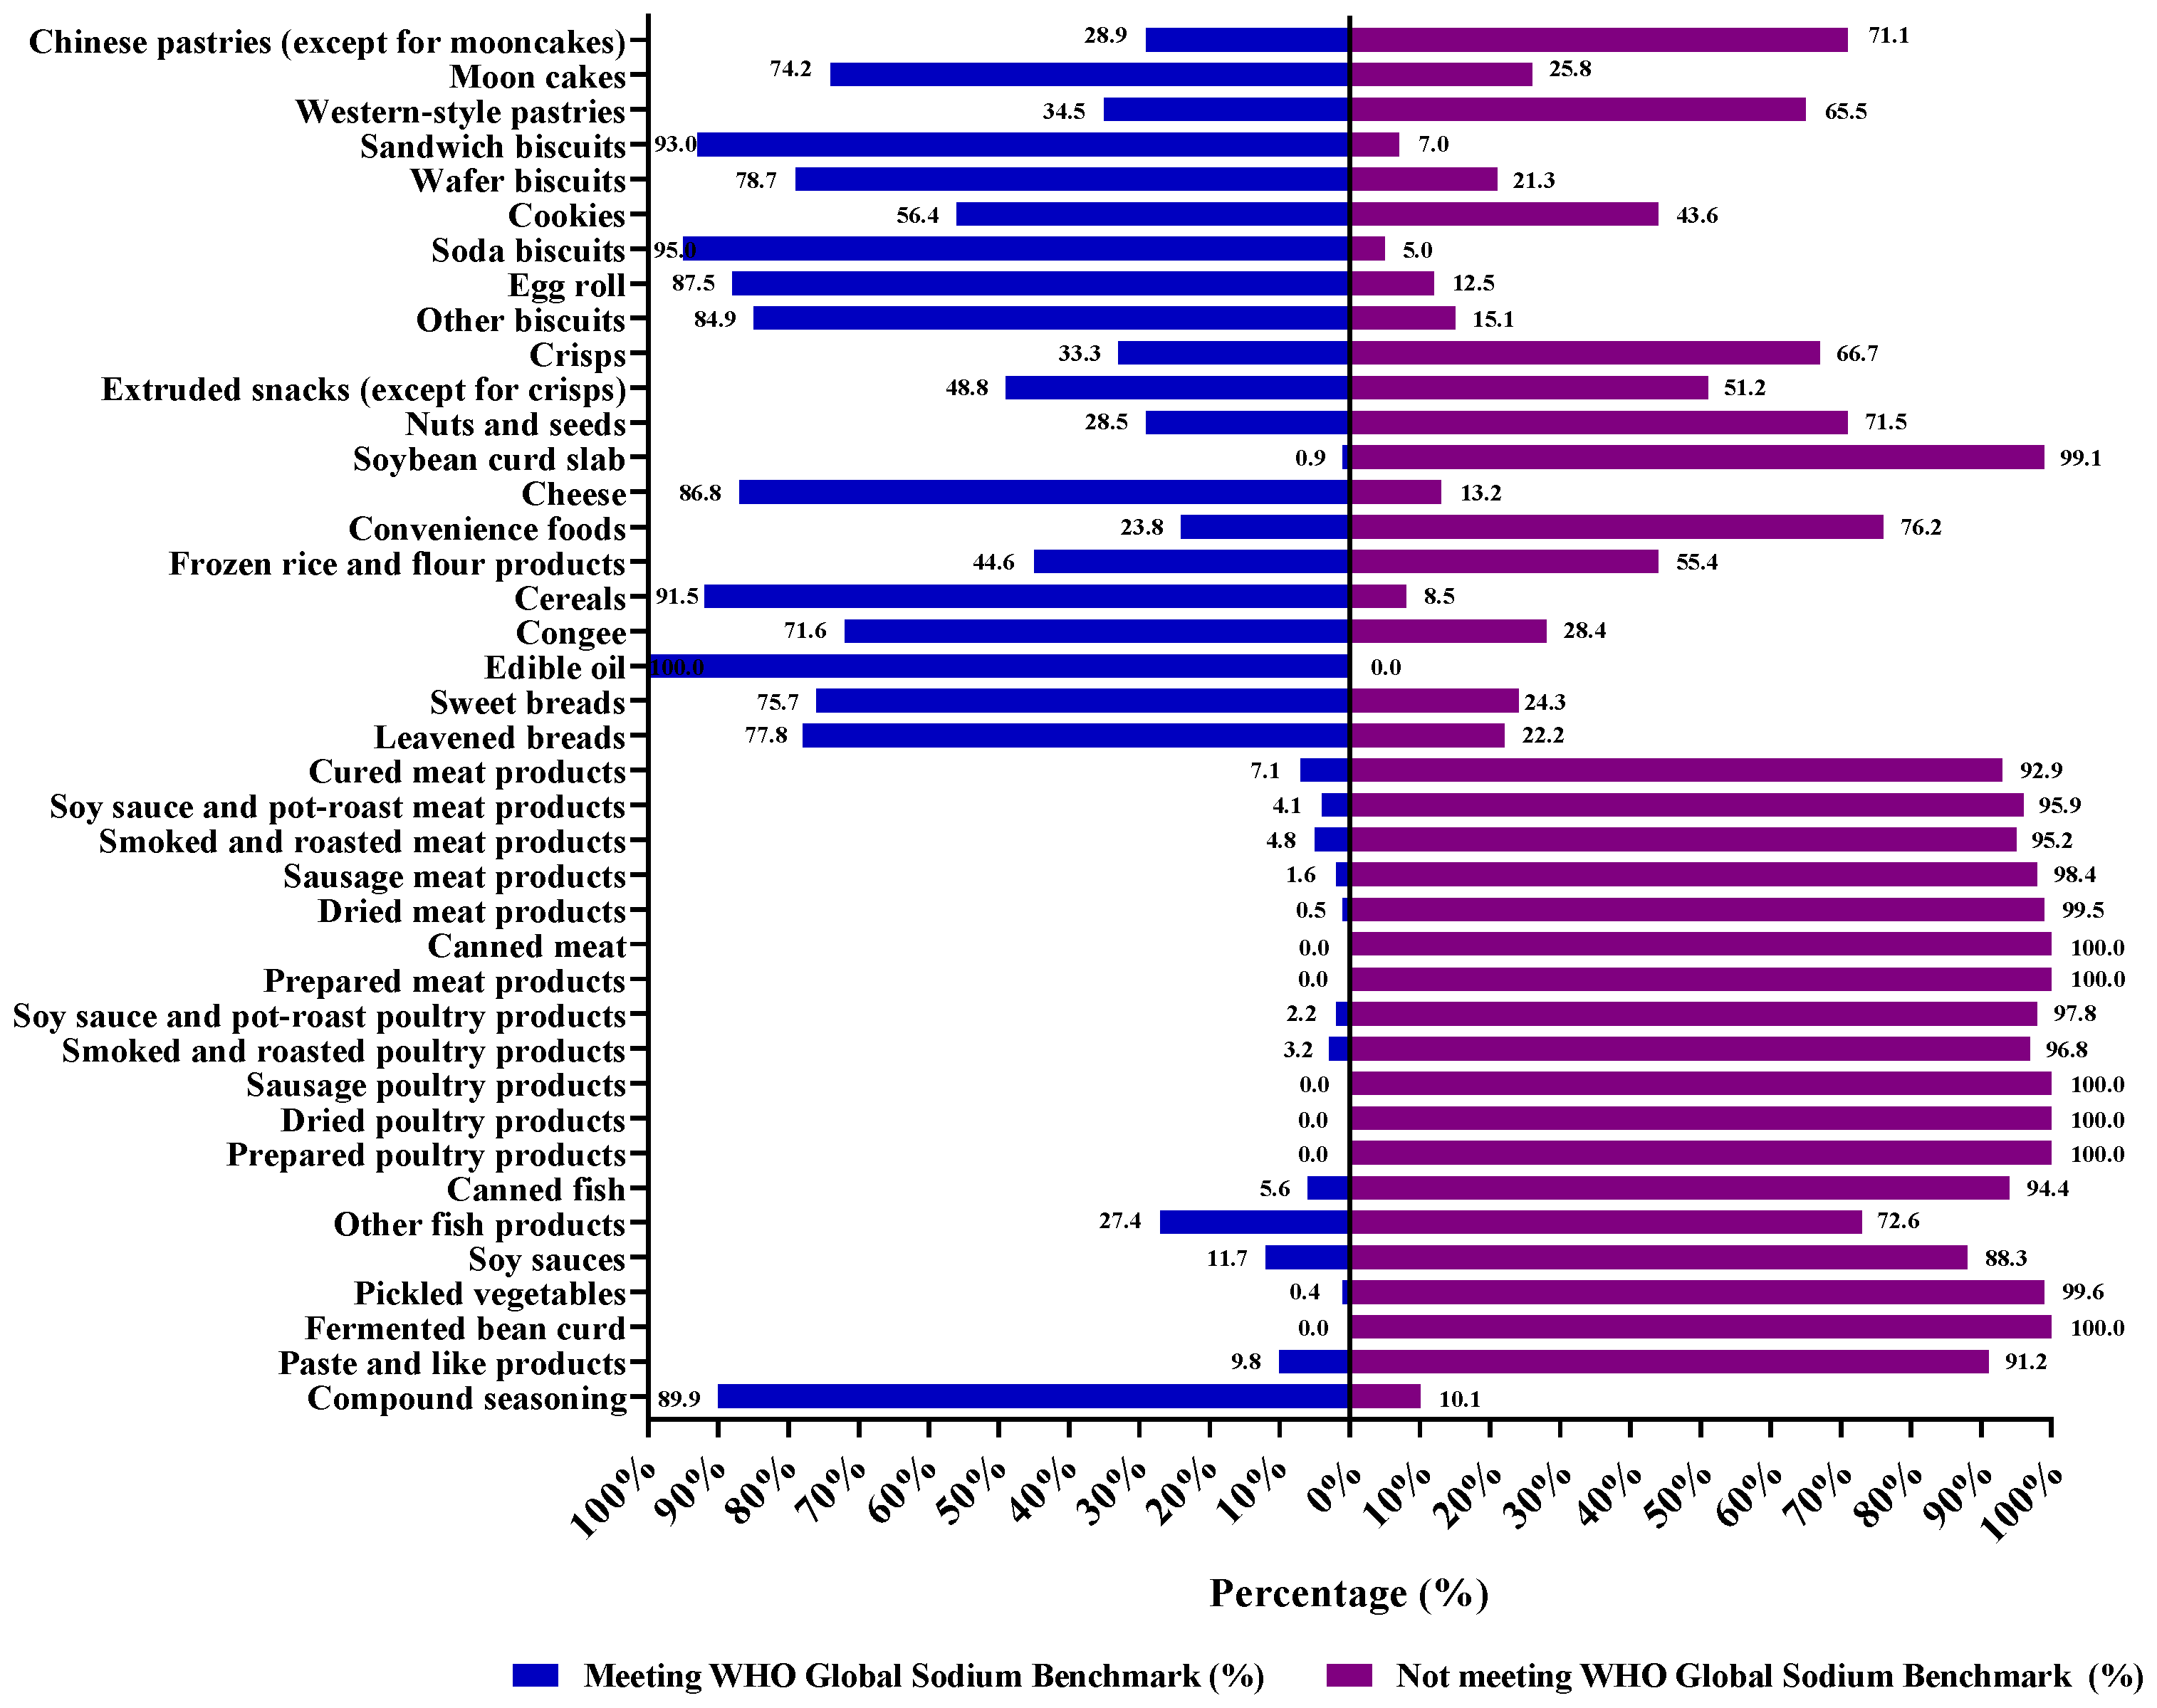
3.3. The Median Sodium Content of Chinese Pre-Packaged Foods Meeting and Not Meeting WHO Global Sodium Benchmarks

The sodium content of Chinese pre-packaged foods in each food subcategory was compared with the related sodium benchmarks (Figure 4). A large proportion of products in the subcategories of frozen rice and flour products, convenience foods, processed meat products, processed poultry products, processed fish products, and sauces, dips, and dressings did not meet the related sodium benchmarks, ranging from 55.4% to 100.0%. The proportion of foods in subcategories such as biscuits, bread and bakery products, cheese, cereals, and congee meeting sodium benchmarks was relatively high. Among these categories, the proportions of soda biscuits, sandwich biscuits, and cereals meeting the sodium benchmarks were 95.0%, 93.0%, and 91.5%, respectively.
Among foods that met sodium benchmarks and those that did not, the category with the greatest difference in median sodium content is congee (34 mg/100 g in meeting to 1243 mg/100 g in not meeting), and the difference in sodium content of products that did not meet the requirements is about 36.6 times that of products that met the requirements, followed by paste and like products (20.5 times) and frozen rice and flour products (8.8 times). The difference in median sodium content between soda biscuits that met sodium benchmarks and those that did not is minimal. The difference in median sodium content between other subcategories ranges from 1.5 to 8.4 times. (Table 2).

4. Discussion

High sodium intake is the major dietary risk factor for deaths and DALYs in China [26,27,28]; pre-packaged foods are gradually becoming an important source of dietary sodium for the Chinese. This study analyzed the sodium content of pre-packaged foods collected by NINH, China CDC in 20 provinces of China from 2017 to 2022. We also analyzed the proportion of foods that meet or exceed the low-sodium, medium-sodium, and high-sodium. Compared with the published articles, this study also calculated the proportion of foods that meet and do not meet the WHO global sodium benchmarks, as well as the difference in sodium content of the corresponding foods. This study provided data to support the implementation of comprehensive salt reduction strategies, such as setting salt reduction targets for different categories of pre-packaged foods, improving food reformulation, and promoting the development of FOPL.
In this study, we observed that sauces, dips, and dressings had the highest median sodium content (3896 mg/100 g), and the distribution of sodium content in this category is very wide, ranging from a minimum sodium content of 0 mg/100 g to a maximum sodium content of 23,696 mg/100 g. The sodium content of sauces, dips, and dressings in this study is much lower than in 14 Latin American and Caribbean countries (7778 mg/100 g) [29] but much higher than in countries such as the UK (440 mg/100 g) [30], the USA (600 mg/100 g) [30], and Fiji (1422 mg/100 g) [31]. Sauces, dips, and dressings are special products that are not only an ingredient in pre-packaged foods but also an important source of sodium for the Chinese [32]. In the sauces, dips, and dressings category, 96.6% are high-sodium foods, and soy sauces, pickled vegetables, fermented bean curd, and paste and like products exceeded the sodium benchmark by 88.3%, 99.6%, 100.0%, 91.2%, respectively. A study that evaluated the sodium content of sauces in the UK over the past 10 years found that 70.0% of products met the UK maximum salt targets [33]. The wide range of sodium content distribution in sauces, dips, and dressings, as well as the fact that a high proportion of UK products have achieved the goal of salt reduction targets, means that there is still a lot of room for China to reduce sodium content in this category.
Pre-packaged foods commonly consumed by Chinese consumers include convenience foods, processed meat and poultry products, and snack foods, among others [10,34,35]. We found that most of these categories belong to high-sodium foods, and more than 70% of processed meat products, processed poultry products, processed fish products, and convenience foods did not meet sodium benchmarks. Therefore, in response, stricter measures to reduce sodium content should be implemented in these categories. However, researchers reported that the rate of achievement of salt reduction targets in categories such as processed meat and fish products and instant noodles was very low. In China, only 7.1% of processed meat and fish products met the UK’s sodium reduction targets [36], while 26% of instant noodles met the Pacific Salt Reduction Target (1600 mg/100 g) and 24% met the South Africa 2016 Target (1500 mg/100 g) [37]. Reducing the sodium content of pre-packaged foods that are high in sodium, high in consumption, or both can help reduce nearly 90% of the sodium intake from pre-packaged foods [38]. Therefore, strong sodium reduction policies should be implemented to regulate the sodium content of these categories, and technical issues should not become an obstacle to the high sodium content of these categories. There is evidence to support the feasibility of new approaches to reducing sodium content in pre-packaged foods, such as salt removal, salt replacement, flavour modification, functional modification, or physical modification [39].
In 2021, the WHO established global sodium benchmarks for 18 categories and 97 subcategories that were based on the lowest value for each subcategory from existing national and regional targets [25]. These sodium benchmarks ensure that products from all countries contain the same amount of sodium and provide a reference point for countries to set targets for salt in foods. If all pre-packaged foods met WHO global sodium benchmarks, the average sodium intake of the Chinese population would be reduced by 13.9% [38]. However, achieving this goal means that approximately 46.9% of Chinese packaged food needs to be reformulated [38]; this result is similar to the study by Martini et al. [40], in which they found the sodium content of most of the items of cereal-based products currently sold on the Italian market is much higher than sodium benchmarks. These results indicate that further efforts are needed globally to reduce the sodium content in pre-packaged foods. It is noteworthy that China has implemented voluntary salt reduction targets for pre-packaged foods, labelled “Healthy Choice” FOPL on lower-sodium products, and held an annual “China Salt Reduction Week” to help Chinese reduce salt intake.
Comprehensive salt reduction strategies in countries such as Finland and the UK have shown significant results. The multicomponent salt-reduction initiative led by the Finnish Government [41,42] resulted in a decrease in the average daily salt intake in Finland by 36% [43]. The comprehensive salt-reduction strategy led by the UK Government has reduced the sodium content of a wide range of packaged food categories by 20% to 50%, and overall population salt intake has decreased by 15% [15]. Comprehensive strategies could generally achieve the biggest reductions in salt consumption across an entire population; food reformulation may be one of the best strategies for reducing sodium intake [44,45]. The current Chinese adult’s average salt intake is 86% higher than the WHO’s recommendation [8]. This means that China needs to take stronger measures to reduce sodium intake and monitor and evaluate the effectiveness of these measures.
The latest report from the WHO stated that by accelerating the implementation of salt reduction policies, it is possible to meet the 2013 target of a 20% reduction in sodium intake and potentially avoid over 7 million deaths by 2030 [7]. China is committed to implementing and updating salt reduction measures, including developing FOPWL, revising salt reduction targets for pre-packaged foods, and promoting the use of low-sodium salt in China. Currently, NINH, China CDC has established a working group on guidelines for salt reduction in collaboration with the Chinese Nutrition Society and has revised Guidelines for Salt Reduction in the Chinese Food Industry. This Guideline provides a detailed classification of pre-packaged foods based on food characteristics, processing techniques, recipes, and Chinese eating habits, and plans to set the latest average salt content target and maximum salt content target for sodium reduction in pre-packaged foods. This Guideline also provides food manufacturers with scientific and practical guidance on salt reduction technologies, sets nutritional food processing standards and work targets, creates a progressive nutritional culture and policy environment, and guarantees support for consumer health. It is important to note that the National Nutrition Plan (2017–2030) aims to reduce daily sodium intake by 20%, and the WHO aims to reduce sodium intake by 30% by 2030.
The strength of this study is the fact that it included a large number of pre-packaged foods in the Chinese food and beverage supply. Compared with the published articles, this study also calculated the proportion of foods that met and did not meet the WHO global sodium benchmarks, as well as the difference in sodium content of the corresponding foods. An important limitation of the current research was that it was based on the nutritional information provided on the nutrition label and did not include actual measurements of sodium in pre-packaged foods.

5. Conclusions

This study analyzed the sodium content of 7660 products in 20 categories and 38 subcategories. The highest median sodium levels per 100 g were among sauces, dips, and dressings, convenience foods, processed fish products, processed meat products, processed poultry products, snack foods, processed egg products, and fine dried noodles, and these were classified as high-sodium foods. A large number of pre-packaged foods currently collected in China have a sodium content above the global sodium benchmarks. This study provided data to support the implementation of comprehensive salt reduction strategies, such as setting salt reduction targets for different categories of pre-packaged foods, improving food reformulation, and promoting the development of FOPL to help reduce sodium intake among the Chinese population and further reduce diet-related NCDs.

Supplementary Materials

The following supporting information can be downloaded at: https://www.mdpi.com/article/10.3390/nu15234862/s1, Table S1: Reference standards for the classification of pre-packaged foods in China.

Author Contributions

X.D.: conceptualization, methodology, software, formal analysis, data curation, writing—original draft preparation. W.L.: software, data curation. Y.L.: investigation, data curation. J.L.: software. H.L.: data curation. A.M.: writing—review and editing, supervision. Y.Y.: writing—review and editing, supervision. Z.W.: data curation, project administration. C.G.: conceptualization, methodology, project administration, writing—review and editing, funding acquisition. All authors have read and agreed to the published version of the manuscript.

Funding

This research is funded by the following national financial projects: Assessment and application of nutrients requirement and food environment for Chinese residents, No. 131031107000210003; United Nations International Children’s Emergency Fund (UNICEF) “Explore and establish Nutrient Profiling Model in China to regulate unhealthy prepackage food marketing to children”; Chinese Nutrition Society Nutrition Science Foundation, CNS-YUM2019A10, CNS-YUM2021-122; Danone Institute China Diet Nutrition Research & Communication Grant, DIC2020-06; Vital Strategies (USA) Jinan Representative Office.

Institutional Review Board Statement

Not applicable.

Informed Consent Statement

Not applicable.

Data Availability Statement

Data sets generated during the study are available from the corresponding author on reasonable request.

Conflicts of Interest

The authors declare no conflict of interest.

References

  1. Filippini, T.; Malavolti, M.; Whelton, P.K.; Naska, A.; Orsini, N.; Vinceti, M. Blood Pressure Effects of Sodium Reduction: Dose-Response Meta-Analysis of Experimental Studies. Circulation 2021, 143, 1542–1567. [Google Scholar] [CrossRef] [PubMed]
  2. Huang, L.; Trieu, K.; Yoshimura, S.; Neal, B.; Woodward, M.; Campbell, N.; Li, Q.; Lackland, D.T.; Leung, A.A.; Anderson, C.; et al. Effect of dose and duration of reduction in dietary sodium on blood pressure levels: Systematic review and meta-analysis of randomised trials. Br. Med. J. 2020, 368, m315. [Google Scholar] [CrossRef] [PubMed]
  3. Mozaffarian, D.; Fahimi, S.; Singh, G.M.; Micha, R.; Khatibzadeh, S.; Engell, R.E.; Lim, S.; Danaei, G.; Ezzati, M.; Powles, J. Global sodium consumption and death from cardiovascular causes. N. Engl. J. Med. 2014, 371, 624–634. [Google Scholar] [CrossRef] [PubMed]
  4. Wang, Y.; Wang, J.; Chen, S.; Li, B.; Lu, X.; Li, J. Different Changing Patterns for Stroke Subtype Mortality Attributable to High Sodium Intake in China During 1990 to 2019. Stroke 2023, 54, 1078–1087. [Google Scholar] [CrossRef] [PubMed]
  5. World Cancer Research Fund International; American Institute for Cancer Research. Continuous Update Project: Diet, Nutrition, Physical Activity and Stomach Cancer; American Institute for Cancer Research: Washington, DC, USA, 2016. [Google Scholar]
  6. Messerli, F.H.; Hofstetter, L.; Syrogiannouli, L.; Rexhaj, E.; Siontis, G.; Seiler, C.; Bangalore, S. Sodium intake, life expectancy, and all-cause mortality. Eur. Heart J. 2021, 42, 2103–2112. [Google Scholar] [CrossRef] [PubMed]
  7. World Health Organization. WHO Global Report on Sodium Intake Reduction; Report No.: 9789240069985 (Electronic Version); World Health Organization: Geneva, Switzerland, 2023. [Google Scholar]
  8. World Health Organization. Guideline: Sodium Intake for Adults and Children; Report No.: 9789241504836; World Health Organization: Geneva, Switzerland, 2012. [Google Scholar]
  9. Chinese Nutrition Society. Dietary Guidelines for Chinese (2022); People’s Medical Publishing House: Beijing, China, 2022. [Google Scholar]
  10. Zhou, Y.; Du, S.; Su, C.; Zhang, B.; Wang, H.; Popkin, B.M. The food retail revolution in China and its association with diet and health. Food Policy 2015, 55, 92–100. [Google Scholar] [CrossRef] [PubMed]
  11. Zhang, J.; Wang, Z.; Du, W.; Huang, F.; Jiang, H.; Bai, J.; Zhang, X.; Zhang, B.; Wang, H. Twenty-Five-Year Trends in Dietary Patterns among Chinese Adults from 1991 to 2015. Nutrients 2021, 13, 1327. [Google Scholar] [CrossRef]
  12. World Health Organization. Tackling NCDs: ‘Best Buys’ and Other Recommended Interventions for the Prevention and Control of Noncommunicable Diseases; World Health Organization: Geneva, Switzerland, 2017. [Google Scholar]
  13. World Health Organization. The SHAKE Technical Package for Salt Reduction; Report No.: 9789241511346; World Health Organization: Geneva, Switzerland, 2016. [Google Scholar]
  14. Santos, J.A.; Tekle, D.; Rosewarne, E.; Flexner, N.; Cobb, L.; Al-Jawaldeh, A.; Kim, W.J.; Breda, J.; Whiting, S.; Campbell, N.; et al. A Systematic Review of Salt Reduction Initiatives Around the World: A Midterm Evaluation of Progress Towards the 2025 Global Non-Communicable Diseases Salt Reduction Target. Adv. Nutr. 2021, 12, 1768–1780. [Google Scholar] [CrossRef]
  15. He, F.J.; Brinsden, H.C.; MacGregor, G.A. Salt reduction in the United Kingdom: A successful experiment in public health. J. Hum. Hypertens. 2014, 28, 345–352. [Google Scholar] [CrossRef]
  16. Musicus, A.A.; Kraak, V.I.; Bleich, S.N. Policy Progress in Reducing Sodium in the American Diet, 2010–2019. Annu. Rev. Nutr. 2020, 40, 407–435. [Google Scholar] [CrossRef]
  17. Smith, B.T.; Hack, S.; Jessri, M.; Arcand, J.; McLaren, L.; L’Abbé, M.R.; Anderson, L.N.; Hobin, E.; Hammond, D.; Manson, H.; et al. The Equity and Effectiveness of Achieving Canada’s Voluntary Sodium Reduction Guidance Targets: A Modelling Study Using the 2015 Canadian Community Health Survey-Nutrition. Nutrients 2021, 13, 779. [Google Scholar] [CrossRef] [PubMed]
  18. Ndanuko, R.N.; Shahid, M.; Jones, A.; Harris, T.; Maboreke, J.; Walker, A.; Raubenheimer, D.; Simpson, S.J.; Neal, B.; Wu, J.H.; et al. Projected effects on salt purchases following implementation of a national salt reduction policy in South Africa. Public Health Nutr. 2021, 24, 4614–4621. [Google Scholar] [CrossRef] [PubMed]
  19. Food and Agriculture Organization of the United Nations; United Nations International Children’s Emergency Fund; Pan American Health Organization. Etiquetado Nutricional en la Parte Frontal del Envase en América Latina y el Caribe; Nota Orientadora; FAO: Rome, Italy, 2022. [Google Scholar]
  20. Pan American Health Organization. Mapping Dietary Salt/Sodium Reduction Policies and Initiatives in the Region of the Americas; Report No.: 978-92-75-12324-9 (Print); PAHO: Washington, DC, USA, 2021. [Google Scholar]
  21. GB 28050-2011; General Rules for Nutrition Labeling of Prepackaged Foods. China Standard Press: Beijing, China, 2011.
  22. Yang, Y.X.; Gao, C.; Wang, Z.; Wang, Y.Y.; Lai, J.Q.; Ding, G.G. Introduction to Guidelines for Salt Reduction in Chinese Food Industry. Zhonghua Yu Fang Yi Xue Za Zhi 2019, 53, 549–552. [Google Scholar] [PubMed]
  23. GB 2760-2014; National Food Safety Standard Standard for Uses of Food Additives. China Standard Press: Beijing, China, 2014.
  24. WS/T 464-2015; Regulation of Food Composition Data Expression. China Standard Press: Beijing, China, 2015.
  25. World Health Organization. WHO Global Sodium Benchmarks for Different Food Categories; Report No.: 9789240025097 (Electronic Version); World Health Organization: Geneva, Switzerland, 2021. [Google Scholar]
  26. Zhou, M.; Wang, H.; Zeng, X.; Yin, P.; Zhu, J.; Chen, W.; Li, X.; Wang, L.; Wang, L.; Liu, Y.; et al. Mortality, morbidity, and risk factors in China and its provinces, 1990–2017: A systematic analysis for the Global Burden of Disease Study 2017. Lancet 2019, 394, 1145–1158. [Google Scholar] [CrossRef] [PubMed]
  27. Afshin, A.; Sur, P.J.; Fay, K.A.; Cornaby, L.; Murray, C. Health effects of dietary risks in 195 countries, 1990–2017: A systematic analysis for the Global Burden of Disease Study 2017. Lancet 2019, 393, 1958–1972. [Google Scholar] [CrossRef] [PubMed]
  28. He, Y.; Li, Y.; Yang, X.; Hemler, E.C.; Fang, Y.; Zhao, L.; Zhang, J.; Yang, Z.; Wang, Z.; He, L.; et al. The dietary transition and its association with cardiometabolic mortality among Chinese adults, 1982–2012: A cross-sectional population-based study. Lancet Diabetes Endocrinol. 2019, 7, 540–548. [Google Scholar] [CrossRef]
  29. Arcand, J.; Blanco-Metzler, A.; Benavides, A.K.; L’Abbe, M.R.; Legetic, B. Sodium Levels in Packaged Foods Sold in 14 Latin American and Caribbean Countries: A Food Label Analysis. Nutrients 2019, 11, 369. [Google Scholar] [CrossRef]
  30. Karlsson, K.; Rådholm, K.; Dunford, E.; Wu, J.; Neal, B.; Sundström, J. Sodium content in processed food items in Sweden compared to other countries: A cross-sectional multinational study. Front. Public Health 2023, 11, 1182132. [Google Scholar] [CrossRef]
  31. Shahid, M.; Waqa, G.; Pillay, A.; Kama, A.; Tukana, I.N.; McKenzie, B.L.; Webster, J.; Johnson, C. Packaged food supply in Fiji: Nutrient levels, compliance with sodium targets and adherence to labelling regulations. Public Health Nutr. 2021, 24, 4358–4368. [Google Scholar] [CrossRef]
  32. Zhang, J.; Wang, H.; Du, W.; Huang, F.; Wang, Z.; Zhang, B. Dietary Sodium Intake of Adult Residents in 15 Provinces of China. Food Nutr. China 2022, 28, 75–77. [Google Scholar]
  33. Tan, M.; He, F.J.; Ding, J.; Li, Y.; Zhang, P.; MacGregor, G.A. Salt content of sauces in the UK and China: Cross-sectional surveys. BMJ Open 2019, 9, e25623. [Google Scholar] [CrossRef] [PubMed]
  34. Zhang, J.; Huang, F.; Zhai, F.; Zhang, B. Investigation on the Consumption KAP of Pre-packagedFood Among Urban Residents in China. Food Nutr. China 2015, 21, 46–48. [Google Scholar]
  35. Li, Y.; Wang, H.; Zhang, P.; Popkin, B.M.; Coyle, D.H.; Ding, J.; Dong, L.; Zhang, J.; Du, W.; Pettigrew, S. Nutritional Quality of Pre-Packaged Foods in China under Various Nutrient Profile Models. Nutrients 2022, 14, 2700. [Google Scholar] [PubMed]
  36. Song, Y.; Li, Y.; Guo, C.; Wang, Y.; Huang, L.; Tan, M.; He, F.J.; Harris, T.; MacGregor, G.A.; Ding, J.; et al. Cross-sectional comparisons of sodium content in processed meat and fish products among five countries: Potential for feasible targets and reformulation. BMJ Open 2021, 11, e46412. [Google Scholar]
  37. Farrand, C.; Charlton, K.; Crino, M.; Santos, J.; Rodriguez-Fernandez, R.; Ni, M.C.; Webster, J. Know Your Noodles! Assessing Variations in Sodium Content of Instant Noodles across Countries. Nutrients 2017, 9, 612. [Google Scholar] [CrossRef] [PubMed]
  38. Zhang, P.; Zhang, J.; Li, Y.; Dong, L.; He, F.J.; Brown, M.; Pettigrew, S.; Webster, J.; Yamamoto, R.; Nishida, C.; et al. Sodium content targets for pre-packaged foods, China: A quantitative study and proposal. Bull. World Health Organ. 2023, 101, 453–469. [Google Scholar] [CrossRef]
  39. Dunteman, A.N.; McKenzie, E.N.; Yang, Y.; Lee, Y.; Lee, S.Y. Compendium of sodium reduction strategies in foods: A scoping review. Compr. Rev. Food. Sci. Food Saf. 2022, 21, 1300–1335. [Google Scholar] [CrossRef]
  40. Martini, D.; Strazzullo, P.; Serafini, M.; Porrini, M.; Pellegrini, N.; Angelino, D. Sodium Content in Cereal-Based Products Sold in Italy: How Far Are We from the Global Benchmarks? Nutrients 2022, 14, 3088. [Google Scholar] [CrossRef]
  41. He, F.J.; MacGregor, G.A. A comprehensive review on salt and health and current experience of worldwide salt reduction programmes. J. Hum. Hypertens. 2009, 23, 363–384. [Google Scholar]
  42. Pietinen, P.; Mannisto, S.; Valsta, L.M.; Sarlio-Lahteenkorva, S. Nutrition policy in Finland. Public Health Nutr. 2010, 13, 901–906. [Google Scholar] [CrossRef]
  43. Barberio, A.M.; Sumar, N.; Trieu, K.; Lorenzetti, D.L.; Tarasuk, V.; Webster, J.; Campbell, N.; McLaren, L. Population-level interventions in government jurisdictions for dietary sodium reduction: A Cochrane Review. Int. J. Epidemiol. 2017, 46, 1405–1551. [Google Scholar] [CrossRef] [PubMed]
  44. Vargas-Meza, J.; Gonzalez-Rocha, A.; Campos-Nonato, I.; Nilson, E.; Basto-Abreu, A.; Barquera, S.; Denova-Gutiérrez, E. Effective and Scalable Interventions to Reduce Sodium Intake: A Systematic Review and Meta-Analysis. Curr. Nutr. Rep. 2023, 12, 486–494. [Google Scholar] [CrossRef] [PubMed]
  45. Hyseni, L.; Elliot-Green, A.; Lloyd-Williams, F.; Kypridemos, C.; O’Flaherty, M.; McGill, R.; Orton, L.; Bromley, H.; Cappuccio, F.P.; Capewell, S. Systematic review of dietary salt reduction policies: Evidence for an effectiveness hierarchy? PLoS ONE 2017, 12, e177535. [Google Scholar]
Figure 1. Distribution of Chinese pre-packaged foods.
Nutrients 15 04862 g001
Figure 2. Chinese pre-packaged foods selection process.
Nutrients 15 04862 g002
Figure 3. Proportion of Chinese pre-packaged foods meeting low-sodium, medium-sodium, and high-sodium content by categories.
Nutrients 15 04862 g003
Figure 4. The percentage of Chinese pre-packaged foods meeting WHO global sodium benchmarks. Reference global sodium benchmarks in [25]. Cookies/sweet biscuits—265 mg/100 g; Pies and pastries—120 mg/100 g; Crackers/savoury biscuits—600 mg/100 g; Nuts, seeds, and kernels—280 mg/100 g; Potato, vegetable, and grain chips—500 mg/100 g; Extruded snacks—520 mg/100 g; Highly processed breakfast cereals—280 mg/100 g; Processed cheese—720 mg/100 g; Pasta, noodles, and rice or grains with sauce or seasoned (dry-mix, concentrated)—770 mg/100 g; Ready-to-eat meals composed of a combination of carbohydrate and either vegetable or meat, or all three combined—250 mg/100 g; Soups (ready-to-serve, canned, and refrigerated soups)—235 mg/100 g; Salted butter, butter blends, margarine, and oil-based spreads—400 mg/100 g; Sweet and raisin breads—310 mg/100 g; Leavened bread—330 mg/100 g; Canned fish—360 mg/100 g; Processed fish and seafood products, raw—270 mg/100 g; Raw meat products and preparations—230 mg/100 g; Comminuted meat products, heat treated (cooked)—540 mg/100 g; Comminuted meat products, non-heat preservation—280 mg/100 g; Potato, vegetable and grain chips—500 mg/100 g; Extruded snacks—830 mg/100 g; Pickled vegetables—550 mg/100 g; Tofu and tempeh—280 mg/100 g; Bouillon and soup stock (concentrated)—15,000 mg/100 g; Soy sauce and fish sauce—4840 mg/100 g; Other Asian-style sauces—680 mg/100 g.
Nutrients 15 04862 g004
Table 1. The sodium content of Chinese pre-packaged foods by categories.
NumberFood CategorynSodium Content (mg/100 g)
MedianIQRRange
1Chocolate, sugar confectionery, and jelly1545323–1020–600
2Cake and pastry products31617960–2800–851
2aChinese pastries (except for moon cakes)135203101–3070–851
2bMoon cakes974725–1210–744
2cWestern-style pastries84238187–32153–545
3Biscuits359280185–4140–956
3aSandwich biscuits71337220–40027–810
3bWafer biscuits4715580–2406–492
3cCookies39260192–324103–497
3dSoda biscuits20480417–495278–660
3eEgg roll1610769–1888–451
3fOther biscuits166300233–4640–956
4Snack foods1191750386–13460–6120
4aCrisps99572400–727107–1104
4bExtruded snacks (except for crisps)283530270–7980–4826
4cNuts and seeds256456232–7560–3912
4dExtruded flavouring noodles22325902221–2748776–3698
4ePreserves6834520–13680–6120
4fDried fruit465916–1630–933
4gSoybean curd slab2161004827–1325117–2608
5Beverages2972413–430–110
6Edible ices417254–866–257
7Yogurt, sour milk, and similar foods2726050–6932–190
8Cheese53363243–515115–1600
9Convenience foods6081578798–2073104–6852
10Frozen rice and flour products27131054–4350–866
11Cereals283678–1500–800
12Congee1025022–5120–2730
13Edible oil2100–00–0
14Bread and bakery products127250205–32095–606
14aSweet breads37249186–31395–546
14bLeavened breads90251212–325101–606
15Fine dried noodles322602250–6580–2100
16Processed meat products8221323990–168164–4718
16aCured meat products2819871478–2432700–4718
16bSoy sauce and pot-roast meat products2411250973–158989–3160
16cSmoked and roasted meat products211022930–1735494–1967
16dSausage meat products611015873–1200484–1967
16eDried meat products39815001238–179264–3684
16fCanned meat51800702–858587–1300
16gPrepared meat products22458306–687269–1170
17Processed poultry products7321240980–1573254–3094
17aSoy sauce and pot-roast poultry products58112961046–1620254–3094
17bSmoked and roasted poultry products621252894–1528301–2898
17cSausage poultry products67985857–1100546–1340
17dDried poultry products515361245–15801180–1600
17ePrepared poultry products17693544–940386–1529
18Processed fish products6111470994–180039–6160
18aCooked fish and seafood products47715611160–1860406–6160
18bCanned fish721116787–1410168–4000
18cOther fish products62701238–88439–1948
19Processed egg products66741618–907194–2706
20Sauces, dips, and dressings101238962059–65230–23,696
20aSoy sauces23166005907–73333140–10,120
20bFermented bean curd6935252975–39322080–5859
20cPickled vegetables25520001655–2360520–12,646
20dPaste and like products8264164045–80070–12,000
20eCompound seasoning37538961690–5447120–23,696
Table 2. The sodium content of Chinese pre-packaged foods meeting and not meeting WHO global sodium benchmarks, median (IQR).
Food CategoryMeeting Global Sodium BenchmarksNot Meeting Global Sodium Benchmarks
nSodium (mg/100 g)nSodium (mg/100 g)
MedianIQRMedianIQR
Chinese pastries (except for moon cakes)395632–8696280189–464
Moon cakes723419–6025184138–274
Western-style pastries29168130–19355300240–354
Sandwich biscuits66311218–3805768658–789
Wafer biscuits3713566–19610412317–471
Cookies22199160–22417325283–373
Soda biscuits19480396–4801660660–660
Egg roll1410253–1682364320–407
Other biscuits141276209–36525699633–747
Crisps33360265–40866681572–754
Extruded snacks (except for crisps)138267190–409145769645–919
Nuts and seeds7313816–197183600433–836
Soybean curd slab2174145–2022141005843–1331
Cheese46321239–4207972800–1024
Convenience foods145530357–73346318491383–2188
Frozen rice and flour products1214814–89150422377–506
Cereals259407–12124321280–413
Congee733411–54291243684–1909
Edible oil2100–0NANANA
Sweet breads28224165–2569400326–499
Leavened breads70238204–26120383362–411
Cured meat products2742721–7622620321590–2485
Soy sauce and pot-roast meat products10396100–42223112661010–1594
Smoked and roasted meat products1752752–752201237971–1735
Sausage meat products1484484–484601043882–1200
Dried meat products2178121–23439615001239–1792
Canned meatNANANA51800702–858
Prepared meat productsNANANA22458306–687
Soy sauce and pot-roast poultry products13510471–53256813041062–1645
Smoked and roasted poultry products2414357–470601254900–1549
Sausage poultry productsNANANA67985857–1100
Dried poultry productsNANANA515361245–1580
Prepared poultry productsNANANA17693544–940
Canned fish4320206–341681135793–1479
Other fish products1712453–19445796619–1016
Soy sauces2745204520–479320467546422–7433
Pickled vegetables1520520–52025420001657–2360
Fermented bean curdNANANA6935252975–3932
Paste and like products83350–4127468554479–8517
Compound seasoning33734561460–47203819,20017,652–20,000
Notes: NA—not applicable—means all items in these categories either met or did not meet WHO global sodium benchmarks.
Disclaimer/Publisher’s Note: The statements, opinions and data contained in all publications are solely those of the individual author(s) and contributor(s) and not of MDPI and/or the editor(s). MDPI and/or the editor(s) disclaim responsibility for any injury to people or property resulting from any ideas, methods, instructions or products referred to in the content.

