
Low-Carbohydrate and Low-Fat Diet with Metabolic-Dysfunction-Associated Fatty Liver Disease
 and
and
Abstract
:1. Introduction
2. Materials and Methods
2.1. Study Design and Participants
2.2. Assessments of LCD and LFD Scores
2.3. Assessment of MAFLD
2.4. Covariates Assessment
2.5. Statistical Analysis
3. Results
3.1. Participant Characteristics
3.2. LCD and LFD Scores and MAFLD
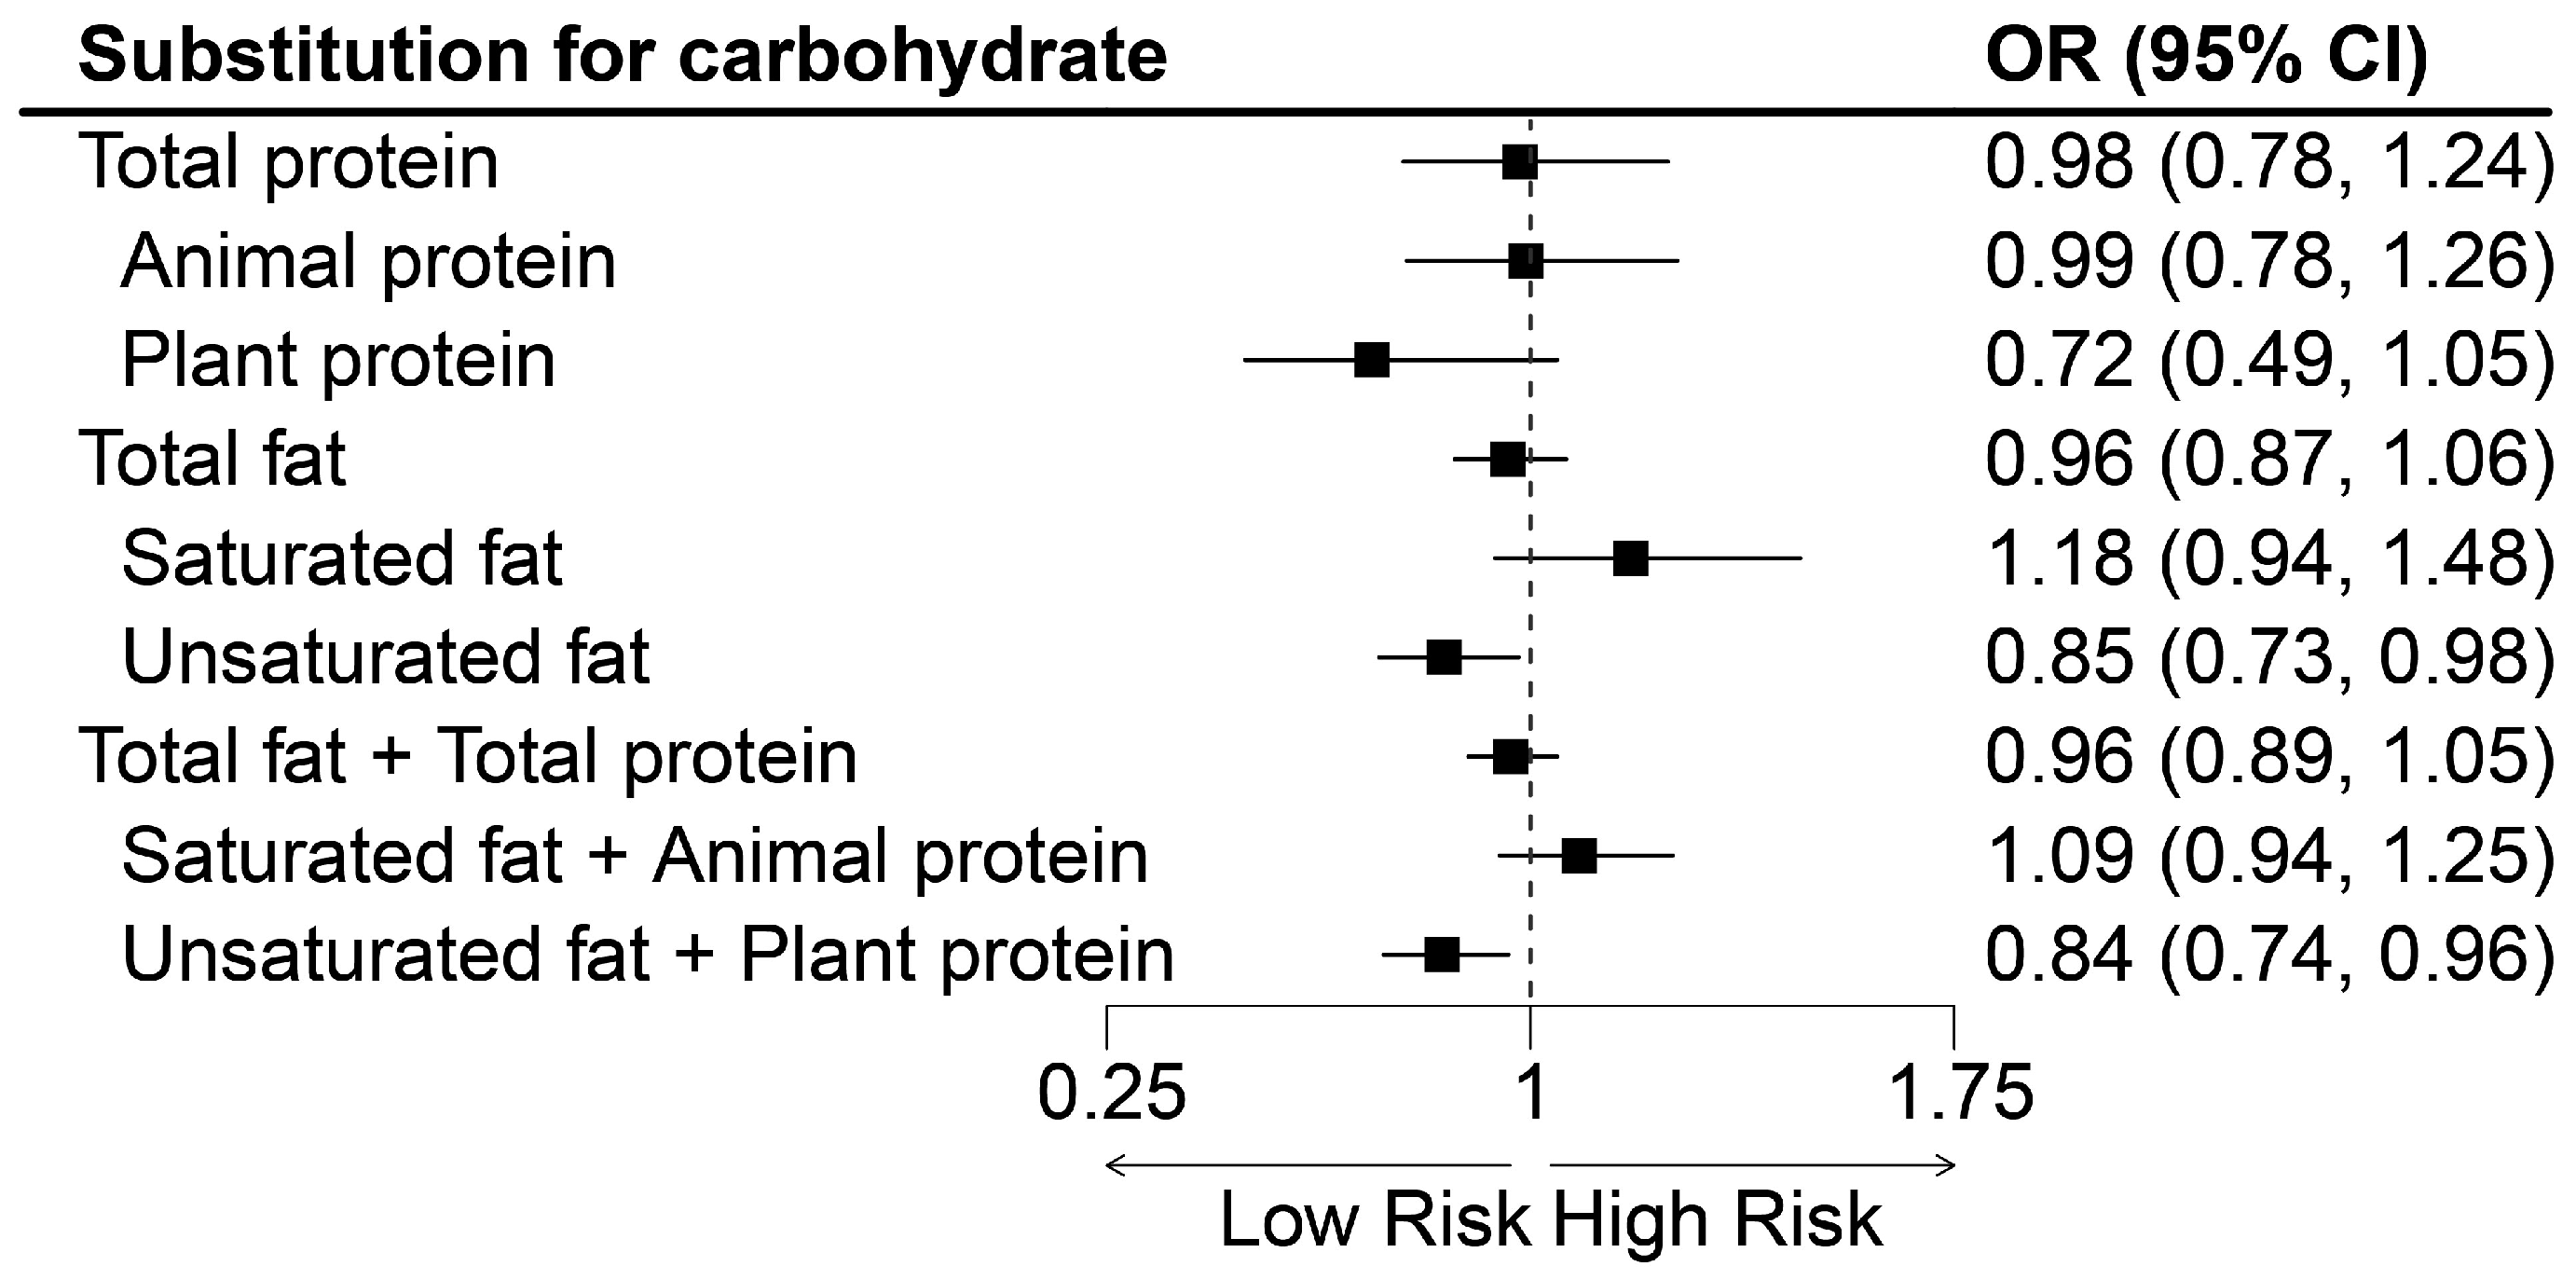
3.3. Isocaloric Substitution Models
3.4. Subgroup and Sensitivity Analyses
4. Discussion
5. Conclusions
Supplementary Materials
Author Contributions
Funding
Institutional Review Board Statement
Informed Consent Statement
Data Availability Statement
Conflicts of Interest
Abbreviations
References
- Sun, D.Q.; Jin, Y.; Wang, T.Y.; Zheng, K.I.; Rios, R.S.; Zhang, H.Y.; Targher, G.; Byrne, C.D.; Yuan, W.J.; Zheng, M.H. MAFLD and risk of CKD. Metabolism 2021, 115, 154433. [Google Scholar] [CrossRef] [PubMed]
- Younossi, Z.M.; Koenig, A.B.; Abdelatif, D.; Fazel, Y.; Henry, L.; Wymer, M. Global epidemiology of nonalcoholic fatty liver disease-Meta-analytic assessment of prevalence, incidence, and outcomes. Hepatology 2016, 64, 73–84. [Google Scholar] [CrossRef] [PubMed]
- Eslam, M.; Newsome, P.N.; Sarin, S.K.; Anstee, Q.M.; Targher, G.; Romero-Gomez, M.; Zelber-Sagi, S.; Wai-Sun Wong, V.; Dufour, J.F.; Schattenberg, J.M.; et al. A new definition for metabolic dysfunction-associated fatty liver disease: An international expert consensus statement. J. Hepatol. 2020, 73, 202–209. [Google Scholar] [CrossRef] [PubMed]
- Fouad, Y.; Waked, I.; Bollipo, S.; Gomaa, A.; Ajlouni, Y.; Attia, D. What’s in a name? Renaming ‘NAFLD’ to ‘MAFLD’. Liver Int. 2020, 40, 1254–1261. [Google Scholar] [CrossRef]
- Eslam, M.; Sanyal, A.J.; George, J. MAFLD: A Consensus-Driven Proposed Nomenclature for Metabolic Associated Fatty Liver Disease. Gastroenterology 2020, 158, 1999–2014.e1991. [Google Scholar] [CrossRef]
- van Kleef, L.A.; de Knegt, R.J.; Brouwer, W.P. Metabolic dysfunction-associated fatty liver disease and excessive alcohol consumption are both independent risk factors for mortality. Hepatology 2023, 77, 942–948. [Google Scholar] [CrossRef]
- Guo, F.; Estévez-Vázquez, O.; Benedé-Ubieto, R.; Maya-Miles, D.; Zheng, K.; Gallego-Durán, R.; Rojas, Á.; Ampuero, J.; Romero-Gómez, M.; Philip, K.; et al. A Shortcut from Metabolic-Associated Fatty Liver Disease (MAFLD) to Hepatocellular Carcinoma (HCC): C-MYC a Promising Target for Preventative Strategies and Individualized Therapy. Cancers 2021, 14, 192. [Google Scholar] [CrossRef]
- Lee, H.; Lee, Y.H.; Kim, S.U.; Kim, H.C. Metabolic Dysfunction-Associated Fatty Liver Disease and Incident Cardiovascular Disease Risk: A Nationwide Cohort Study. Clin. Gastroenterol. Hepatol. 2021, 19, 2138–2147.e2110. [Google Scholar] [CrossRef]
- Key, T.J.; Bradbury, K.E.; Perez-Cornago, A.; Sinha, R.; Tsilidis, K.K.; Tsugane, S. Diet, nutrition, and cancer risk: What do we know and what is the way forward? BMJ 2020, 368, m511. [Google Scholar] [CrossRef]
- Zhou, Y.F.; Lai, J.S.; Chong, M.F.; Tong, E.H.; Neelakantan, N.; Pan, A.; Koh, W.P. Association between changes in diet quality from mid-life to late-life and healthy ageing: The Singapore Chinese Health Study. Age Ageing 2022, 51, afac232. [Google Scholar] [CrossRef]
- Hansen, C.D.; Gram-Kampmann, E.M.; Hansen, J.K.; Hugger, M.B.; Madsen, B.S.; Jensen, J.M.; Olesen, S.; Torp, N.; Rasmussen, D.N.; Kjærgaard, M.; et al. Effect of Calorie-Unrestricted Low-Carbohydrate, High-Fat Diet Versus High-Carbohydrate, Low-Fat Diet on Type 2 Diabetes and Nonalcoholic Fatty Liver Disease: A Randomized Controlled Trial. Ann. Intern. Med. 2023, 176, 10–21. [Google Scholar] [CrossRef] [PubMed]
- Bazzano, L.A.; Hu, T.; Reynolds, K.; Yao, L.; Bunol, C.; Liu, Y.; Chen, C.S.; Klag, M.J.; Whelton, P.K.; He, J. Effects of low-carbohydrate and low-fat diets: A randomized trial. Ann. Intern. Med. 2014, 161, 309–318. [Google Scholar] [CrossRef] [PubMed]
- Shan, Z.; Guo, Y.; Hu, F.B.; Liu, L.; Qi, Q. Association of Low-Carbohydrate and Low-Fat Diets with Mortality among US Adults. JAMA Intern. Med. 2020, 180, 513–523. [Google Scholar] [CrossRef] [PubMed]
- Cai, L.; Yin, J.; Ma, X.; Mo, Y.; Li, C.; Lu, W.; Bao, Y.; Zhou, J.; Jia, W. Low-carbohydrate diets lead to greater weight loss and better glucose homeostasis than exercise: A randomized clinical trial. Front. Med. 2021, 15, 460–471. [Google Scholar] [CrossRef] [PubMed]
- Mardinoglu, A.; Wu, H.; Bjornson, E.; Zhang, C.; Hakkarainen, A.; Räsänen, S.M.; Lee, S.; Mancina, R.M.; Bergentall, M.; Pietiläinen, K.H.; et al. An Integrated Understanding of the Rapid Metabolic Benefits of a Carbohydrate-Restricted Diet on Hepatic Steatosis in Humans. Cell Metab. 2018, 27, 559–571.e555. [Google Scholar] [CrossRef] [PubMed]
- Nordmann, A.J.; Nordmann, A.; Briel, M.; Keller, U.; Yancy, W.S., Jr.; Brehm, B.J.; Bucher, H.C. Effects of low-carbohydrate vs low-fat diets on weight loss and cardiovascular risk factors: A meta-analysis of randomized controlled trials. Arch. Intern. Med. 2006, 166, 285–293. [Google Scholar] [CrossRef]
- Ludwig, D.S.; Hu, F.B.; Tappy, L.; Brand-Miller, J. Dietary carbohydrates: Role of quality and quantity in chronic disease. BMJ 2018, 361, k2340. [Google Scholar] [CrossRef]
- Sacks, F.M.; Lichtenstein, A.H.; Wu, J.H.Y.; Appel, L.J.; Creager, M.A.; Kris-Etherton, P.M.; Miller, M.; Rimm, E.B.; Rudel, L.L.; Robinson, J.G.; et al. Dietary Fats and Cardiovascular Disease: A Presidential Advisory from the American Heart Association. Circulation 2017, 136, e1–e23. [Google Scholar] [CrossRef]
- Song, M.; Fung, T.T.; Hu, F.B.; Willett, W.C.; Longo, V.D.; Chan, A.T.; Giovannucci, E.L. Association of Animal and Plant Protein Intake With All-Cause and Cause-Specific Mortality. JAMA Intern. Med. 2016, 176, 1453–1463. [Google Scholar] [CrossRef]
- Leamy, A.K.; Egnatchik, R.A.; Young, J.D. Molecular mechanisms and the role of saturated fatty acids in the progression of non-alcoholic fatty liver disease. Prog. Lipid Res. 2013, 52, 165–174. [Google Scholar] [CrossRef]
- Obara, N.; Fukushima, K.; Ueno, Y.; Wakui, Y.; Kimura, O.; Tamai, K.; Kakazu, E.; Inoue, J.; Kondo, Y.; Ogawa, N.; et al. Possible involvement and the mechanisms of excess trans-fatty acid consumption in severe NAFLD in mice. J. Hepatol. 2010, 53, 326–334. [Google Scholar] [CrossRef] [PubMed]
- Li, X.; Li, M.; Xu, L.; Zeng, X.; Zhang, T.; Yang, H.; Li, H.; Zhou, Z.; Wang, Y.; Zhang, C.; et al. Associations between low-carbohydrate and low-fat diets and hepatic steatosis. Obesity 2022, 30, 2317–2328. [Google Scholar] [CrossRef] [PubMed]
- Patel, C.J.; Pho, N.; McDuffie, M.; Easton-Marks, J.; Kothari, C.; Kohane, I.S.; Avillach, P. A database of human exposomes and phenomes from the US National Health and Nutrition Examination Survey. Sci. Data 2016, 3, 160096. [Google Scholar] [CrossRef] [PubMed]
- Moshfegh, A.J.; Rhodes, D.G.; Baer, D.J.; Murayi, T.; Clemens, J.C.; Rumpler, W.V.; Paul, D.R.; Sebastian, R.S.; Kuczynski, K.J.; Ingwersen, L.A.; et al. The US Department of Agriculture Automated Multiple-Pass Method reduces bias in the collection of energy intakes. Am. J. Clin. Nutr. 2008, 88, 324–332. [Google Scholar] [CrossRef] [PubMed]
- Herrick, K.A.; Rossen, L.M.; Parsons, R.; Dodd, K.W. Estimating Usual Dietary in Take from National Health and Nut Rition Examination Survey Data Using the National Cancer Institute Method. Vital and Health Statistics. Series 2; 2018; pp. 1–63. Available online: https://www.cdc.gov/nchs/data/series/sr_02/sr02_178.pdf (accessed on 20 March 2023).
- Eddowes, P.J.; Sasso, M.; Allison, M.; Tsochatzis, E.; Anstee, Q.M.; Sheridan, D.; Guha, I.N.; Cobbold, J.F.; Deeks, J.J.; Paradis, V.; et al. Accuracy of FibroScan Controlled Attenuation Parameter and Liver Stiffness Measurement in Assessing Steatosis and Fibrosis in Patients with Nonalcoholic Fatty Liver Disease. Gastroenterology 2019, 156, 1717–1730. [Google Scholar] [CrossRef] [PubMed]
- Karlas, T.; Petroff, D.; Sasso, M.; Fan, J.G.; Mi, Y.Q.; de Lédinghen, V.; Kumar, M.; Lupsor-Platon, M.; Han, K.H.; Cardoso, A.C.; et al. Individual patient data meta-analysis of controlled attenuation parameter (CAP) technology for assessing steatosis. J. Hepatol. 2017, 66, 1022–1030. [Google Scholar] [CrossRef]
- Weng, Z.; Ou, W.; Huang, J.; Singh, M.; Wang, M.; Zhu, Y.; Kumar, R.; Lin, S. Circadian Misalignment Rather Than Sleep Duration Is Associated with MAFLD: A Population-Based Propensity Score-Matched Study. Nat. Sci. Sleep 2021, 13, 103–111. [Google Scholar] [CrossRef]
- Tian, T.; Zhang, J.; Xie, W.; Ni, Y.; Fang, X.; Liu, M.; Peng, X.; Wang, J.; Dai, Y.; Zhou, Y. Dietary Quality and Relationships with Metabolic Dysfunction-Associated Fatty Liver Disease (MAFLD) among United States Adults, Results from NHANES 2017–2018. Nutrients 2022, 14, 4505. [Google Scholar] [CrossRef]
- Park, Y.M.; Choi, M.K.; Lee, S.S.; Shivappa, N.; Han, K.; Steck, S.E.; Hébert, J.R.; Merchant, A.T.; Sandler, D.P. Dietary inflammatory potential and risk of mortality in metabolically healthy and unhealthy phenotypes among overweight and obese adults. Clin. Nutr. 2019, 38, 682–688. [Google Scholar] [CrossRef]
- Liu, Y.; Yang, W.; VoPham, T.; Ma, Y.; Simon, T.G.; Gao, X.; Chan, A.T.; Meyerhardt, J.A.; Giovannucci, E.L.; Zhang, X. Plant-Based and Animal-Based Low-Carbohydrate Diets and Risk of Hepatocellular Carcinoma among US Men and Women. Hepatology 2021, 73, 175–185. [Google Scholar] [CrossRef]
- Thomsen, M.N.; Skytte, M.J.; Samkani, A.; Carl, M.H.; Weber, P.; Astrup, A.; Chabanova, E.; Fenger, M.; Frystyk, J.; Hartmann, B.; et al. Dietary carbohydrate restriction augments weight loss-induced improvements in glycaemic control and liver fat in individuals with type 2 diabetes: A randomised controlled trial. Diabetologia 2022, 65, 506–517. [Google Scholar] [CrossRef]
- Hu, Y.; Liu, G.; Yu, E.; Wang, B.; Wittenbecher, C.; Manson, J.E.; Rimm, E.B.; Liang, L.; Rexrode, K.; Willett, W.C.; et al. Low-Carbohydrate Diet Scores and Mortality among Adults with Incident Type 2 Diabetes. Diabetes Care 2023, 46, 874–884. [Google Scholar] [CrossRef]
- Rosqvist, F.; Iggman, D.; Kullberg, J.; Cedernaes, J.; Johansson, H.E.; Larsson, A.; Johansson, L.; Ahlström, H.; Arner, P.; Dahlman, I.; et al. Overfeeding polyunsaturated and saturated fat causes distinct effects on liver and visceral fat accumulation in humans. Diabetes 2014, 63, 2356–2368. [Google Scholar] [CrossRef] [PubMed]
- Liao, Y.J.; Wang, Y.H.; Wu, C.Y.; Hsu, F.Y.; Chien, C.Y.; Lee, Y.C. Ketogenic Diet Enhances the Cholesterol Accumulation in Liver and Augments the Severity of CCl(4) and TAA-Induced Liver Fibrosis in Mice. Int. J. Mol. Sci. 2021, 22, 2934. [Google Scholar] [CrossRef] [PubMed]
- van den Hoek, A.M.; de Jong, J.; Worms, N.; van Nieuwkoop, A.; Voskuilen, M.; Menke, A.L.; Lek, S.; Caspers, M.P.M.; Verschuren, L.; Kleemann, R. Diet and exercise reduce pre-existing NASH and fibrosis and have additional beneficial effects on the vasculature, adipose tissue and skeletal muscle via organ-crosstalk. Metabolism 2021, 124, 154873. [Google Scholar] [CrossRef] [PubMed]
- Roager, H.M.; Vogt, J.K.; Kristensen, M.; Hansen, L.B.S.; Ibrügger, S.; Mærkedahl, R.B.; Bahl, M.I.; Lind, M.V.; Nielsen, R.L.; Frøkiær, H.; et al. Whole grain-rich diet reduces body weight and systemic low-grade inflammation without inducing major changes of the gut microbiome: A randomised cross-over trial. Gut 2019, 68, 83–93. [Google Scholar] [CrossRef]
- Hollænder, P.L.; Ross, A.B.; Kristensen, M. Whole-grain and blood lipid changes in apparently healthy adults: A systematic review and meta-analysis of randomized controlled studies. Am. J. Clin. Nutr. 2015, 102, 556–572. [Google Scholar] [CrossRef]
- Barchetta, I.; Cimini, F.A.; Cavallo, M.G. Vitamin D and Metabolic Dysfunction-Associated Fatty Liver Disease (MAFLD): An Update. Nutrients 2020, 12, 3302. [Google Scholar] [CrossRef]
- Bao, Y.; Han, J.; Hu, F.B.; Giovannucci, E.L.; Stampfer, M.J.; Willett, W.C.; Fuchs, C.S. Association of nut consumption with total and cause-specific mortality. N. Engl. J. Med. 2013, 369, 2001–2011. [Google Scholar] [CrossRef]
- Gong, L.; Cao, W.; Chi, H.; Wang, J.; Zhang, H.; Liu, J.; Sun, B. Whole cereal grains and potential health effects: Involvement of the gut microbiota. Food Res. Int. 2018, 103, 84–102. [Google Scholar] [CrossRef]
- Wolters, M.; Ahrens, J.; Romaní-Pérez, M.; Watkins, C.; Sanz, Y.; Benítez-Páez, A.; Stanton, C.; Günther, K. Dietary fat, the gut microbiota, and metabolic health—A systematic review conducted within the MyNewGut project. Clin. Nutr. 2019, 38, 2504–2520. [Google Scholar] [CrossRef] [PubMed]
- Le Chatelier, E.; Nielsen, T.; Qin, J.; Prifti, E.; Hildebrand, F.; Falony, G.; Almeida, M.; Arumugam, M.; Batto, J.M.; Kennedy, S.; et al. Richness of human gut microbiome correlates with metabolic markers. Nature 2013, 500, 541–546. [Google Scholar] [CrossRef] [PubMed]
- Zhu, Y.; Peng, Z.; Lu, Y.; Li, H.; Zeng, X.; Zhang, Z.; Li, X.; Hu, C.; Hu, A.; Zhao, Q.; et al. Higher dietary insulinaemic potential is associated with increased risk of liver steatosis and fibrosis. Liver Int. 2022, 42, 69–79. [Google Scholar] [CrossRef] [PubMed]
- Kaya, E.; Yilmaz, Y. Metabolic-Associated Fatty Liver Disease (MAFLD): A Multi-Systemic Disease beyond the Liver. J. Clin. Transl. Hepatol. 2022, 10, 329–338. [Google Scholar] [CrossRef] [PubMed]
- El-Bakry, H.A.; El-Sherif, G.; Rostom, R.M. Therapeutic dose of green tea extract provokes liver damage and exacerbates paracetamol-induced hepatotoxicity in rats through oxidative stress and caspase 3-dependent apoptosis. Biomed. Pharmacother. 2017, 96, 798–811. [Google Scholar] [CrossRef]
- Bunchorntavakul, C.; Reddy, K.R. Review article: Herbal and dietary supplement hepatotoxicity. Aliment. Pharmacol. Ther. 2013, 37, 3–17. [Google Scholar] [CrossRef]
- Blanton, C.A.; Moshfegh, A.J.; Baer, D.J.; Kretsch, M.J. The USDA automated multiple-pass method accurately estimates group total energy and nutrient intake. J. Nutr. 2006, 136, 2594–2599. [Google Scholar] [CrossRef]
- Drewnowski, A.; Maillot, M.; Vieux, F. Multiple metrics of carbohydrate quality place starchy vegetables alongside non-starchy vegetables, legumes, and whole fruit. Front. Nutr. 2022, 9, 867378. [Google Scholar] [CrossRef]
- Pasiakos, S.M.; Agarwal, S.; Lieberman, H.R.; Fulgoni, V.L., 3rd. Sources and amounts of animal, dairy, and plant protein intake of US adults in 2007–2010. Nutrients 2015, 7, 7058–7069. [Google Scholar] [CrossRef]

| Characteristic | Overall LCD Score | p | Unhealthy LCD Score | p | Healthy LCD Score | p | |||
|---|---|---|---|---|---|---|---|---|---|
| Tertile 1 | Tertile 3 | Tertile 1 | Tertile 3 | Tertile 1 | Tertile 3 | ||||
| Participants, n | 1429 | 1257 | 1423 | 1270 | 1476 | 1277 | |||
| Median score (IQR) | 7 (4–9) | 24 (21–27) | 8 (5–11) | 22 (20–24) | 9 (6–11) | 22 (20–24) | |||
| Age, years | 48.01 ± 0.88 | 47.63 ± 0.95 | 0.723 | 52.18 ± 0.84 | 44.3 ± 0.98 | <0.001 | 44.45 ± 0.77 | 50.31 ± 1.23 | 0.001 |
| BMI, kg/m2 | 29.49 ± 0.29 | 29.78 ± 0.38 | 0.297 | 28.71 ± 0.30 | 30.2 ± 0.35 | 0.012 | 29.58 ± 0.28 | 28.99 ± 0.34 | 0.017 |
| WC, cm | 99.72 ± 0.70 | 101.22 ± 0.97 | 0.085 | 98.11 ± 0.71 | 102.23 ± 0.94 | 0.006 | 100.01 ± 0.66 | 99.23 ± 0.95 | 0.051 |
| Female, % | 823 (57.36) | 534 (43.58) | <0.001 | 868 (58.88) | 490 (39.86) | <0.001 | 746 (52.22) | 643 (51.05) | 0.834 |
| Race/Ethnicity | <0.001 | <0.001 | <0.001 | ||||||
| Non-Hispanic White | 414 (53.71) | 552 (69.87) | 357 (53.91) | 579 (68.96) | 467 (54.14) | 504 (68.21) | |||
| Other | 1015 (46.29) | 705 (30.13) | 1066 (46.09) | 691 (31.04) | 1009 (45.86) | 773 (31.79) | |||
| Educational level | 0.009 | 0.148 | <0.001 | ||||||
| High school or below | 627 (41.79) | 487 (32.81) | 567 (35.48) | 538 (38.22) | 689 (46.58) | 441 (30.17) | |||
| Above high school | 799 (58.21) | 769 (67.19) | 853 (64.52) | 731 (61.78) | 783 (53.42) | 834 (69.83) | |||
| Marital status | 0.254 | 0.751 | 0.019 | ||||||
| Married or living with partner | 852 (59.11) | 751 (63.79) | 894 (62.87) | 725 (60.74) | 820 (56.84) | 826 (64.59) | |||
| Other | 575 (40.89) | 505 (36.21) | 528 (37.13) | 545 (39.26) | 653 (43.16) | 451 (35.41) | |||
| PIR | <0.001 | 0.264 | <0.001 | ||||||
| <1.85 | 587 (37.33) | 417 (24.95) | 512 (31.47) | 474 (28.49) | 646 (40.2) | 395 (23.69) | |||
| ≥1.85 | 666 (62.67) | 703 (75.05) | 734 (68.53) | 673 (71.51) | 650 (59.8) | 750 (76.31) | |||
| Current smoker, % | 240 (19.53) | 234 (15.26) | 0.203 | 164 (13.49) | 309 (19.46) | <0.001 | 347 (23.51) | 164 (11.59) | <0.001 |
| Current drinker, % | 903 (72.24) | 910 (81.33) | <0.001 | 871 (69.95) | 949 (83.34) | <0.001 | 992 (73.83) | 892 (77.73) | 0.125 |
| Recommended physical activity, % | 307 (24.90) | 345 (34.18) | <0.001 | 352 (28.38) | 313 (28.69) | 0.821 | 284 (20.42) | 396 (38.57) | <0.001 |
| MAFLD, % | 783 (55.57) | 727 (52.43) | 0.613 | 787 (52.25) | 729 (54.54) | 0.672 | 811 (56.85) | 714 (49.18) | 0.032 |
| CAP, dB/m | 263.79 ± 2.40 | 262.67 ± 3.13 | 0.899 | 258.79 ± 2.82 | 264.88 ± 3.33 | 0.265 | 263.88 ± 2.02 | 258.77 ± 3.48 | 0.054 |
| Dietary intake | |||||||||
| Total energy, kcal/d | 2089 ± 24 | 1901 ± 19 | <0.001 | 1980 ± 22 | 2009 ± 18 | 0.694 | 2126 ± 18 | 1870 ± 17 | <0.001 |
| Total carbohydrate, % of total energy intake | 54.88 ± 0.10 | 44.03 ± 0.16 | <0.001 | 53.51 ± 0.14 | 45.34 ± 0.20 | <0.001 | 53.22 ± 0.18 | 45.31 ± 0.24 | <0.001 |
| High-quality carbohydrate | 9.88 ± 0.32 | 7.97 ± 0.15 | <0.001 | 12.8 ± 0.27 | 5.84 ± 0.15 | <0.001 | 6.91 ± 0.25 | 10.44 ± 0.26 | <0.001 |
| Low-quality carbo hydrate | 45.00 ± 0.32 | 36.06 ± 0.23 | <0.001 | 40.71 ± 0.32 | 39.50 ± 0.32 | <0.001 | 46.31 ± 0.28 | 34.86 ± 0.19 | <0.001 |
| Total fat, % of total energy intake | 30.32 ± 0.12 | 37.75 ± 0.10 | <0.001 | 31.22 ± 0.20 | 36.99 ± 0.13 | <0.001 | 31.53 ± 0.14 | 36.98 ± 0.18 | <0.001 |
| Unsaturated fat | 19.47 ± 0.10 | 24.20 ± 0.09 | <0.001 | 20.62 ± 0.15 | 23.28 ± 0.10 | <0.001 | 19.84 ± 0.08 | 24.16 ± 0.12 | <0.001 |
| Saturated fat | 10.85 ± 0.05 | 13.55 ± 0.10 | <0.001 | 10.6 ± 0.07 | 13.71 ± 0.09 | <0.001 | 11.69 ± 0.07 | 12.82 ± 0.10 | <0.001 |
| Total protein, % of total energy intake | 14.8 ± 0.08 | 18.22 ± 0.12 | <0.001 | 15.27 ± 0.10 | 17.68 ± 0.12 | <0.001 | 15.25 ± 0.09 | 17.71 ± 0.12 | <0.001 |
| Plant protein | 5.25 ± 0.05 | 5.42 ± 0.04 | 0.044 | 5.75 ± 0.06 | 5.10 ± 0.03 | <0.001 | 4.82 ± 0.03 | 5.91 ± 0.04 | <0.001 |
| Animal protein | 9.55 ± 0.06 | 12.8 ± 0.13 | <0.001 | 9.52 ± 0.07 | 12.58 ± 0.12 | <0.001 | 10.44 ± 0.08 | 11.81 ± 0.13 | <0.001 |
| Characteristic | Overall LFD Score | p | Unhealthy LFD Score | p | Healthy LFD Score | p | |||
|---|---|---|---|---|---|---|---|---|---|
| Tertile 1 | Tertile 3 | Tertile 1 | Tertile 3 | Tertile 1 | Tertile 3 | ||||
| Participants, n | 1449 | 1206 | 1569 | 1069 | 1380 | 1311 | |||
| Median score (IQR) | 9 (7–11) | 21 (20–23) | 10 (8–12) | 21 (20–23) | 8 (5–10) | 23 (21–26) | |||
| Age, years | 48.84 ± 0.91 | 46.87 ± 0.73 | 0.136 | 52.15 ± 1.02 | 42.1 ± 0.78 | <0.001 | 45.17 ± 0.67 | 50.96 ± 0.69 | <0.001 |
| BMI, kg/m2 | 29.74 ± 0.35 | 29.20 ± 0.27 | 0.484 | 29.34 ± 0.35 | 29.67 ± 0.35 | 0.291 | 30.43 ± 0.36 | 28.66 ± 0.28 | 0.003 |
| WC, cm | 101.24 ± 0.85 | 98.52 ± 0.79 | 0.064 | 100.33 ± 0.98 | 99.8 ± 0.92 | 0.841 | 102.69 ± 0.82 | 97.36 ± 0.75 | <0.001 |
| Female, % | 704 (47.78) | 635 (55.38) | 0.043 | 871 (54.73) | 479 (48.91) | 0.029 | 619 (46.26) | 753 (59.26) | <0.001 |
| Race/Ethnicity | <0.001 | <0.001 | <0.001 | ||||||
| Non-Hispanic White | 689 (74.59) | 229 (40.84) | 669 (72.84) | 296 (48.49) | 639 (69.82) | 271 (45.81) | |||
| Other | 760 (25.41) | 977 (59.16) | 900 (27.16) | 773 (51.51) | 741 (30.18) | 1040 (54.19) | |||
| Educational level | 0.014 | <0.001 | 0.107 | ||||||
| High school or below | 551 (34.6) | 577 (44.66) | 541 (30.53) | 528 (48.30) | 591 (40.16) | 527 (33.72) | |||
| Above high school | 896 (65.4) | 624 (55.34) | 1026 (69.47) | 538 (51.70) | 787 (59.84) | 780 (66.28) | |||
| Marital status | 0.513 | 0.089 | 0.104 | ||||||
| Married or living with partner | 825 (63.28) | 747 (60.61) | 966 (64.81) | 613 (57.53) | 765 (58.66) | 857 (65.13) | |||
| Other | 623 (36.72) | 456 (39.39) | 602 (35.19) | 454 (42.47) | 614 (41.34) | 453 (34.87) | |||
| PIR | <0.001 | <0.001 | 0.062 | ||||||
| <1.85 | 510 (26.10) | 506 (40.62) | 490 (23.42) | 487 (43.44) | 557 (31.82) | 473 (32.52) | |||
| ≥1.85 | 790 (73.90) | 530 (59.38) | 905 (76.58) | 438 (56.56) | 691 (68.18) | 682 (67.48) | |||
| Current smoker, % | 277 (17.18) | 195 (18.83) | 0.209 | 208 (13.38) | 244 (23.25) | <0.001 | 364 (23.80) | 129 (11.08) | <0.001 |
| Current drinker, % | 1019 (78.25) | 754 (72.42) | 0.035 | 1076 (77.61) | 725 (76.56) | 0.658 | 984 (78.72) | 818 (71.20) | 0.007 |
| Recommended physical activity, % | 354 (29.46) | 272 (25.85) | 0.363 | 422 (31.85) | 222 (21.30) | 0.002 | 285 (22.97) | 360 (32.69) | 0.003 |
| MAFLD, % | 815 (51.37) | 692 (56.69) | 0.250 | 892 (50.00) | 599 (57.08) | 0.013 | 782 (55.38) | 719 (49.77) | 0.033 |
| CAP, dB/m | 261.69 ± 3.34 | 266.54 ± 2.46 | 0.549 | 260.39 ± 3.44 | 266.97 ± 3.04 | 0.317 | 265.29 ± 2.42 | 257.29 ± 3.12 | 0.185 |
| Dietary intake | |||||||||
| Total energy, kcal/d | 2013 ± 20 | 1955 ± 16 | 0.063 | 1951 ± 17 | 2048 ± 23 | 0.002 | 2094 ± 17 | 1881 ± 22 | <0.001 |
| Total carbohydrate, % of total energy intake | 45.38 ± 0.19 | 54.46 ± 0.18 | <0.001 | 46.5 ± 0.24 | 53.22 ± 0.20 | <0.001 | 47.49 ± 0.23 | 52.17 ± 0.20 | <0.001 |
| High-quality carbo hydrate | 7.39 ± 0.21 | 11.00 ± 0.24 | <0.001 | 9.93 ± 0.26 | 7.15 ± 0.21 | <0.001 | 5.30 ± 0.15 | 13.89 ± 0.23 | <0.001 |
| Low-quality carbo hydrate | 37.98 ± 0.29 | 43.47 ± 0.35 | <0.001 | 36.57 ± 0.18 | 46.07 ± 0.36 | <0.001 | 42.19 ± 0.34 | 38.29 ± 0.26 | <0.001 |
| Total fat, % of total energy intake | 37.92 ± 0.09 | 29.14 ± 0.10 | <0.001 | 36.95 ± 0.15 | 30.43 ± 0.13 | <0.001 | 36.19 ± 0.13 | 31.26 ± 0.20 | <0.001 |
| Unsaturated fat | 24.30 ± 0.11 | 18.81 ± 0.08 | <0.001 | 24.08 ± 0.11 | 19.11 ± 0.08 | <0.001 | 22.71 ± 0.1 | 20.74 ± 0.15 | <0.001 |
| Saturated fat | 13.62 ± 0.10 | 10.33 ± 0.05 | <0.001 | 12.87 ± 0.10 | 11.31 ± 0.07 | <0.001 | 13.48 ± 0.07 | 10.53 ± 0.06 | <0.001 |
| Total protein, % of total energy intake | 16.71 ± 0.12 | 16.40 ± 0.11 | 0.046 | 16.55 ± 0.14 | 16.35 ± 0.13 | 0.338 | 16.31 ± 0.13 | 16.56 ± 0.08 | 0.149 |
| Plant protein | 5.23 ± 0.05 | 5.53 ± 0.05 | 0.002 | 5.54 ± 0.05 | 5.06 ± 0.04 | <0.001 | 4.73 ± 0.02 | 6.17 ± 0.03 | <0.001 |
| Animal protein | 11.47 ± 0.13 | 10.86 ± 0.1 | 0.005 | 11.01 ± 0.13 | 11.29 ± 0.1 | 0.170 | 11.58 ± 0.11 | 10.39 ± 0.08 | <0.001 |
| Tertiles of Diet Scores | p for Trend | Per Five-Point Increase | |||
|---|---|---|---|---|---|
| Tertile1 | Tertile2 | Tertile3 | |||
| Overall LCD score | 7 (4–9) | 16 (13–17) | 24 (21–27) | ||
| Median score (IQR) | |||||
| Cases/participants, n/n | 783/1429 | 726/1275 | 727/1257 | ||
| Model 1 | Reference | 0.93 (0.68, 1.28) | 0.87 (0.66, 1.15) | 0.302 | 0.95 (0.88, 1.02) |
| Model 2 | Reference | 0.91 (0.67, 1.25) | 0.90 (0.66, 1.23) | 0.484 | 0.95 (0.87, 1.04) |
| Unhealthy LCD score | |||||
| Median score (IQR) | 8 (5–11) | 16 (14–17) | 22 (20–24) | ||
| Cases/participants, n/n | 787/1423 | 720/1268 | 729/1270 | ||
| Model 1 | Reference | 1.27 (1.05, 1.54) | 1.34 (1.02, 1.75) | 0.035 | 1.09 (1.00, 1.18) |
| Model 2 | Reference | 1.21 (0.93, 1.57) | 1.38 (0.98, 1.94) | 0.063 | 1.11 (0.99, 1.24) |
| Healthy LCD score | |||||
| Median score (IQR) | 9 (6–11) | 15 (14–17) | 22 (20–24) | ||
| Cases/participants, n/n | 811/1476 | 711/1208 | 714/1277 | ||
| Model 1 | Reference | 0.85 (0.66, 1.09) | 0.63 (0.48, 0.84) | 0.004 | 0.85 (0.79, 0.92) |
| Model 2 | Reference | 0.80 (0.59, 1.07) | 0.63 (0.45, 0.89) | 0.013 | 0.85 (0.77, 0.93) |
| Overall LFD score | |||||
| Median score (IQR) | 9 (7–11) | 15 (14–17) | 21 (20–23) | ||
| Cases/participants, n/n | 815/1449 | 729/1306 | 692/1206 | ||
| Model 1 | Reference | 1.19 (0.92, 1.55) | 1.25 (0.93, 1.68) | 0.117 | 1.07 (0.97, 1.19) |
| Model 2 | Reference | 1.24 (0.91, 1.69) | 1.30 (0.88, 1.93) | 0.161 | 1.10 (0.96, 1.25) |
| Unhealthy LFD score | |||||
| Median score (IQR) | 10 (8–12) | 16 (15–17) | 21 (20–23) | ||
| Cases/participants, n/n | 892/1569 | 745/1323 | 599/1069 | ||
| Model 1 | Reference | 1.45 (1.20, 1.75) | 1.66 (1.23, 2.24) | 0.001 | 1.24 (1.10, 1.41) |
| Model 2 | Reference | 1.49 (1.17, 1.90) | 1.77 (1.19, 2.63) | 0.004 | 1.27 (1.08, 1.49) |
| Healthy LFD score | |||||
| Median score (IQR) | 8 (5–10) | 15 (13–17) | 23 (21–26) | ||
| Cases/participants, n/n | 782/1380 | 735/1270 | 719/1311 | ||
| Model 1 | Reference | 0.90 (0.74, 1.08) | 0.64 (0.51, 0.80) | 0.001 | 0.89 (0.82, 0.95) |
| Model 2 | Reference | 0.89 (0.71, 1.12) | 0.64 (0.48, 0.86) | 0.008 | 0.89 (0.81, 0.99) |
Disclaimer/Publisher’s Note: The statements, opinions and data contained in all publications are solely those of the individual author(s) and contributor(s) and not of MDPI and/or the editor(s). MDPI and/or the editor(s) disclaim responsibility for any injury to people or property resulting from any ideas, methods, instructions or products referred to in the content. |
© 2023 by the authors. Licensee MDPI, Basel, Switzerland. This article is an open access article distributed under the terms and conditions of the Creative Commons Attribution (CC BY) license (https://creativecommons.org/licenses/by/4.0/).
Share and Cite
Hu, C.; Huang, R.; Li, R.; Ning, N.; He, Y.; Zhang, J.; Wang, Y.; Ma, Y.; Jin, L. Low-Carbohydrate and Low-Fat Diet with Metabolic-Dysfunction-Associated Fatty Liver Disease. Nutrients 2023, 15, 4763. https://doi.org/10.3390/nu15224763
Hu C, Huang R, Li R, Ning N, He Y, Zhang J, Wang Y, Ma Y, Jin L. Low-Carbohydrate and Low-Fat Diet with Metabolic-Dysfunction-Associated Fatty Liver Disease. Nutrients. 2023; 15(22):4763. https://doi.org/10.3390/nu15224763
Chicago/Turabian StyleHu, Chengxiang, Rong Huang, Runhong Li, Ning Ning, Yue He, Jiaqi Zhang, Yingxin Wang, Yanan Ma, and Lina Jin. 2023. "Low-Carbohydrate and Low-Fat Diet with Metabolic-Dysfunction-Associated Fatty Liver Disease" Nutrients 15, no. 22: 4763. https://doi.org/10.3390/nu15224763
APA StyleHu, C., Huang, R., Li, R., Ning, N., He, Y., Zhang, J., Wang, Y., Ma, Y., & Jin, L. (2023). Low-Carbohydrate and Low-Fat Diet with Metabolic-Dysfunction-Associated Fatty Liver Disease. Nutrients, 15(22), 4763. https://doi.org/10.3390/nu15224763