
Effects of an Individualized vs. Standardized Vitamin D Supplementation on the 25(OH)D Level in Athletes


Abstract
:1. Introduction
2. Materials and Methods
2.1. Participants
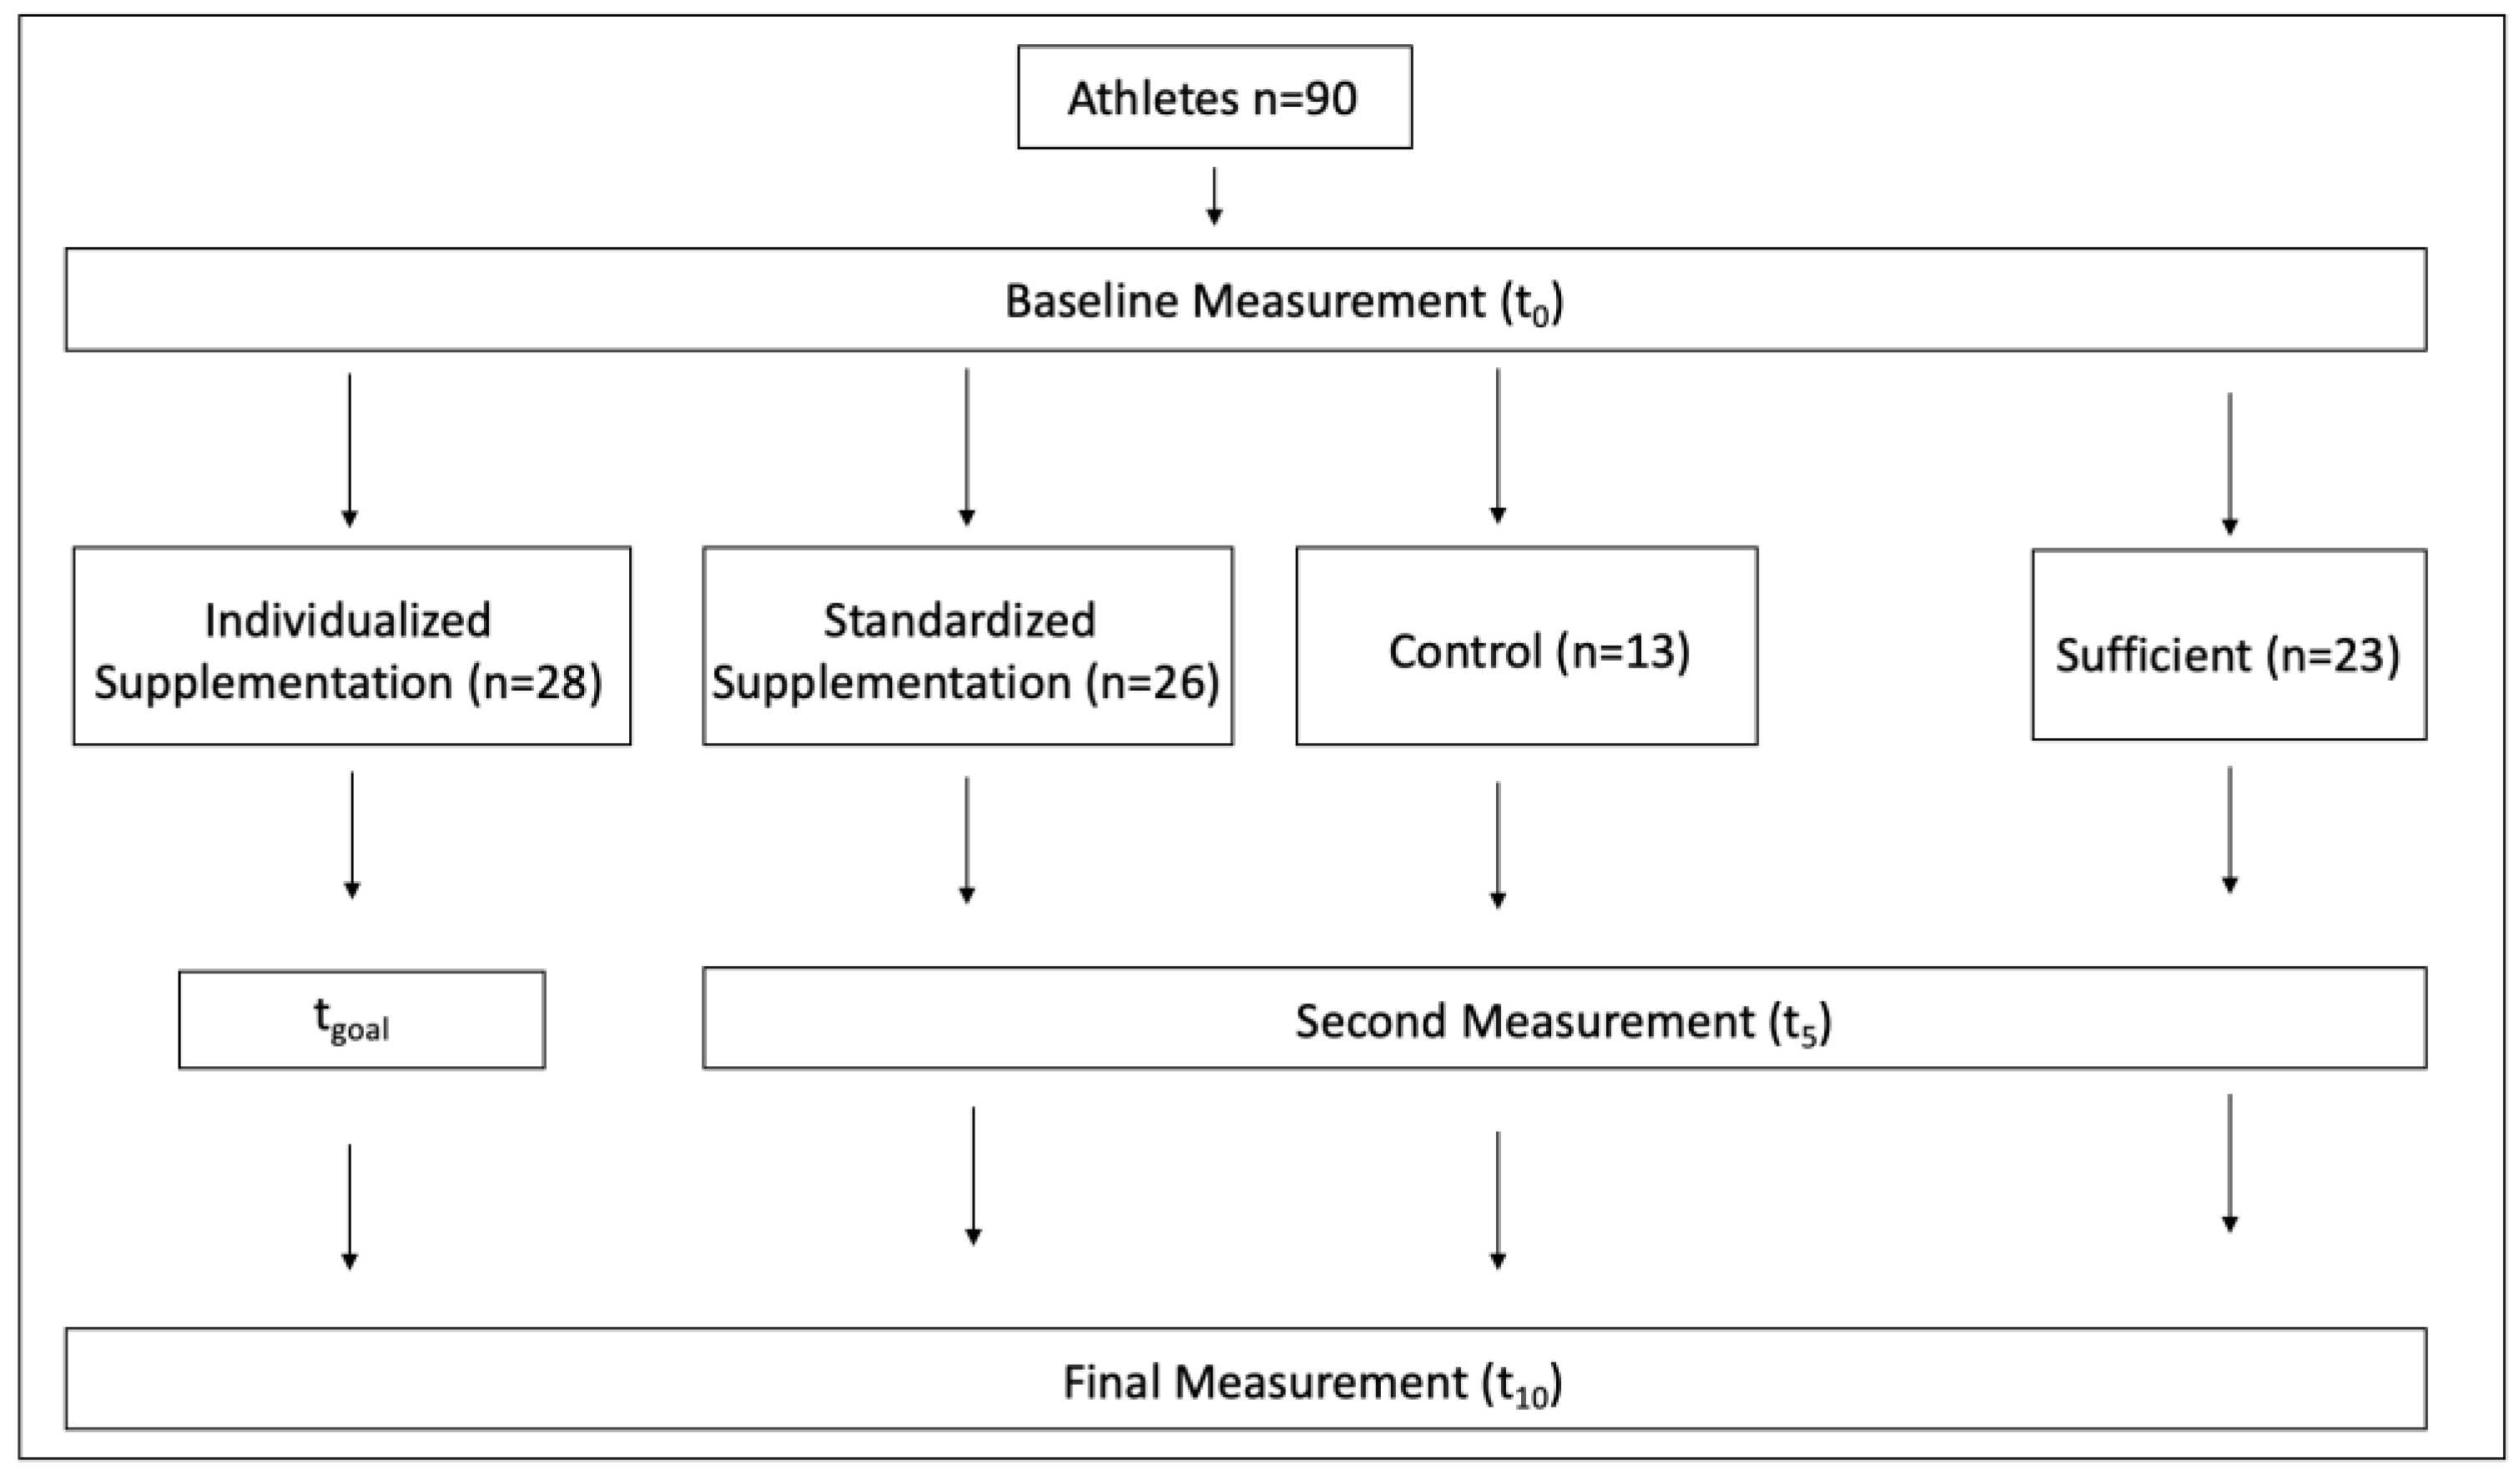
2.2. Study Design
2.3. Analytical Parameters
2.4. Questionnaire
2.5. Statistical Analysis
3. Results
4. Discussion
5. Conclusions
Author Contributions
Funding
Institutional Review Board Statement
Informed Consent Statement
Data Availability Statement
Acknowledgments
Conflicts of Interest
References
- Wang, T.-T.; Tavera-Mendoza, L.E.; Laperriere, D.; Libby, E.; MacLeod, N.B.; Nagai, Y.; Bourdeau, V.; Konstorum, A.; Lallemant, B.; Zhang, R.; et al. Large-scale in silico and microarray-based identification of direct 1,25-dihydroxyvitamin D3 target genes. Mol. Endocrinol. 2005, 19, 2685–2695. [Google Scholar] [CrossRef]
- Owens, D.J.; Allison, R.; Close, G.L. Vitamin D and the Athlete: Current Perspectives and New Challenges. Sports Med. 2018, 48, 3–16. [Google Scholar] [CrossRef] [PubMed]
- Charoenngam, N.; Shirvani, A.; Holick, M.F. Vitamin D for skeletal and non-skeletal health: What we should know. J. Clin. Orthop. Trauma 2019, 10, 1082–1093. [Google Scholar] [CrossRef] [PubMed]
- Charoenngam, N.; Holick, M.F. Immunologic Effects of Vitamin D on Human Health and Disease. Nutrients 2020, 12, 2097. [Google Scholar] [CrossRef] [PubMed]
- Goussetis, E.; Spiropoulos, A.; Tsironi, M.; Skenderi, K.; Margeli, A.; Graphakos, S.; Baltopoulos, P.; Papassotiriou, I. Spartathlon, a 246 kilometer foot race: Effects of acute inflammation induced by prolonged exercise on circulating progenitor reparative cells. Blood Cells Mol. Dis. 2009, 42, 294–299. [Google Scholar] [CrossRef]
- Lippi, G.; Schena, F.; Salvagno, G.L.; Montagnana, M.; Gelati, M.; Tarperi, C.; Banfi, G.; Guidi, G.C. Acute variation of biochemical markers of muscle damage following a 21-km, half-marathon run. Scand. J. Clin. Lab. Investig. 2008, 68, 667–672. [Google Scholar] [CrossRef]
- McAnulty, S.R.; McAnulty, L.S.; Nieman, D.C.; Morrow, J.D.; Utter, A.C.; Dumke, C.L. Effect of resistance exercise and carbohydrate ingestion on oxidative stress. Free Radic. Res. 2005, 39, 1219–1224. [Google Scholar] [CrossRef]
- McBride, J.M.; Kraemer, W.J.; Triplett-McBride, T.; Sebastianelli, W. Effect of resistance exercise on free radical production. Med. Sci. Sports Exerc. 1998, 30, 67–72. [Google Scholar] [CrossRef]
- Ostrowski, K.; Schjerling, P.; Pedersen, B.K. Physical activity and plasma interleukin-6 in humans—Effect of intensity of exercise. Eur. J. Appl. Physiol. 2000, 83, 512–515. [Google Scholar] [CrossRef]
- Barker, T.; Martins, T.B.; Hill, H.R.; Kjeldsberg, C.R.; Dixon, B.M.; Schneider, E.D.; Henriksen, V.T.; Weaver, L.K. Circulating pro-inflammatory cytokines are elevated and peak power output correlates with 25-hydroxyvitamin D in vitamin D insufficient adults. Eur. J. Appl. Physiol. 2013, 113, 1523–1534. [Google Scholar] [CrossRef]
- Nash, D.; Hughes, M.G.; Butcher, L.; Aicheler, R.; Smith, P.; Cullen, T.; Webb, R. IL-6 signaling in acute exercise and chronic training: Potential consequences for health and athletic performance. Scand. J. Med. Sci. Sports 2023, 33, 4–19. [Google Scholar] [CrossRef]
- Girgis, C.M.; Clifton-Bligh, R.J.; Hamrick, M.W.; Holick, M.F.; Gunton, J.E. The Roles of Vitamin D in Skeletal Muscle: Form, Function, and Metabolism. Endocr. Rev. 2013, 34, 33–83. [Google Scholar] [CrossRef] [PubMed]
- Girgis, C.M.; Mokbel, N.; Cha, K.M.; Houweling, P.J.; Abboud, M.; Fraser, D.R.; Mason, R.S.; Clifton-Bligh, R.J.; Gunton, J.E. The vitamin D receptor (VDR) is expressed in skeletal muscle of male mice and modulates 25-hydroxyvitamin D (25OHD) uptake in myofibers. Endocrinology 2014, 155, 3227–3237. [Google Scholar] [CrossRef]
- Close, G.L.; Leckey, J.; Patterson, M.; Bradley, W.; Owens, D.J.; Fraser, W.D.; Morton, J.P. The effects of vitamin D(3) supplementation on serum total 25[OH]D concentration and physical performance: A randomised dose-response study. Br. J. Sports Med. 2013, 47, 692–696. [Google Scholar] [CrossRef]
- Larson-Meyer, E. Vitamin D Supplementation in Athletes. In Nestlé Nutrition Institute Workshop Series; Tipton, K.D., van Loon, L.J.C., Eds.; S.Karger AG: Basel, Switzerland, 2013; Volume 75, pp. 109–121. ISBN 978-3-318-02332-9. [Google Scholar]
- Ogan, D.; Pritchett, K. Vitamin D and the Athlete: Risks, Recommendations, and Benefits. Nutrients 2013, 5, 1856–1868. [Google Scholar] [CrossRef] [PubMed]
- Cannell, J.J.; Hollis, B.W.; Sorenson, M.B.; Taft, T.N.; Anderson, J.J.B. Athletic performance and vitamin D. Med. Sci. Sports Exerc. 2009, 41, 1102–1110. [Google Scholar] [CrossRef]
- de la Puente Yagüe, M.; Collado Yurrita, L.; Ciudad Cabañas, M.J.; Cuadrado Cenzual, M.A. Role of Vitamin D in Athletes and Their Performance: Current Concepts and New Trends. Nutrients 2020, 12, 579. [Google Scholar] [CrossRef]
- Farrokhyar, F.; Tabasinejad, R.; Dao, D.; Peterson, D.; Ayeni, O.R.; Hadioonzadeh, R.; Bhandari, M. Prevalence of vitamin D inadequacy in athletes: A systematic-review and meta-analysis. Sports Med. 2015, 45, 365–378. [Google Scholar] [CrossRef]
- Ip, T.S.-T.; Fu, S.-C.; Ong, M.T.-Y.; Yung, P.S.-H. Vitamin D deficiency in athletes: Laboratory, clinical and field integration. Asia Pac. J. Sports Med. Arthrosc. Rehabil. Technol. 2022, 29, 22–29. [Google Scholar] [CrossRef]
- Constantini, N.W.; Arieli, R.; Chodick, G.; Dubnov-Raz, G. High prevalence of vitamin D insufficiency in athletes and dancers. Clin. J. Sport. Med. 2010, 20, 368–371. [Google Scholar] [CrossRef]
- Halliday, T.M.; Peterson, N.J.; Thomas, J.J.; Kleppinger, K.; Hollis, B.W.; Larson-Meyer, D.E. Vitamin D status relative to diet, lifestyle, injury, and illness in college athletes. Med. Sci. Sports Exerc. 2011, 43, 335–343. [Google Scholar] [CrossRef]
- Hamilton, B.; Grantham, J.; Racinais, S.; Chalabi, H. Vitamin D deficiency is endemic in Middle Eastern sportsmen. Public. Health Nutr. 2010, 13, 1528–1534. [Google Scholar] [CrossRef] [PubMed]
- Spiro, A.; Buttriss, J.L. Vitamin D: An overview of vitamin D status and intake in Europe. Nutr. Bull. 2014, 39, 322–350. [Google Scholar] [CrossRef]
- Ribbans, W.J.; Aujla, R.; Dalton, S.; Nunley, J.A. Vitamin D and the athlete–patient: State of the art. J. ISAKOS 2021, 6, 46–60. [Google Scholar] [CrossRef] [PubMed]
- Holick, M.F.; Binkley, N.C.; Bischoff-Ferrari, H.A.; Gordon, C.M.; Hanley, D.A.; Heaney, R.P.; Murad, M.H.; Weaver, C.M. Endocrine Society Evaluation, treatment, and prevention of vitamin D deficiency: An Endocrine Society clinical practice guideline. J. Clin. Endocrinol. Metab. 2011, 96, 1911–1930. [Google Scholar] [CrossRef] [PubMed]
- Barger-Lux, M.J.; Heaney, R.P.; Dowell, S.; Chen, T.C.; Holick, M.F. Vitamin D and its major metabolites: Serum levels after graded oral dosing in healthy men. Osteoporos. Int. 1998, 8, 222–230. [Google Scholar] [CrossRef] [PubMed]
- EFSA Panel on Dietetic Products, Nutrition and Allergies (NDA). Opinion on the Tolerable Upper Intake Level of vitamin D. EFSA J. 2012, 10, 2813. [Google Scholar] [CrossRef]
- van Groningen, L.; Opdenoordt, S.; van Sorge, A.; Telting, D.; Giesen, A.; Boer, H. de Cholecalciferol loading dose guideline for vitamin D-deficient adults. Eur. J. Endocrinol. 2010, 162, 805–811. [Google Scholar] [CrossRef]
- Tuma, C.; Thomas, A.; Braun, H.; Thevis, M. Quantification of 25-hydroxyvitamin D2 and D3 in Mitra® devices with volumetric absorptive microsampling technology (VAMS®) by UHPLC-HRMS for regular vitamin D status monitoring. J. Pharm. Biomed. Anal. 2023, 228, 115314. [Google Scholar] [CrossRef]
- Larson-Meyer, D.E.; Douglas, C.S.; Thomas, J.J.; Johnson, E.C.; Barcal, J.N.; Heller, J.E.; Hollis, B.W.; Halliday, T.M. Validation of a Vitamin D Specific Questionnaire to Determine Vitamin D Status in Athletes. Nutrients 2019, 11, 2732. [Google Scholar] [CrossRef]
- Fitzpatrick, T.B. The validity and practicality of sun-reactive skin types I through VI. Arch. Dermatol. 1988, 124, 869–871. [Google Scholar] [CrossRef] [PubMed]
- Faul, F.; Erdfelder, E.; Lang, A.-G.; Buchner, A. G*Power 3: A flexible statistical power analysis program for the social, behavioral, and biomedical sciences. Behav. Res. Methods 2007, 39, 175–191. [Google Scholar] [CrossRef] [PubMed]
- Backx, E.M.P.; Tieland, M.; Maase, K.; Kies, A.K.; Mensink, M.; van Loon, L.J.C.; de Groot, L.C.P.G.M. The impact of 1-year vitamin D supplementation on vitamin D status in athletes: A dose–response study. Eur. J. Clin. Nutr. 2016, 70, 1009–1014. [Google Scholar] [CrossRef]
- Lee, P.; Greenfield, J.R.; Seibel, M.J.; Eisman, J.A.; Center, J.R. Adequacy of vitamin D replacement in severe deficiency is dependent on body mass index. Am. J. Med. 2009, 122, 1056–1060. [Google Scholar] [CrossRef]
- Wortsman, J.; Matsuoka, L.Y.; Chen, T.C.; Lu, Z.; Holick, M.F. Decreased bioavailability of vitamin D in obesity. Am. J. Clin. Nutr. 2000, 72, 690–693. [Google Scholar] [CrossRef]
- Arabi, S.M.; Sedaghat, A.; Ehsaei, M.R.; Safarian, M.; Ranjbar, G.; Rezaee, H.; Rezvani, R.; Tabesh, H.; Norouzy, A. Efficacy of high-dose versus low-dose vitamin D supplementation on serum levels of inflammatory factors and mortality rate in severe traumatic brain injury patients: Study protocol for a randomized placebo-controlled trial. Trials 2020, 21, 685. [Google Scholar] [CrossRef] [PubMed]
- Mazess, R.B.; Bischoff-Ferrari, H.A.; Dawson-Hughes, B. Vitamin D: Bolus Is Bogus-A Narrative Review. JBMR Plus 2021, 5, e10567. [Google Scholar] [CrossRef]
- Hewison, M. Vitamin D and the immune system: New perspectives on an old theme. Endocrinol. Metab. Clin. N. Am. 2010, 39, 365–379. [Google Scholar] [CrossRef]
- Hollis, B.W.; Wagner, C.L. Clinical review: The role of the parent compound vitamin D with respect to metabolism and function: Why clinical dose intervals can affect clinical outcomes. J. Clin. Endocrinol. Metab. 2013, 98, 4619–4628. [Google Scholar] [CrossRef]
- Ketha, H.; Thacher, T.D.; Oberhelman, S.S.; Fischer, P.R.; Singh, R.J.; Kumar, R. Comparison of the Effect of Daily Versus Bolus Dose Maternal Vitamin D3 Supplementation on the 24,25-dihydroxyvitamin D3 to 25-hydroxyvitamin D3 Ratio. Bone 2018, 110, 321–325. [Google Scholar] [CrossRef]
- Hamilton, B.; Whiteley, R.; Farooq, A.; Chalabi, H. Vitamin D concentration in 342 professional football players and association with lower limb isokinetic function. J. Sci. Med. Sport. 2014, 17, 139–143. [Google Scholar] [CrossRef] [PubMed]
- Koundourakis, N.E.; Androulakis, N.E.; Malliaraki, N.; Margioris, A.N. Vitamin D and Exercise Performance in Professional Soccer Players. PLoS ONE 2014, 9, e101659. [Google Scholar] [CrossRef] [PubMed]
- Książek, A.; Dziubek, W.; Pietraszewska, J.; Słowińska-Lisowska, M. Relationship between 25(OH)D levels and athletic performance in elite Polish judoists. Biol. Sport. 2018, 35, 191–196. [Google Scholar] [CrossRef] [PubMed]
- Seo, M.-W.; Song, J.K.; Jung, H.C.; Kim, S.-W.; Kim, J.-H.; Lee, J.-M. The Associations of Vitamin D Status with Athletic Performance and Blood-borne Markers in Adolescent Athletes: A Cross-Sectional Study. Int. J. Environ. Res. Public Health 2019, 16, 3422. [Google Scholar] [CrossRef]
- Forney, L.A.; Earnest, C.P.; Henagan, T.M.; Johnson, L.E.; Castleberry, T.J.; Stewart, L.K. Vitamin D status, body composition, and fitness measures in college-aged students. J. Strength. Cond. Res. 2014, 28, 814–824. [Google Scholar] [CrossRef]
- Jastrzębska, M.; Kaczmarczyk, M.; Michalczyk, M.; Radzimiński, Ł.; Stępień, P.; Jastrzębska, J.; Wakuluk, D.; Suárez, A.D.; López Sánchez, G.F.; Cięszczyk, P.; et al. Can Supplementation of Vitamin D Improve Aerobic Capacity in Well Trained Youth Soccer Players? J. Hum. Kinet. 2018, 61, 63–72. [Google Scholar] [CrossRef]
- Koundourakis, N.E.; Androulakis, N.E.; Malliaraki, N.; Tsatsanis, C.; Venihaki, M.; Margioris, A.N. Discrepancy between exercise performance, body composition, and sex steroid response after a six-week detraining period in professional soccer players. PLoS ONE 2014, 9, e87803. [Google Scholar] [CrossRef]
- Zeitler, C.; Fritz, R.; Smekal, G.; Ekmekcioglu, C. Association Between the 25-Hydroxyvitamin D Status and Physical Performance in Healthy Recreational Athletes. Int. J. Environ. Res. Public. Health 2018, 15, 2724. [Google Scholar] [CrossRef]
- Rebolledo, B.J.; Bernard, J.A.; Werner, B.C.; Finlay, A.K.; Nwachukwu, B.U.; Dare, D.M.; Warren, R.F.; Rodeo, S.A. The Association of Vitamin D Status in Lower Extremity Muscle Strains and Core Muscle Injuries at the National Football League Combine. Arthrosc. J. Arthrosc. Relat. Surg. 2018, 34, 1280–1285. [Google Scholar] [CrossRef]
- Yoon, S.; Kwon, O.; Kim, J. Vitamin D in athletes: Focus on physical performance and musculoskeletal injuries. Phys. Act. Nutr. 2021, 25, 20–25. [Google Scholar] [CrossRef]
- Knechtle, B.; Jastrzębski, Z.; Hill, L.; Nikolaidis, P.T. Vitamin D and Stress Fractures in Sport: Preventive and Therapeutic Measures-A Narrative Review. Medicina 2021, 57, 223. [Google Scholar] [CrossRef] [PubMed]
- Millward, D.; Root, A.D.; Dubois, J.; Cohen, R.P.; Valdivia, L.; Helming, B.; Kokoskie, J.; Waterbrook, A.L.; Paul, S. Association of Serum Vitamin D Levels and Stress Fractures in Collegiate Athletes. Orthop. J. Sports Med. 2020, 8, 2325967120966967. [Google Scholar] [CrossRef] [PubMed]
- Şenışık, S.; Köyağasıoğlu, O.; Denerel, N. Vitamin D levels on sports injuries in outdoor and indoor athletes: A cross-sectional study. Phys. Sport. 2022, 50, 164–170. [Google Scholar] [CrossRef] [PubMed]
- Mieszkowski, J.; Borkowska, A.; Stankiewicz, B.; Kochanowicz, A.; Niespodziński, B.; Surmiak, M.; Waldziński, T.; Rola, R.; Petr, M.; Antosiewicz, J. Single High-Dose Vitamin D Supplementation as an Approach for Reducing Ultramarathon-Induced Inflammation: A Double-Blind Randomized Controlled Trial. Nutrients 2021, 13, 1280. [Google Scholar] [CrossRef] [PubMed]
- Van Uytfanghe, K.; Heughebaert, L.; Stove, C.P. Self-sampling at home using volumetric absorptive microsampling: Coupling analytical evaluation to volunteers’ perception in the context of a large scale study. Clin. Chem. Lab. Med. (CCLM) 2021, 59, e185–e187. [Google Scholar] [CrossRef]
- Denniff, P.; Spooner, N. Volumetric Absorptive Microsampling: A Dried Sample Collection Technique for Quantitative Bioanalysis. Anal. Chem. 2014, 86, 8489–8495. [Google Scholar] [CrossRef]
- De Kesel, P.M.; Sadones, N.; Capiau, S.; Lambert, W.E.; Stove, C.P. Hemato-critical issues in quantitative analysis of dried blood spots: Challenges and solutions. Bioanalysis 2013, 5, 2023–2041. [Google Scholar] [CrossRef] [PubMed]
- De Kesel, P.M.M.; Lambert, W.E.; Stove, C.P. Does volumetric absorptive microsampling eliminate the hematocrit bias for caffeine and paraxanthine in dried blood samples? A comparative study. Anal. Chim. Acta 2015, 881, 65–73. [Google Scholar] [CrossRef]
- Denniff, P.; Spooner, N. The effect of hematocrit on assay bias when using DBS samples for the quantitative bioanalysis of drugs. Bioanalysis 2010, 2, 1385–1395. [Google Scholar] [CrossRef]
- Jensen, B.P.; Saraf, R.; Ma, J.; Berry, S.; Grant, C.C.; Camargo, C.A.; Sies, C.W. Quantitation of 25-hydroxyvitamin D in dried blood spots by 2D LC-MS/MS without derivatization and correlation with serum in adult and pediatric studies. Clin. Chim. Acta 2018, 481, 61–68. [Google Scholar] [CrossRef]
- Newman, M.S.; Brandon, T.R.; Groves, M.N.; Gregory, W.L.; Kapur, S.; Zava, D.T. A Liquid Chromatography/Tandem Mass Spectrometry Method for Determination of 25-Hydroxy Vitamin D 2 and 25-Hydroxy Vitamin D 3 in Dried Blood Spots: A Potential Adjunct to Diabetes and Cardiometabolic Risk Screening. J. Diabetes Sci. Technol. 2009, 3, 156–162. [Google Scholar] [CrossRef] [PubMed]
- Ackermans, M.T.; de Kleijne, V.; Martens, F.; Heijboer, A.C. Hematocrit and standardization in DBS analysis: A practical approach for hormones mainly present in the plasma fraction. Clin. Chim. Acta 2021, 520, 179–185. [Google Scholar] [CrossRef] [PubMed]
- Chen, P.-Z.; Li, M.; Duan, X.-H.; Jia, J.-Y.; Li, J.-Q.; Chu, R.-A.; Yu, C.; Han, J.-H.; Wang, H. Pharmacokinetics and effects of demographic factors on blood 25(OH)D3 levels after a single orally administered high dose of vitamin D3. Acta Pharmacol. Sin. 2016, 37, 1509–1515. [Google Scholar] [CrossRef] [PubMed]

| INDV (n = 28) | STAD (n = 26) | CON (n = 13) | SUF (n = 23) | |
|---|---|---|---|---|
| Age (years) | 25 (±5) | 25 (±6) | 26 (±4) | 26 (±5) |
| Sex (M/F) | 14/14 | 14/12 | 6/7 | 8/15 |
| Height (cm) | 176 (±9) | 174 (±9) | 175 (±12) | 176 (±9) |
| Weight (kg) | 74 (±11) | 72 (±10) | 71 (±13) | 68 (±11) |
| Indoor/ Outdoor sport | 23/5 | 18/8 | 6/7 | 10/13 |
| Skin type after Fitzpatrick (2/3/4) | 10/15/3 | 6/17/3 | 2/9/2 | 6/14/3 |
| Training volume per week (h) | 6.4 (±3.9) | 7.3 (±4.4) | 8.8 (±4.0) | 8.0 (±4.1) |
| Competitions per month | 0.6 (±1.9) | 0.6 (±2.0) | 0.2 (±0.6) | 1.0 (±2.2) |
| Average nutritive vitamin D intake (μg/day) | 3.5 (±2.5) | 3.8 (±2.6) | 4.1 (±2.3) | 3.3 (±1.6) |
| INDV (n = 28) | STAD (n = 26) | CON (n = 13) | SUF (n = 23) | |
|---|---|---|---|---|
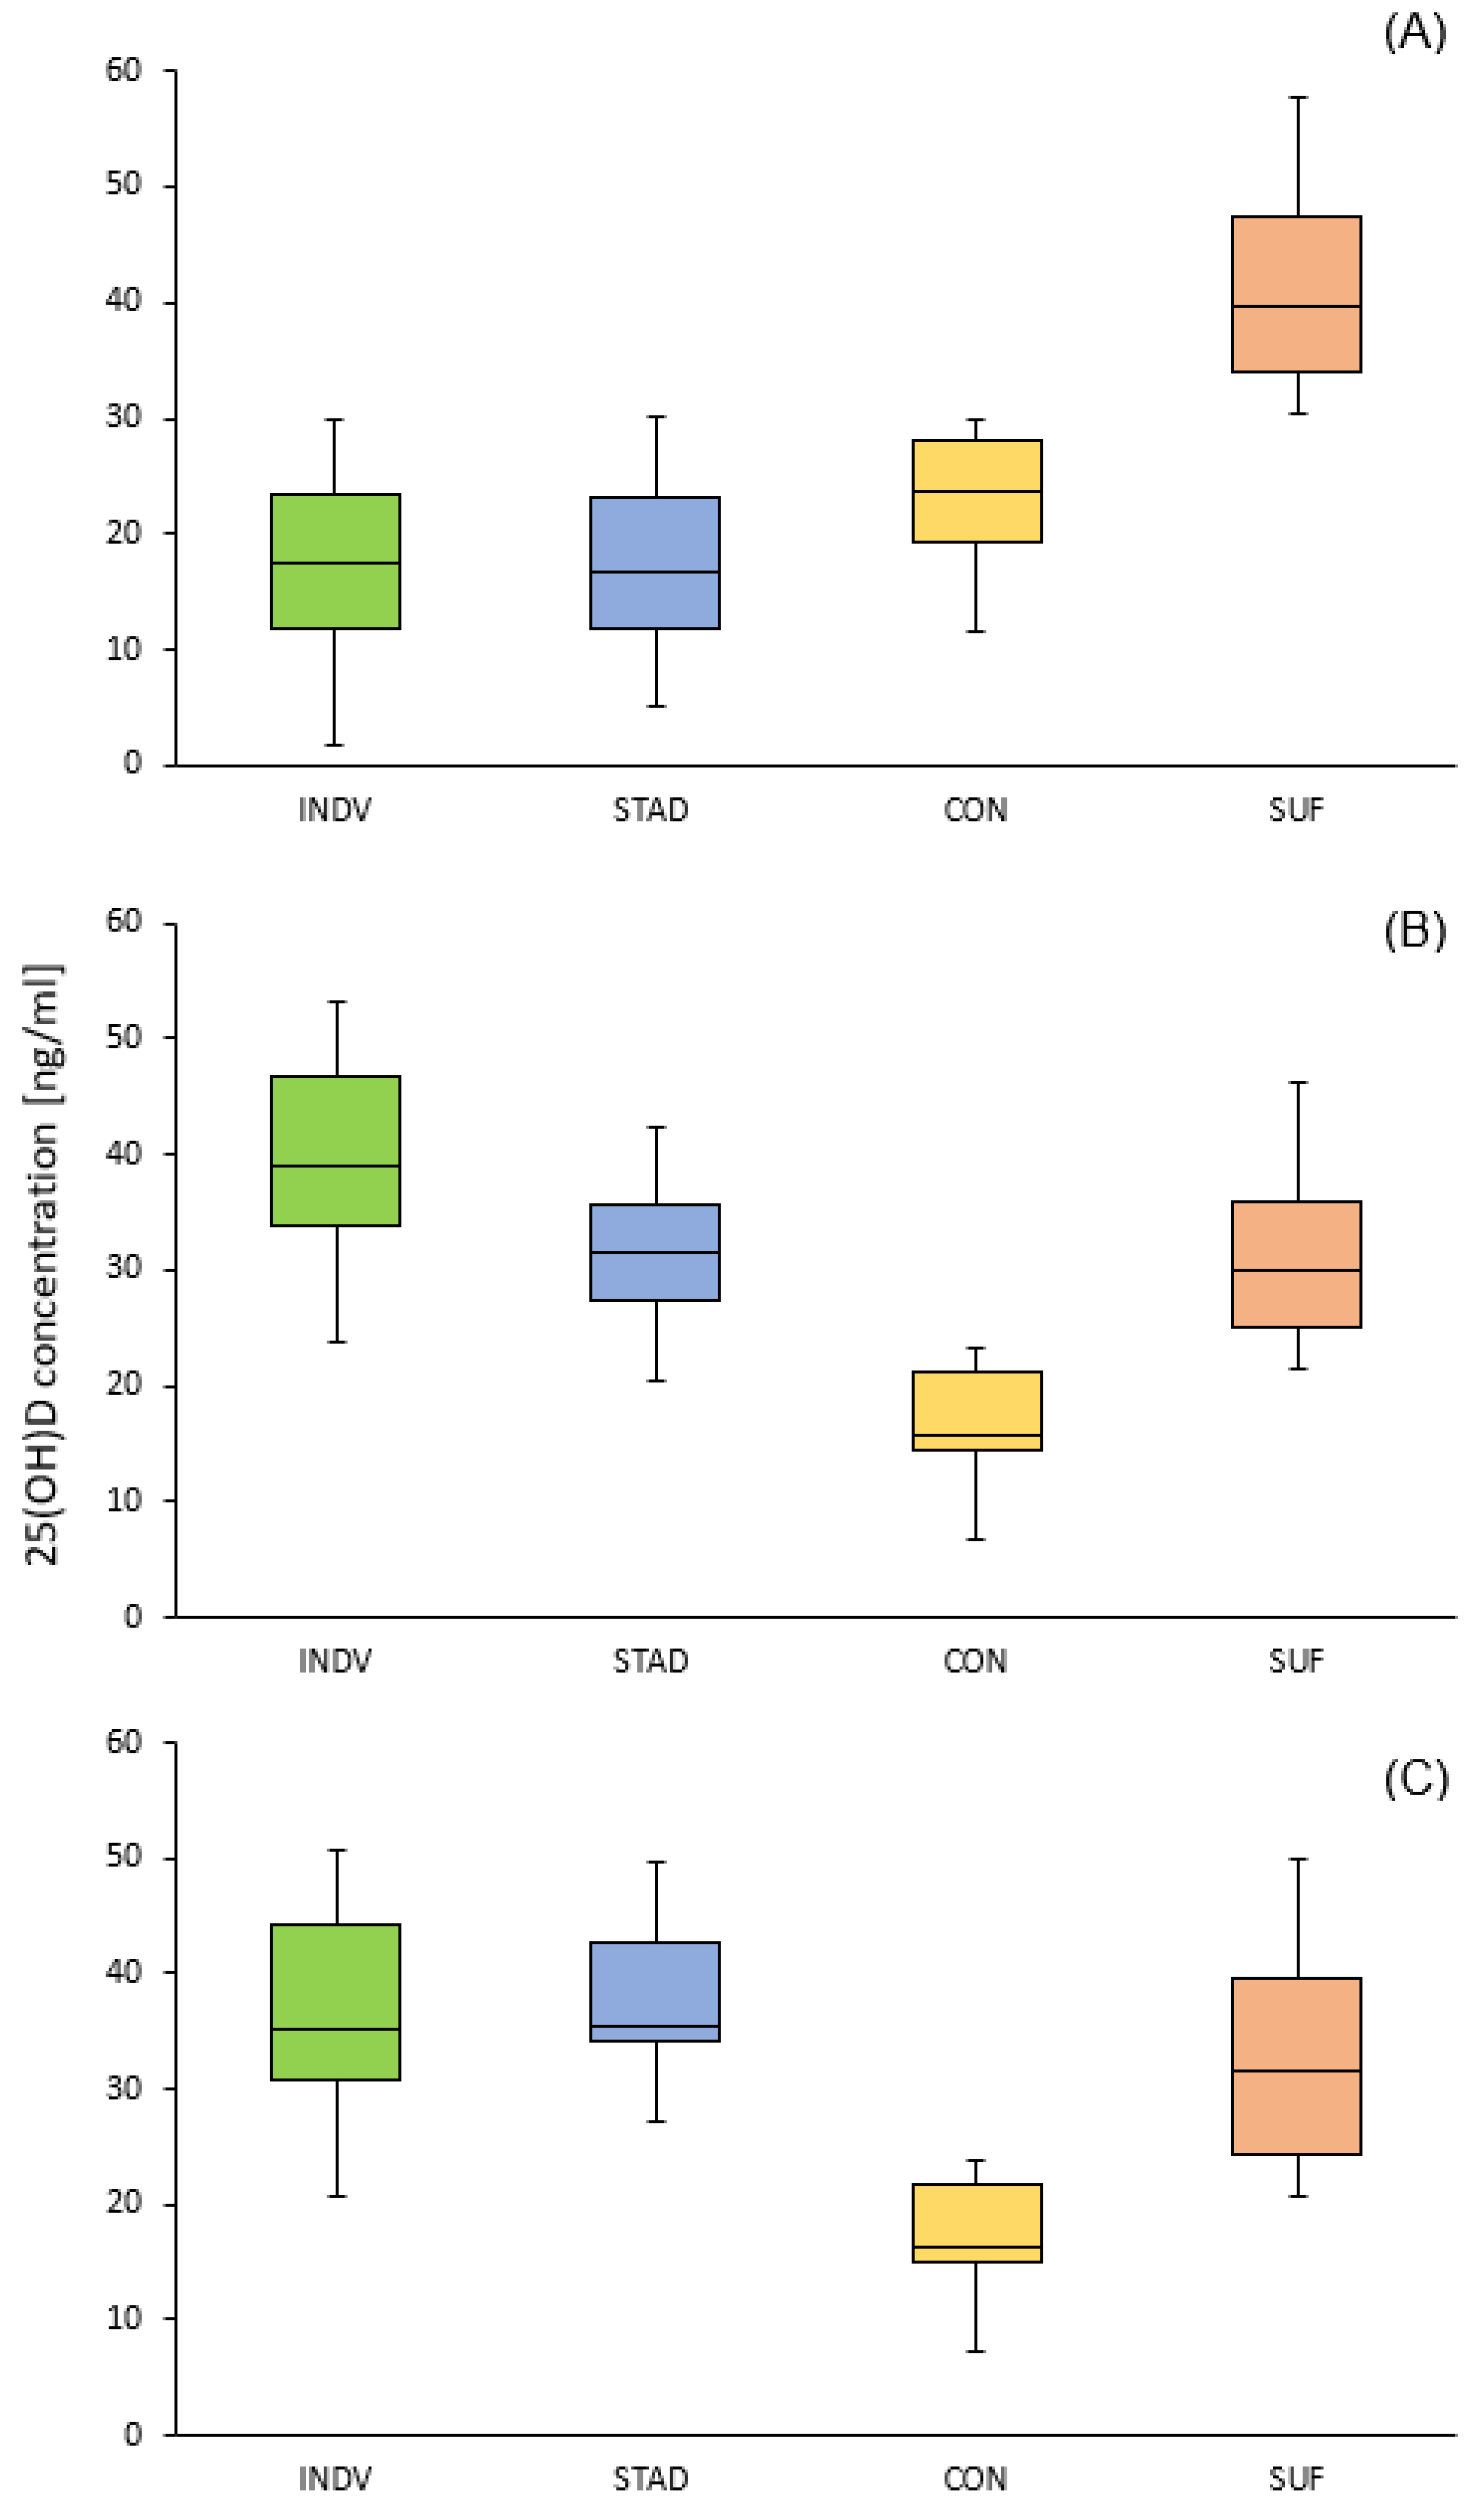
| Baseline 25(OH)D concentration | 17.5(±7.6) a | 17.0 (±7.2) a | 21.9 (±6.3) a | 40.5 (±8.4) |
| Second measurement # | 41.1 (±10.9) a,b,c,d | 32.5 (±6.4) c,d,e | 17.7 (±6.2) a,d | 31.6 (±10.7) d |
| Final 25(OH)D concentration ## | 37.9 (±10.3) c,d | 38.1 (±6.8) c,d | 18.1 (±6.3) a | 31.8 (±9.9) d |
| Supplementation Groups (INDV and STAD) | Control Groups (CON and SUF) | |||
|---|---|---|---|---|
| Baseline 25(OH)D concentration | Increase in 25(OH)D from baseline to final concentration (Δt10-t0) | Baseline 25(OH)D concentration | Decline in 25(OH)D from baseline to final concentration (Δt10-t0) | |
| Difference in 25(OH)D from baseline to final measurement (Δt10-t0) | −0.54 ** | −0.45 * | ||
| Average training volume per week | 0.19 | −0.34 * | −0.18 | 0.01 |
| Average competition volume per month | −0.12 | 0.01 | 0.17 | 0.03 |
| Average nutritive vitamin D intake (μg/day) | 0.03 | −0.23 | −0.09 | 0.01 |
| BMI | −0.15 | −0.001 | −0.23 | 0.08 |
Disclaimer/Publisher’s Note: The statements, opinions and data contained in all publications are solely those of the individual author(s) and contributor(s) and not of MDPI and/or the editor(s). MDPI and/or the editor(s) disclaim responsibility for any injury to people or property resulting from any ideas, methods, instructions or products referred to in the content. |
© 2023 by the authors. Licensee MDPI, Basel, Switzerland. This article is an open access article distributed under the terms and conditions of the Creative Commons Attribution (CC BY) license (https://creativecommons.org/licenses/by/4.0/).
Share and Cite
Tuma, C.; Schick, A.; Pommerening, N.; Braun, H.; Thevis, M. Effects of an Individualized vs. Standardized Vitamin D Supplementation on the 25(OH)D Level in Athletes. Nutrients 2023, 15, 4747. https://doi.org/10.3390/nu15224747
Tuma C, Schick A, Pommerening N, Braun H, Thevis M. Effects of an Individualized vs. Standardized Vitamin D Supplementation on the 25(OH)D Level in Athletes. Nutrients. 2023; 15(22):4747. https://doi.org/10.3390/nu15224747
Chicago/Turabian StyleTuma, Chiara, Arne Schick, Nele Pommerening, Hans Braun, and Mario Thevis. 2023. "Effects of an Individualized vs. Standardized Vitamin D Supplementation on the 25(OH)D Level in Athletes" Nutrients 15, no. 22: 4747. https://doi.org/10.3390/nu15224747
APA StyleTuma, C., Schick, A., Pommerening, N., Braun, H., & Thevis, M. (2023). Effects of an Individualized vs. Standardized Vitamin D Supplementation on the 25(OH)D Level in Athletes. Nutrients, 15(22), 4747. https://doi.org/10.3390/nu15224747