
Relationship between Serum Homocysteine Concentration and Dietary Factors in Young Japanese Women


Abstract
:
1. Introduction
2. Materials and Methods
2.1. Study Design
2.2. Subjects
2.3. Lifestyle Survey and Physical Condition Check Survey
2.4. Dietary Survey
2.5. Anthropometric Measurement
2.6. Blood Drawing
2.7. Blood Analysis
2.8. Ethics Approval
2.9. Statistical Analysis
3. Results
3.1. Target Characteristics
3.2. Relationship between Energy/Nutrient Intake and Serum Homocysteine Concentration
3.3. Relationship between Food Group Intake and Serum Homocysteine Concentration
3.4. Dietary Fiber Intake by Food Group
4. Discussion
5. Conclusions
Author Contributions
Funding
Institutional Review Board Statement
Informed Consent Statement
Data Availability Statement
Conflicts of Interest
References
- 2022 Summary of Vital Statistics Monthly Report Annual Total (Approximate Number). Available online: https://www.mhlw.go.jp/toukei/saikin/hw/jinkou/geppo/nengai22/index.html (accessed on 12 September 2023).
- World Health Organization. Noncommunicable Diseases Country Profiles 2018. Available online: https://www.who.int/publications/i/item/9789241514620 (accessed on 12 September 2023).
- McCully, K.S. Vascular pathology of homocysteinemia: Implications for the pathogenesis of arteriosclerosis. Am. J. Pathol. 1969, 56, 111–128. [Google Scholar]
- McCully, K.S. Homocysteine, vitamins, and vascular disease prevention. Am. J. Clin. Nutr. 2007, 86, 1563s–1568s. [Google Scholar] [CrossRef] [PubMed]
- Refsum, H.; Ueland, P.M.; Nygård, O.; Vollset, S.E. Homocysteine and cardiovascular disease. Annu. Rev. Med. 1998, 49, 31–62. [Google Scholar] [CrossRef] [PubMed]
- den Heijer, M.; Rosendaal, F.R.; Blom, H.J.; Gerrits, W.B.; Bos, G.M. Hyperhomocysteinemia and venous thrombosis: A meta-analysis. Thromb. Haemost. 1998, 80, 874–877. [Google Scholar] [CrossRef] [PubMed]
- Jacques, P.F.; Bostom, A.G.; Wilson, P.W.; Rich, S.; Rosenberg, I.H.; Selhub, J. Determinants of plasma total homocysteine concentration in the Framingham Offspring cohort. Am. J. Clin. Nutr. 2001, 73, 613–621. [Google Scholar] [CrossRef] [PubMed]
- D’Souza, S.W.; Glazier, J.D. Homocysteine Metabolism in Pregnancy and Developmental Impacts. Front. Cell Dev. Biol. 2022, 10, 802285. [Google Scholar] [CrossRef]
- Mennen, L.I.; de Courcy, G.P.; Guilland, J.C.; Ducros, V.; Bertrais, S.; Nicolas, J.P.; Maurel, M.; Zarebska, M.; Favier, A.; Franchisseur, C.; et al. Homocysteine, cardiovascular disease risk factors, and habitual diet in the French Supplementation with Antioxidant Vitamins and Minerals Study. Am. J. Clin. Nutr. 2002, 76, 1279–1289. [Google Scholar] [CrossRef]
- Rasmussen, L.B.; Ovesen, L.; Bülow, I.; Knudsen, N.; Laurberg, P.; Perrild, H. Folate intake, lifestyle factors, and homocysteine concentrations in younger and older women. Am. J. Clin. Nutr. 2000, 72, 1156–1163. [Google Scholar] [CrossRef]
- Saw, S.M.; Yuan, J.M.; Ong, C.N.; Arakawa, K.; Lee, H.P.; Coetzee, G.A.; Yu, M.C. Genetic, dietary, and other lifestyle determinants of plasma homocysteine concentrations in middle-aged and older Chinese men and women in Singapore. Am. J. Clin. Nutr. 2001, 73, 232–239. [Google Scholar] [CrossRef]
- Dietary Survey Manual, 3rd ed.; Supervised by the Japanese Society for Nutrition Improvement; Nanzando: Tokyo, Japan, 2016.
- Energy Quick Guide, 4th ed.; Supervised by Makino, N.; Kagawa Nutrition University Press: Tokyo, Japan, 2017.
- Japan’s Standard Tables of Food Composition; Office for Resources, Policy Division Science and Technology Policy Bureau: Tokyo, Japan, 2015.
- Calorie Guide for Home Side Dishes, Revised ed.; Supervised by Kagawa, Y.; Kagawa Nutrition University Press: Tokyo, Japan, 2014.
- Calorie Guide for Everyday Meals, Revised ed.; Supervised by Kagawa, Y.; Kagawa Nutrition University Press: Tokyo, Japan, 2015.
- Calorie Guide for Eating Out, Revised ed.; Supervised by Kagawa, Y.; Kagawa Nutrition University Press: Tokyo, Japan, 2016.
- Basic Data for Cooking, 5th ed.; Supervised by Nakako Matsumoto; Kagawa Nutrition University Press: Tokyo, Japan, 2018.
- Kubo, Y.; Shoji, K.; Tajima, A.; Horiguchi, S.; Fukuoka, H.; Nishikawa, M.; Kagawa, Y.; Kawabata, T. Serum 5-Methyltetrahydrofolate Status Is Associated with One-Carbon Metabolism-Related Metabolite Concentrations and Enzyme Activity Indicators in Young Women. Int. J. Mol. Sci. 2023, 24, 10993. [Google Scholar] [CrossRef]
- Vrentzos, G.E.; Papadakis, J.A.; Malliaraki, N.; Zacharis, E.A.; Mazokopakis, E.; Margioris, A.; Ganotakis, E.S.; Kafatos, A. Diet, serum homocysteine levels and ischaemic heart disease in a Mediterranean population. Br. J. Nutr. 2004, 91, 1013–1019. [Google Scholar] [CrossRef] [PubMed]
- Mirmiran, P.; Bahadoran, Z.; Khalili Moghadam, S.; Zadeh Vakili, A.; Azizi, F. A Prospective Study of Different Types of Dietary Fiber and Risk of Cardiovascular Disease: Tehran Lipid and Glucose Study. Nutrients 2016, 8, 686. [Google Scholar] [CrossRef]
- Morrison, D.J.; Preston, T. Formation of short chain fatty acids by the gut microbiota and their impact on human metabolism. Gut Microbes 2016, 7, 189–200. [Google Scholar] [CrossRef] [PubMed]
- Barrett, E.M.; Amoutzopoulos, B.; Batterham, M.J.; Ray, S.; Beck, E.J. Whole grain intake compared with cereal fibre intake in association to CVD risk factors: A cross-sectional analysis of the National Diet and Nutrition Survey (UK). Public Health Nutr. 2020, 23, 1392–1403. [Google Scholar] [CrossRef]
- Sharma, S.; Sheehy, T.; Kolonel, L.N. Ethnic differences in grains consumption and their contribution to intake of B-vitamins: Results of the Multiethnic Cohort Study. Nutr. J. 2013, 12, 65. [Google Scholar] [CrossRef]
- Lairon, D.; Arnault, N.; Bertrais, S.; Planells, R.; Clero, E.; Hercberg, S.; Boutron-Ruault, M.C. Dietary fiber intake and risk factors for cardiovascular disease in French adults. Am. J. Clin. Nutr. 2005, 82, 1185–1194. [Google Scholar] [CrossRef]
- Aoe, S. Characteristics of Dietary Fiber in Cereals. J. Cook. Sci. Jpn. 2016, 49, 297–302. [Google Scholar]
- Gibson, R.; Eriksen, R.; Chambers, E.; Gao, H.; Aresu, M.; Heard, A.; Chan, Q.; Elliott, P.; Frost, G. Intakes and Food Sources of Dietary Fibre and Their Associations with Measures of Body Composition and Inflammation in UK Adults: Cross-Sectional Analysis of the Airwave Health Monitoring Study. Nutrients 2019, 11, 1839. [Google Scholar] [CrossRef] [PubMed]
- Fuller, S.; Beck, E.; Salman, H.; Tapsell, L. New Horizons for the Study of Dietary Fiber and Health: A Review. Plant Foods Hum. Nutr. 2016, 71, 1–12. [Google Scholar] [CrossRef]
- Thoma, C.; Green, T.J.; Ferguson, L.R. Citrus pectin and oligofructose improve folate status and lower serum total homocysteine in rats. Int. J. Vitam. Nutr. Res. 2003, 73, 403–409. [Google Scholar] [CrossRef]
- Krajcovicova-Kudlackova, M.; Ginter, E.; Blazicek, P.; Klvanova, J. Homocysteine and vitamin C. Bratisl. Lek. Listy 2002, 103, 171–173. [Google Scholar] [PubMed]
- Muszyńska, B.; Grzywacz-Kisielewska, A.; Kała, K.; Gdula-Argasińska, J. Anti-inflammatory properties of edible mushrooms: A review. Food Chem. 2018, 243, 373–381. [Google Scholar] [CrossRef] [PubMed]
- Kozarski, M.; Klaus, A.; Niksic, M.; Jakovljevic, D.; Helsper, J.P.F.G.; Van Griensven, L.J.L.D. Antioxidative and immunomodulating activities of polysaccharide extracts of the medicinal mushrooms Agaricus bisporus, Agaricus brasiliensis, Ganoderma lucidum and Phellinus linteus. Food Chem. 2011, 129, 1667–1675. [Google Scholar] [CrossRef]
- Belkaid, Y.; Hand, T.W. Role of the Microbiota in Immunity and Inflammation. Cell 2014, 157, 121–141. [Google Scholar] [CrossRef]
- Chou, W.-T.; Sheih, I.C.; Fang, T.J. The Applications of Polysaccharides from Various Mushroom Wastes as Prebiotics in Different Systems. J. Food Sci. 2013, 78, M1041–M1048. [Google Scholar] [CrossRef]
- Rioux, L.E.; Turgeon, S.L.; Beaulieu, M. Structural characterization of laminaran and galactofucan extracted from the brown seaweed Saccharina longicruris. Phytochemistry 2010, 71, 1586–1595. [Google Scholar] [CrossRef]
- Nakashima, A.; Yamada, K.; Iwata, O.; Sugimoto, R.; Atsuji, K.; Ogawa, T.; Ishibashi-Ohgo, N.; Suzuki, K. β-Glucan in Foods and Its Physiological Functions. J. Nutr. Sci. Vitaminol. 2018, 64, 8–17. [Google Scholar] [CrossRef]
- Sharif, S.; Maqsood, M.; Naz, S.; Manzoor, F.; Shah Jahan, M.; Farasat, T. Expression of Gstt1 in Type 2 Diabetic Retinopathy Patients. Crit. Rev. Eukaryot. Gene Expr. 2019, 29, 47–50. [Google Scholar] [CrossRef]
- Pharmaceutical Interview Form. Available online: https://image.packageinsert.jp/pdf.php?mode=1&yjcode=4299401D1083 (accessed on 2 November 2023).
- Mielgo-Ayuso, J.; Valtueña, J.; Huybrechts, I.; Breidenassel, C.; Cuenca-García, M.; De Henauw, S.; Stehle, P.; Kafatos, A.; Kersting, M.; Widhalm, K.; et al. Fruit and vegetables consumption is associated with higher vitamin intake and blood vitamin status among European adolescents. Eur. J. Clin. Nutr. 2017, 71, 458–467. [Google Scholar] [CrossRef]
- Murakami, K.; Sasaki, S.; Uenishi, K. Higher intake of vitamin B-6 and dairy products and lower intake of green and oolong tea are independently associated with lower serum homocysteine concentration in young Japanese women. Nutr. Res. 2013, 33, 653–660. [Google Scholar] [CrossRef]


| Variables | Overall (n = 227) | |
|---|---|---|
| Age | (years) | 20 [19, 21] |
| Height | (cm) | 158.4 [155.3, 162.4] |
| Body weight | (kg) | 51.4 ± 5.6 |
| BMI | (kg/m2) | 20.3 ± 1.9 |
| Body fat percentage | (%) | 25.4 ± 4.2 |
| Mean systolic blood pressure | (mmHg) | 107 [100, 115] |
| Mean diastolic blood pressure | (mmHg) | 69 [64, 74] |
| Homocysteine | (µmol/L) | 6.39 [5.53, 7.41] |
| Amount of Intake | Model 1 ¶ | Model 2 ¶ | Model 3 ¶ | |||||
|---|---|---|---|---|---|---|---|---|
| βcoefficient | p Value § | βcoefficient | p Value § | βcoefficient | p Value § | |||
| Energy | (kcal/day) | 1729 [1454, 1961] | ||||||
| Protein | (% energy) | 14 [13, 16] | −0.196 | 0.0036 | −0.154 | 0.0540 | −0.102 | 0.2048 |
| Fat | (% energy) | 32 [29, 35] | 0.053 | 0.4281 | 0.039 | 0.5618 | 0.010 | 0.8755 |
| Carbohydrate | (% energy) | 54 [51, 57] | 0.027 | 0.6819 | 0.007 | 0.9142 | 0.018 | 0.7866 |
| Protein | (g/1000 kcal) | 35.3 [32.8, 38.8] | −0.201 | 0.0029 | −0.159 | 0.0468 | −0.113 | 0.1625 |
| Fat | (g/1000 kcal) | 35.6 [31.8, 39.1] | 0.053 | 0.4268 | 0.039 | 0.5607 | 0.011 | 0.8735 |
| Carbohydrate | (g/1000 kcal) | 130 [122, 139] | −0.005 | 0.9424 | −0.027 | 0.6890 | −0.011 | 0.8646 |
| Soluble dietary fiber | (g/1000 kcal) | 2 [2, 2] | −0.286 | <0.0001 | −0.311 | <0.0001 | −0.281 | 0.0023 |
| Insoluble dietary fiber | (g/1000 kcal) | 5 [4, 6] | −0.241 | 0.0003 | −0.255 | 0.0003 | −0.195 | 0.0151 |
| Total fiber | (g/1000 kcal) | 7 [6, 8] | −0.268 | <0.0001 | −0.298 | <0.0001 | −0.255 | 0.0069 |
| Vitamin A | (µg retinol activity equivalent/1000 kcal) | 243 [197, 295] | −0.148 | 0.0270 | −0.101 | 0.1655 | 0.034 | 0.6910 |
| Vitamin D | (µg/1000 kcal) | 2.3 [1.4, 3.3] | −0.130 | 0.0568 | −0.054 | 0.5095 | −0.062 | 0.4343 |
| Vitamin E | (mg/1000 kcal) | 3.8 [3.3, 4.4] | −0.144 | 0.0320 | −0.130 | 0.0720 | −0.089 | 0.2196 |
| Vitamin K | (µg/1000 kcal) | 118 [84, 155] | −0.225 | 0.0008 | −0.211 | 0.0030 | −0.125 | 0.1528 |
| Vitamin B1 | (mg/1000 kcal) | 0.5 [0.4, 0.6] | −0.124 | 0.0719 | −0.138 | 0.0950 | −0.086 | 0.2995 |
| Vitamin B2 | (mg/1000 kcal) | 0.6 [0.5, 0.7] | −0.154 | 0.0232 | −0.121 | 0.1232 | −0.049 | 0.5506 |
| Vitamin B6 | (mg/1000 kcal) | 0.6 [0.5, 0.7] | −0.079 | 0.2500 | ||||
| Vitamin B12 | (µg/1000 kcal) | 2.5 [1.6, 3.8] | −0.169 | 0.0137 | ||||
| Folate | (µg dietary folate equivalents/1000 kcal) | 143 [121, 170] | −0.231 | 0.0006 | −0.241 | 0.0021 | ||
| Vitamin C | (mg/1000 kcal) | 42 [32, 54] | −0.186 | 0.0054 | −0.238 | 0.0047 | −0.138 | 0.1649 |
| Sodium | (mg/1000 kcal) | 1908 [1668, 2208] | −0.005 | 0.9461 | 0.017 | 0.8064 | 0.035 | 0.6104 |
| Potassium | (mg/1000 kcal) | 1091 [963, 1230] | −0.224 | 0.0008 | −0.259 | 0.0015 | −0.169 | 0.0980 |
| Calcium | (mg/1000 kcal) | 255 [224, 306] | −0.221 | 0.0009 | −0.202 | 0.0033 | −0.133 | 0.0838 |
| (g/day) | (g/1000 kcal) | (g/1000 kcal) | (g/1000 kcal) | p Value for Trend § | |
|---|---|---|---|---|---|
| T1 (n = 75) ¶ | T2 (n = 76) ¶ | T3 (n = 76) ¶ | |||
| Cereals | 344 [300, 397] | 163 [150, 174] | 200 [190, 211] | 248 [234, 272] | 0.7194 |
| Tubers and roots | 31 [19, 48] | 9 [5, 11] | 18 [16, 21] | 32 [26, 39] | 0.4418 |
| Sugar and sweeteners | 11 [6, 17] | 3 [3, 4] | 7 [5, 7] | 11 [10, 13] | 0.1902 |
| Nuts | 2 [1, 3] | 0 [0, 0] | 1 [1, 1] | 3 [2, 4] | 0.5505 |
| Green and yellow vegetables | 61 [41, 91] | 21 [14, 26] | 36 [32, 40] | 58 [53, 68] | 0.0548 |
| Other Vegetables | 100 [72, 132] | 40 [30, 45] | 57 [54, 63] | 82 [74, 97] | 0.1127 |
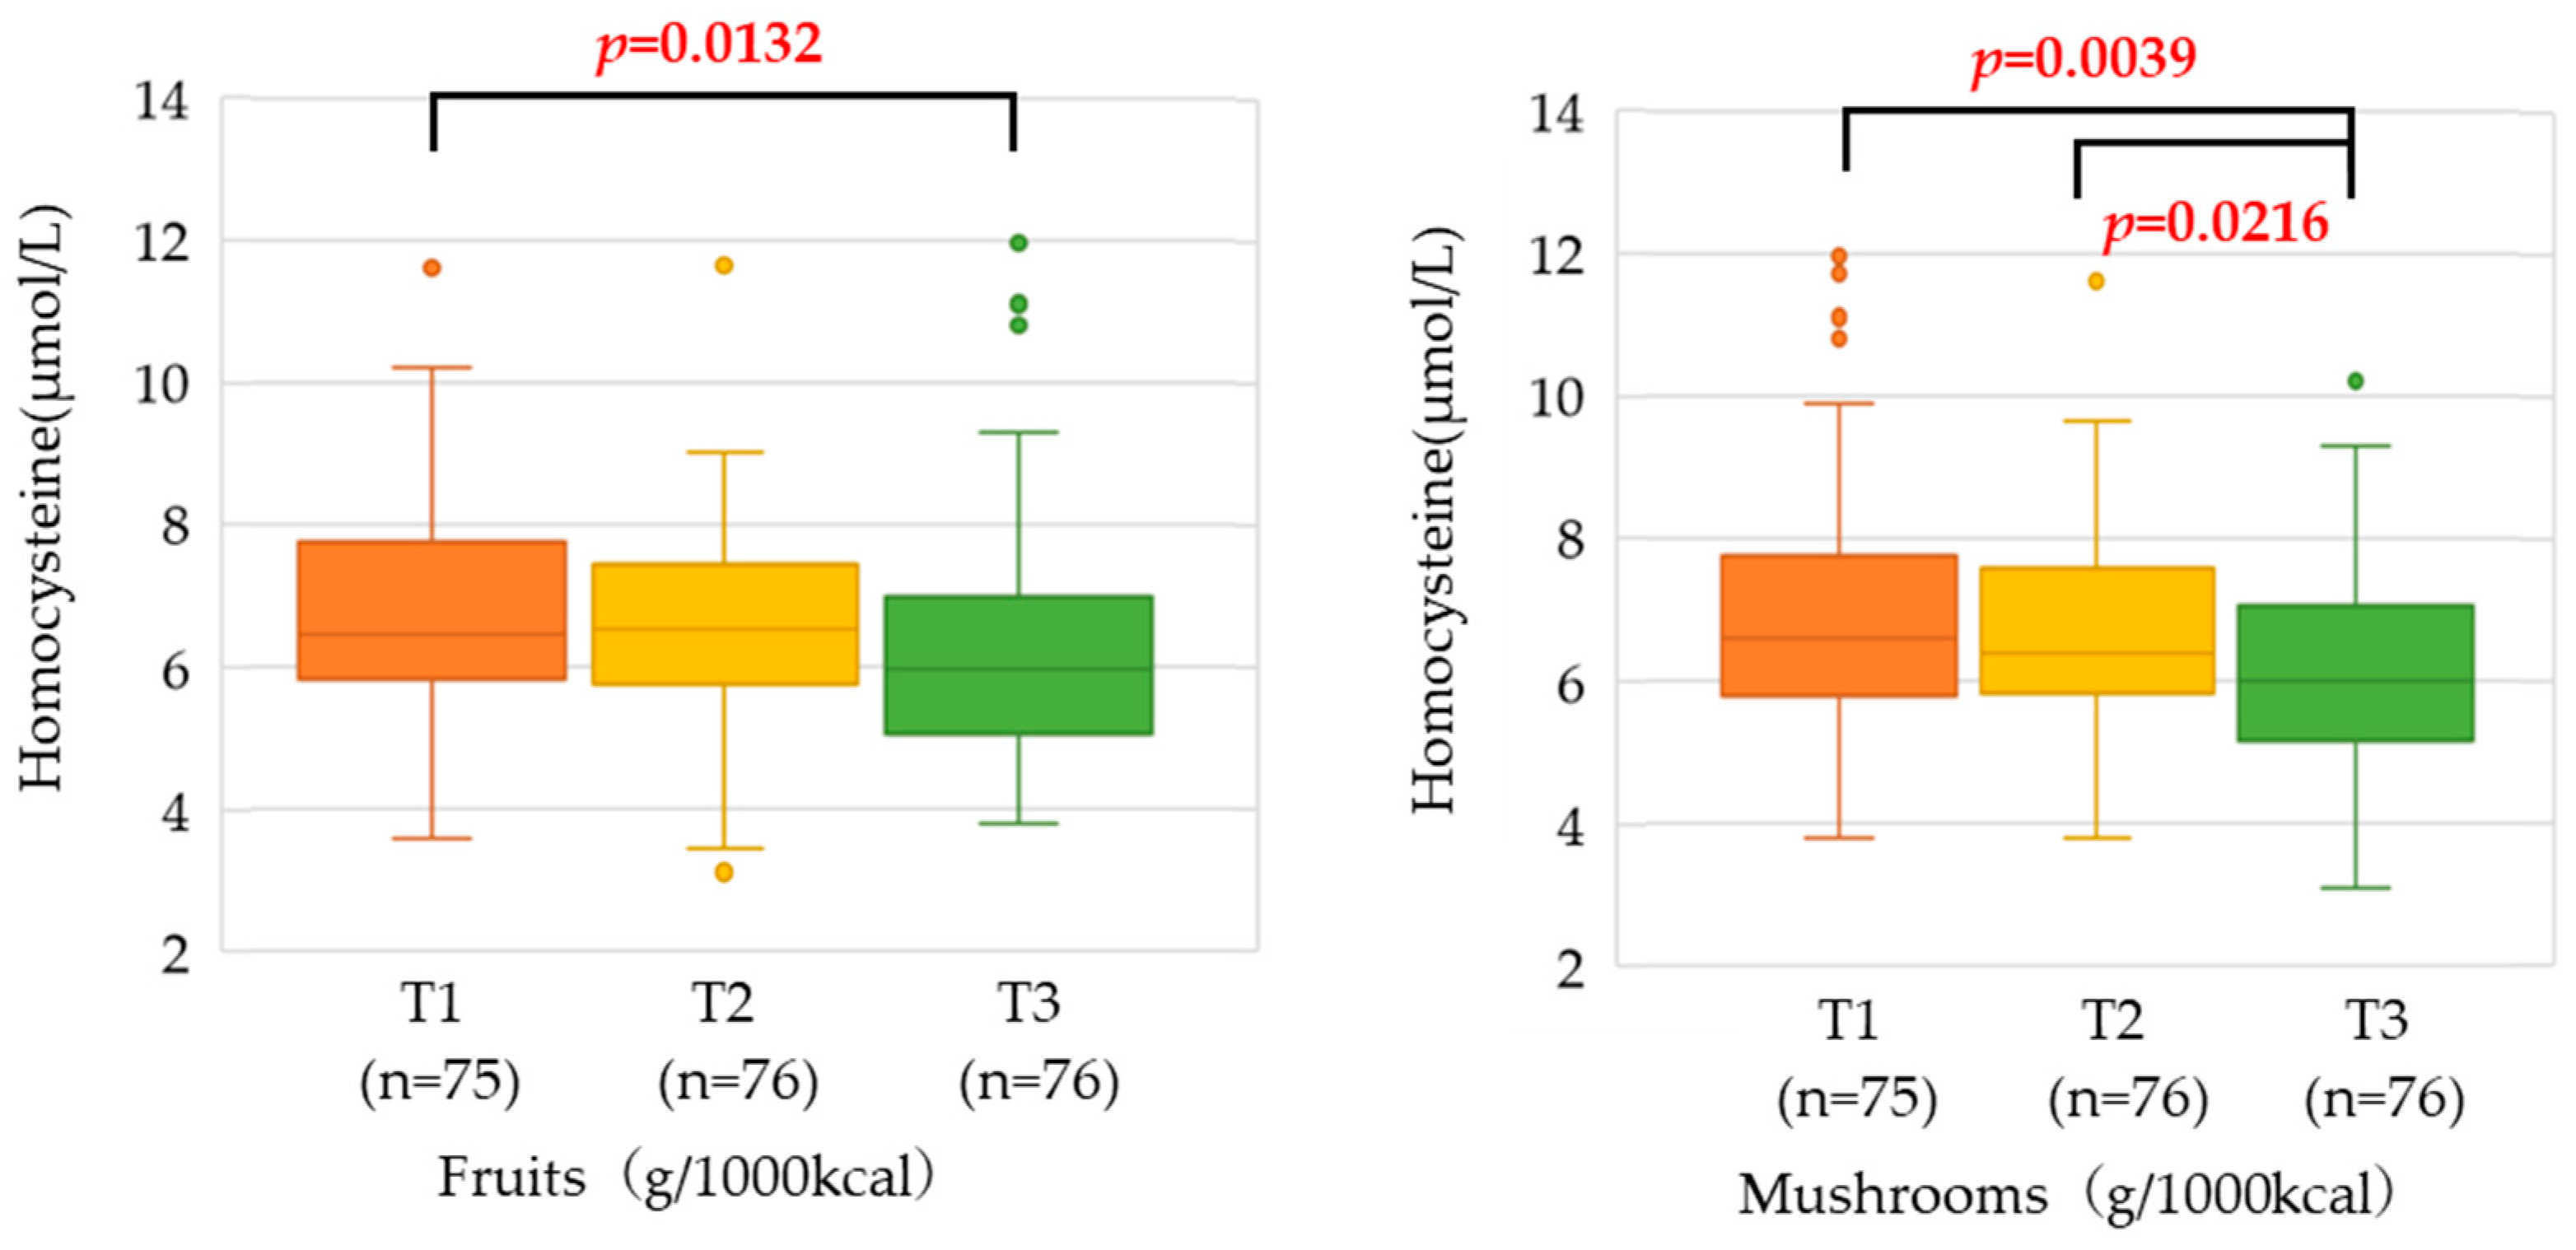
| Fruits | 49 [16, 92] | 7 [3, 11] | 29 [23, 36] | 61 [49, 83] | 0.0060 |
| Mushrooms | 8 [3, 15] | 1 [0, 2] | 5 [4, 6] | 11 [8, 14] | 0.0091 |
| Seaweed | 3 [1, 7] | 0 [0, 1] | 2 [1, 2] | 5 [4, 7] | 0.3715 |
| Pulses | 29 [15, 50] | 6 [2, 8] | 17 [15, 19] | 36 [26, 53] | 0.0929 |
| Seafood | 32 [17, 53] | 8 [4, 11] | 18 [15, 22] | 34 [30, 42] | 0.0573 |
| Meat | 66 [44, 90] | 24 [20, 28] | 38 [34, 43] | 56 [52, 65] | 0.1804 |
| Egg | 33 [19, 49] | 9 [5, 12] | 19 [16, 22] | 31 [26, 36] | 0.0743 |
| Dairy products | 103 [62, 166] | 29 [20, 38] | 60 [51, 65] | 107 [96, 128] | 0.1837 |
| Fats and oils | 11 [8, 15] | 4 [3, 5] | 7 [6, 7] | 9 [8, 10] | 0.6495 |
| Confectioneries | 30 [14, 50] | 5 [2, 9] | 18 [15, 21] | 35 [28, 44] | 0.9064 |
| Beverages | 283 [141, 415] | 63 [33, 84] | 158 [133, 176] | 287 [230, 360] | 0.8447 |
| Seasonings & Spices | 41 [30, 53] | 17 [14, 19] | 23 [22, 25] | 34 [29, 41] | 0.1787 |
| Soluble Dietary Fiber | Insoluble Dietary Fiber | Total Fiber | |
|---|---|---|---|
| Cereals | 440 [311, 599] | 1271 [1061, 1614] | 1710 [1411, 2227] |
| Tubers and roots | 105 [51, 180] | 283 [153, 461] | 395 [220, 629] |
| Sugar and sweeteners | 0 [0, 0] | 0 [0, 0] | 0 [0, 0] |
| Nuts | 11 [5, 21] | 84 [31, 154] | 98 [38, 169] |
| Green and yellow vegetables | 237 [173, 334] | 758 [532, 1056] | 1007 [705, 1374] |
| Other Vegetables | 340 [260, 452] | 821 [645, 1055] | 1190 [922, 1517] |
| Fruits | 125 [49, 231] | 287 [123, 520] | 430 [178, 765] |
| Mushrooms | 11 [4, 22] | 213 [84, 377] | 221 [88, 391] |
| Seaweed § | – | – | 189 [73, 320] |
| Pulses | 111 [25, 213] | 291 [81, 601] | 388 [119, 826] |
| Seafood | 0 [0, 0] | 0 [0, 0] | 0 [0, 0] |
| Meat | 0 [0, 13] | 0 [0, 40] | 0 [0, 53] |
| Egg | 0 [0, 0] | 0 [0, 0] | 0 [0, 0] |
| Dairy products | 0 [0, 4] | 0 [0, 0] | 0 [0, 4] |
| Fats and oils | 0 [0, 0] | 0 [0, 0] | 0 [0, 0] |
| Confectioneries | 95 [36, 174] | 179 [69, 357] | 291 [106, 531] |
| Beverages | 5 [0, 36] | 3 [0, 77] | 20 [0, 115] |
| Seasonings & Spices | 48 [28, 70] | 189 [107, 278] | 243 [142, 346] |
Disclaimer/Publisher’s Note: The statements, opinions and data contained in all publications are solely those of the individual author(s) and contributor(s) and not of MDPI and/or the editor(s). MDPI and/or the editor(s) disclaim responsibility for any injury to people or property resulting from any ideas, methods, instructions or products referred to in the content. |
© 2023 by the authors. Licensee MDPI, Basel, Switzerland. This article is an open access article distributed under the terms and conditions of the Creative Commons Attribution (CC BY) license (https://creativecommons.org/licenses/by/4.0/).
Share and Cite
Tajima, A.; Kubo, Y.; Horiguchi, S.; Shoji, K.; Kawabata, T. Relationship between Serum Homocysteine Concentration and Dietary Factors in Young Japanese Women. Nutrients 2023, 15, 4740. https://doi.org/10.3390/nu15224740
Tajima A, Kubo Y, Horiguchi S, Shoji K, Kawabata T. Relationship between Serum Homocysteine Concentration and Dietary Factors in Young Japanese Women. Nutrients. 2023; 15(22):4740. https://doi.org/10.3390/nu15224740
Chicago/Turabian StyleTajima, Akiko, Yoshinori Kubo, Sayaka Horiguchi, Kumiko Shoji, and Terue Kawabata. 2023. "Relationship between Serum Homocysteine Concentration and Dietary Factors in Young Japanese Women" Nutrients 15, no. 22: 4740. https://doi.org/10.3390/nu15224740
APA StyleTajima, A., Kubo, Y., Horiguchi, S., Shoji, K., & Kawabata, T. (2023). Relationship between Serum Homocysteine Concentration and Dietary Factors in Young Japanese Women. Nutrients, 15(22), 4740. https://doi.org/10.3390/nu15224740