
Changes in Skeletal Muscle Protein Metabolism Signaling Induced by Glutamine Supplementation and Exercise
 , ,
, ,
Abstract
:1. Introduction
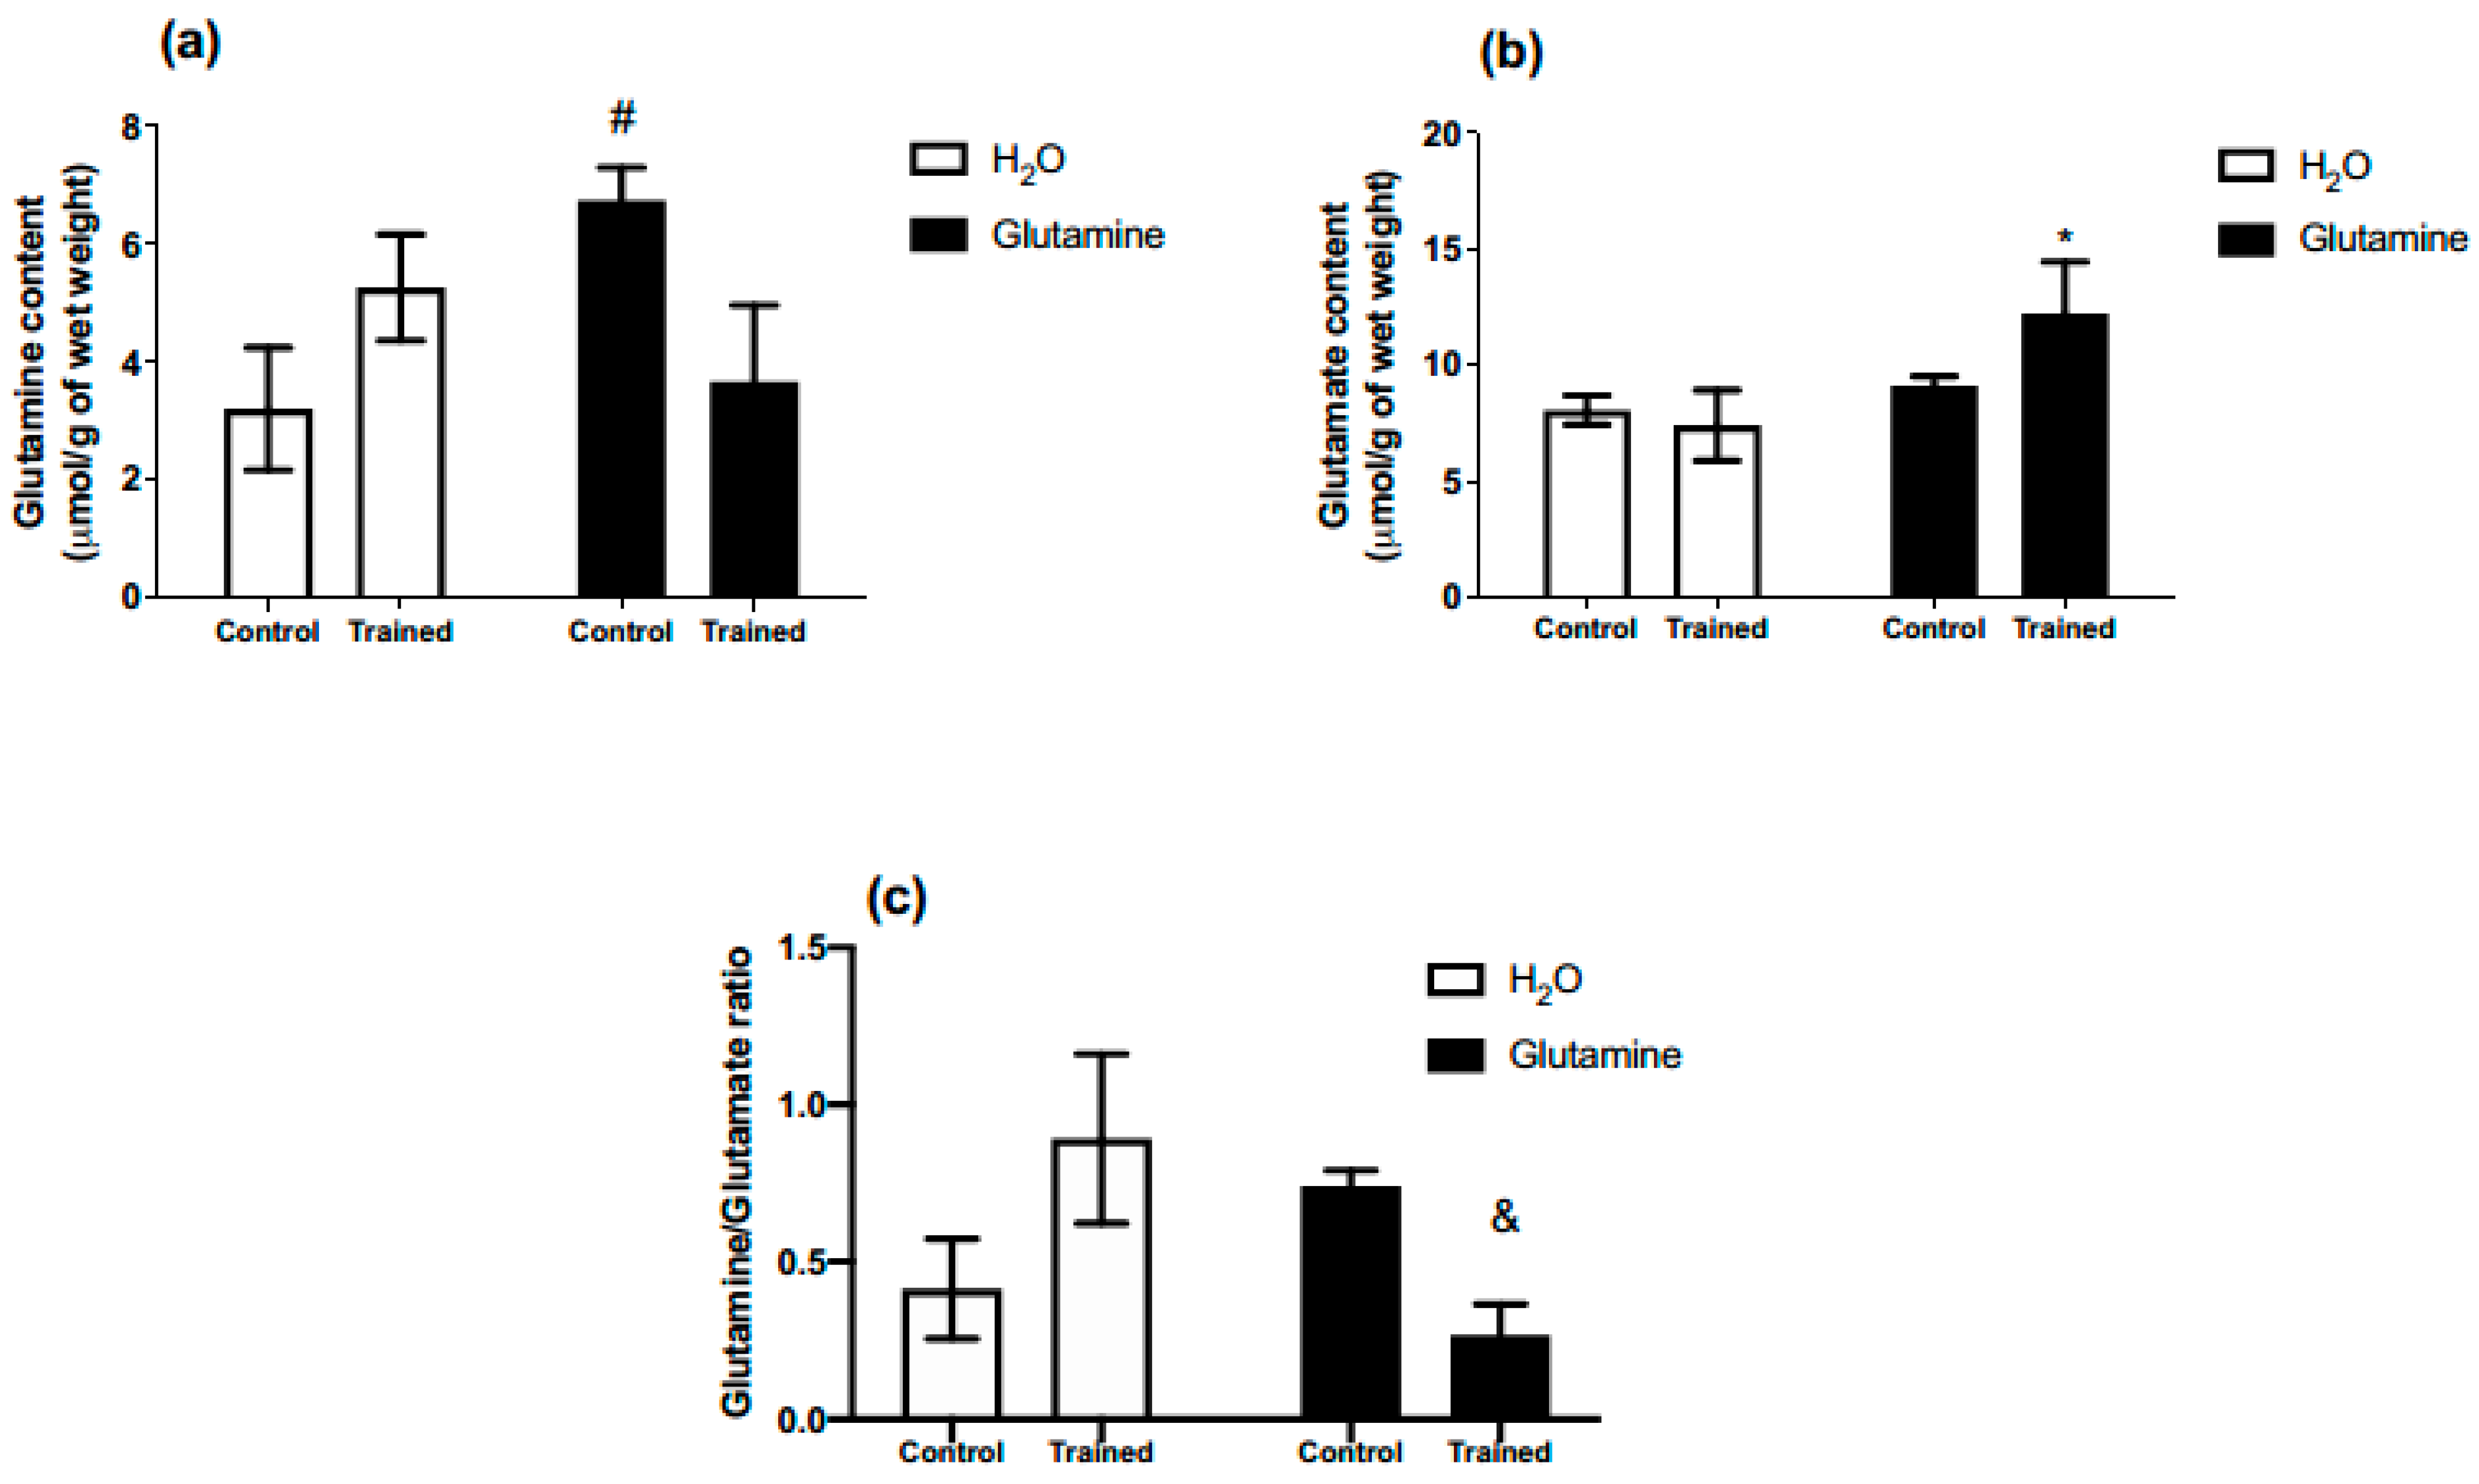
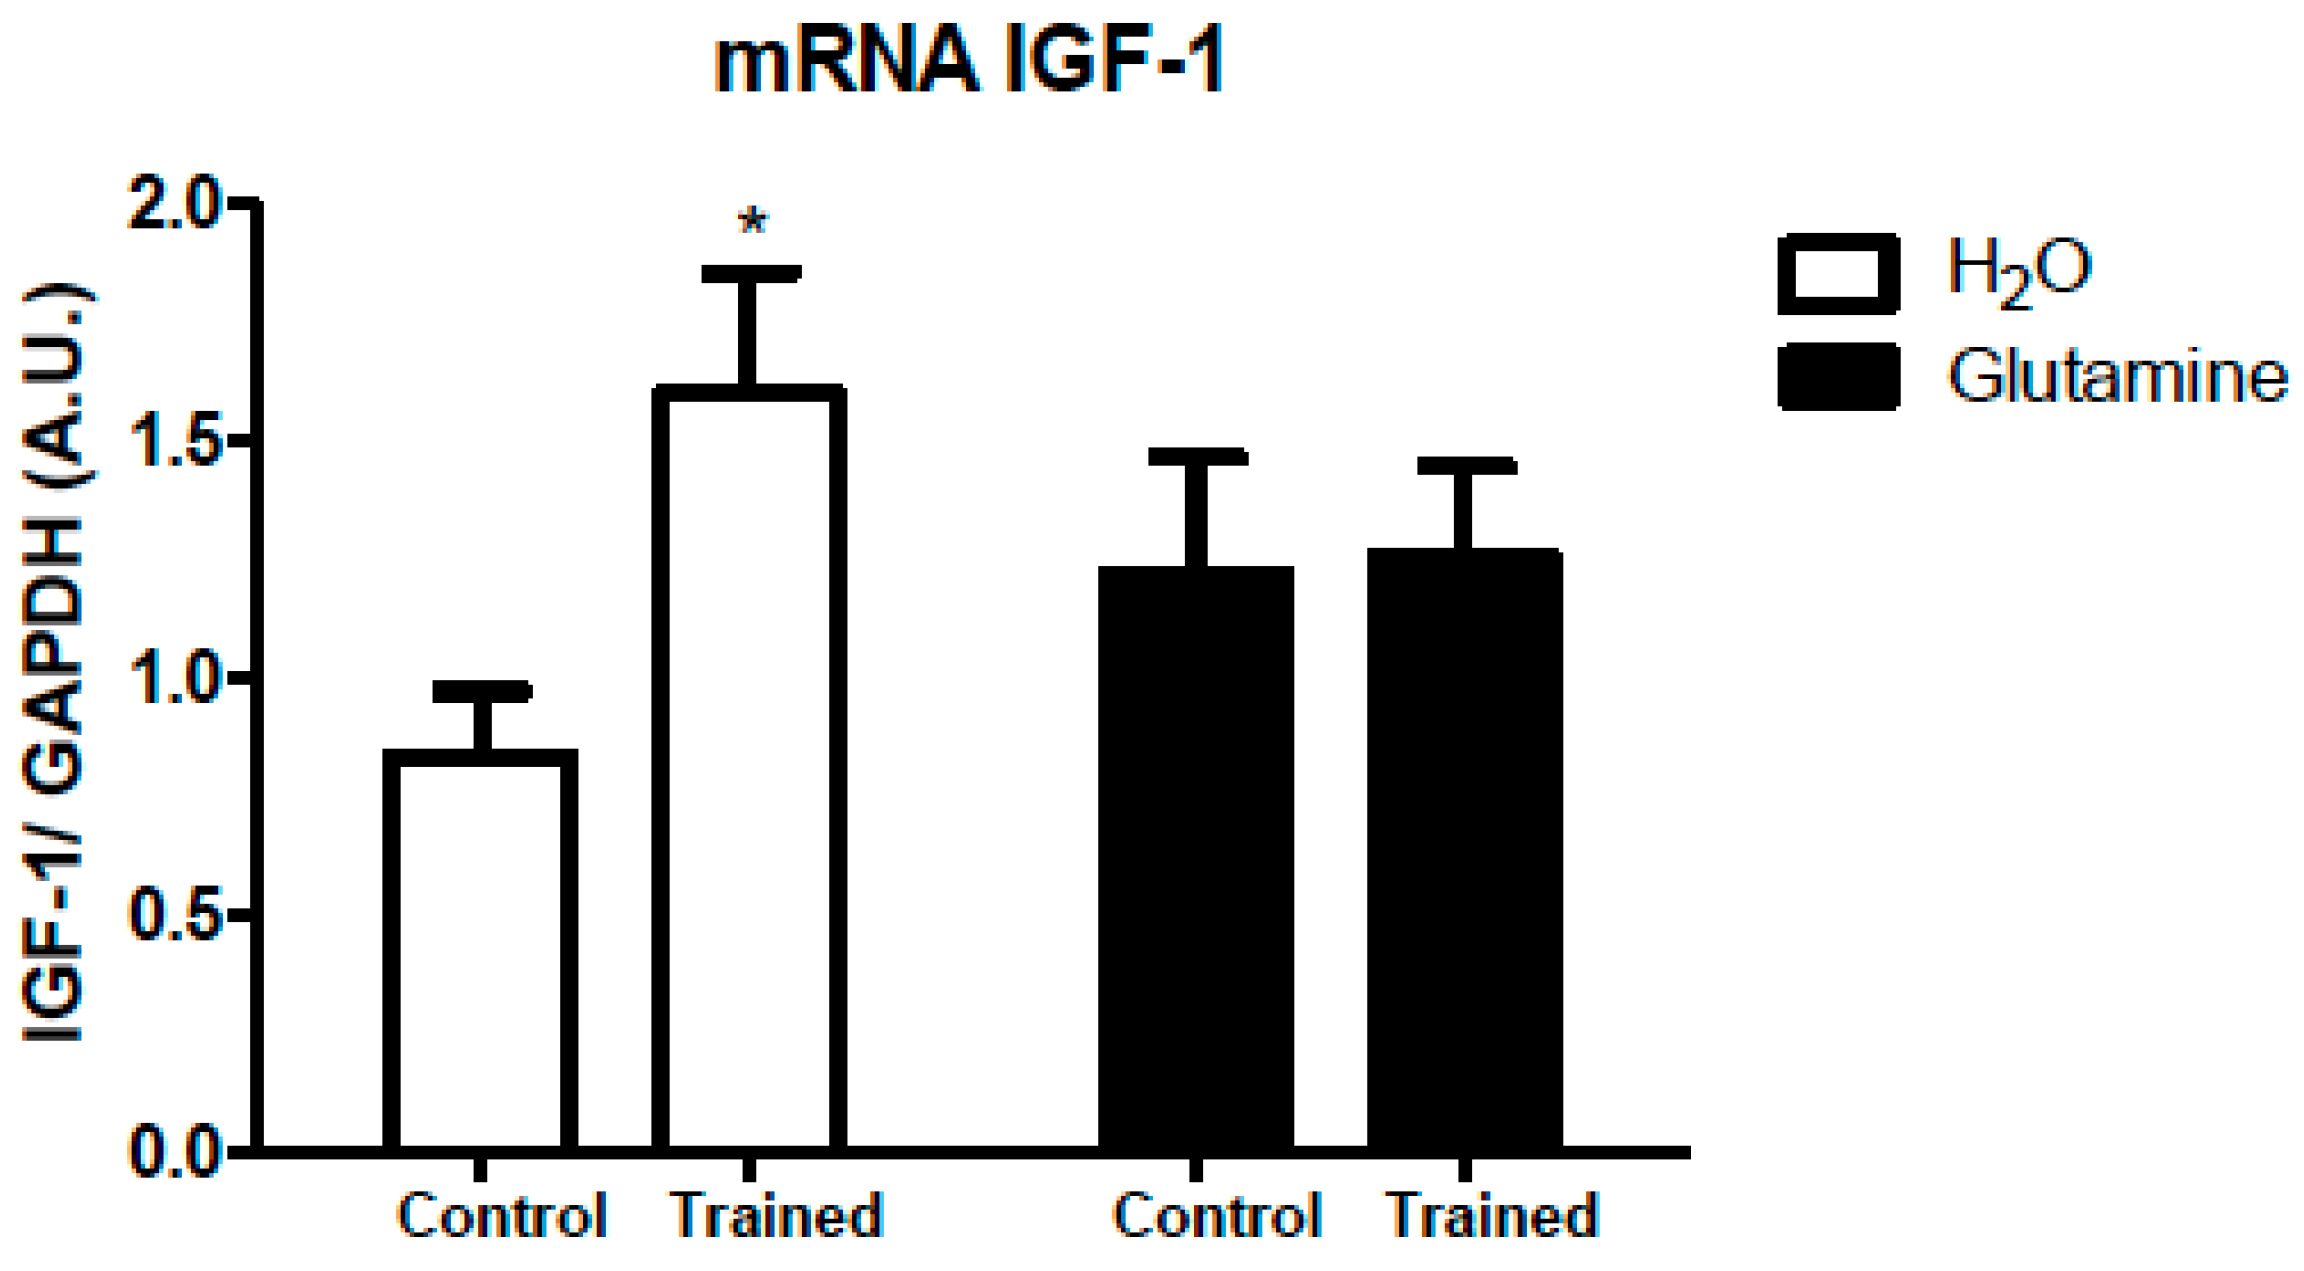
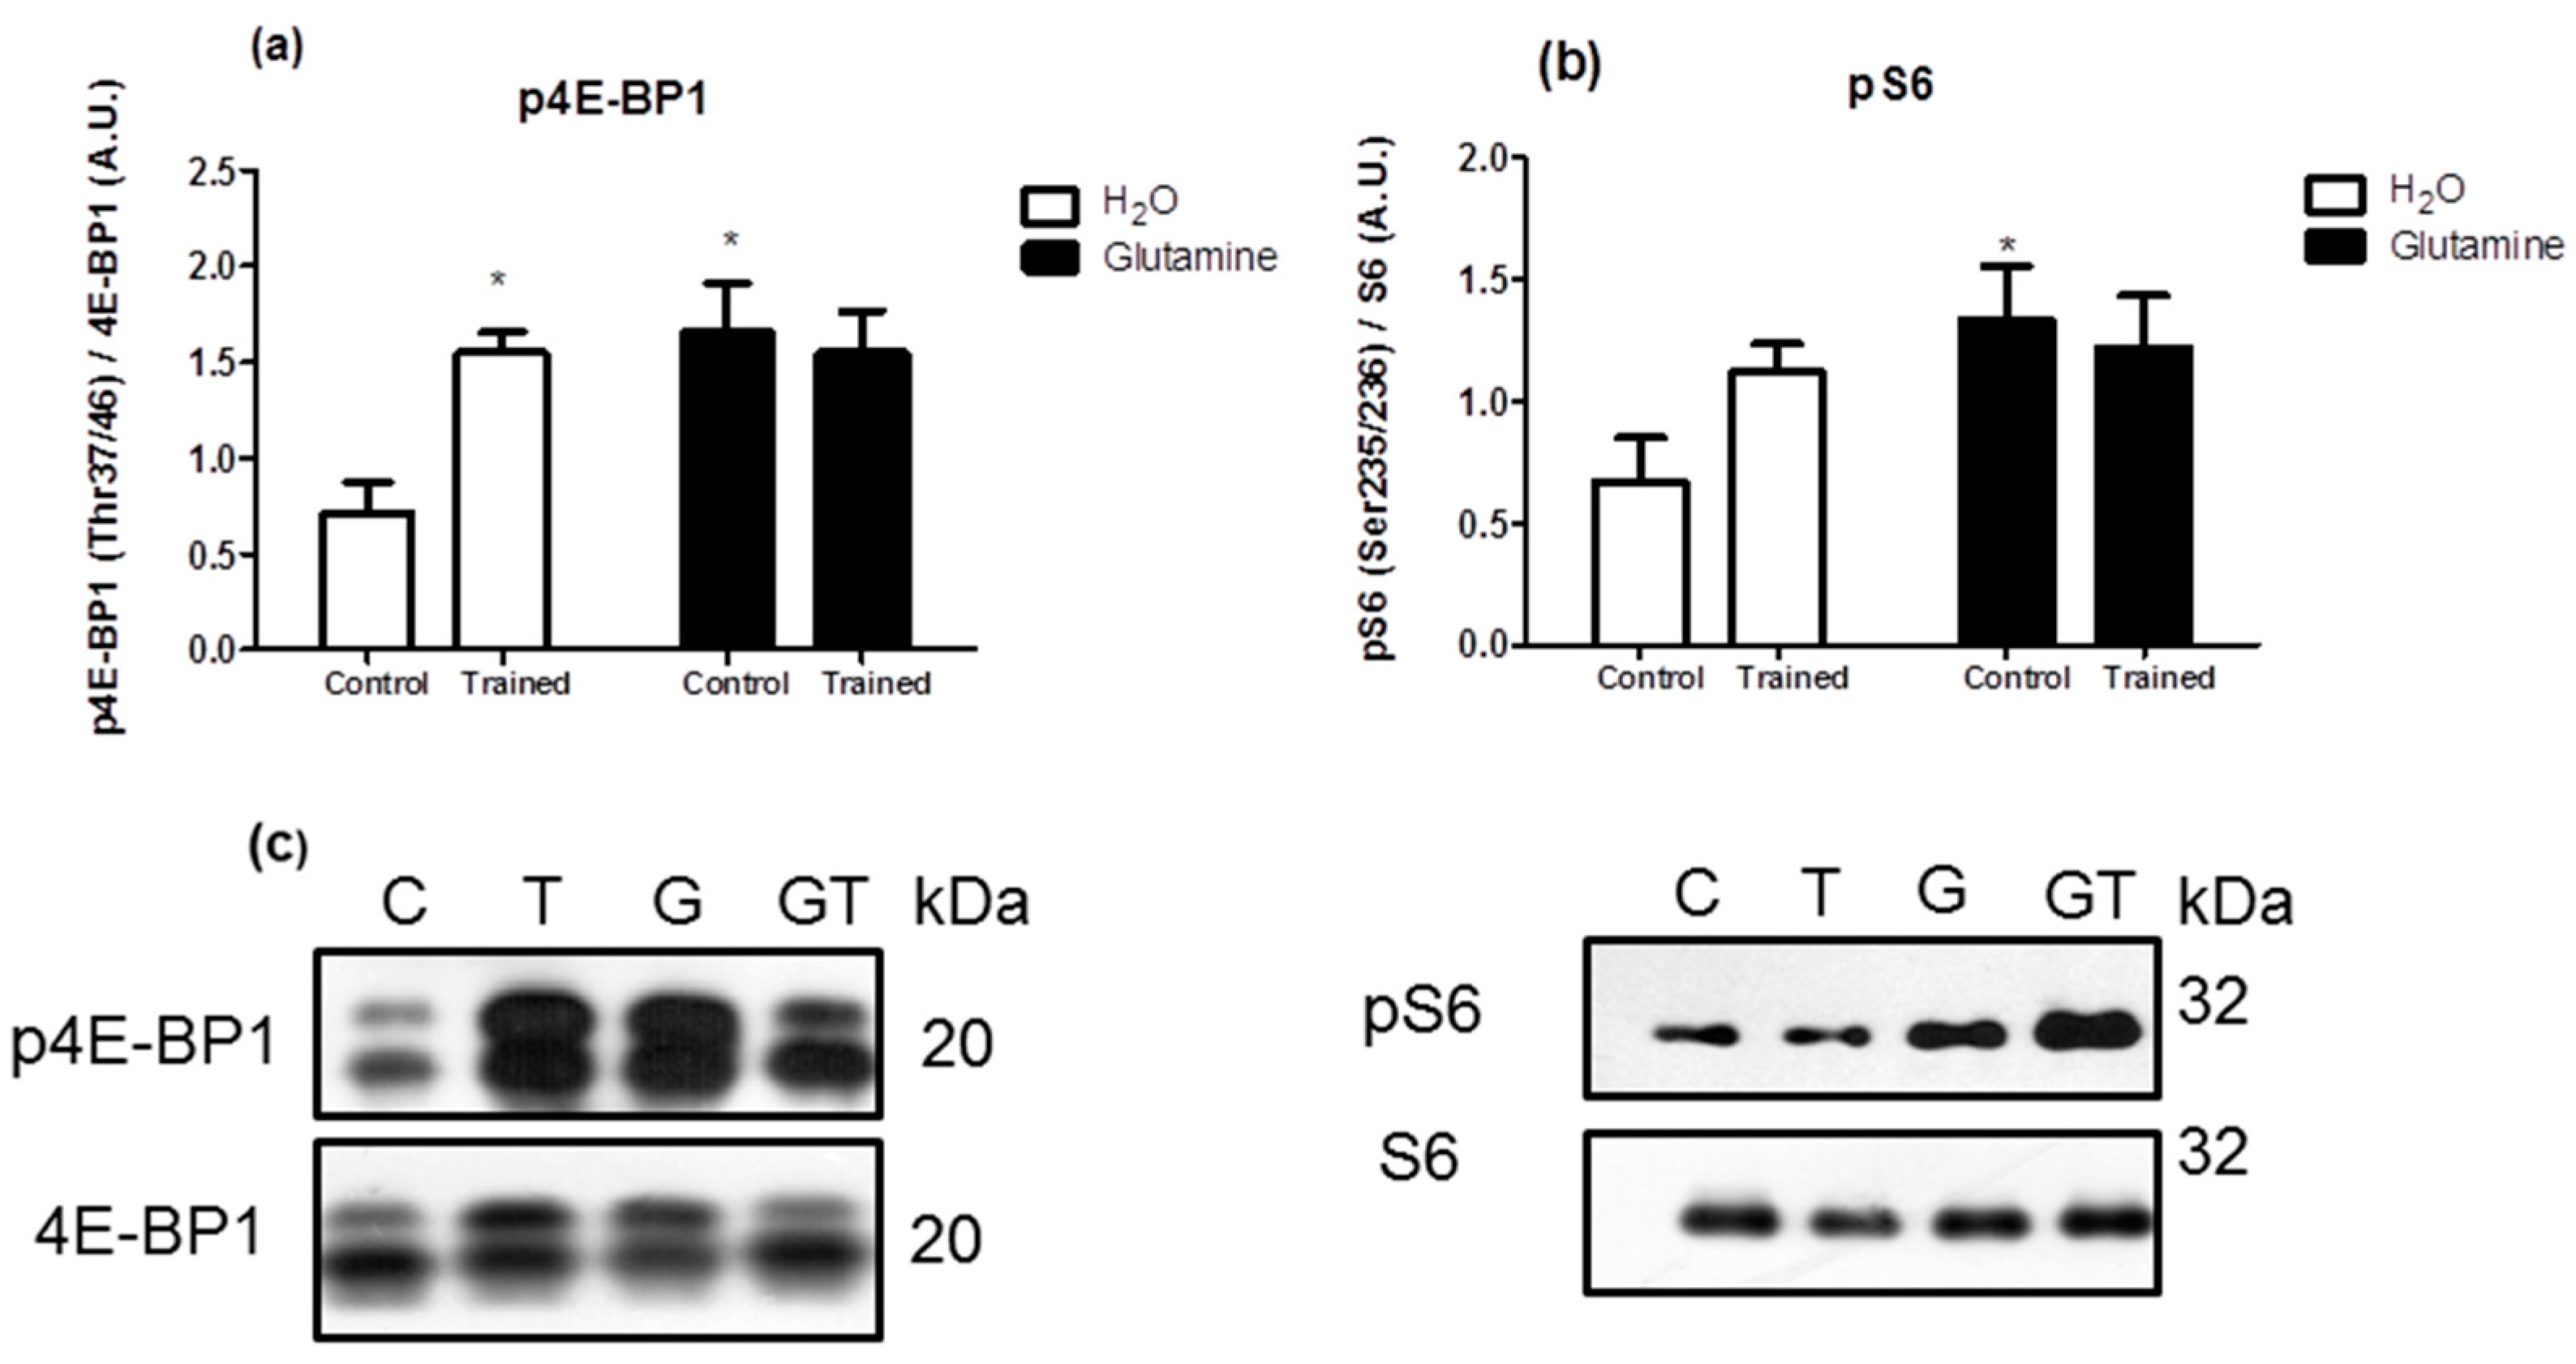
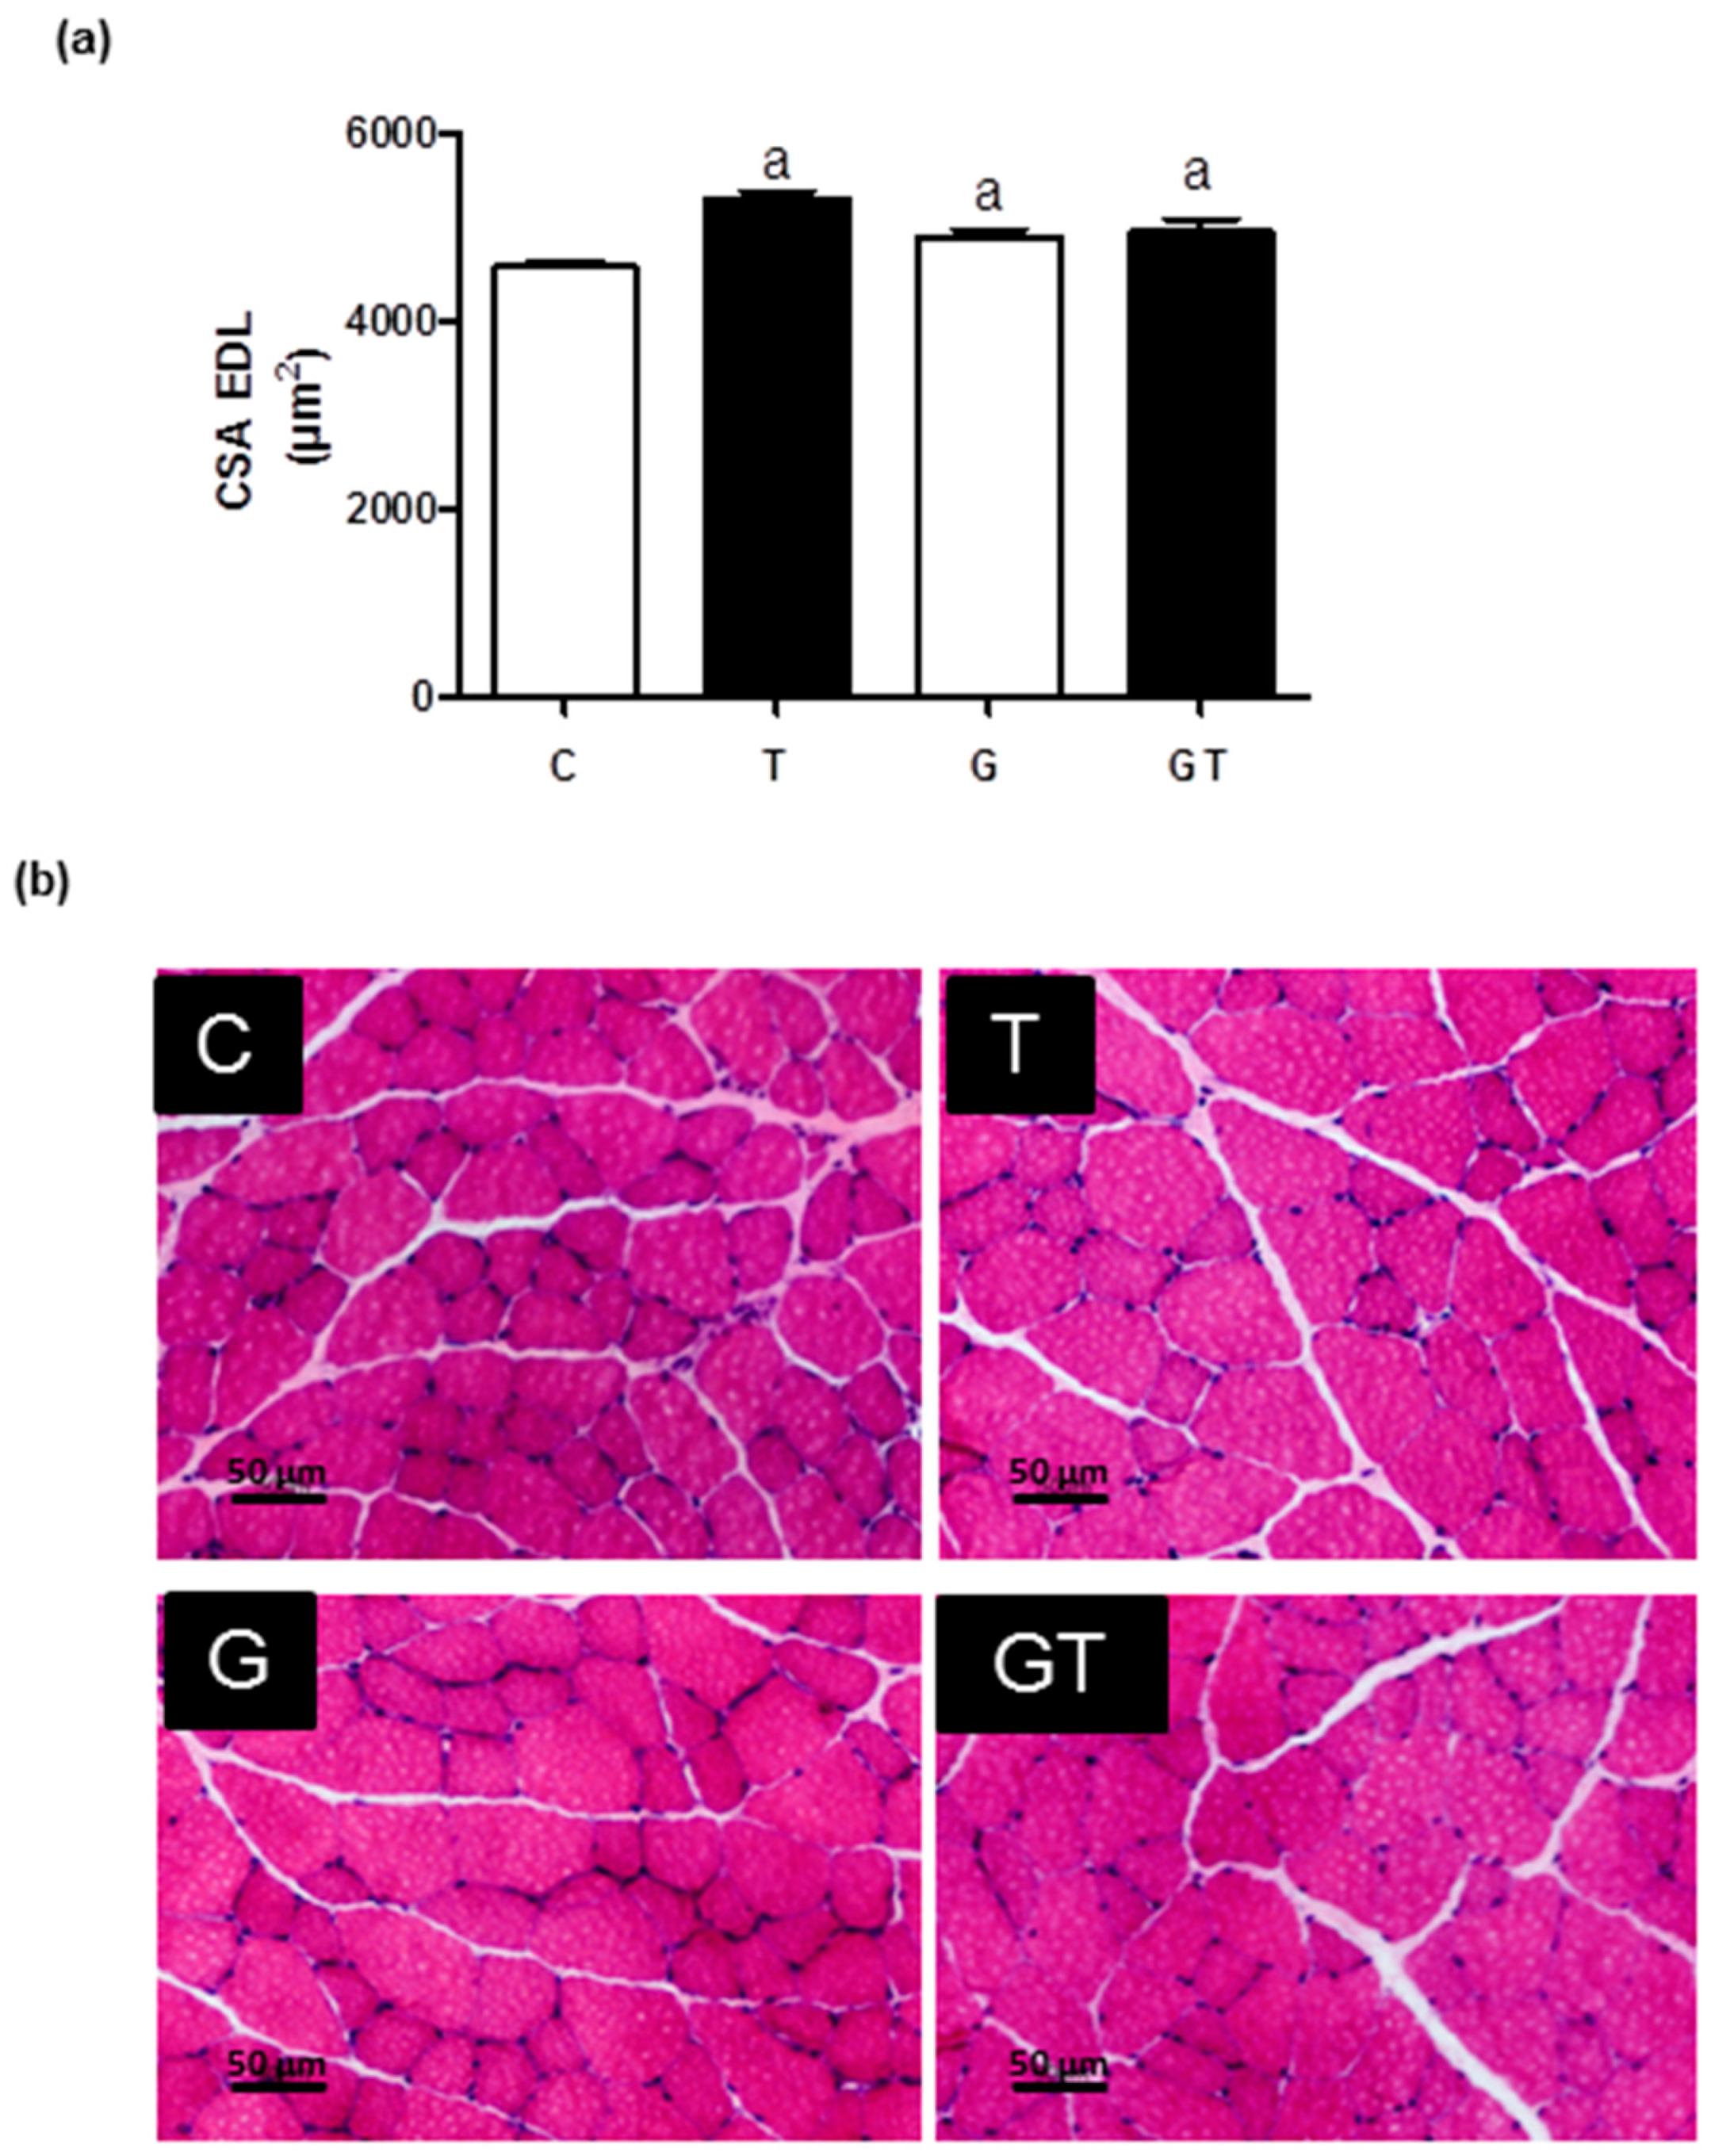
2. Results
3. Discussion
4. Materials and Methods
4.1. Animals
4.2. Resistance Exercise Training (RET) Protocol
4.3. Glutamine Supplementation (GS)
4.4. Determination of Glutamine and Glutamate Contents in EDL Muscle
4.5. Histological Analysis: Fiber Cross-Sectional Area (CSA) Determination of the EDL Muscles
4.6. Real-Time PCR Analysis of IGF-1 and GAPDH mRNA Expression
4.7. Western Blotting
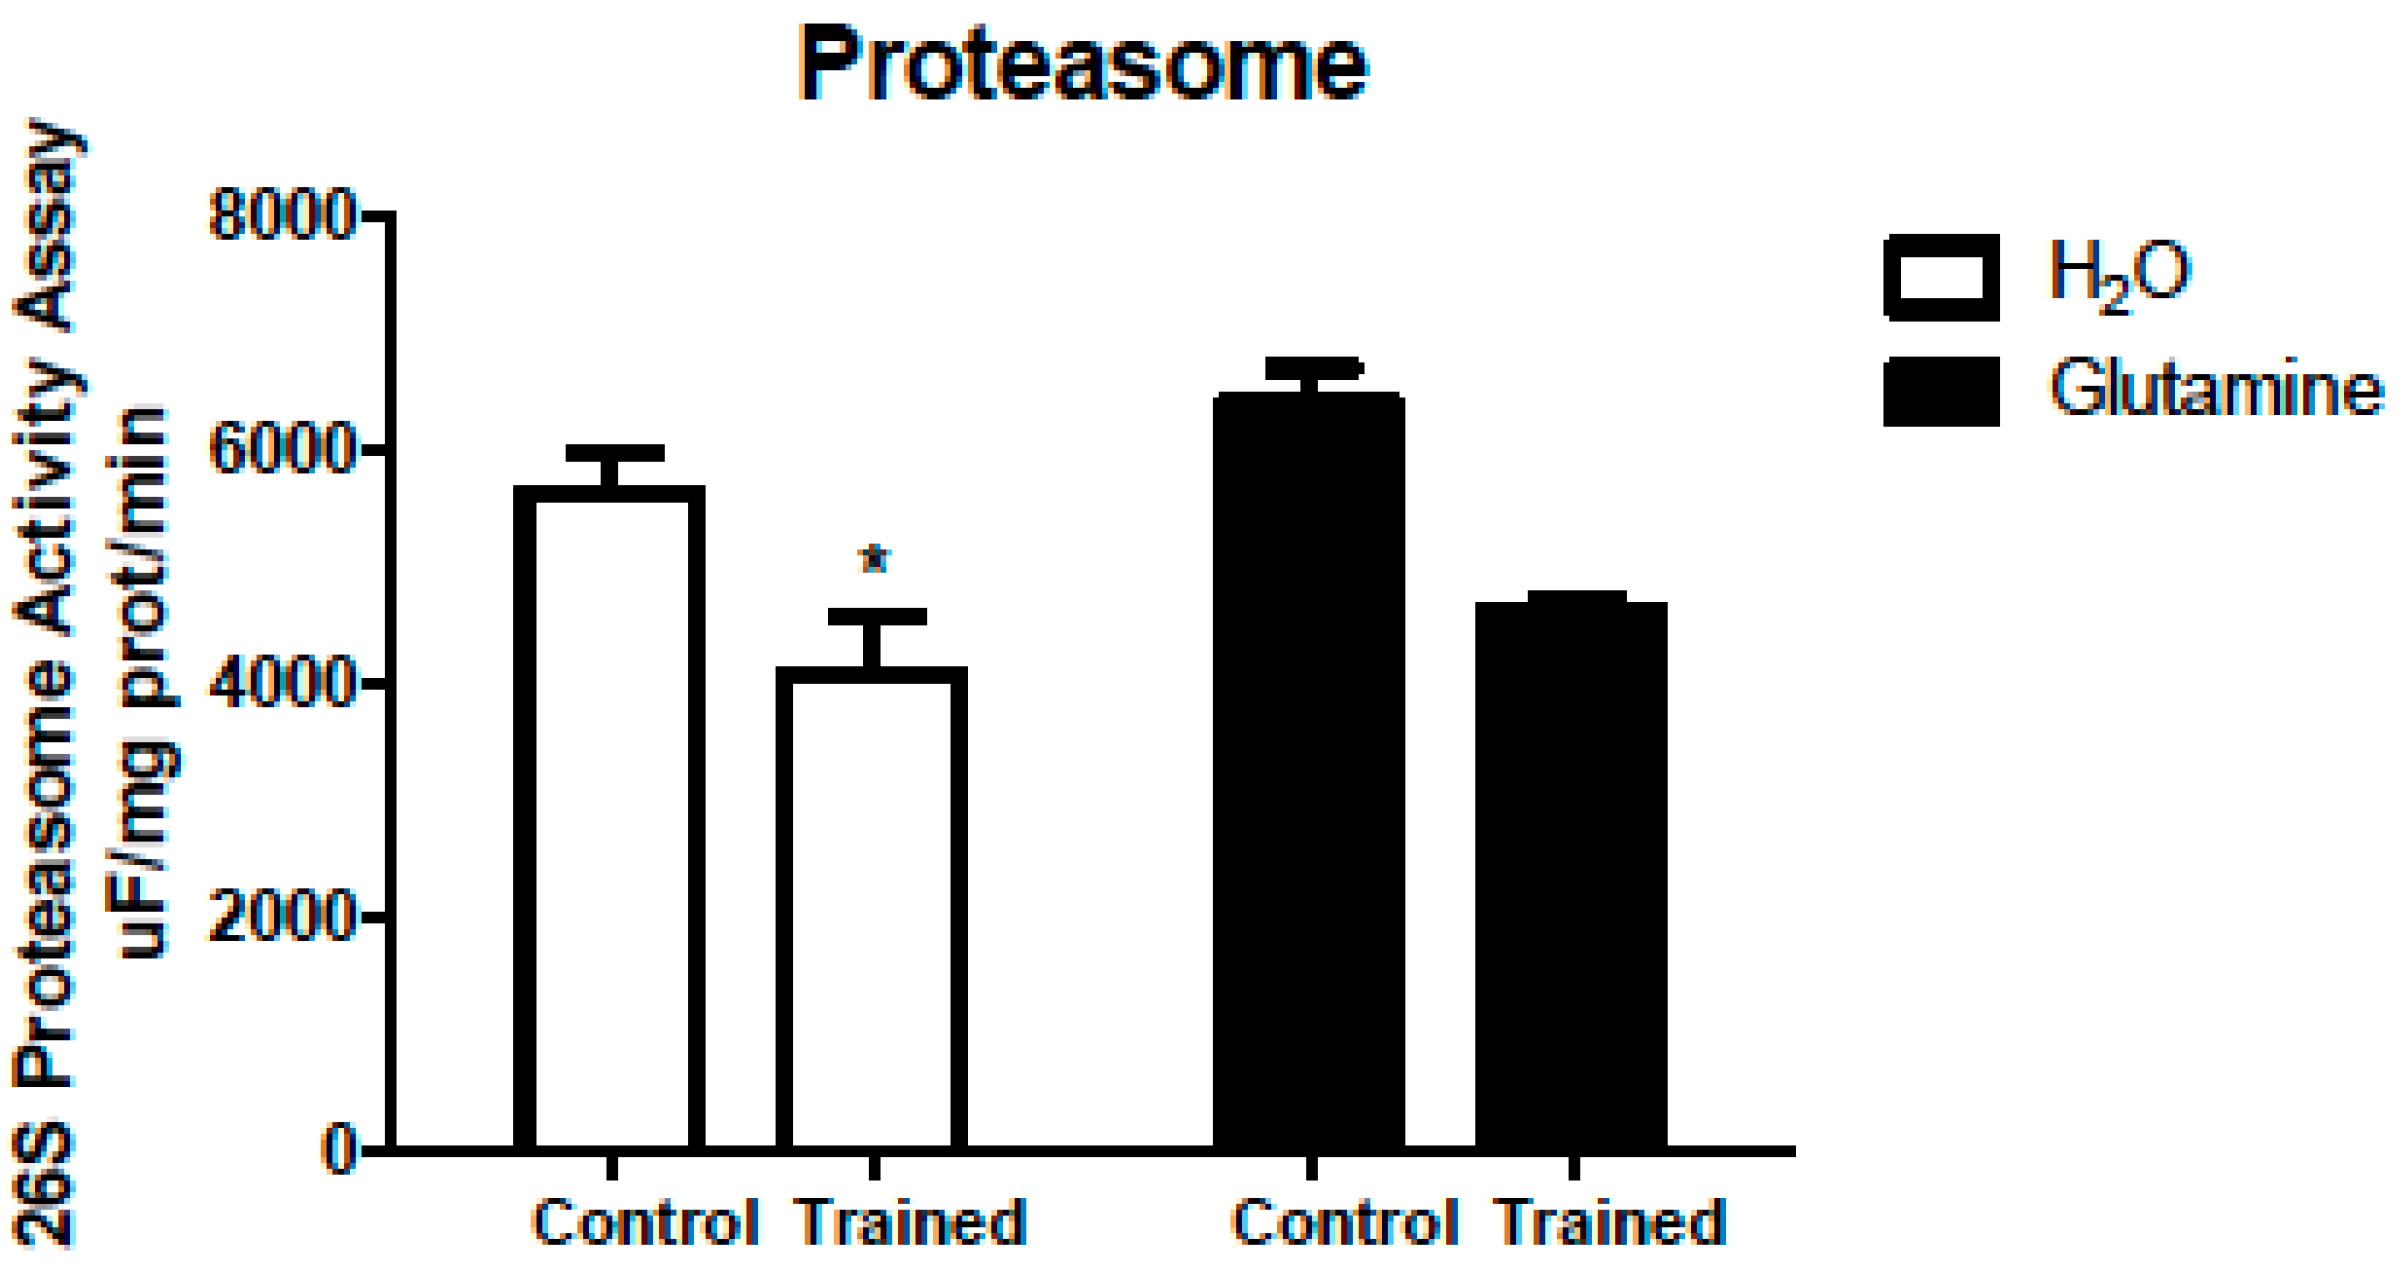
4.8. Proteasome Activity Assay
4.9. Statistical Analysis
5. Conclusions
Supplementary Materials
Author Contributions
Funding
Institutional Review Board Statement
Informed Consent Statement
Data Availability Statement
Acknowledgments
Conflicts of Interest
References
- Klitgaard, H.; Zhou, M.; Richter, E.A. Myosin heavy chain composition of single fibres from m. biceps brachii of male body builders. Acta Physiol. Scand. 1990, 140, 175–180. [Google Scholar] [CrossRef] [PubMed]
- Tamaki, T.; Uchiyama, S.; Nakano, S. A weight-lifting exercise model for inducing hypertrophy in the hindlimb muscles of rats. Med. Sci. Sports Exerc. 1992, 24, 881–886. [Google Scholar] [CrossRef] [PubMed]
- Wong, T.S.; Booth, F.W. Skeletal muscle enlargement with weight-lifting exercise by rats. J. Appl. Physiol. 1988, 65, 950–954. [Google Scholar] [CrossRef]
- Hornberger, T.A.; Farrar, R.P. Physiological hypertrophy of the FHL muscle following 8 weeks of progressive resistance exercise in the rat. Can. J. Appl. Physiol. 2004, 29, 16–31. [Google Scholar] [CrossRef]
- Gordon, E.E.; Kowalski, K.; Fritts, W. Changes in rat muscle fiber with forceful exercises. Arch. Phys. Med. Rehabil. 1967, 48, 577–582. [Google Scholar]
- Jaweed, M.M.; Herbison, G.J.; Ditunno, J.F. Myosin ATPase activity after strengthening exercise. J. Anat. 1977, 124, 371–381. [Google Scholar]
- Klitgaard, H. A model for quantitative strength training of hindlimb muscles of the rat. J. Appl. Physiol. 1998, 64, 1740–1745. [Google Scholar] [CrossRef] [PubMed]
- Yarasheski, K.; Lemon, P.W.; Gilloteaux, J. Effect of heavy-resistance exercise training on muscle fiber composition in young rats. J. Appl. Physiol. 1990, 69, 434–437. [Google Scholar] [CrossRef]
- Garner, R.F.; Terracio, L.; Borh, T.K.; Buggy, J. Intracranial self-stimulation motivates weight-lifting exercise in rats. J. Appl. Physiol. 1991, 71, 1627–1631. [Google Scholar] [CrossRef]
- Heck, R.W.; Mckeever, K.H.; Always, S.E.; Auge, W.K.; Whitehead, R.; Bertone, A.L.; Lombardo, J.A. Resistance training-induced increases in muscle mass and performance in ponies. Med. Sci. Sports Exerc. 1996, 28, 877–883. [Google Scholar] [CrossRef]
- Roy, R.R.; Wilson, R.; Edgerton, V.R. Architectural and mechanical properties of the rat adductor longus: Response to weight-lifting training. Anat. Rec. 1997, 247, 170–178. [Google Scholar] [CrossRef]
- Padilha, C.S.; Cella, P.S.; Ribeiro, A.S.; Voltarelli, F.A.; Testa, M.T.J.; Marinello, P.C.; Iarosz, K.C.; Guirro, P.B.; Deminice, R. Moderate vs high-load resistance training on muscular adaptations in rats. Life Sci. 2019, 238, 116964. [Google Scholar] [CrossRef] [PubMed]
- Yin, L.; Lu, L.; Lin, X.; Wang, X. Crucial role of androgen receptor in resistance and endurance trainings-induced muscle hypertrophy through IGF-1/IGF-1RPI3K/Akt-mTOR pathway. Nutr. Metab. 2020, 17, 26. [Google Scholar] [CrossRef] [PubMed]
- Guttridge, D.C. Signaling pathways weigh in on decisions to make or break skeletal muscle. Curr. Opin. Clin. Nutr. Metab. Care 2004, 4, 443–450. [Google Scholar] [CrossRef]
- Lai, M.V.; Gonzalez, M.; Poueymirou, W.T.; Kline, W.O.; Na, E.; Zlotchenko, E.; Stitt, T.N.; Economides, A.N.; Yancopoulos, G.D.; Glass, D.J. Conditional activation of Akt in adult skeletal muscle induces rapid hypertrophy. Mol. Cell. Biol. 2004, 24, 9295–9304. [Google Scholar] [CrossRef]
- Glass, D.J. Molecular mechanisms modulating muscle mass. Trends Mol. Med. 2003, 8, 344–350. [Google Scholar] [CrossRef]
- Glass, D.J. Skeletal muscle hypertrophy and atrophy signaling pathways. Int. J. Biochem. Cell Biol. 2005, 10, 1974–1984. [Google Scholar] [CrossRef]
- Glass, D.J. Signaling pathways perturbing muscle mass. Clin. Nutr. Metab. Care 2010, 13, 225–229. [Google Scholar] [CrossRef]
- Frost, R.A.; Lang, C.H. mTor signaling in skeletal muscle during sepsis and inflammation: Where does it all go wrong? Physiology 2011, 26, 83–96. [Google Scholar] [CrossRef]
- Marzuca-Nassr, G.N.; Murata, G.M.; Martins, A.R.; Vitzel, K.F.; Crisma, A.R.; Torres, R.P.; Mancini-Filho, J.; Kang, J.X.; Curi, R. Balanced Diet-Fed Fat-1 Transgenic mice exhibit lower hindlimb suspension-induced soleus muscle atrophy. Nutrients 2017, 10, 1100. [Google Scholar] [CrossRef]
- De Vasconcelos, D.A.A.; Giesbertz, P.; de Souza, D.R.; Vitzel, K.F.; Abreu, P.; Marzuca-Nassr, G.N.; Fortes, M.A.S.; Murata, G.M.; Hirabara, S.M.; Curi, R.; et al. Oral L-glutamine pretreatment attenuates skeletal muscle atrophy induced by 24-h fasting in mice. J. Nutr. Biochem. 2019, 70, 202–214. [Google Scholar] [CrossRef] [PubMed]
- Marzuca-Nassr, G.N.; Fortes, M.A.S.; Guimaraes-Ferreira, L.; Murata, G.M.; Vitzel, K.F.; Vasconcelos, D.A.A.; Bassit, R.A.; Curi, R. Short-term creatine supplementation changes protein metabolism signaling in hindlimb suspension. Braz. J. Med. Biol. Res. 2019, 10, 7–52. [Google Scholar] [CrossRef] [PubMed]
- Zheng, L.F.; Chen, P.J.; Xiao, W.H. Signaling pathways controlling skeletal muscle mass. Acta Physiol. 2019, 71, 671–679. [Google Scholar]
- Sugita, H.; Kaneki, M.; Sugita, M.; Yasukawa, T.; Yasuhara, S.; Martyn, J.A.J. Burn injury impairs insulin-stimulated Akt/PKB activation in skeletal muscle. Am. J. Physiol. Endocrinol. Metab. 2005, 288, 585–591. [Google Scholar] [CrossRef]
- Sarbassov, D.; Guertin, D.; Ali, S.; Sabatini, D. Phosphorylation and regulation of Akt/PKB by the rictor-mTORcomplex. Science 2005, 307, 1098–1101. [Google Scholar] [CrossRef]
- Weigl, L.G. Lost in translation: Regulation of skeletal muscle protein synthesis. Curr. Opin. Pharmacol. 2012, 3, 377–382. [Google Scholar] [CrossRef]
- Hara, K.; Maruki, Y.; Long, X.; Yoshino, K.; Oshiro, N.; Hidayat, S.; Tokunaga, C.; Avruch, J.; Yonezawa, K. Raptor, a binding partner of target of rapamycin (TOR), mediates TOR action. Cell 2002, 110, 177–189. [Google Scholar] [CrossRef]
- Proud, C.G. Role of mTOR signaling in the control of translation initiation and elongation by nutrients. Curr. Top. Microbiol. Immunol. 2004, 279, 215–244. [Google Scholar]
- Kimball, S.; Jefferson, L. Regulation of global and specific mRNA translation by oral administration of branched-chain amino acids. Biochem. Res. Commun. 2004, 313, 423–427. [Google Scholar] [CrossRef] [PubMed]
- Escobar, J.; Frank, J.; Suryawan, A.; Nguyen, H.; Kimball, S.; Jefferson, L.; Davis, T. Physiological rise in plasma leucine stimulates muscle protein synthesis in neonatal pigs by enhancing translation initiation factor activation. Am. J. Physiol. Endocrinol. Metab. 2005, 288, 914–921. [Google Scholar] [CrossRef]
- Anthony, J.; Anthony, T.; Kimball, S.; Vary, T.; Jefferson, L. Orally administered leucine stimulates protein synthesis in skeletal muscle of post absorptive rats in association with increased eIF4F formation. J. Nutr. 2000, 130, 139–145. [Google Scholar] [CrossRef]
- Bodine, S.C.; Latres, E.; Baumhueter, S.; Lai, V.K.; Nunez, L.; Clarke, B.A.; Poueymirou, W.T.; Panaro, F.J.; Na, E.; Dharmarajan, K.; et al. Identification of ubiquitin ligases required for skeletal muscle atrophy. Science 2001, 294, 1704–1708. [Google Scholar] [CrossRef] [PubMed]
- Schiaffino, S.; Mammucari, C. Regulation of skeletal muscle growth by the IGF1-Akt/PKB pathway: Insights from genetic models. Skelet. Muscle 2011, 24, 4. [Google Scholar] [CrossRef] [PubMed]
- Gomes, M.D.; Lecker, S.H.; Jagoe, R.T. Atrogin-1, a muscle-specific F-box protein highly expressed during muscle atrophy. Proc. Natl. Acad. Sci. USA 2001, 98, 14440–14445. [Google Scholar] [CrossRef] [PubMed]
- Pasiakos, S.M. Exercise and amino acid anabolic cell signaling and the regulation of skeletal muscle mass. Nutrients 2012, 7, 740–758. [Google Scholar] [CrossRef]
- Nicklin, P.; Bergman, P.; Zhang, B.; Triantafellow, E.; Wang, H.; Nyfeler, B.; Yang, H.; Hild, M.; Kung, C.; Wilson, C. Bidirectional transport of amino acids regulates mTOR and autophagy. Cell 2009, 136, 521–534. [Google Scholar] [CrossRef]
- Durán, R.V.; Oppliger, W.; Robitaille, A.M.; Heiserich, L.; Skendaj, R.; Gottlieb, E.; HALL, M.N. Glutaminolysis activates rag-mTORC1 signaling. Mol. Cell 2012, 47, 349–358. [Google Scholar] [CrossRef]
- Kim, S.G.; Hoffman, G.R.; Poulogiannis, G.; Buel, G.R.; Jang, Y.J.; Lee, K.W.; Kim, B.Y.; Erikson, R.L.; Cantley, L.C.; Choo, A.Y.; et al. Metabolic stress controls mTORC1 lysosomal localization and dimerization by regulating the TTT-RUVBL1/2 complex. Mol. Cell 2013, 49, 172–185. [Google Scholar] [CrossRef]
- Tajan, M.; Hock, A.K.; Blagih, J.; Robertson, N.A.; Labuschagne, C.F.; Kruiswijk, F.; Humpton, T.J.; Adams, P.D.; Vousden, K.H. A Role for p53 in the Adaptation to Glutamine Starvation Through the Expression of SLC1A3. Cell Metab. 2018, 28, 721–736. [Google Scholar] [CrossRef]
- Song, W.; Li, D.; Tao, L.; Luo, Q.; Chen, L. Solute carrier transporters: The metabolic gatekeepers of immune cells. Acta Pharm. Sin. B 2020, 10, 61–78. [Google Scholar]
- Lambertucci, A.C.; Lambertucci, R.H.; Hirabara, S.M.; Curi, R.; Moriscot, A.S.; Alba-Loureiro, T.C.; Guimarães-ferreira, L.; Levada-Pires, A.C.; Vasconcelos, D.A.; Sellitti, D.F.; et al. Glutamine supplementation stimulates protein-synthetic and inhibits protein-degradative signaling pathways in skeletal muscle of diabetic rats. PLoS ONE 2012, 12, 50–90. [Google Scholar] [CrossRef] [PubMed]
- Peres, F.P.; Levada-Pires, A.C.; Vieira, M.; Hatanaka, E.; Cury-Boaventura, M.F.; Folador, A.; Gorjão, R.; Hirabara, S.M.; Santos-Silva, P.; Deuster, P.; et al. Hydrolyzed whey protein enriched with glutamine dipeptide attenuates skeletal muscle damage and improves physical exhaustion test performance in triathletes. Front. Sports Act. Living 2023, 4, 1011240. [Google Scholar] [PubMed]
- Neu, J.; Shenoy, V.; Chakrabarti, R. Glutamine nutrition and metabolism: Where do we go from here? FASEB J. 1996, 8, 29–37. [Google Scholar] [CrossRef] [PubMed]
- Newsholme, P.; Procopio, J.; Lima, M.M.; Pithon-Curi, T.C.; Curi, R. Glutamine and glutamate—Their central role in cell metabolism and function. Cell Biochem. 2003, 21, 1–9. [Google Scholar] [CrossRef] [PubMed]
- Newsholme, P.; Lima, M.M.; Procopio, J.; Pithon-Curi, T.C.; Doi, S.Q.; Bazotte, R.B.; Curi, R. Glutamine and glutamate as vital metabolites. J. Med. Biol. Res. 2003, 36, 153–163. [Google Scholar] [CrossRef]
- Schiaffino, S.; Reggiani, C. Fiber types in mammalian skeletal muscles. Physiol. Rev. 2011, 91, 1447–1531. [Google Scholar]
- Duncan, N.D.; Williams, D.A.; Lynch, G.S. Adaptations in rat skeletal muscle following long-term resistance exercise training. Eur. J. Appl. Physiol. 1998, 77, 372–378. [Google Scholar] [CrossRef]
- Kelty, T.J.; Schachtman, T.R.; Mao, X.; Grigsby, K.B.; Childs, T.E.; Olver, T.D.; Michener, P.N.; Richardson, R.A.; Roberts, C.K.; Booth, F.W. Resistance-exercise Training Ameliorates LPS-induced Cognitive Impairment Concurrent with Molecular Signaling Changes in the Rat Dentate Gyrus. J. Appl. Physiol. 2019, 127, 254–263. [Google Scholar] [CrossRef]
- Marni, D.B.; Ziad, S.M. Integrin signaling: Linking mechanical stimulation to skeletal muscle hypertrophy. Am. J. Physiol. Cell Physiol. 2019, 317, 629–641. [Google Scholar]
- Coeffier, M.; Claeyssens, S.; Hecketsweiler, B.; Lavoinne, A.; Ducrotté, P.; Déchelotte, P. Enteral glutamine stimulates protein synthesis and decreases ubiquitin mRNA level in human gut mucosa. Am. J. Physiol. Gastrointest. Liver Physiol. 2003, 285, 266–273. [Google Scholar] [CrossRef]
- Boza, J.J.; Turini, M.; Moënnoz, D.; Montigon, F.; Vuichoud, J.; Gueissaz, N.; Gremaud, G.; Pouteau, E.; Piguet-welsch, C.; Finot, P.A.; et al. Effect of glutamine supplementation of the diet on tissue protein synthesis rate of glucocorticoid-treated rats. Nutrition 2001, 17, 35–40. [Google Scholar] [CrossRef] [PubMed]
- Zanchi, N.E.; de Siqueira filho, M.A.; Lira, F.S.; Rosa, J.C.; Yamashita, A.S.; de Oliveira Carvalho, C.R.; Seelaender, M.; Lancha-Jr, A.H. Chronic resistance training decreases MuRF-1 and Atrogin-1 gene expression but does not modify Akt, GSK-3beta and p70S6K levels in rats. Eur. J. Appl. Physiol. 2009, 106, 415–423. [Google Scholar] [CrossRef] [PubMed]
- Chaillou, T.; Sanna, I.; Kadi, F. Glutamine-stimulated in vitro hypertrophy is preserved in muscle cells from older women. Mech. Ageing Dev. 2020, 187, 1112–1128. [Google Scholar] [CrossRef] [PubMed]
- Saha, A.K.; Xu, X.J.; Lawson, E.; De Oliveira, R.; Brandon, A.E.; Kraegen, E.W.; Ruderman, N.B. Downregulation of AMPK accompanies leucine- and glucose-induced increases in protein synthesis and insulin resistance in rat skeletal muscle. Diabetes 2010, 59, 2426–2434. [Google Scholar] [CrossRef]
- Murgas, T.R.; Suryawan, A.; Gazzaneo, M.C.; Orellana, R.A.; Frank, J.W.; Nguyen, H.V.; Fiorotto, M.L.; El-kadi, S.; Davis, T.A. Leucine supplementation of a low-protein meal increases skeletal muscle and visceral tissue protein synthesis in neonatal pigs by stimulating mTOR-dependent translation initiation 1,2. J. Nutr. 2010, 140, 2145–2152. [Google Scholar] [CrossRef]
- Suryawan, A.; Orellana, R.A.; Fiorotto, M.L.; Davis, T.A. Triennial growth symposium: Leucine acts as a nutrient signal to stimulate protein synthesis in neonatal pigs. J. Anim. Sci. 2011, 89, 2004–2016. [Google Scholar] [CrossRef]
- Lim, C.; Gil, J.H.; Quan, H.; Viet, D.H.; Kim, C.K. Effect of 8-week leucine supplementation and resistance exercise training on muscle hypertrophy and satellite cell activation in rats. Physiol. Rep. 2018, 12, 13–25. [Google Scholar] [CrossRef]
- Ellis, A.C.; Hunter, G.R.; Goss, A.M.; Gower, B.A. Oral Supplementation with beta-hydroxy-beta-methylbutyrate, arginine, and glutamine improves lean body mass in healthy older adults. J. Diet. Suppl. 2019, 16, 281–293. [Google Scholar] [CrossRef]
- Yao, K.; Yin, Y.L.; Chu, W.; Liu, Z.; Deng, D.; Li, T.; Huang, R.; Zhang, J.; Tan, B.; Wang, W.; et al. Dietary arginine supplementation increases mTOR signaling activity in skeletal muscle of neonatal pigs. J. Nutr. 2008, 138, 867–872. [Google Scholar] [CrossRef]
- Zoncu, R.; Efeyan, A.; Sabatini, D.M. mTOR: From growth signal integration to cancer, diabetes and ageing. Nat. Rev. Mol. Cell Biol. 2011, 12, 21–35. [Google Scholar]
- MacLennan, P.A.; Smith, K.; Weryk, B.; Watt, P.W.; Rennie, M.J. Inhibition of protein breakdown by glutamine in perfused rat skeletal muscle. FEBS Lett. 1988, 237, 133–136. [Google Scholar] [CrossRef] [PubMed]
- MacLennan, P.A.; Brown, R.A.; Rennie, M.J. A positive relationship between protein synthetic rate and intracellular glutamine concentration in perfused rat skeletal muscle. FEBS Lett. 1987, 215, 187–191. [Google Scholar] [CrossRef] [PubMed]
- De Vasconcelos, D.A.A.; Giesbertz, P.; Murata, G.M.; de Souza, D.R.; Fiamoncini, J.; Duque-Guimaraes, D.; Leandro, C.G.; Hirabara, S.M.; Daniel, H.; Curi, R.; et al. Myotube protein content associates with intracellular L-glutamine levels. Cell Physiol. Biochem. 2019, 53, 200–214. [Google Scholar] [PubMed]
- Dohl, J.; Passos, M.E.P.; Foldi, J.; Chen, Y.; Pithon-Curi, T.; Curi, R.; Gorjao, R.; Deuster, P.A.; Yu, T. Glutamine depletion disrupts mitochondrial integrity and impairs C2C12 myoblast proliferation, differentiation, and the heat-shock response. Nutr. Res. 2020, 84, 42–52. [Google Scholar] [CrossRef]
- Weng, S.T.H.; Sim, A.Y.L.; Long, Y.C. Glutamine Metabolism Regulates Autophagy-Dependent mTORC1 Reactivation During Amino Acid Starvation. Nat. Commun. 2017, 8, 338. [Google Scholar]
- Souza, D.R.; de Vasconcelos, D.A.A.; Murata, G.M.; Fortes, M.A.S.; Marzuca-Nassr, G.N.; Levada-Pires, A.C.; Vitzel, K.F.; Abreu, P.; Scervino, M.V.M.; Hirabara, S.M.; et al. Glutamine supplementation versus functional overload in extensor digitorum longus muscle hypertrophy. PharmaNutrition 2020, 14, 236. [Google Scholar] [CrossRef]
- Amirato, G.R.; Borges, J.O.; Marques, D.L.; Santos, J.M.B.; Santos, C.A.F.; Andrade, M.S.; Furtado, G.E.; Rossi, M.; Luis, L.N.; Zambonatto, R.F.; et al. L-Glutamine Supplementation Enhances Strength and Power of Knee Muscles and Improves Glycemia Control and Plasma Redox Balance in Exercising Elderly Women. Nutrients 2021, 13, 1025. [Google Scholar] [CrossRef]
- Rogero, M.M.; Tirapegui, J.O.; Pedrosa, R.G.; Castro, I.A.; Pires, I.S. Plasma and tissue glutamine response to acute and chronic supplementation with L-glutamine and L-alanyl-L-glutamine in rats. Nutr. Res. 2004, 24, 261–270. [Google Scholar] [CrossRef]
- Hirabara, S.M.; Folador, A.; Fiamoncini, J.; Lambertucci, R.H.; Rodrigues, C.F., Jr.; Rocha, M.S.; Aikawa, J.; Yamazaki, R.K.; Martins, A.R.; Rodrigues, A.C.; et al. Fish oil supplementation for two generations increases insulin sensitivity in rats. J. Nutr. Biochem. 2013, 24, 1136–1145. [Google Scholar] [CrossRef]
- Yonamine, C.Y.; Teixeira, S.S.; Campello, R.S.; Gerlinger-Romero, F.; Rodrigues, C.F.; Guimarães-Ferreira, L.; Machado, U.F.; Nunes, M.T. Beta Hydroxy Beta Methylbutyrate Supplementation impairs peripheral insulin sensitivity in healthy sedentary wistar rats. Acta Physiol. 2014, 212, 62–74. [Google Scholar] [CrossRef]
- Churchill, E.N.; Ferreira, J.C.; Brum, P.C.; Szweda, L.I.; Mochly-Rosen, D. Ischaemic preconditioning improves proteasomal activity and increases the degradation of delta PKC during reperfusion. Cardiovasc. Res. 2010, 85, 385–394. [Google Scholar] [CrossRef] [PubMed]


| Gene | Primer Sense (Forward) | Primer Antisense (Reverse) |
|---|---|---|
| IGF1 | 5′-AAGCCTACAAAGTCAGCTCG- 3′ | 5′-GGTCTTGTTTCCTGCACTT-3′ |
| GAPDH | 5′-GATGGGTGTGAACCACGAGAAA-3′ | 5′-ACGGATACATTGGGGGTAGGA-3′ |
Disclaimer/Publisher’s Note: The statements, opinions and data contained in all publications are solely those of the individual author(s) and contributor(s) and not of MDPI and/or the editor(s). MDPI and/or the editor(s) disclaim responsibility for any injury to people or property resulting from any ideas, methods, instructions or products referred to in the content. |
© 2023 by the authors. Licensee MDPI, Basel, Switzerland. This article is an open access article distributed under the terms and conditions of the Creative Commons Attribution (CC BY) license (https://creativecommons.org/licenses/by/4.0/).
Share and Cite
Rodrigues Junior, C.F.; Murata, G.M.; Gerlinger-Romero, F.; Nachbar, R.T.; Marzuca-Nassr, G.N.; Gorjão, R.; Vitzel, K.F.; Hirabara, S.M.; Pithon-Curi, T.C.; Curi, R. Changes in Skeletal Muscle Protein Metabolism Signaling Induced by Glutamine Supplementation and Exercise. Nutrients 2023, 15, 4711. https://doi.org/10.3390/nu15224711
Rodrigues Junior CF, Murata GM, Gerlinger-Romero F, Nachbar RT, Marzuca-Nassr GN, Gorjão R, Vitzel KF, Hirabara SM, Pithon-Curi TC, Curi R. Changes in Skeletal Muscle Protein Metabolism Signaling Induced by Glutamine Supplementation and Exercise. Nutrients. 2023; 15(22):4711. https://doi.org/10.3390/nu15224711
Chicago/Turabian StyleRodrigues Junior, Carlos Flores, Gilson Masahiro Murata, Frederico Gerlinger-Romero, Renato Tadeu Nachbar, Gabriel Nasri Marzuca-Nassr, Renata Gorjão, Kaio Fernando Vitzel, Sandro Massao Hirabara, Tania Cristina Pithon-Curi, and Rui Curi. 2023. "Changes in Skeletal Muscle Protein Metabolism Signaling Induced by Glutamine Supplementation and Exercise" Nutrients 15, no. 22: 4711. https://doi.org/10.3390/nu15224711
APA StyleRodrigues Junior, C. F., Murata, G. M., Gerlinger-Romero, F., Nachbar, R. T., Marzuca-Nassr, G. N., Gorjão, R., Vitzel, K. F., Hirabara, S. M., Pithon-Curi, T. C., & Curi, R. (2023). Changes in Skeletal Muscle Protein Metabolism Signaling Induced by Glutamine Supplementation and Exercise. Nutrients, 15(22), 4711. https://doi.org/10.3390/nu15224711