
The Antioxidant and Anti-Inflammatory Effects of the Main Carotenoids from Tomatoes via Nrf2 and NF-κB Signaling Pathways


Abstract
:1. Introduction
2. Materials and Methods
2.1. Materials
2.2. Sample Preparation
2.3. HPLC
2.4. Cell Culture and Treatment
2.5. Cell Viability
2.6. Production of Reactive Oxygen Species (ROS)
2.6.1. Confocal Laser Method
2.6.2. Production of Reactive Oxygen Species (ROS)
2.7. SOD and GPX Assays
2.8. iNOS Assays
2.9. Extraction of the Whole-Cell Protein, Cytosolic Protein, and Nuclear Protein
2.10. siRNA Interference Technique Silencing the Expression of TGF-β1/IL-10 Gene
2.11. The Gene Expression Levels of Nrf2 Pathway and NF-κB Pathway after Gene Silencing Were Determined by Q-PCR
2.12. Western Blot Analysis
2.13. Statistical Analysis
3. Results
3.1. Extraction and Identification of the Major Carotenoids from Tomatoes
3.2. Effects of Lutein, Lycopene, and Tomato Extract on the Viability of H9c2 Cells
3.3. Effects of Lutein, Lycopene, and Tomato Extract on ROS Levels in H9c2 Cells
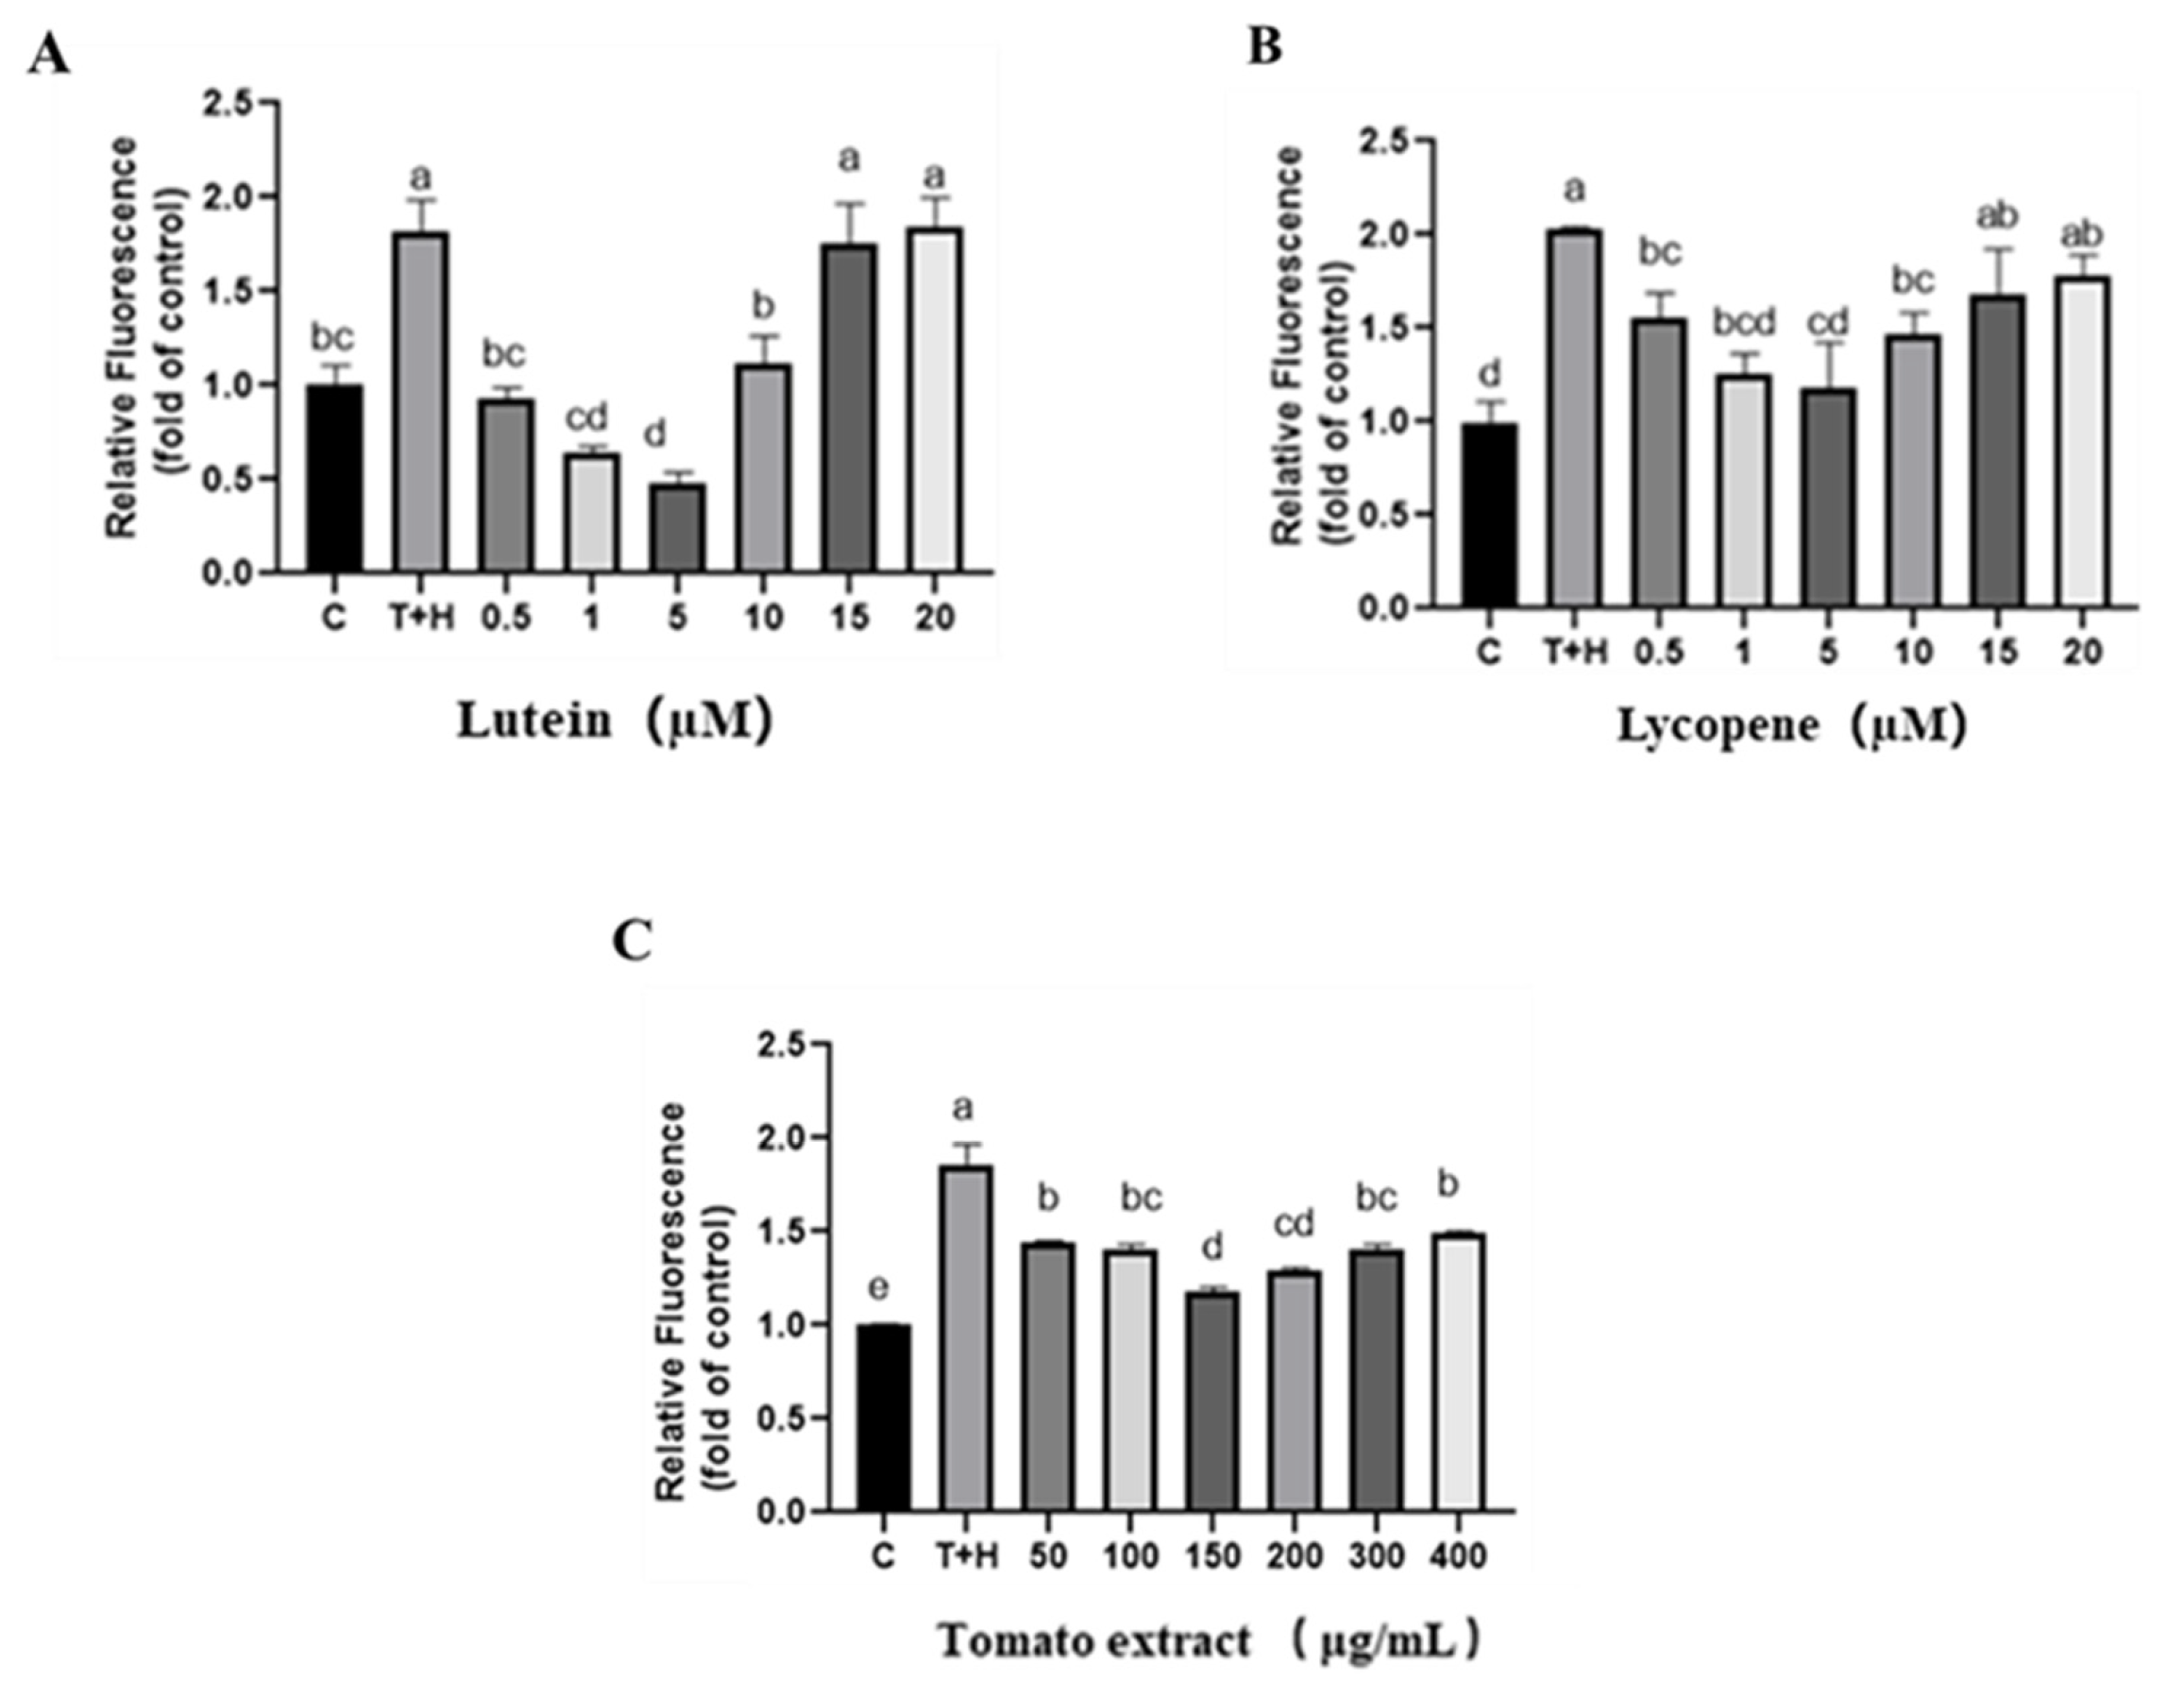
3.3.1. Confocal Laser Method for the Intracellular ROS Detection
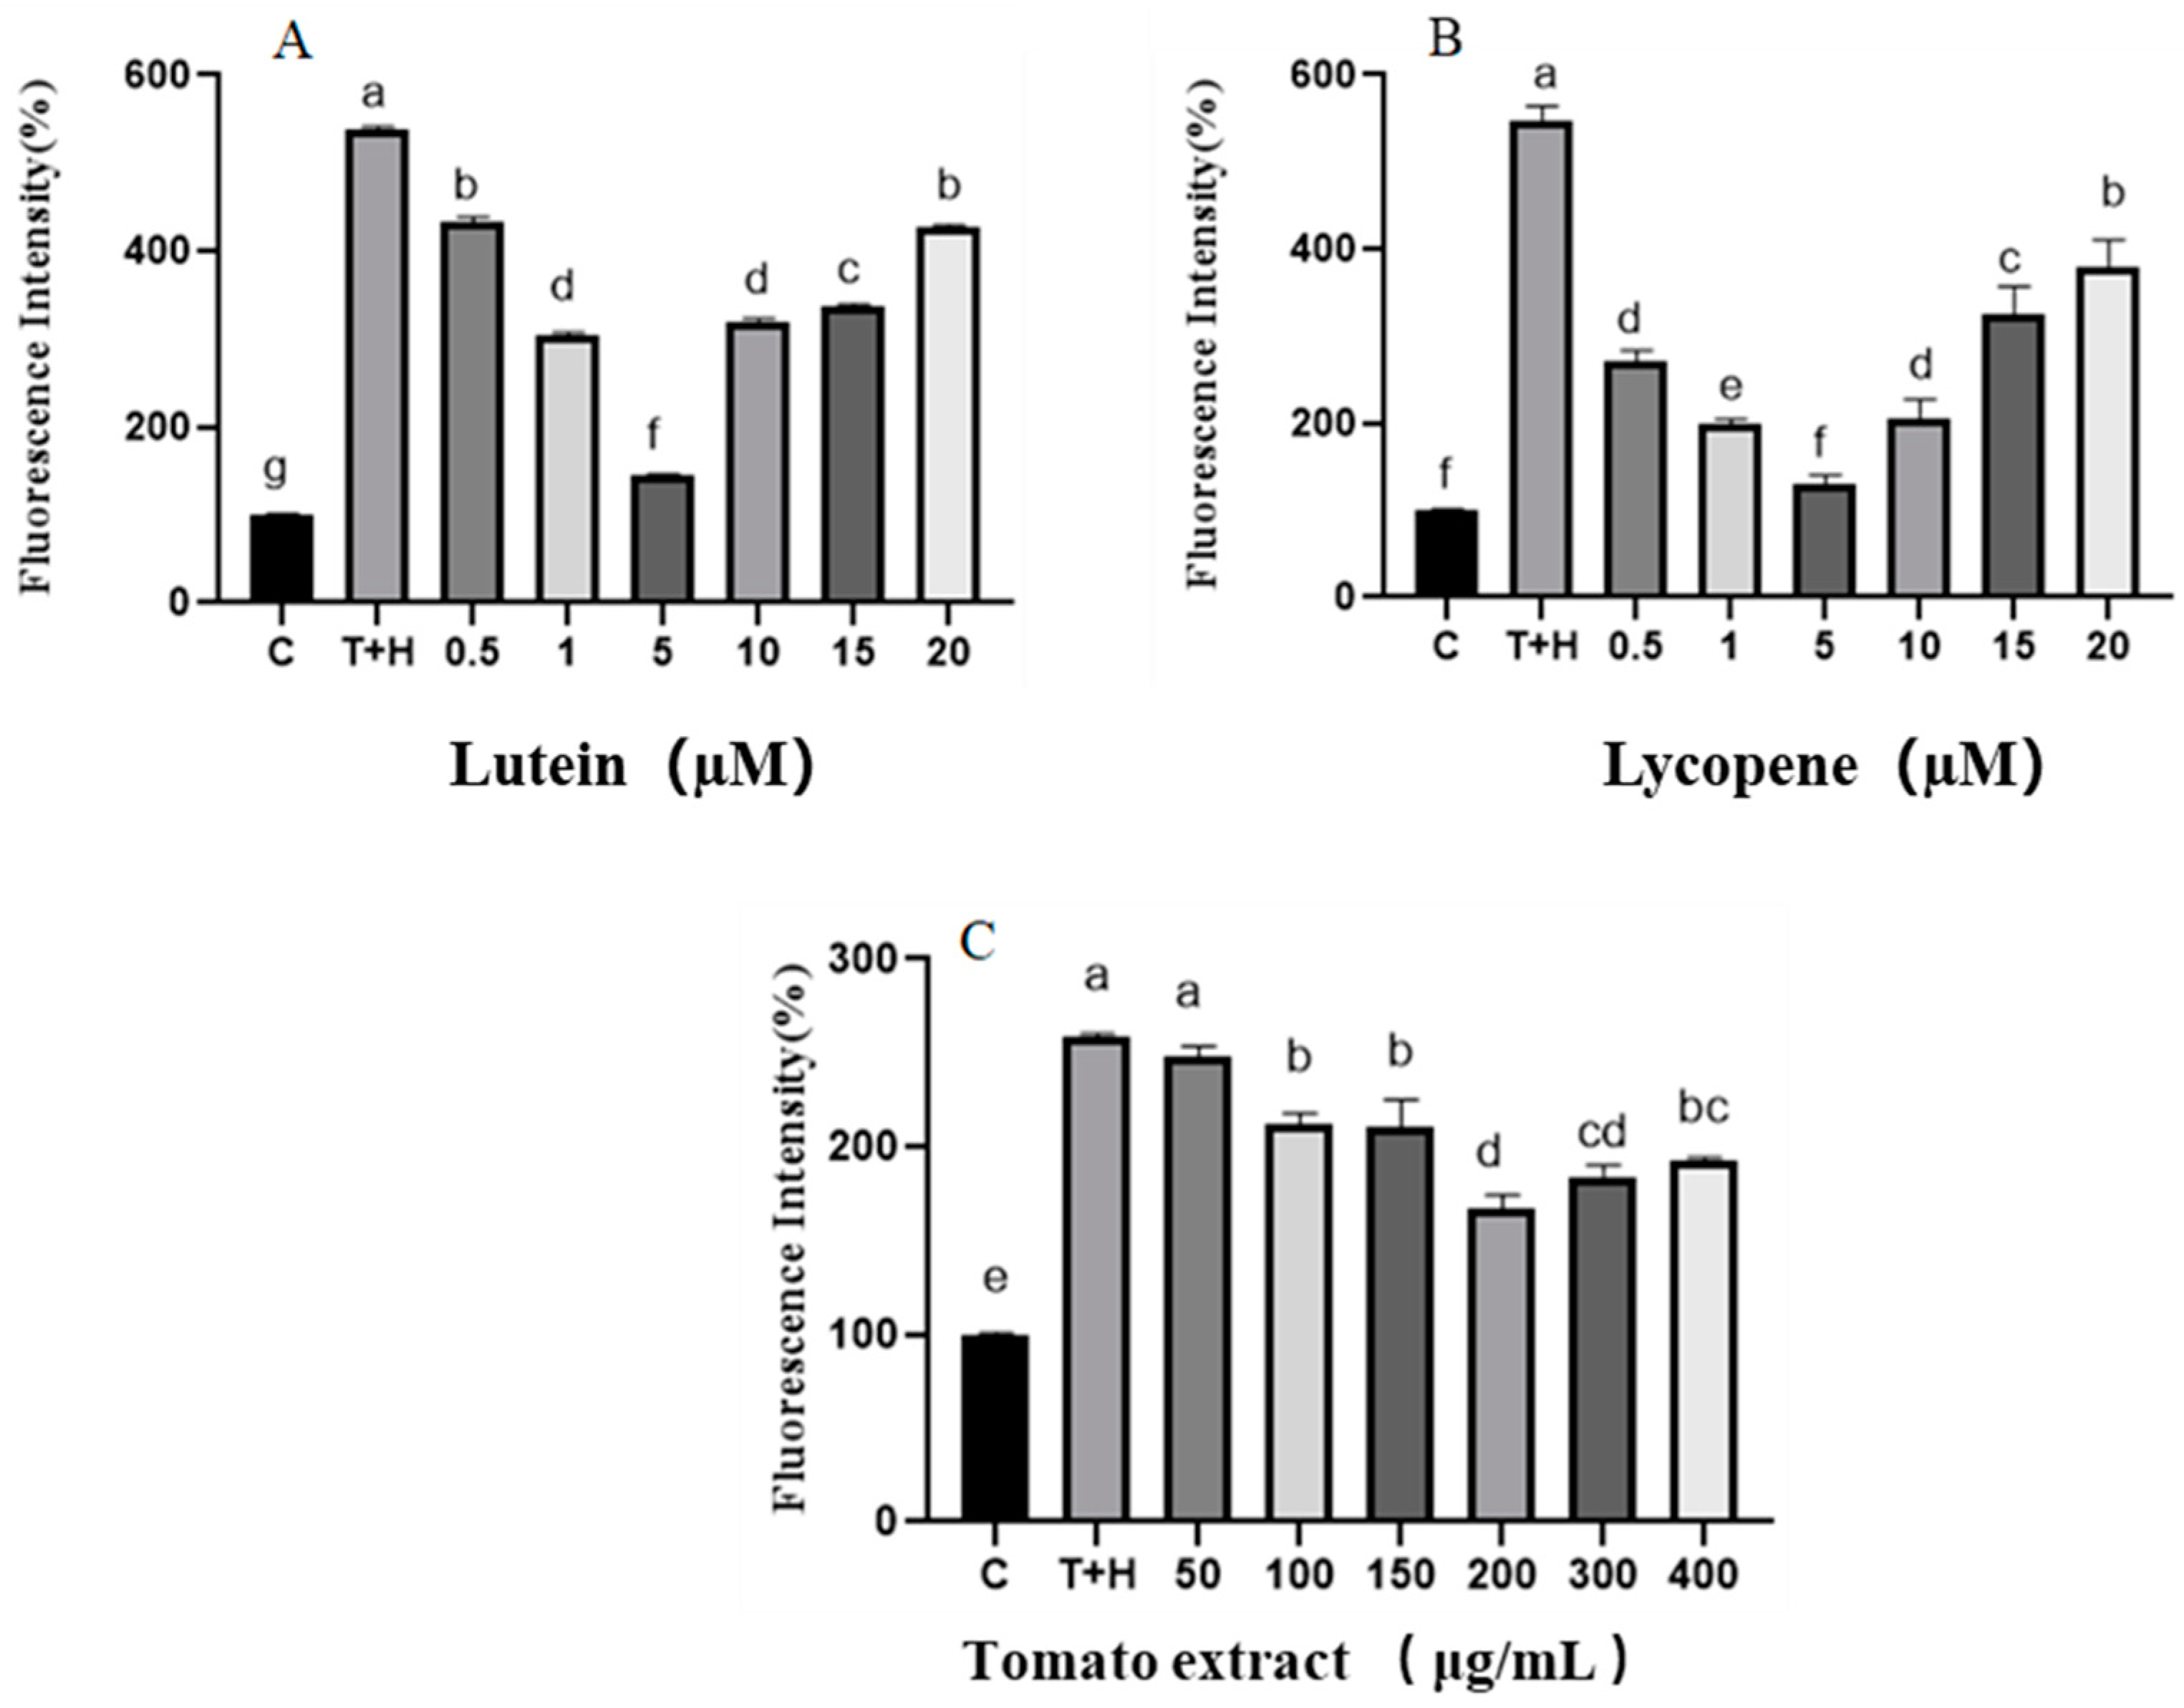
3.3.2. Detection of the Intracellular ROS by Flow Cytometry
3.4. Effect of Lutein, Lycopene, and Tomato Extract on the Antioxidant Enzymes in H9c2 Cells
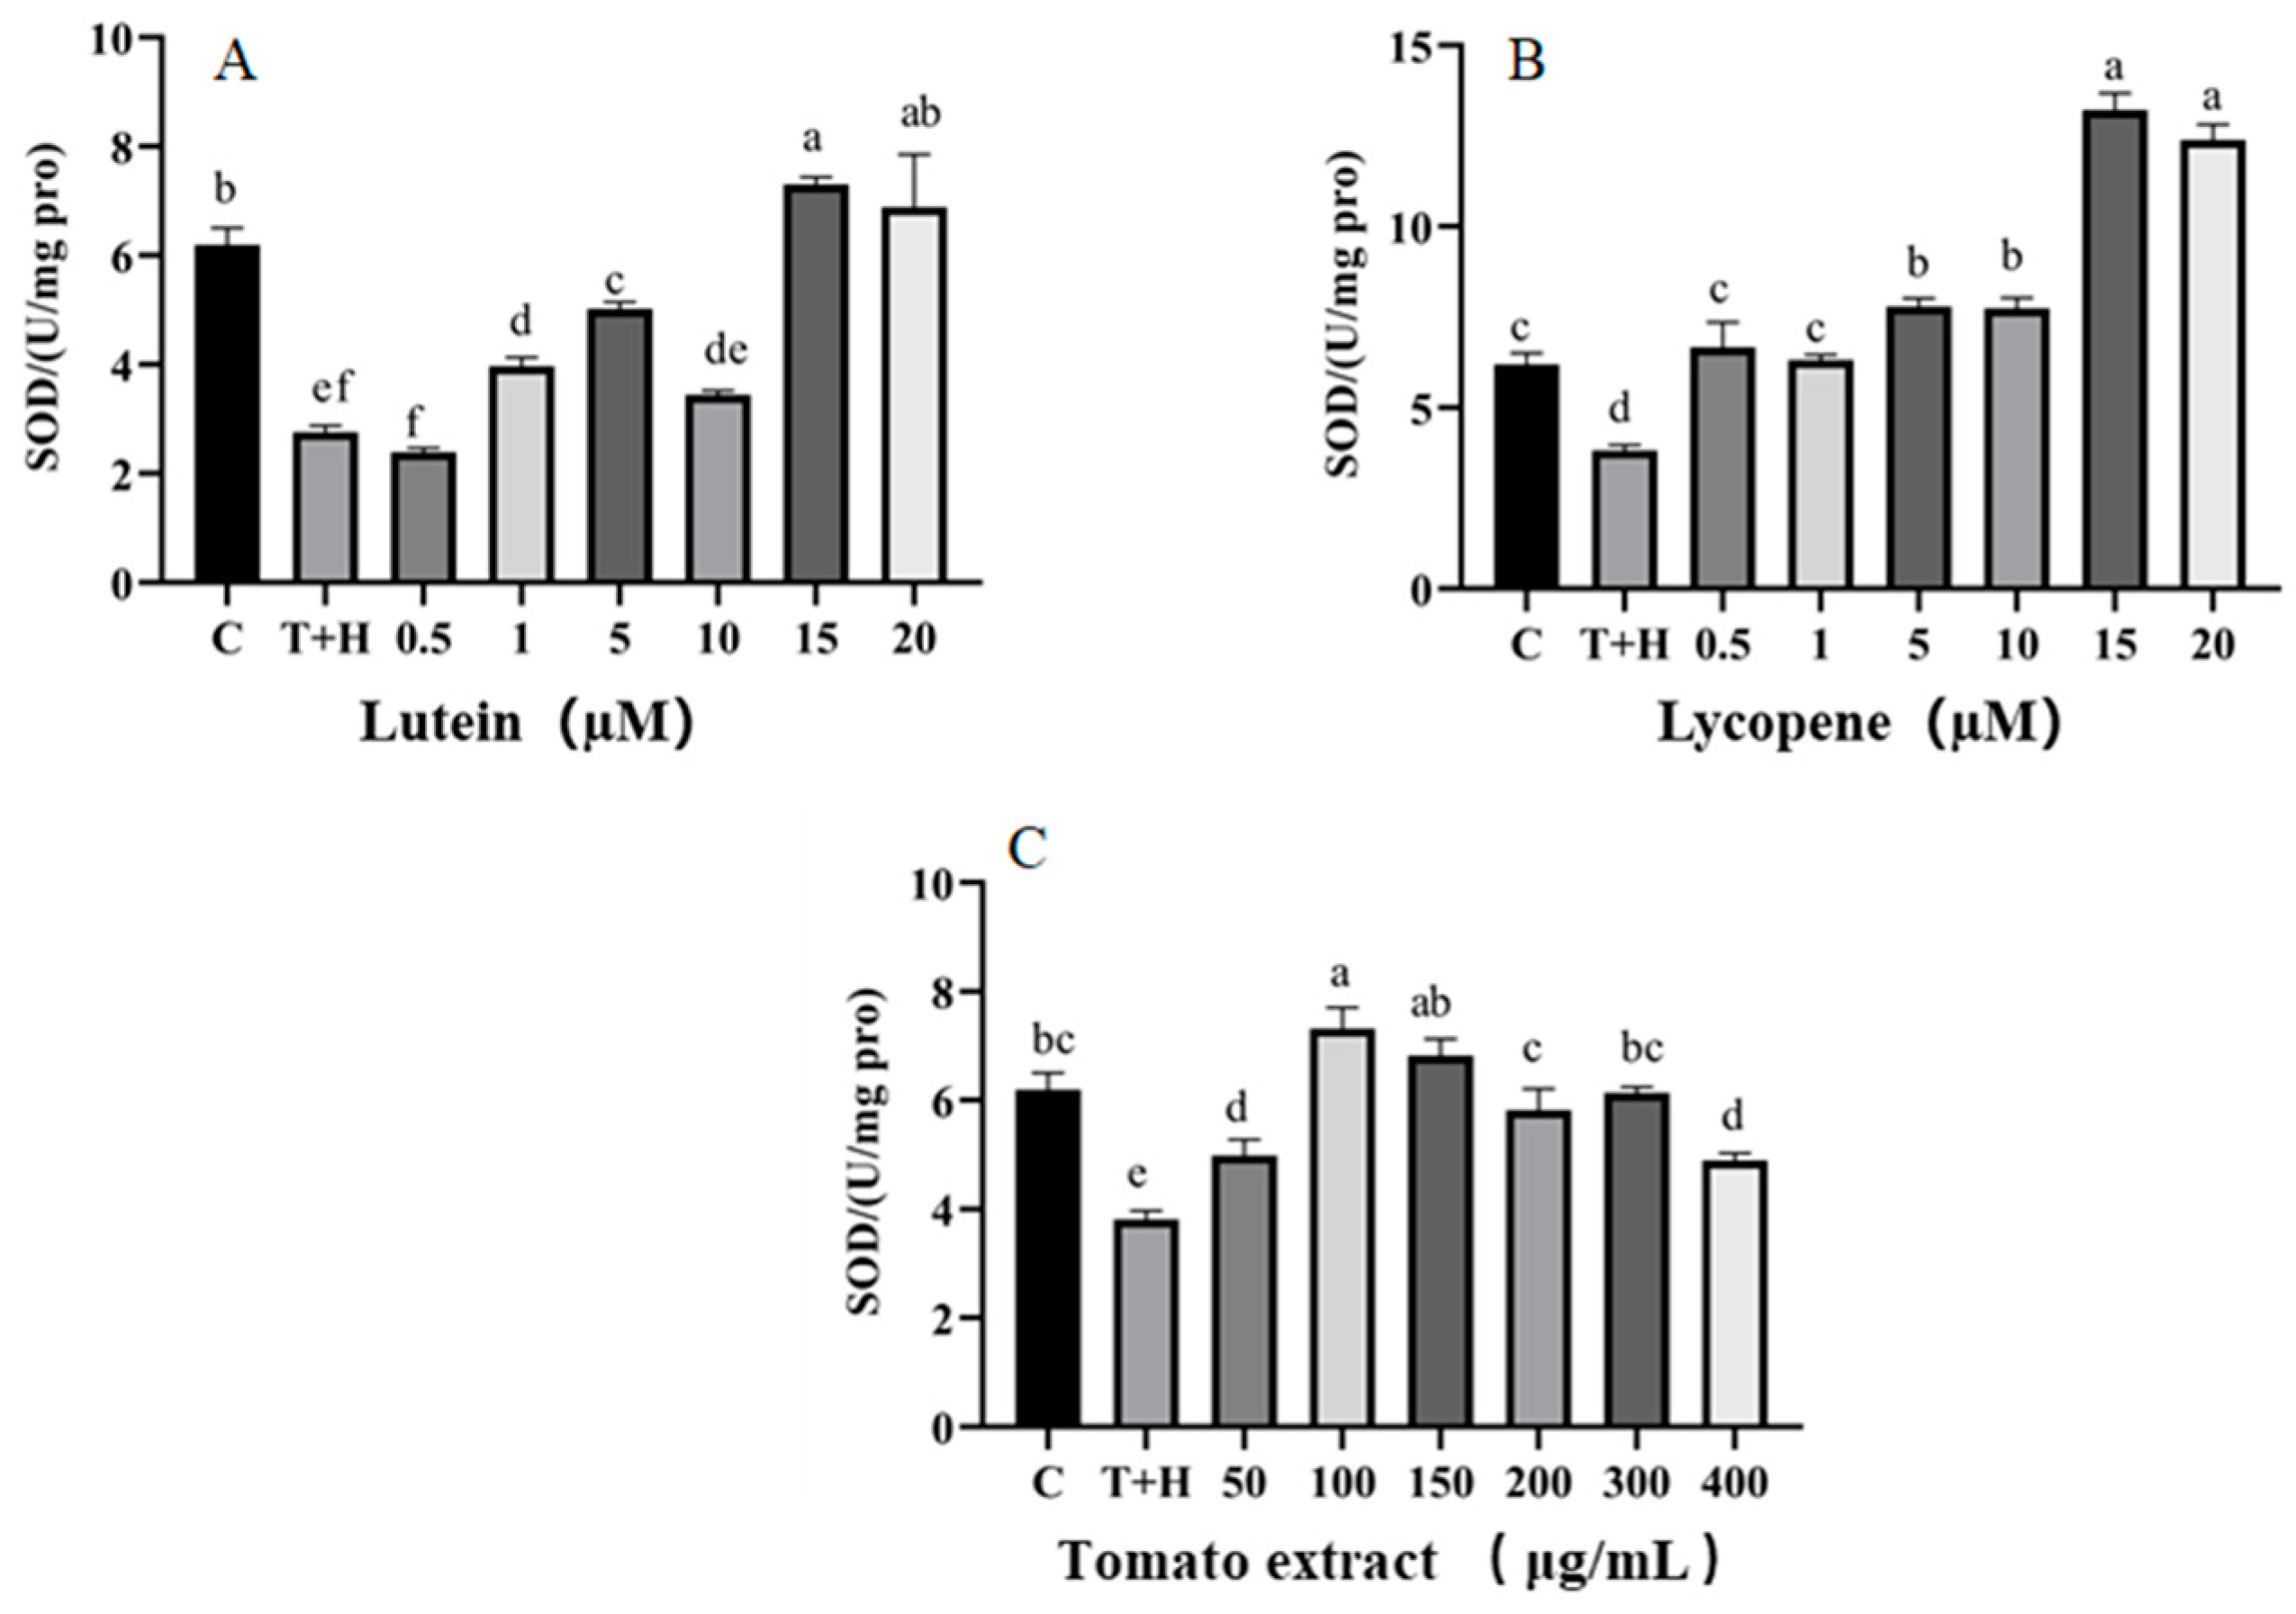
3.4.1. SOD
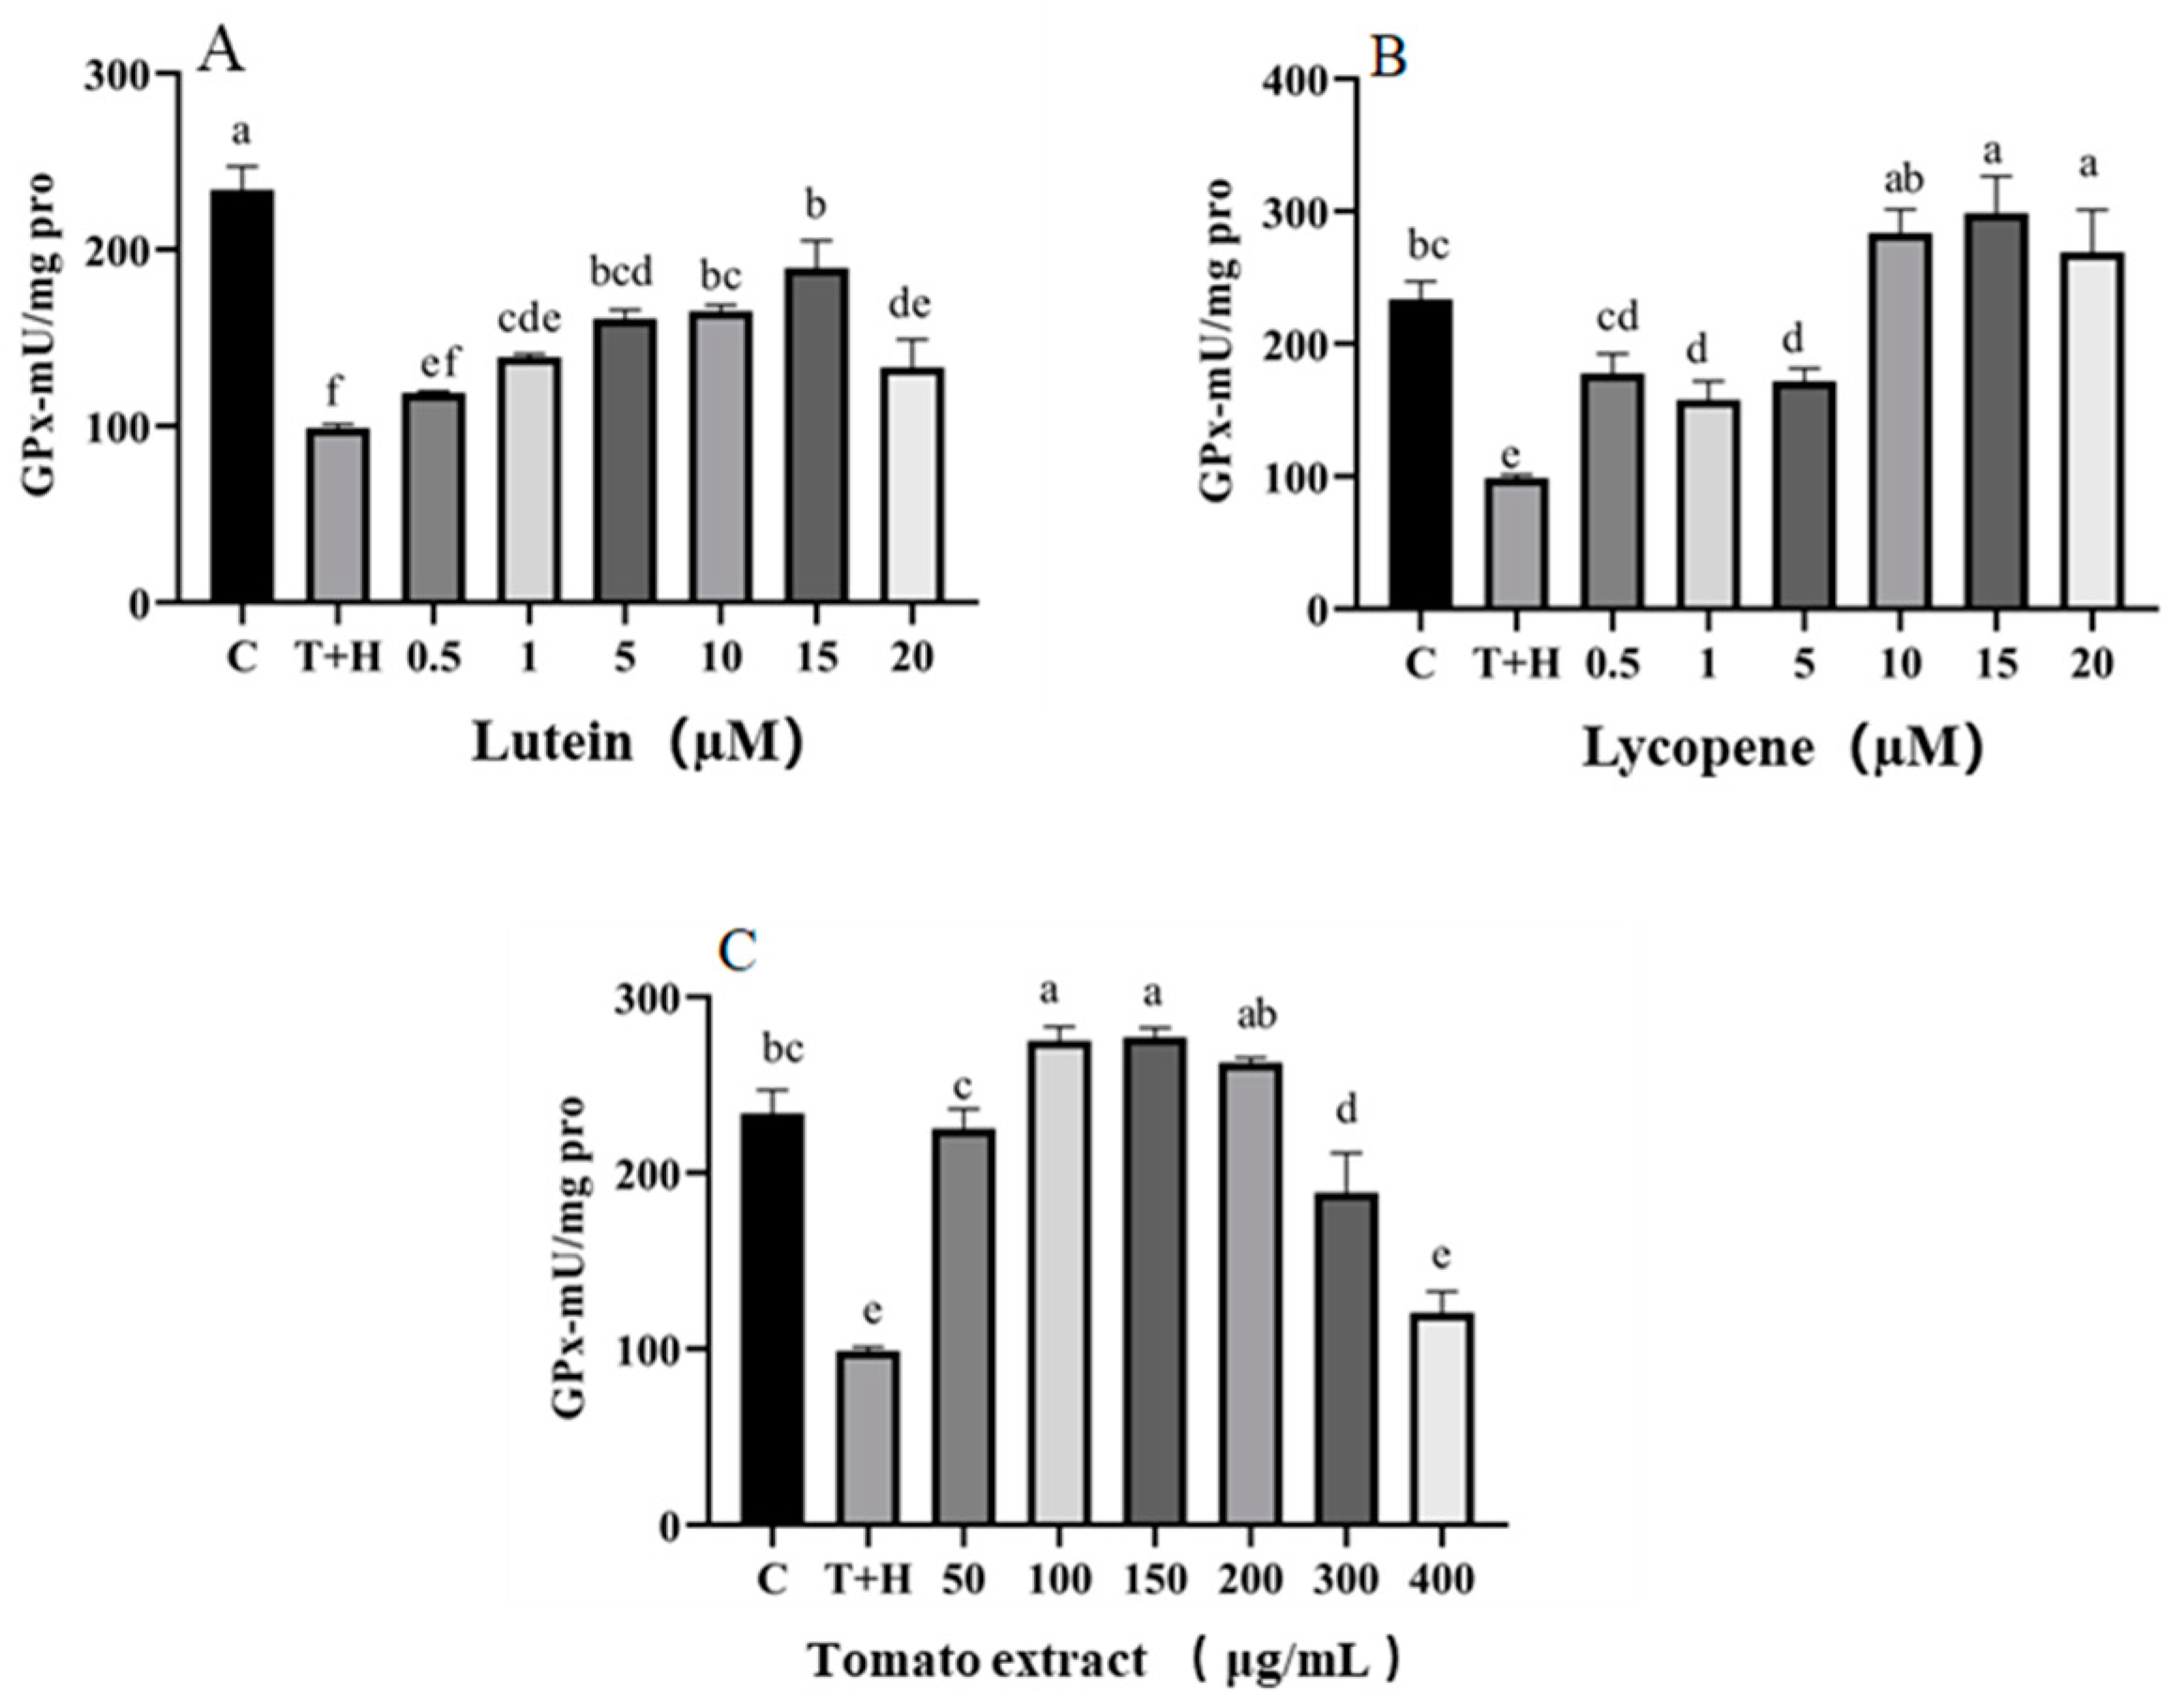
3.4.2. GPX
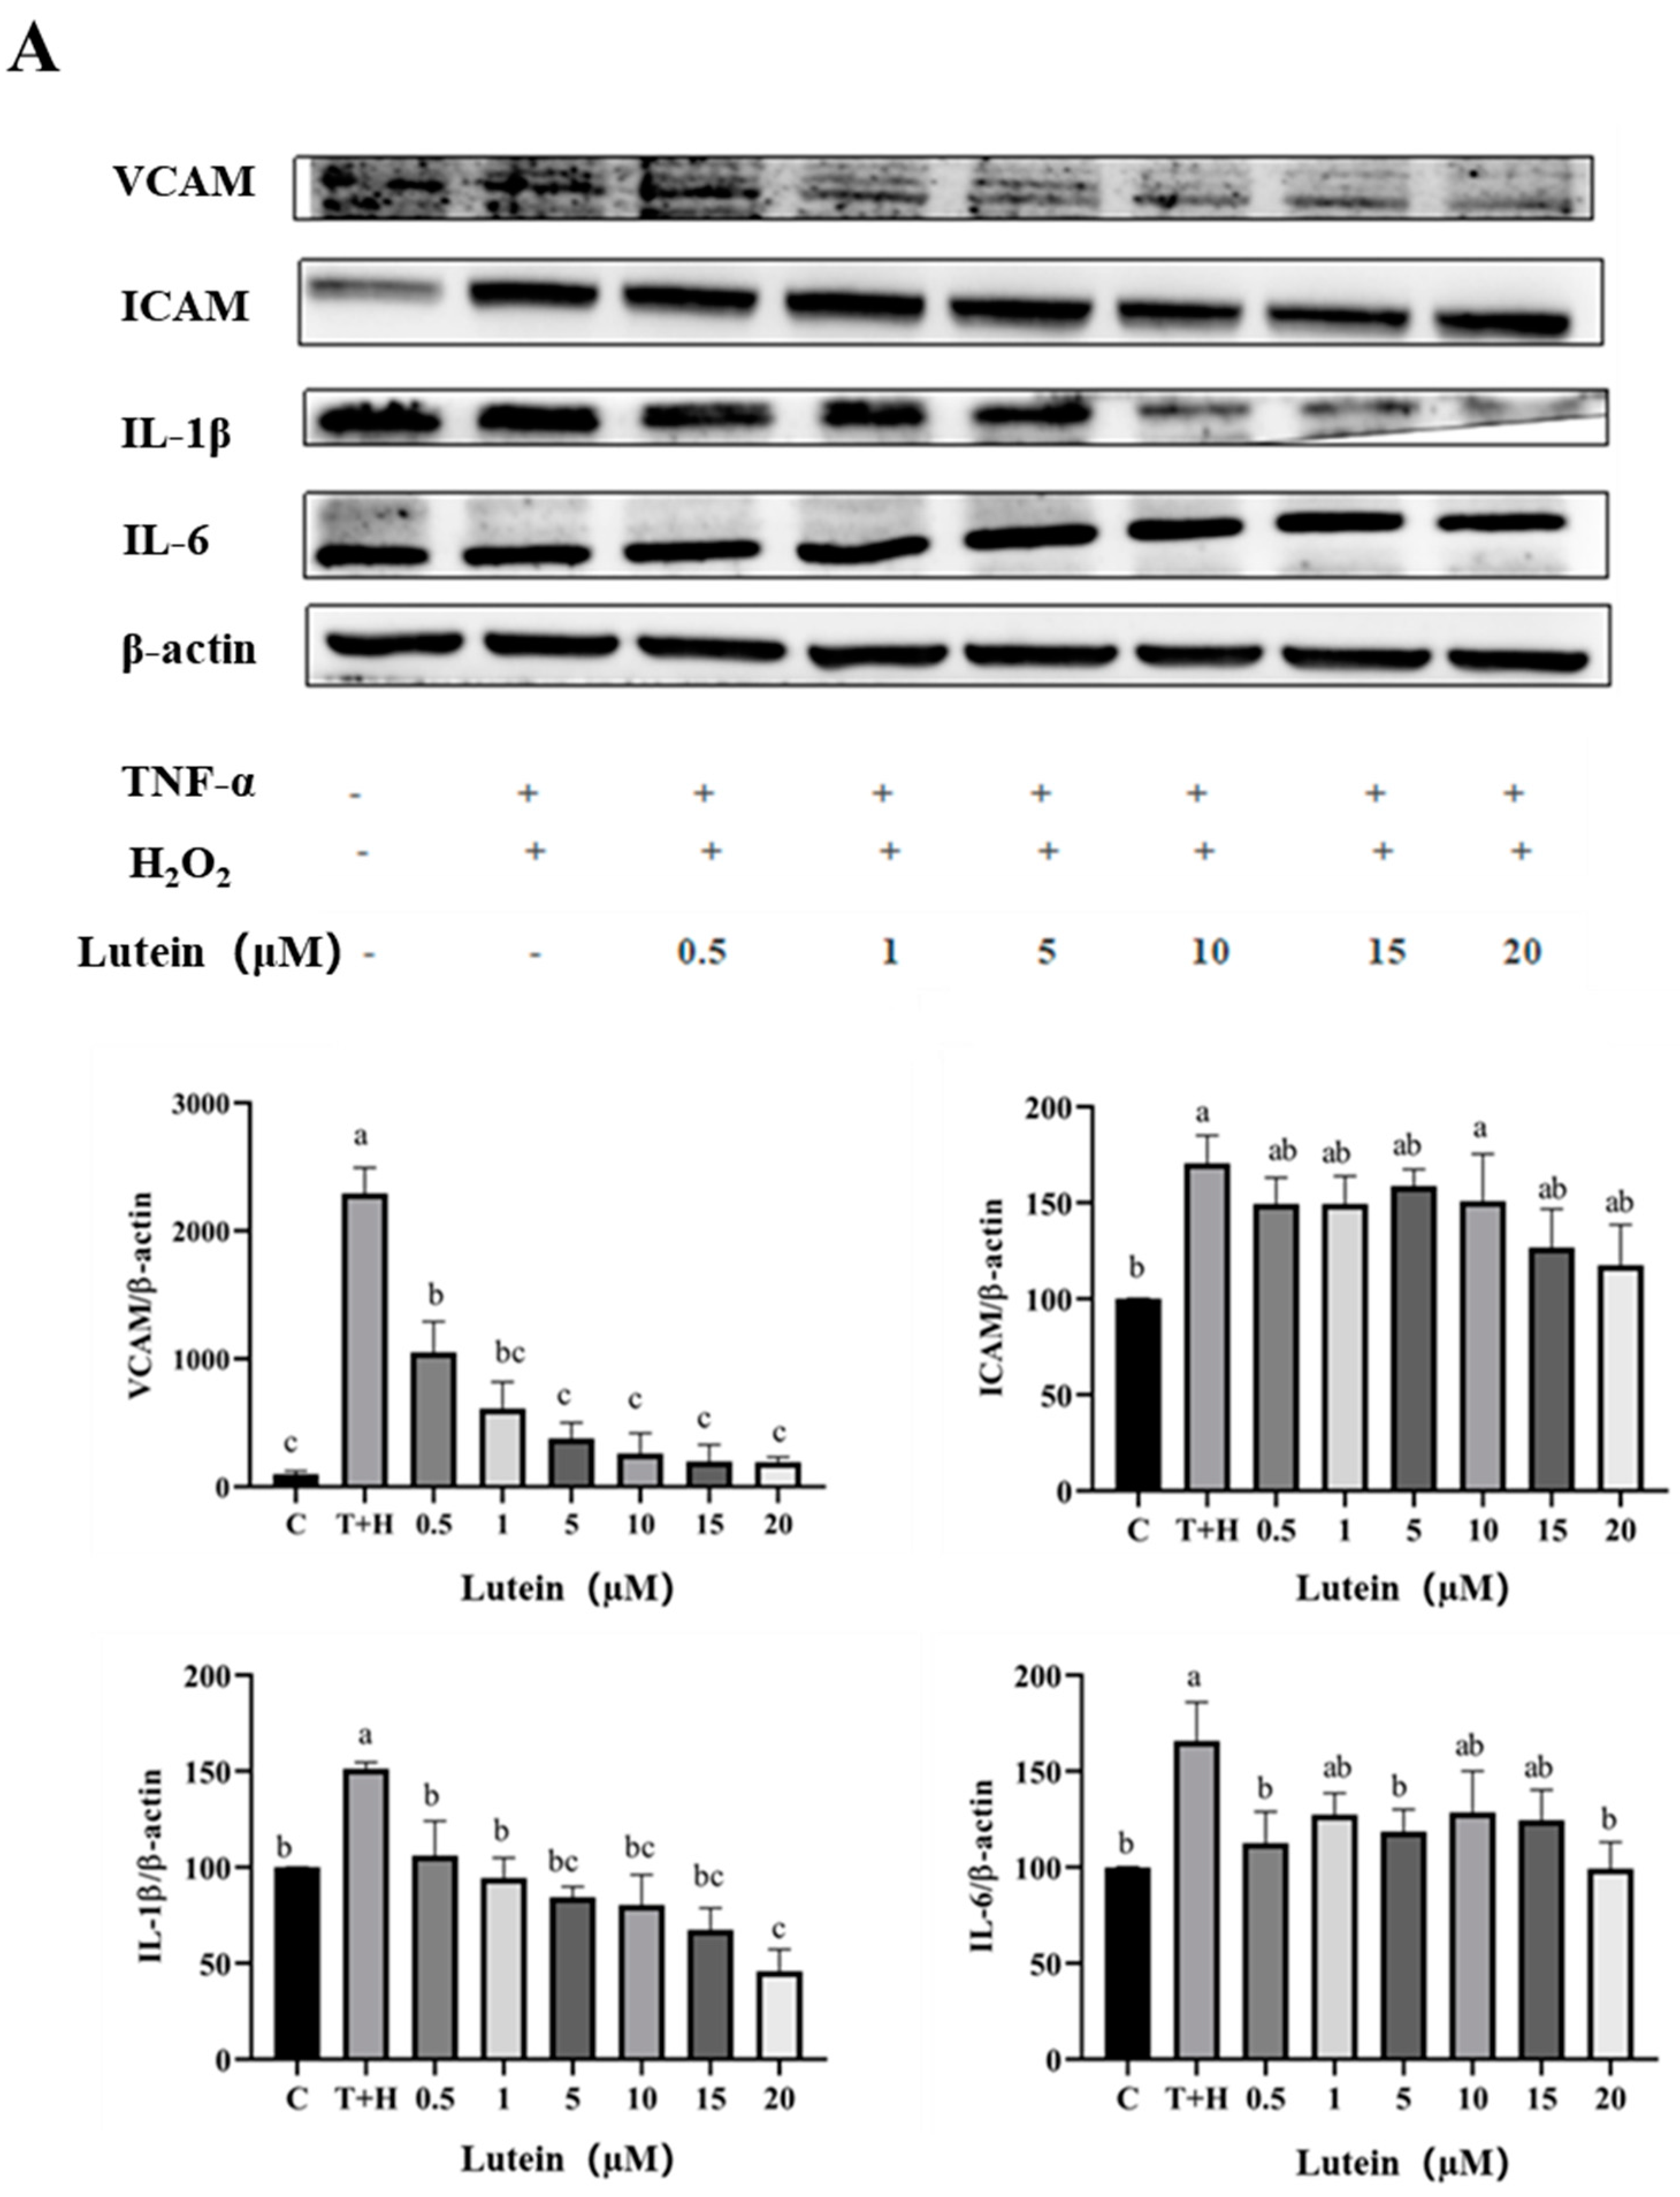
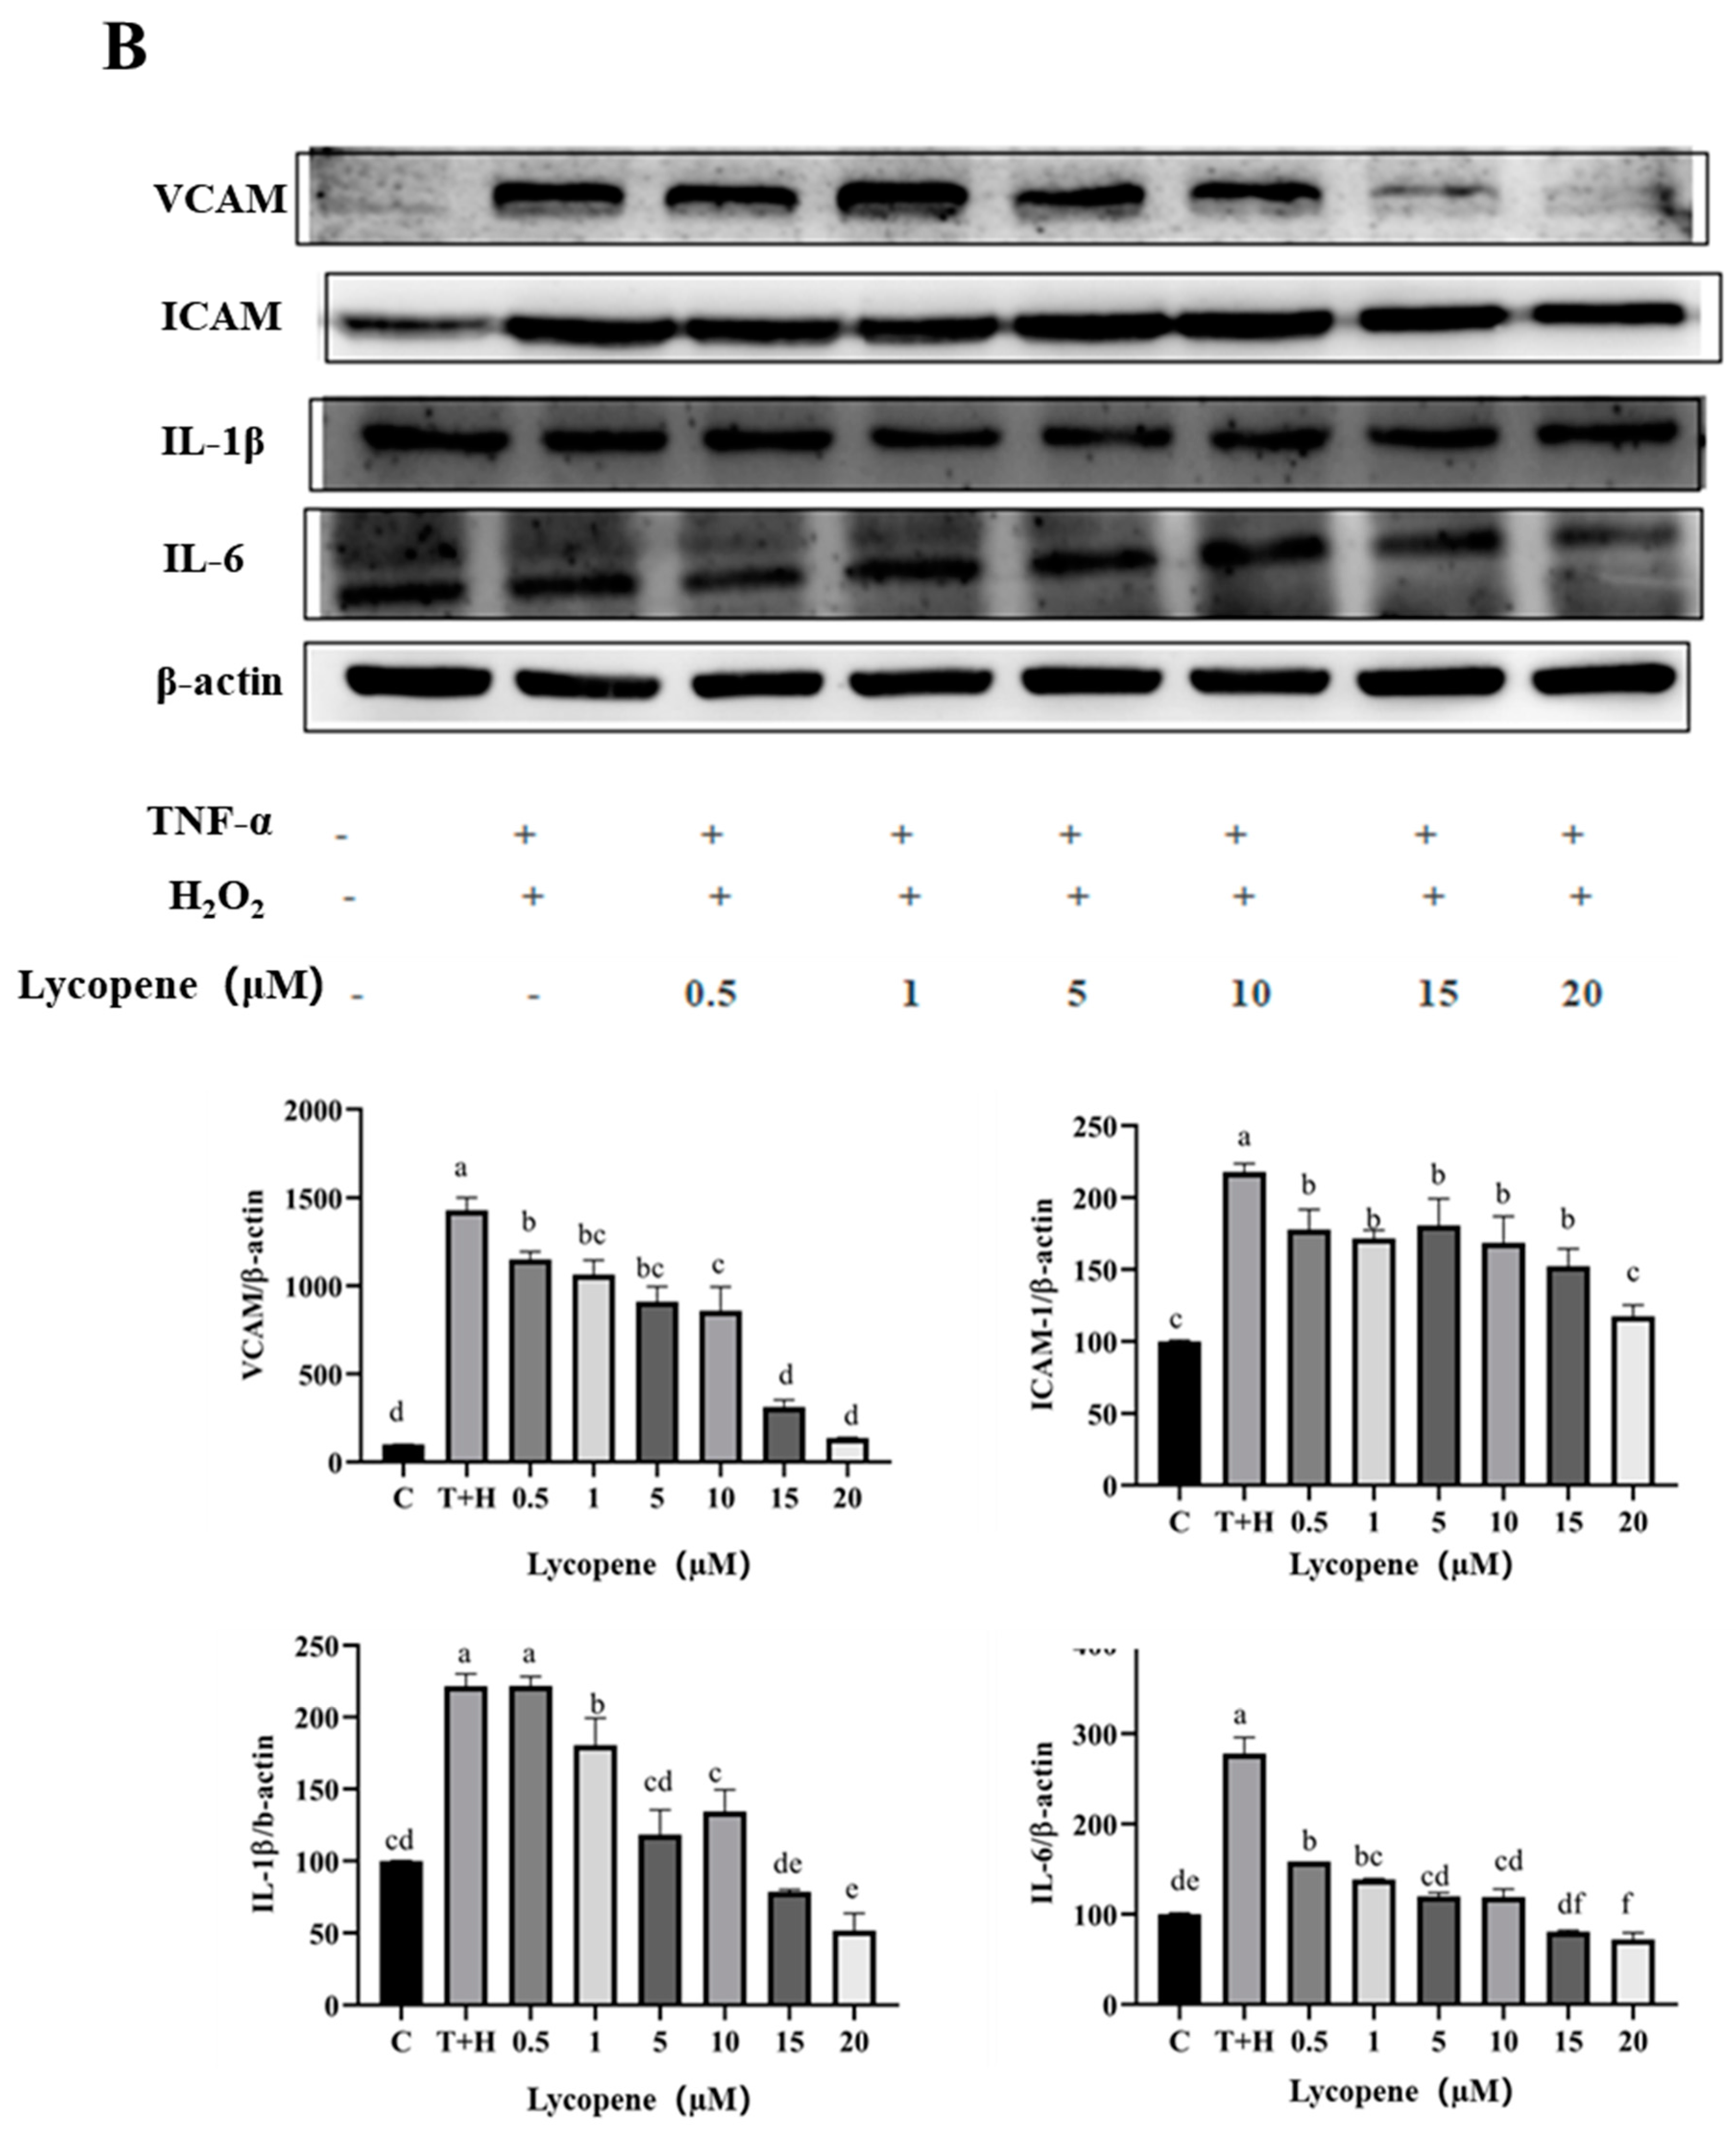
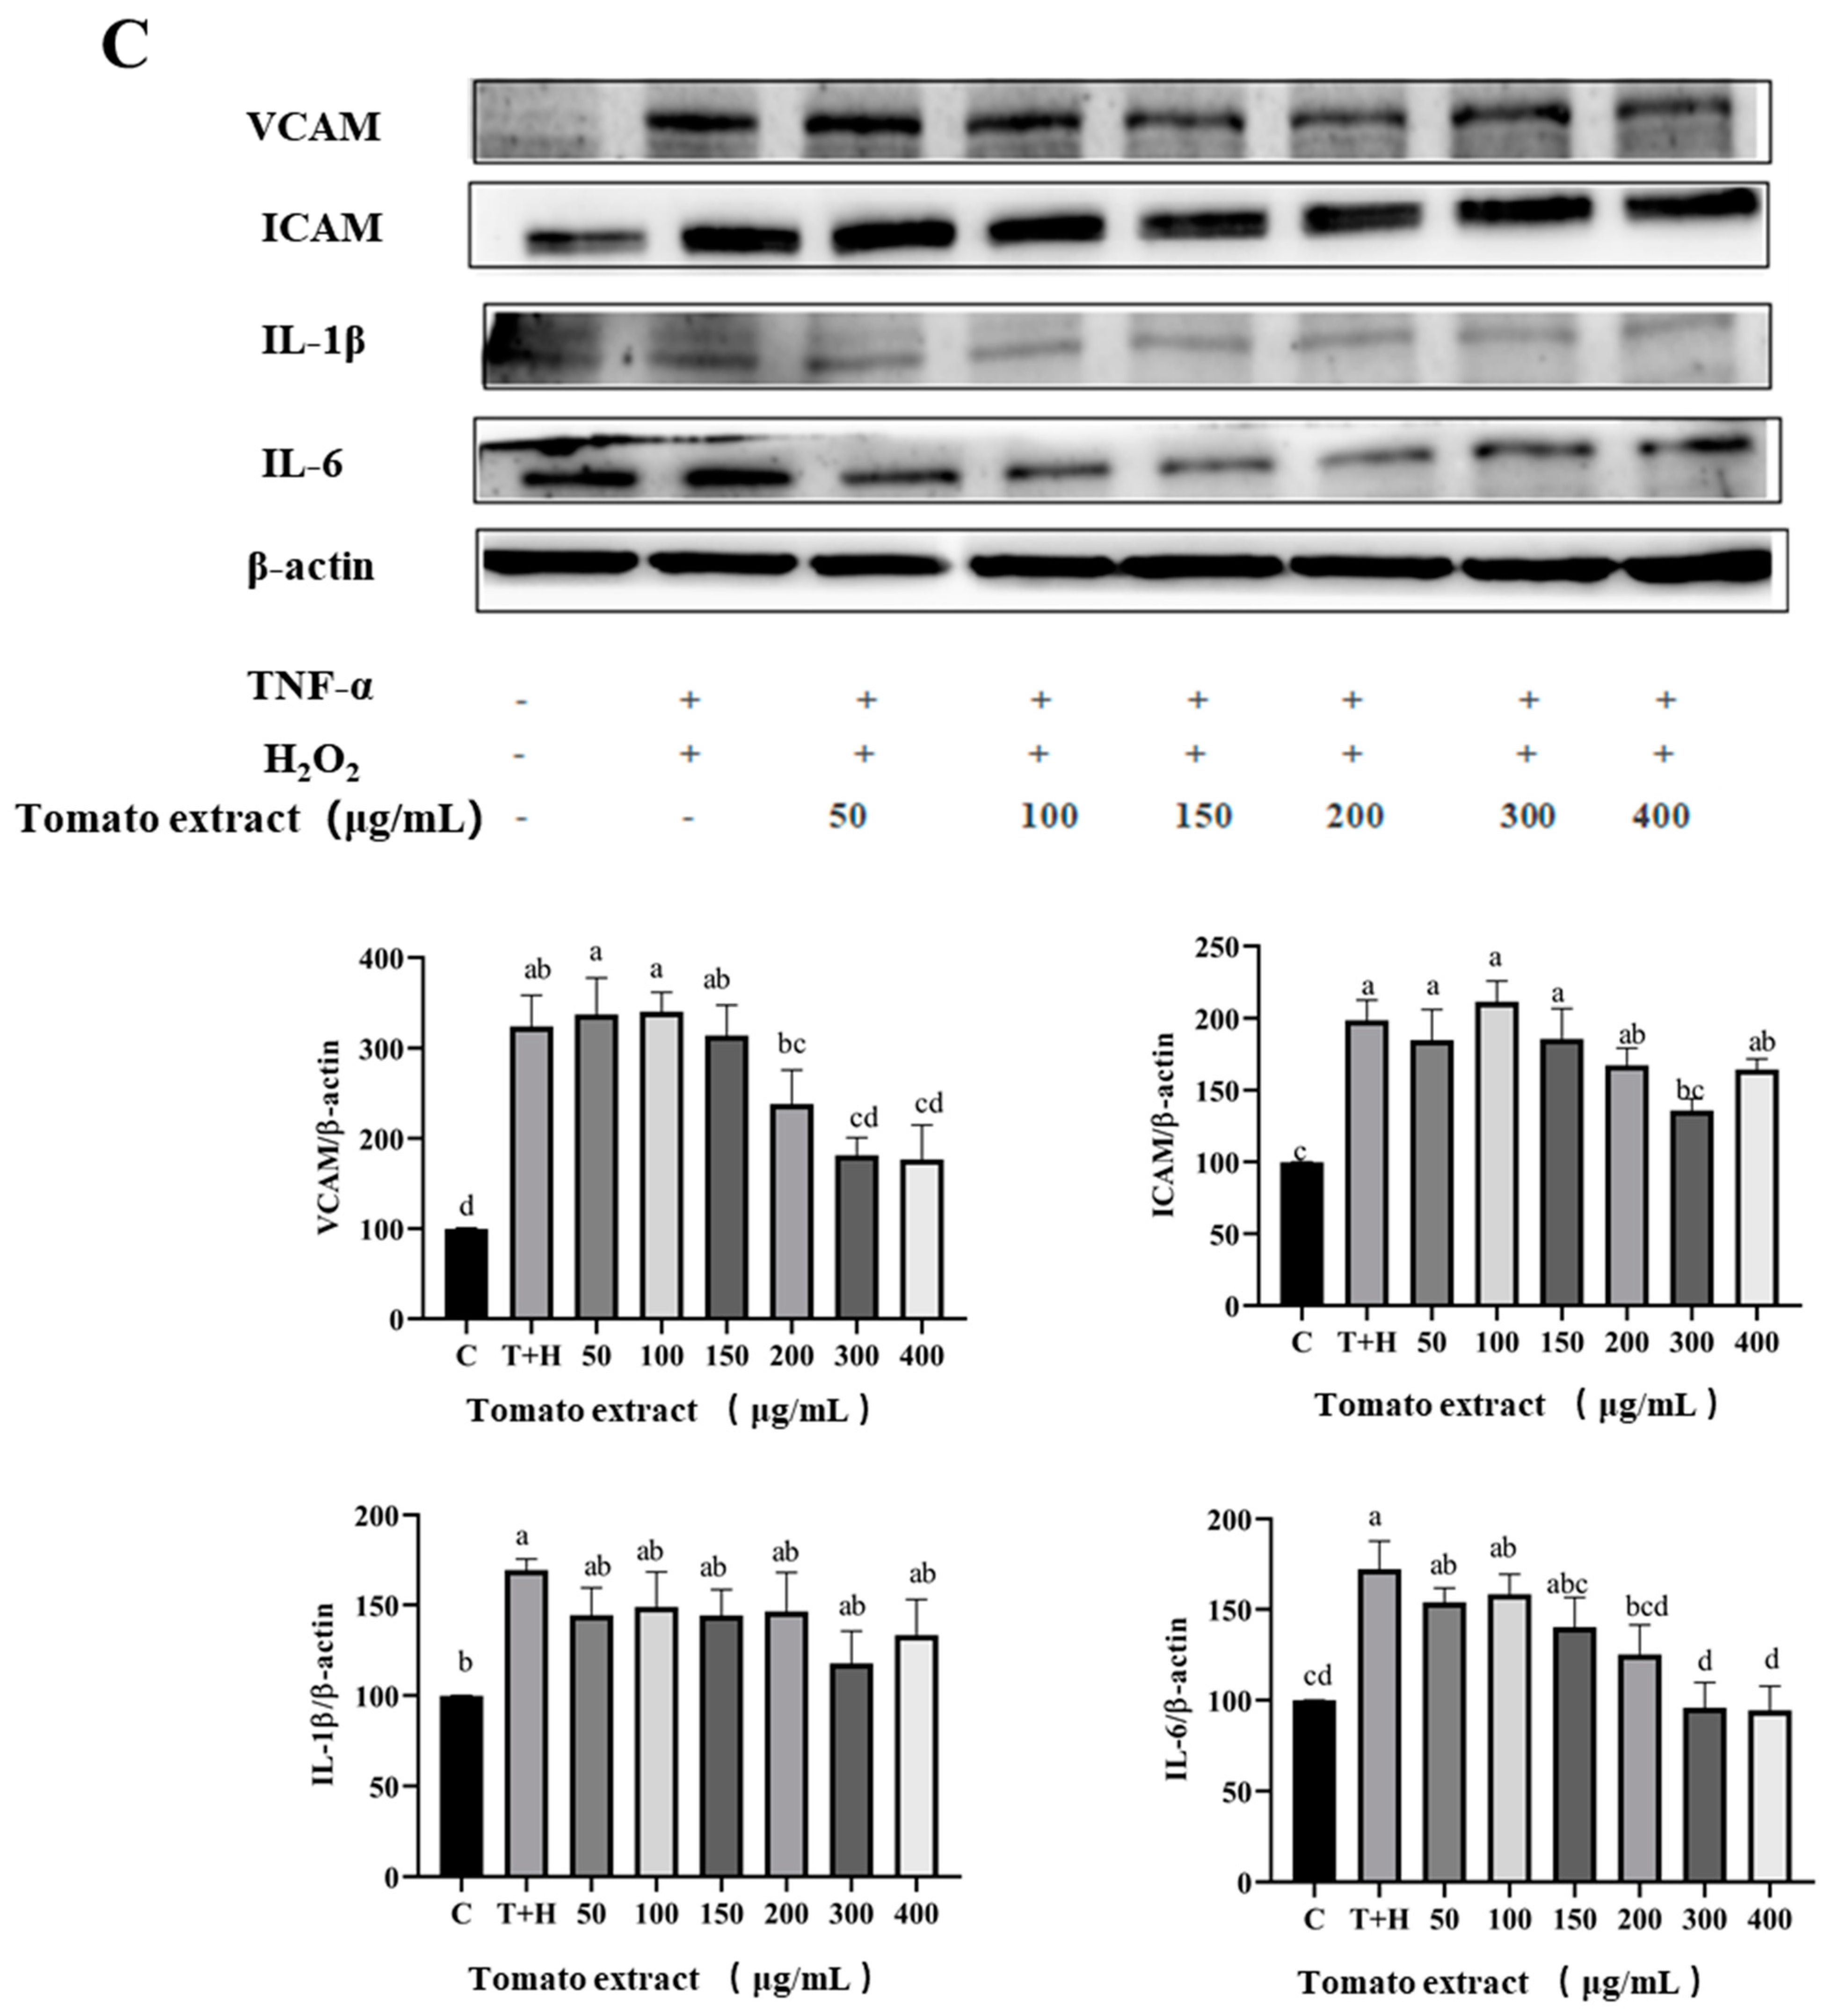
3.5. Effects of Lutein, Lycopene, and Tomato Extract on the Expression of Pro-Inflammatory Cytokines in H9c2 Cells
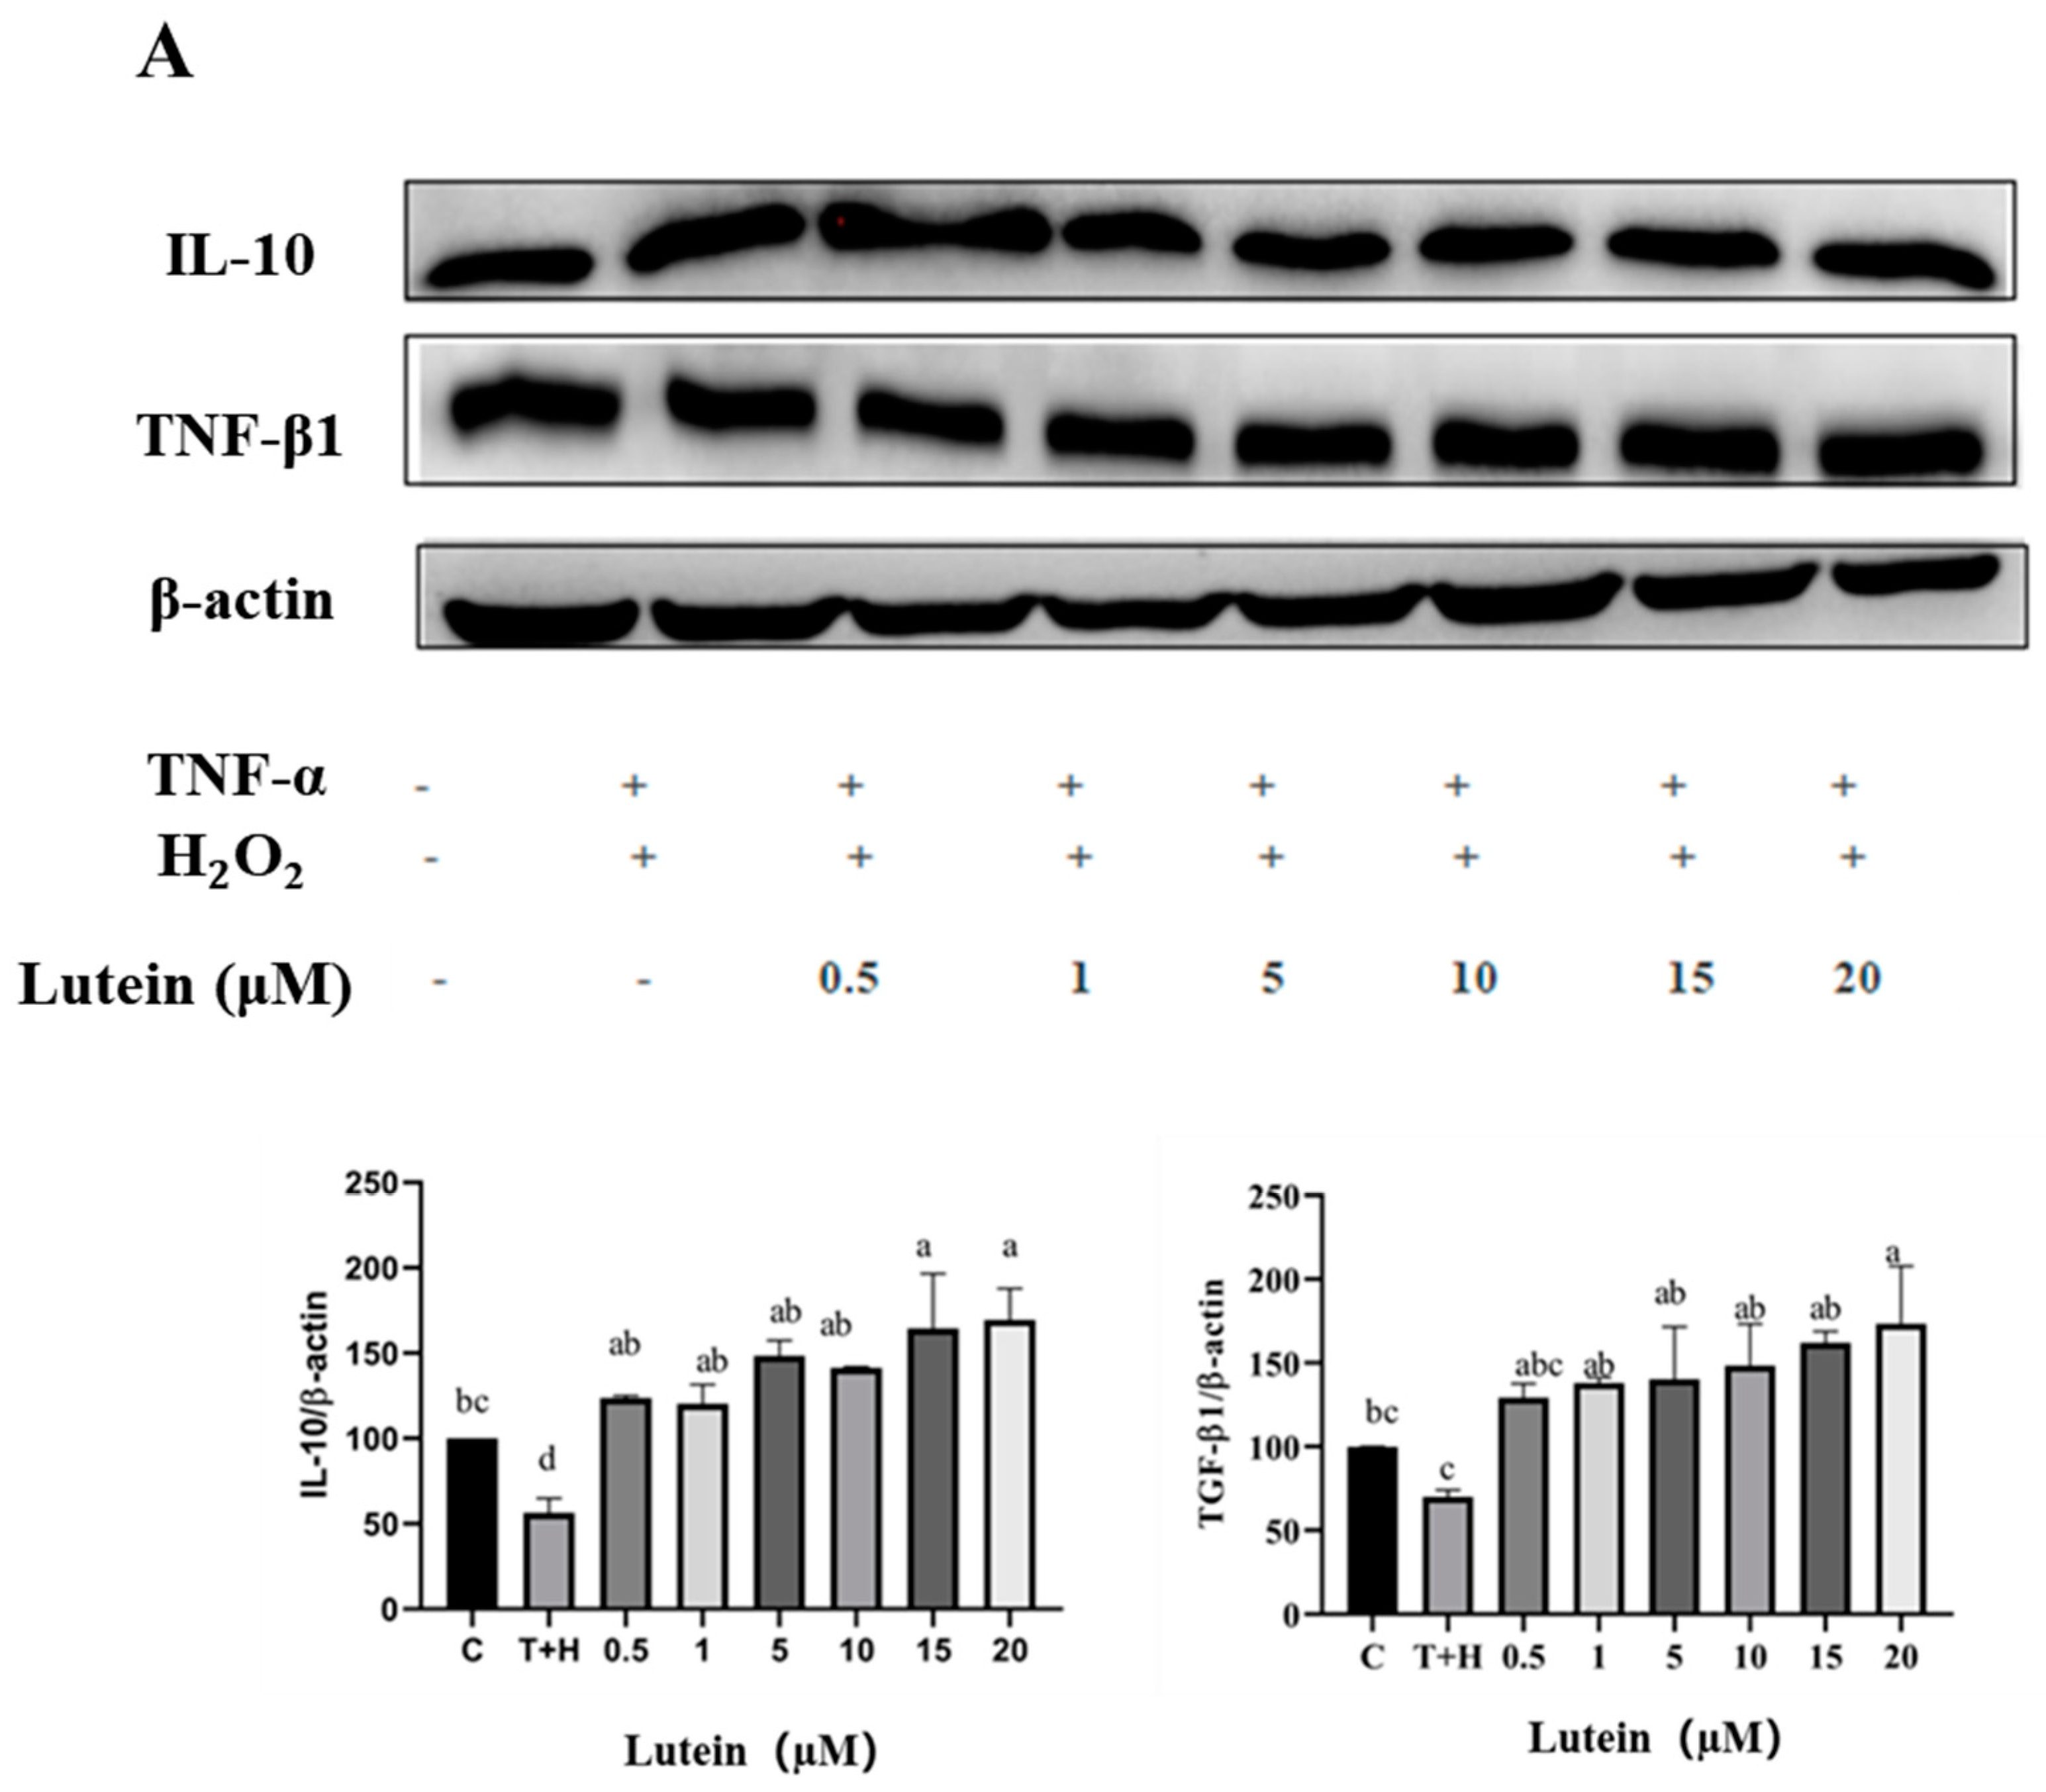
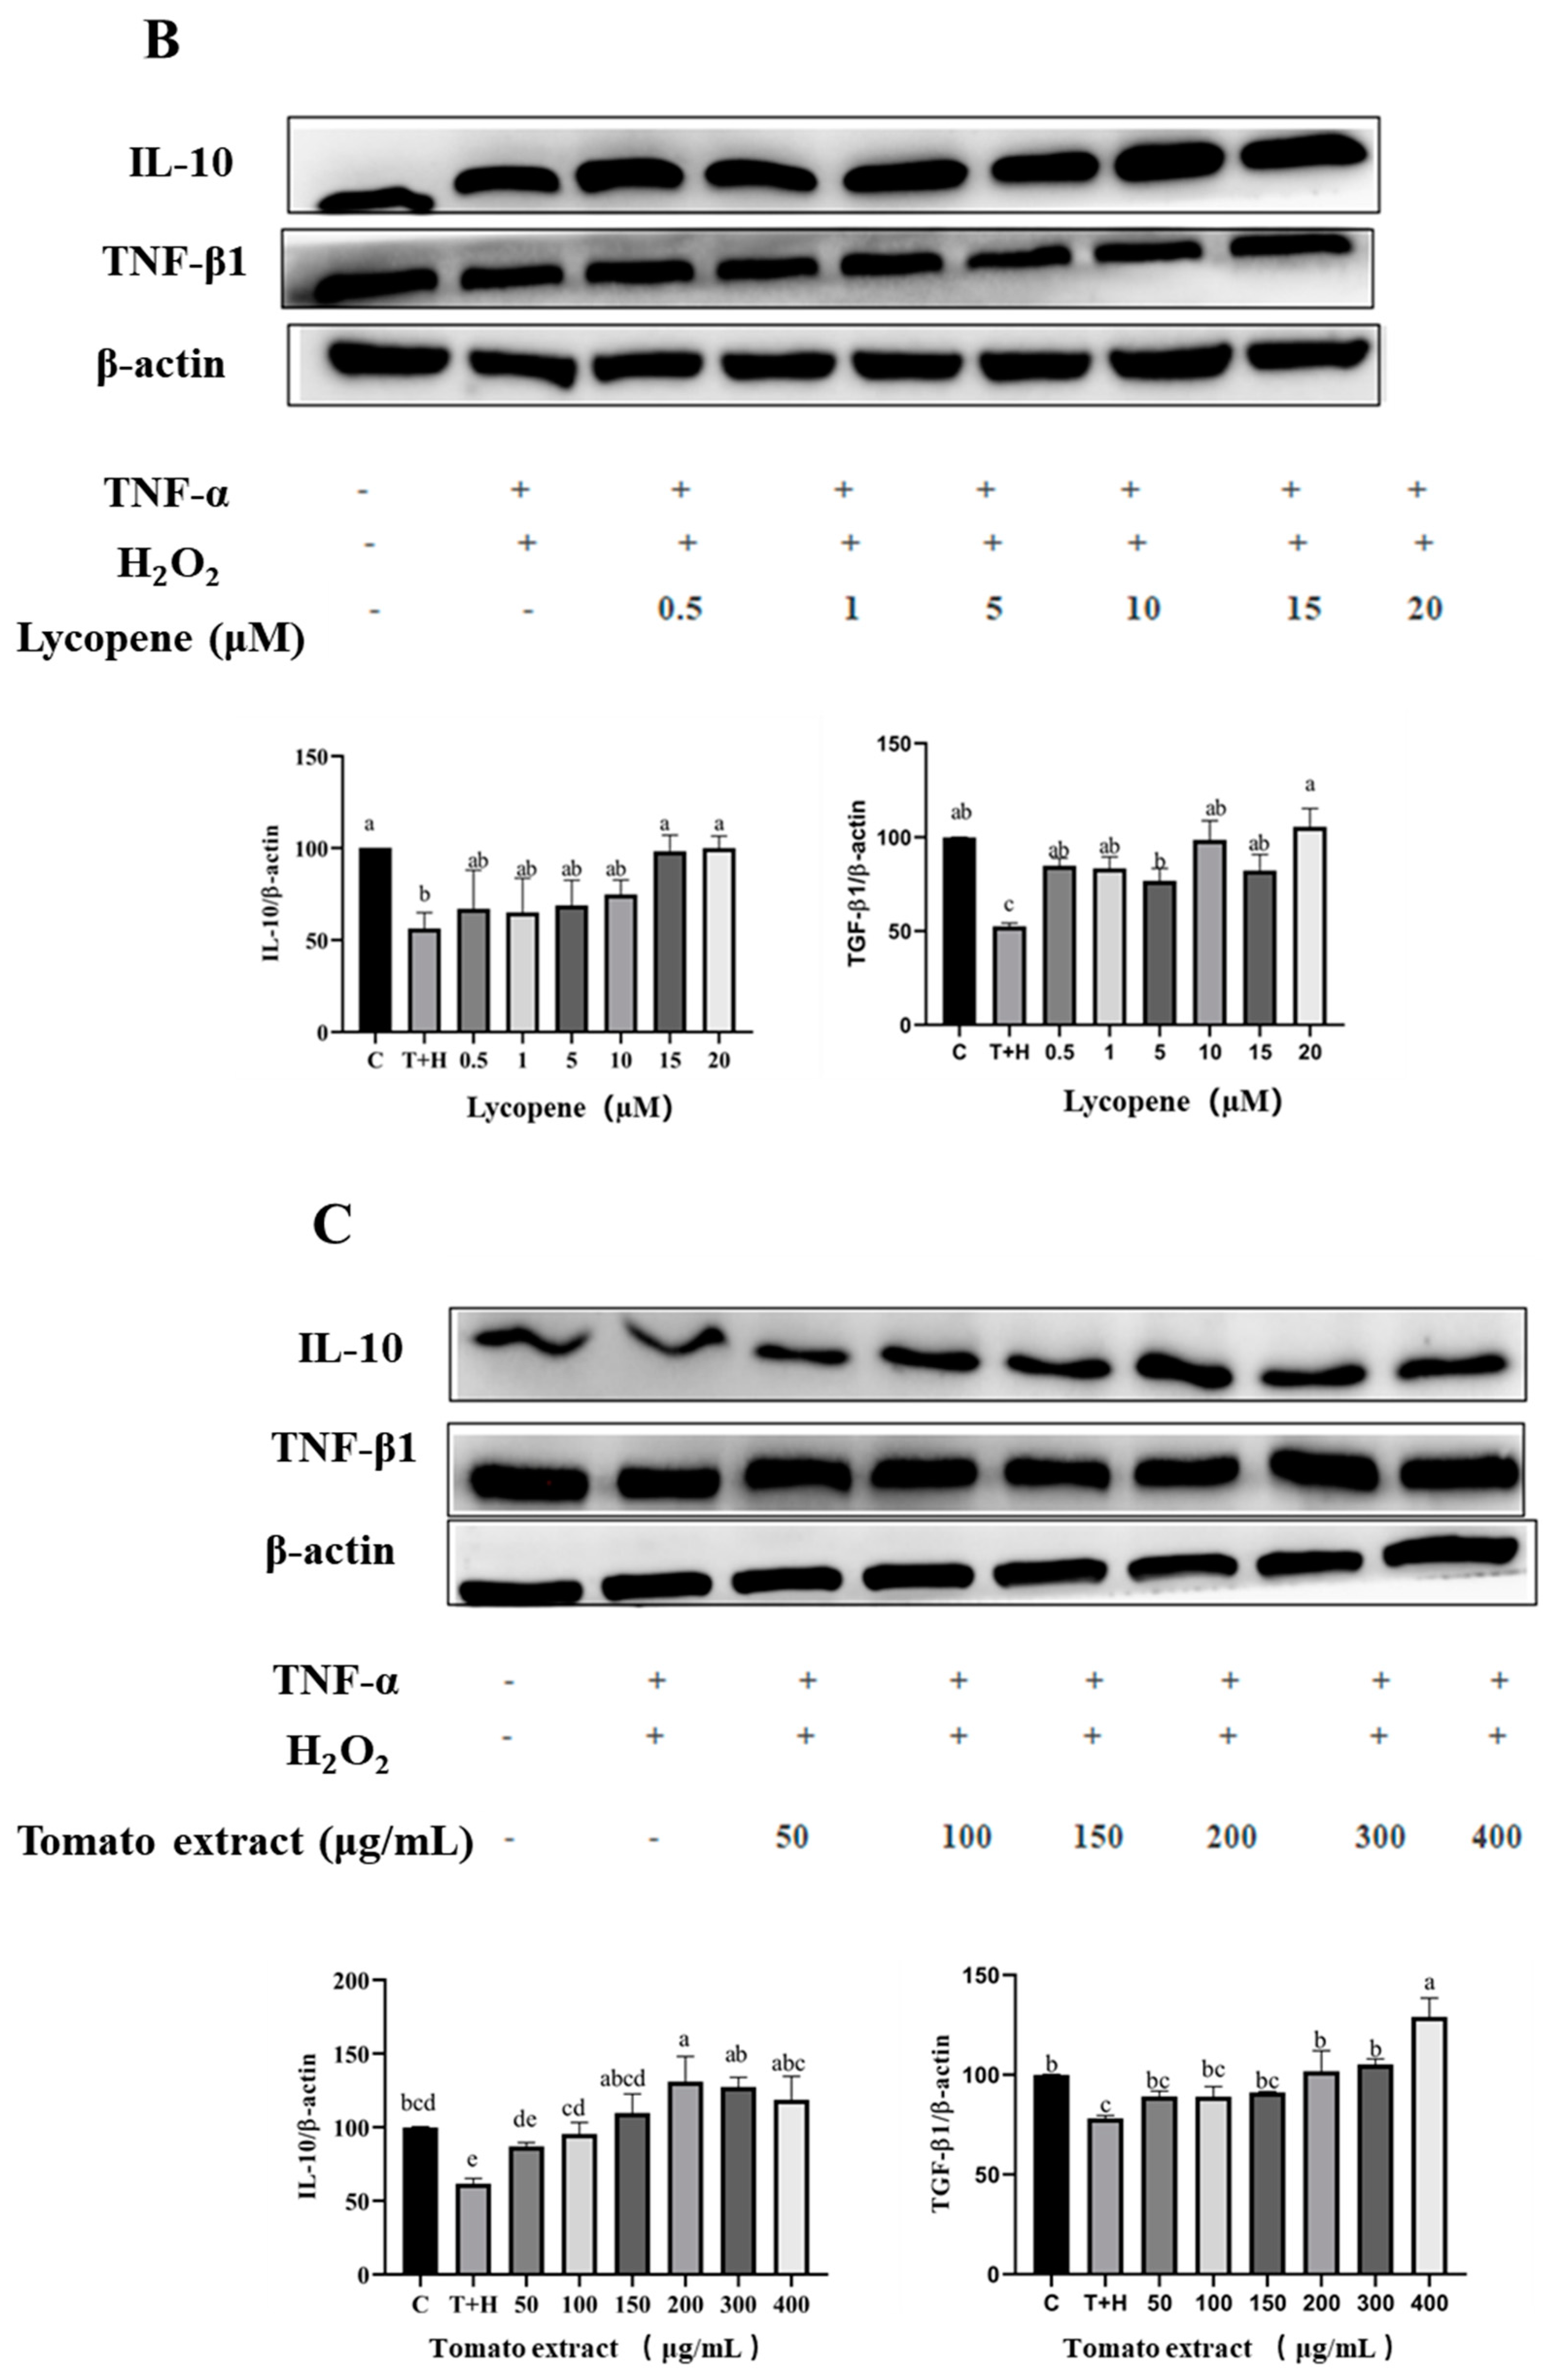
3.6. Effects of Lutein, Lycopene, and Tomato Extract on the Expression of Anti-Inflammatory Cytokines in H9c2 Cells
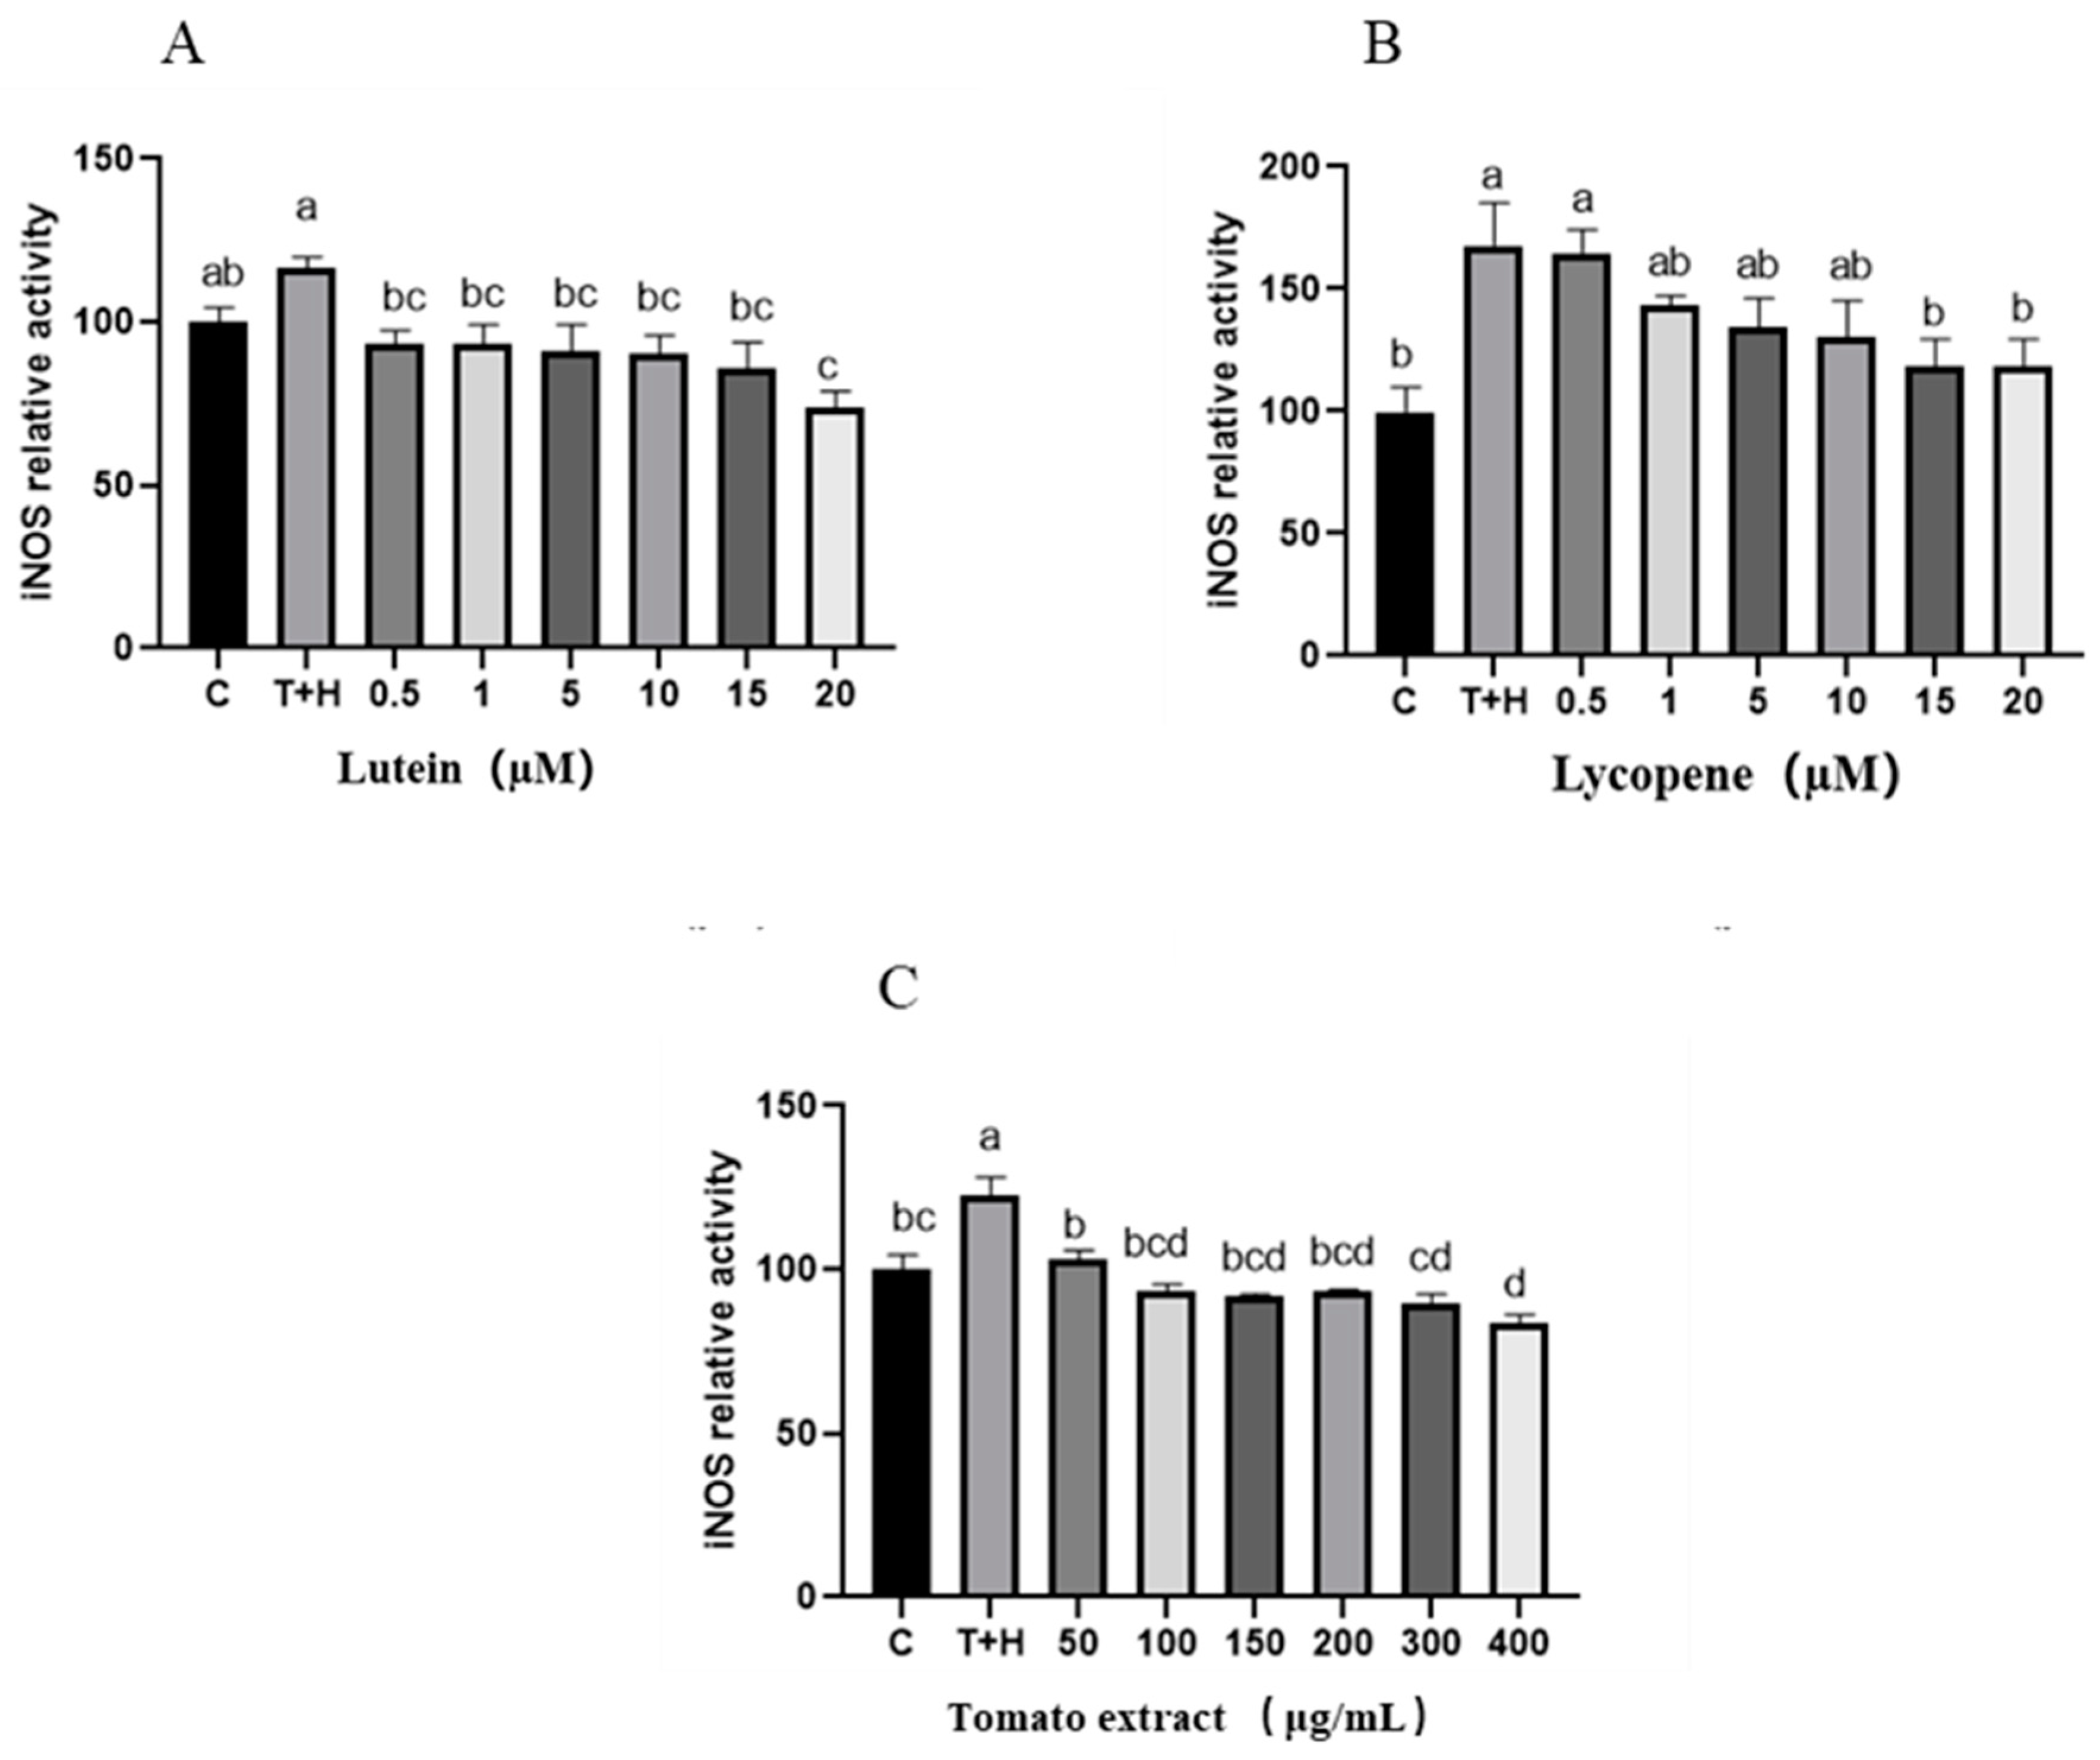
3.7. Effects of Lutein, Lycopene, and Tomato Extract on iNOS in H9c2 Cells
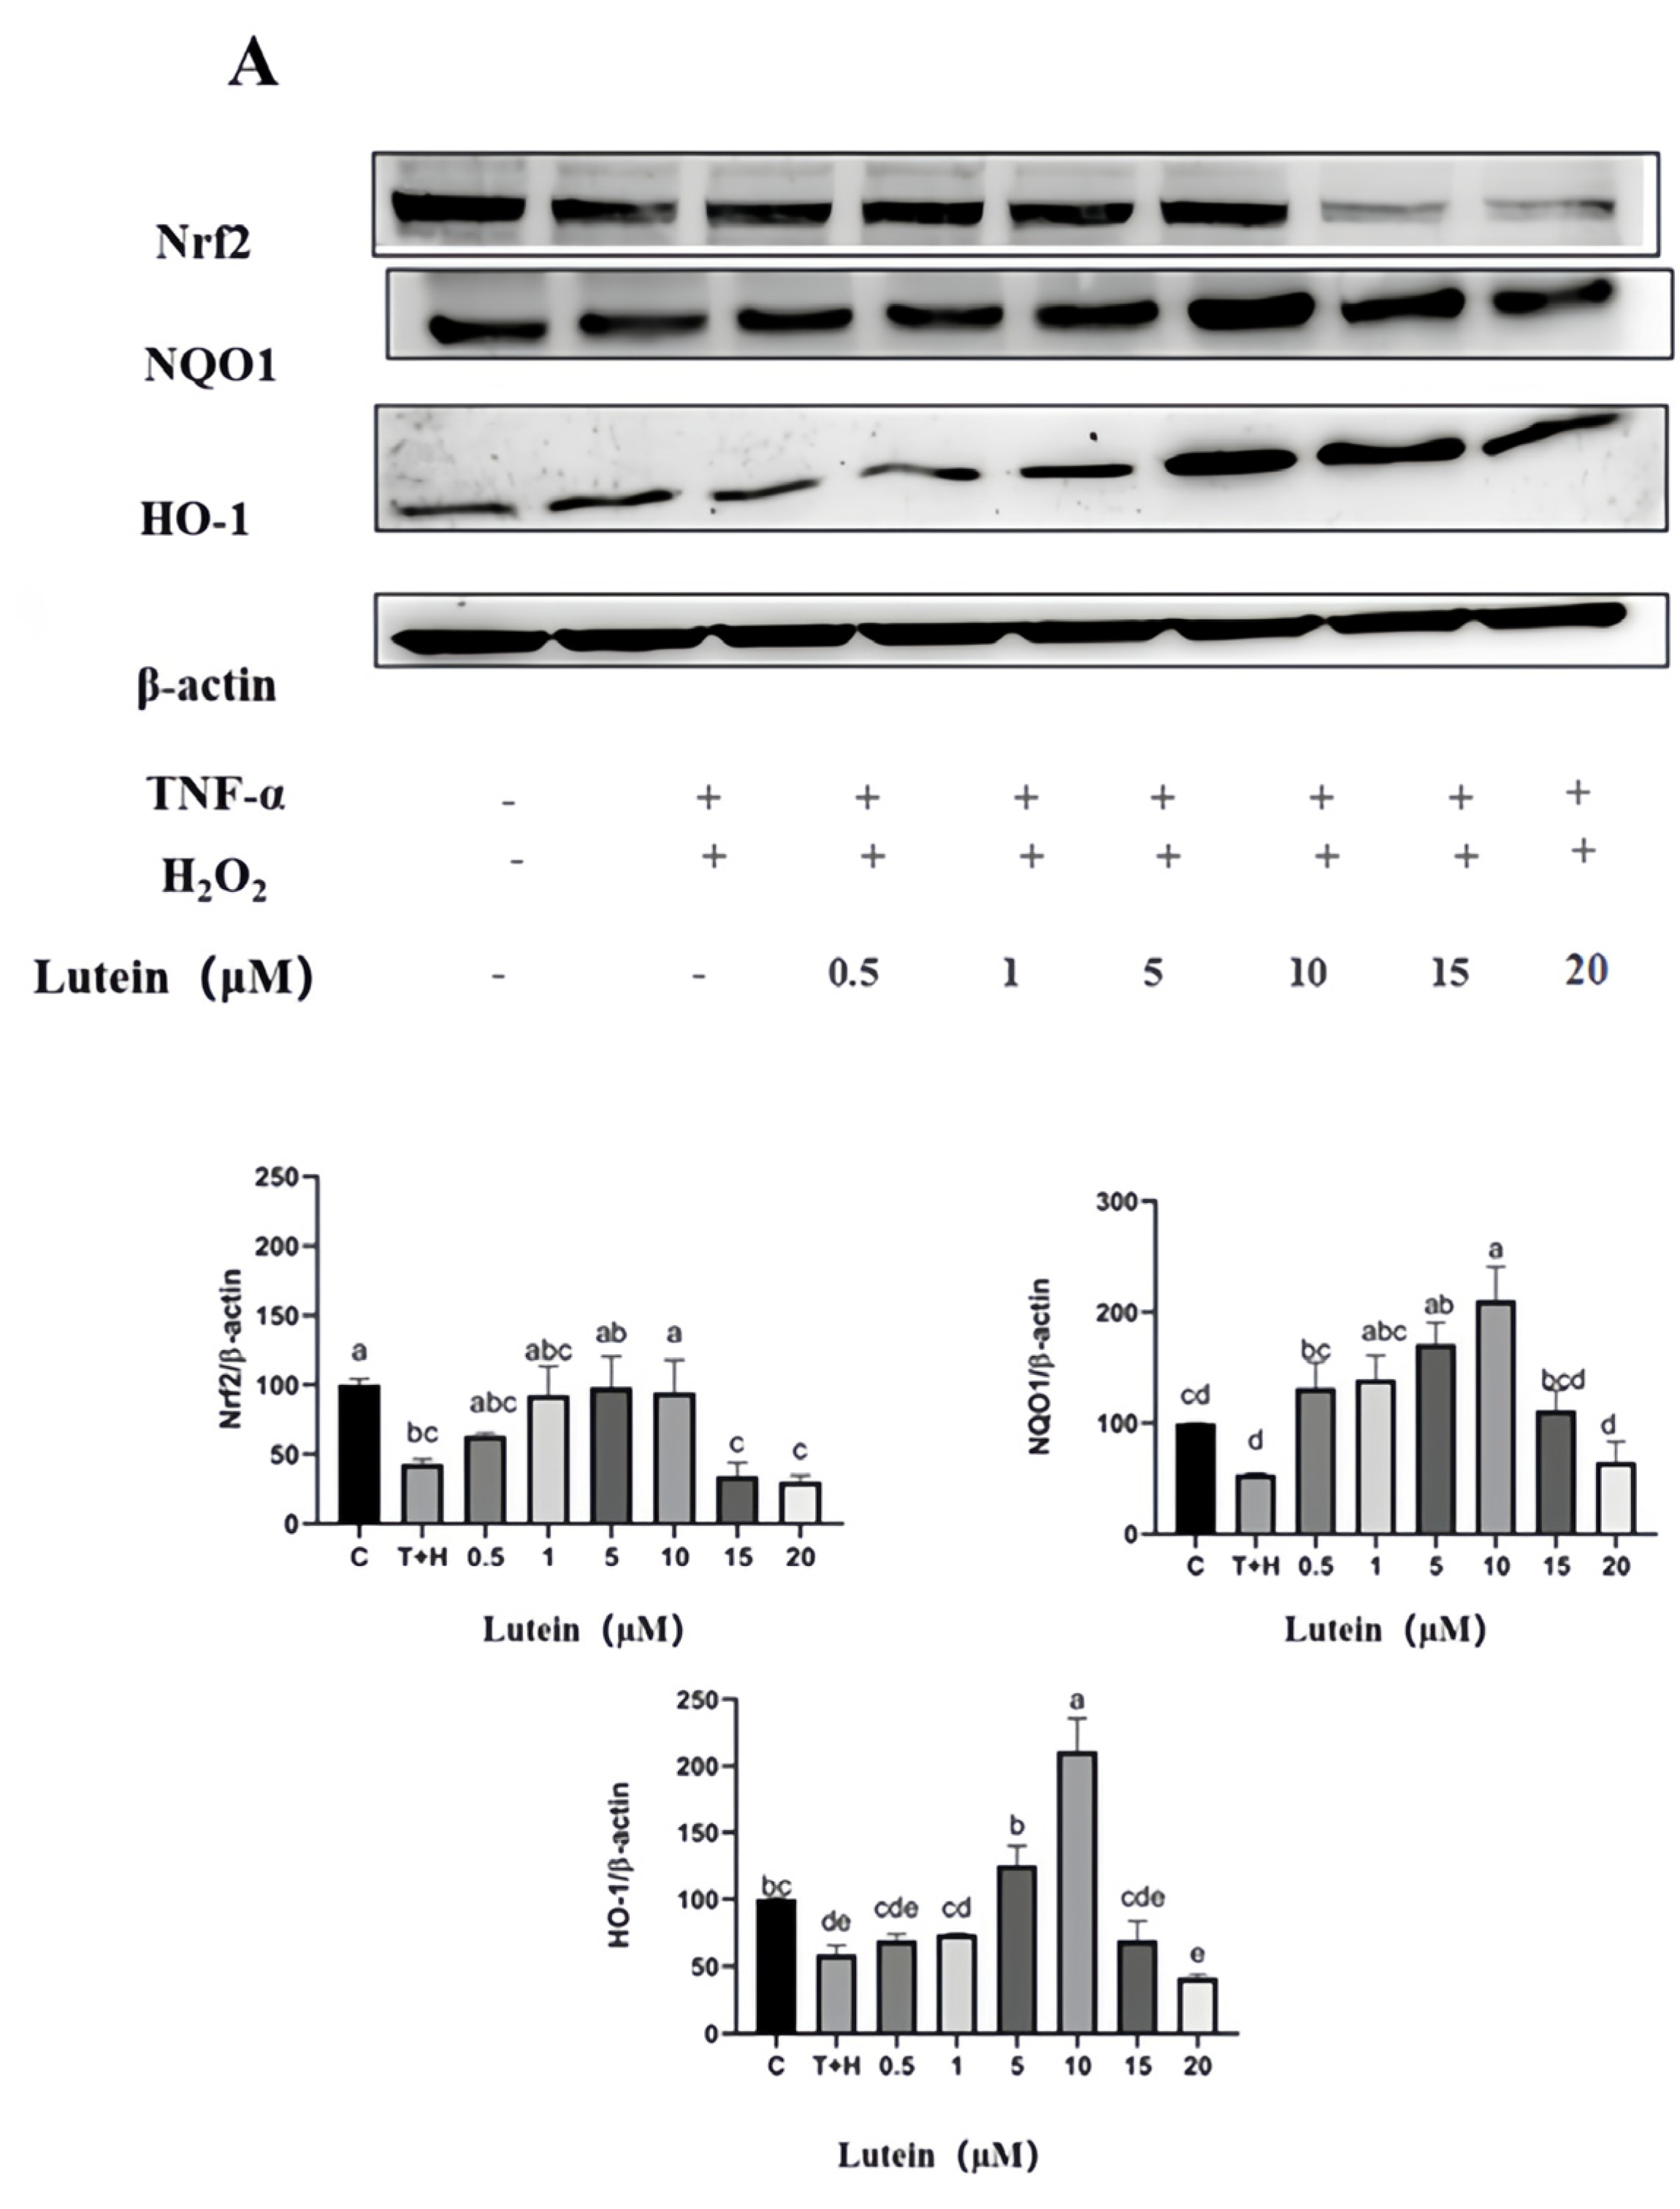
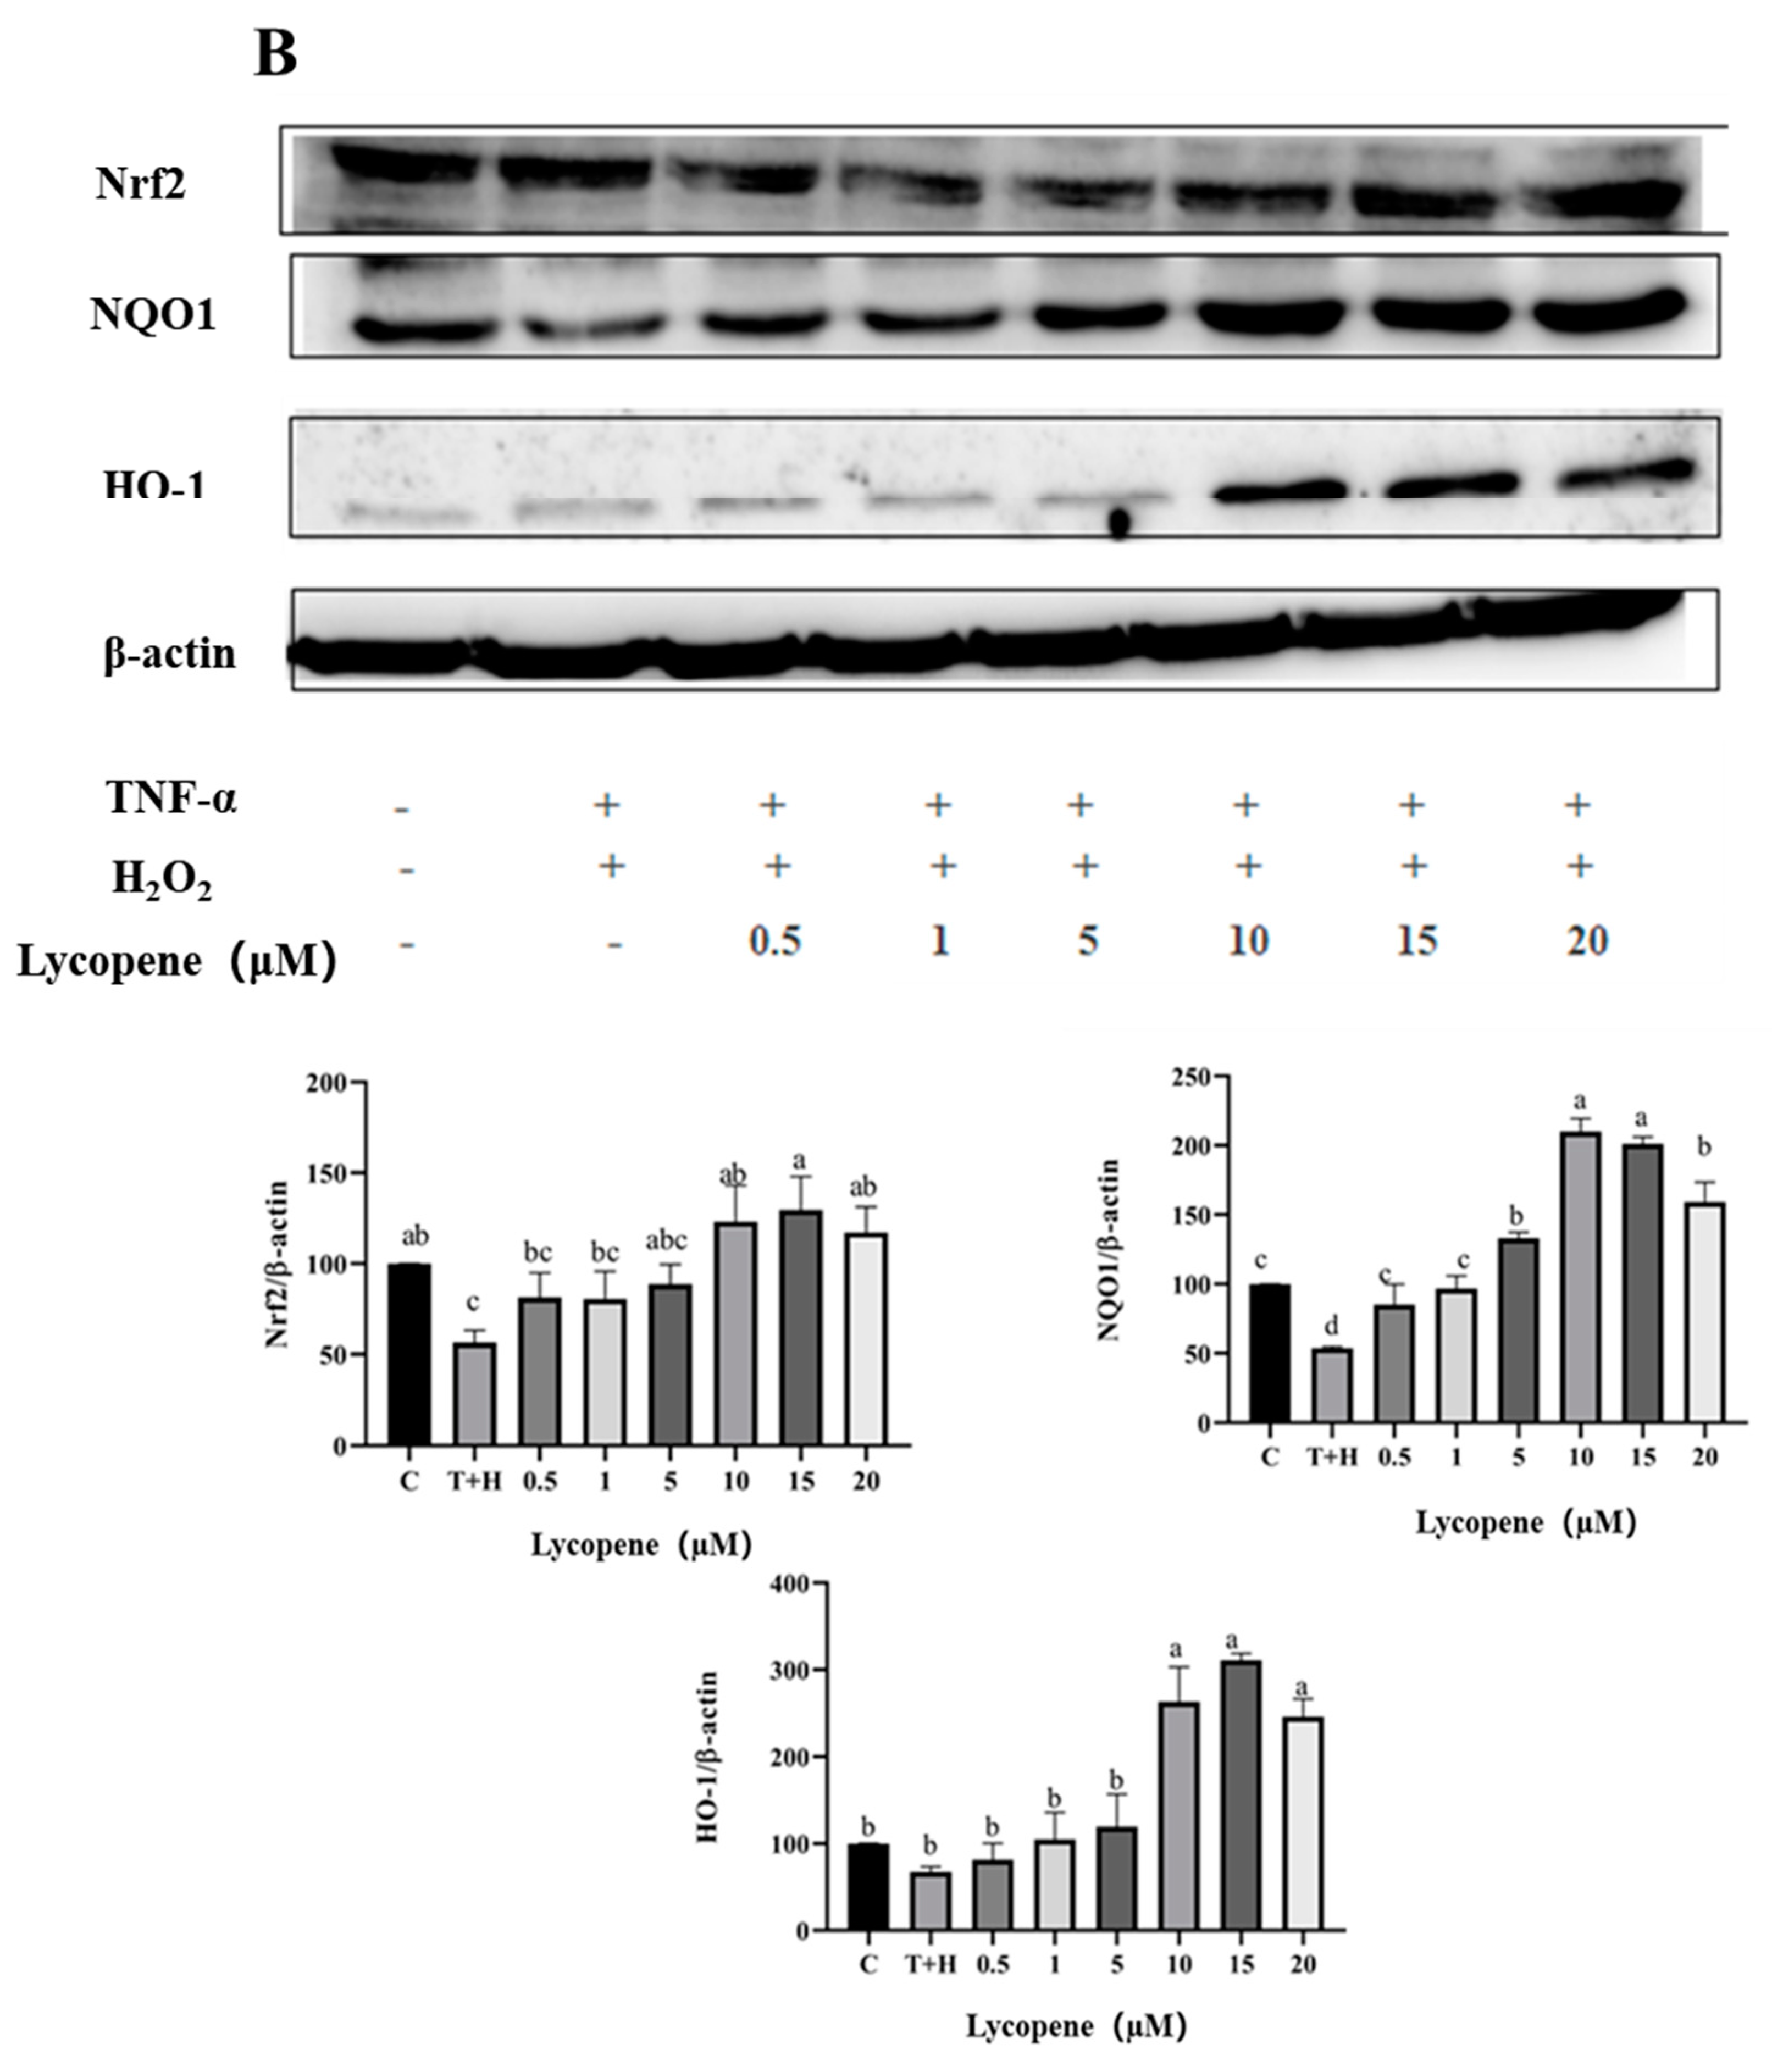
3.8. Activation of Nrf2 Pathway by Lutein, Lycopene, and Tomato Extract
3.9. Lutein, Lycopene and Tomato Extract Promote Nrf2 Nuclear Transport
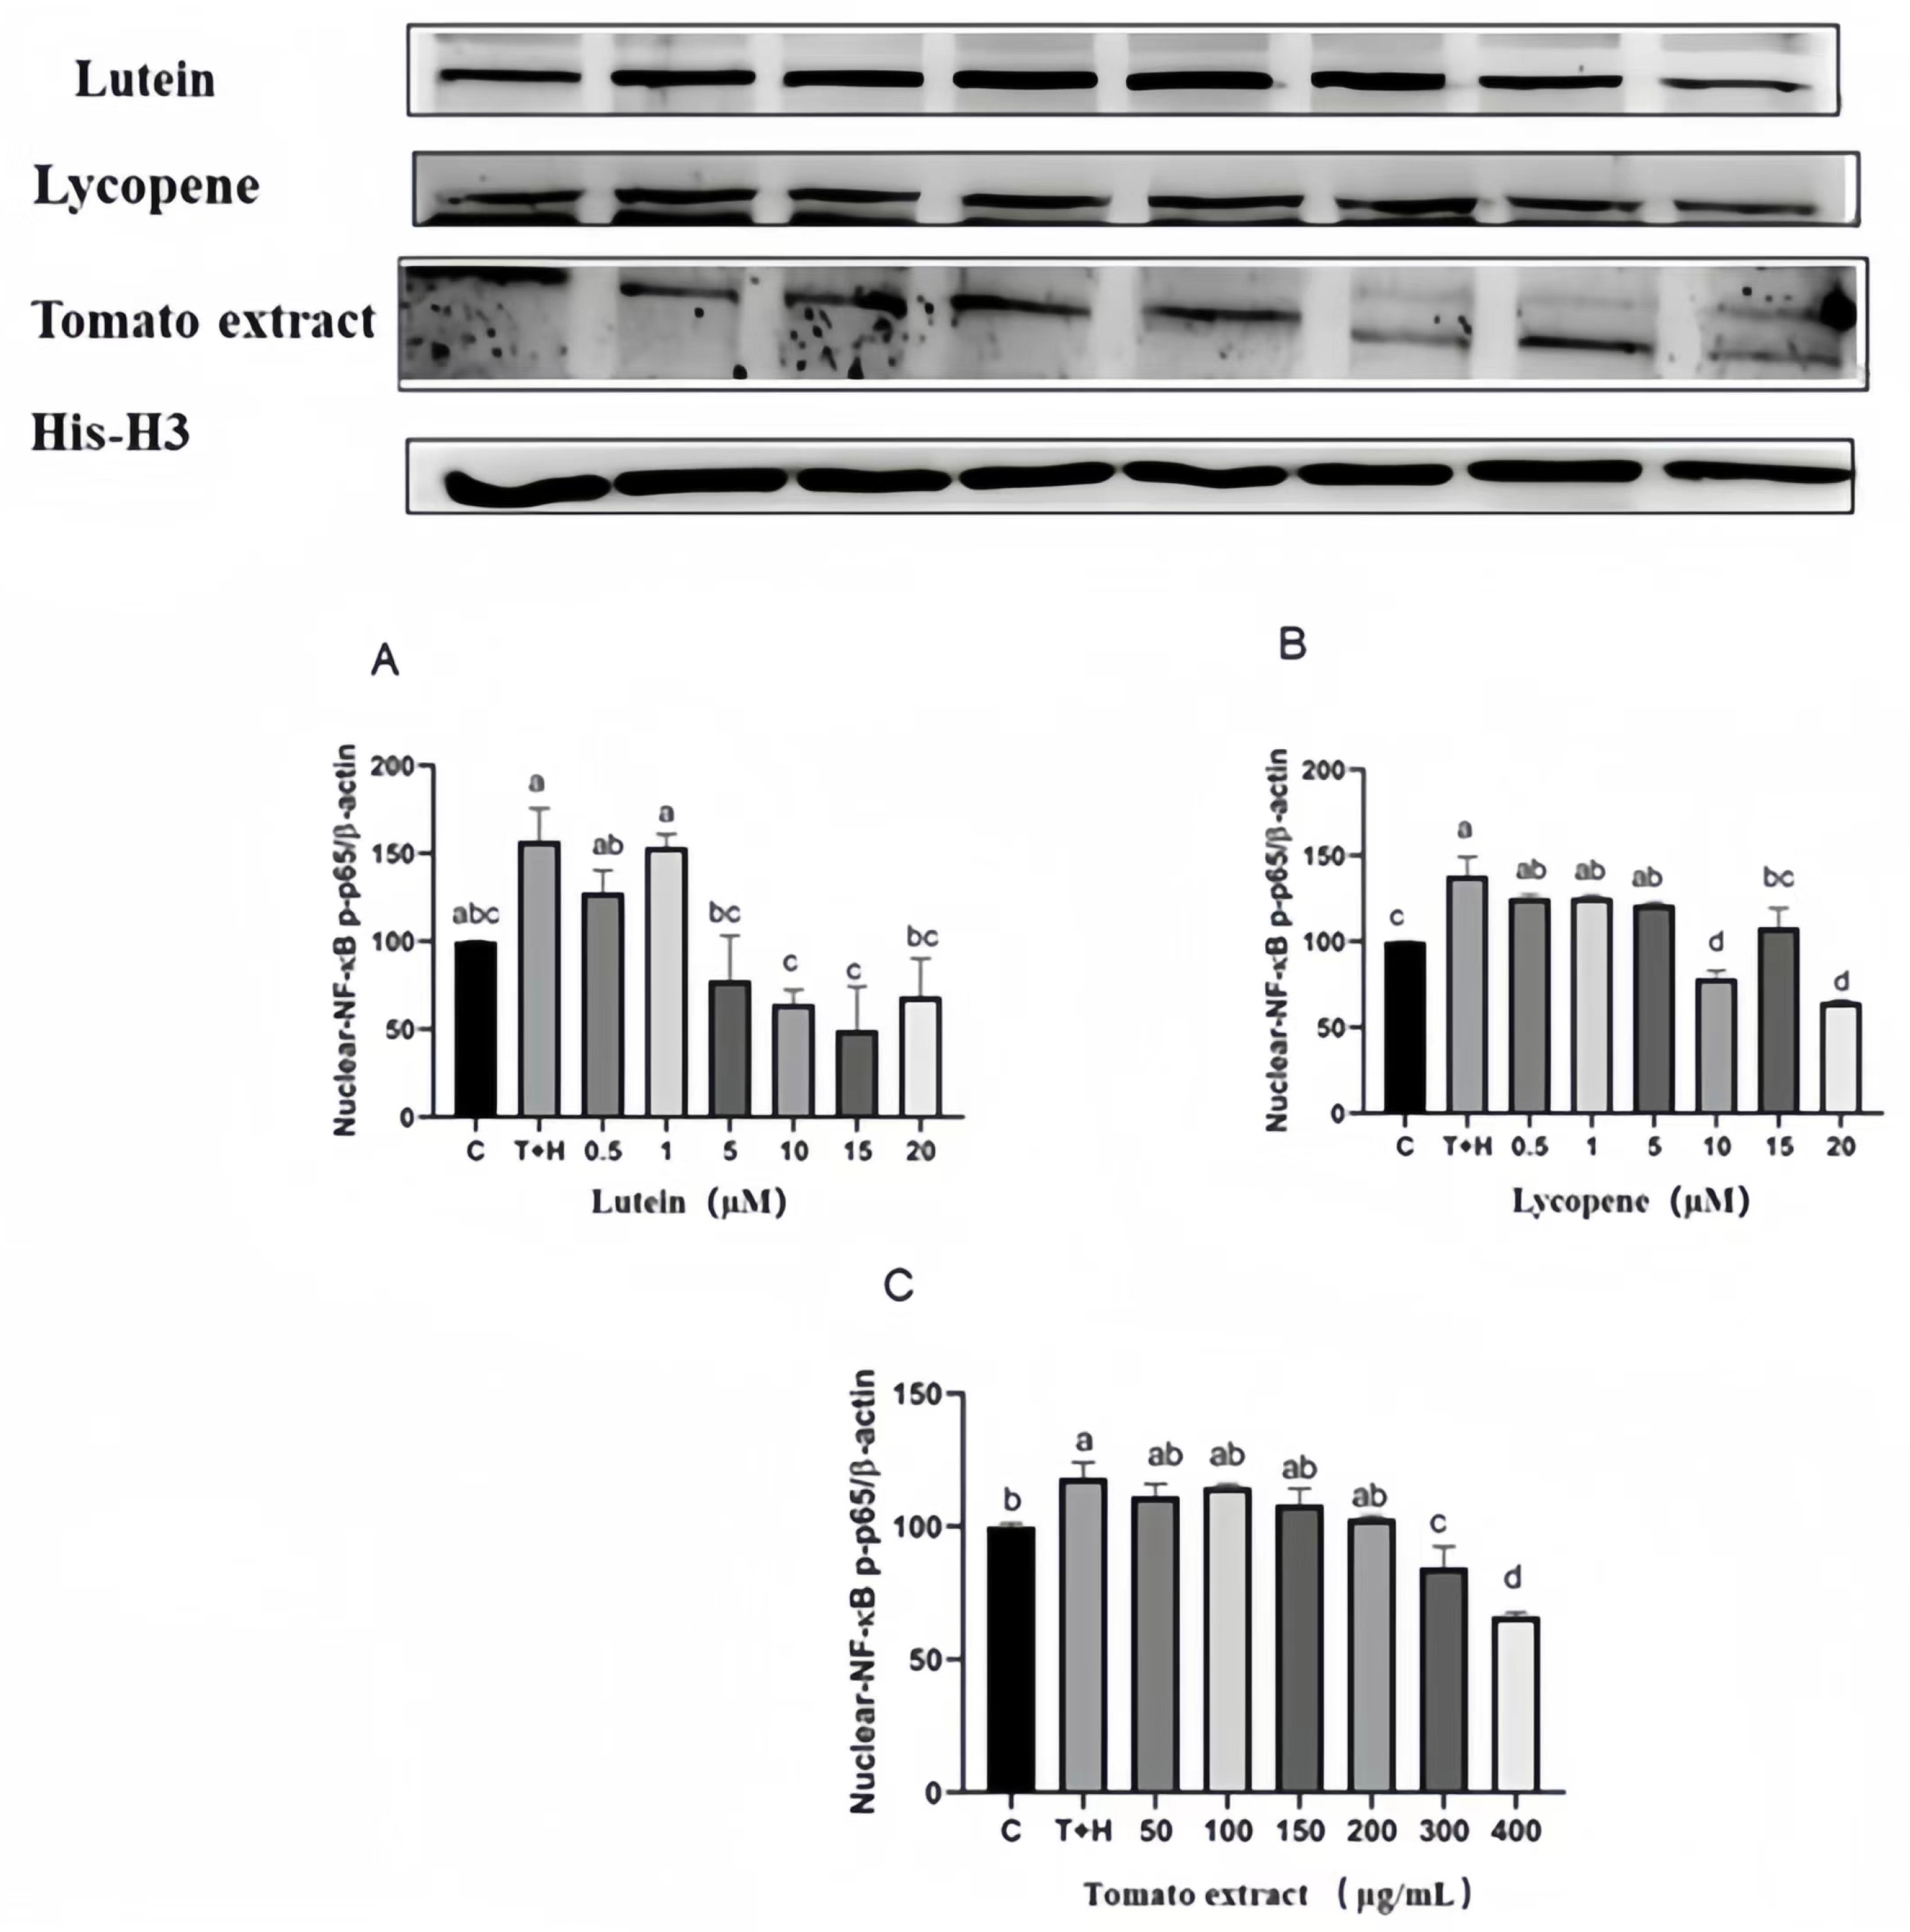
3.10. Effects of Lutein, Lycopene, and Tomato Extract on NF-κB Activation
3.11. Effects of Different Concentrations of Lutein, Lycopene, and Tomato Extract on NF-κB Nuclear Transport
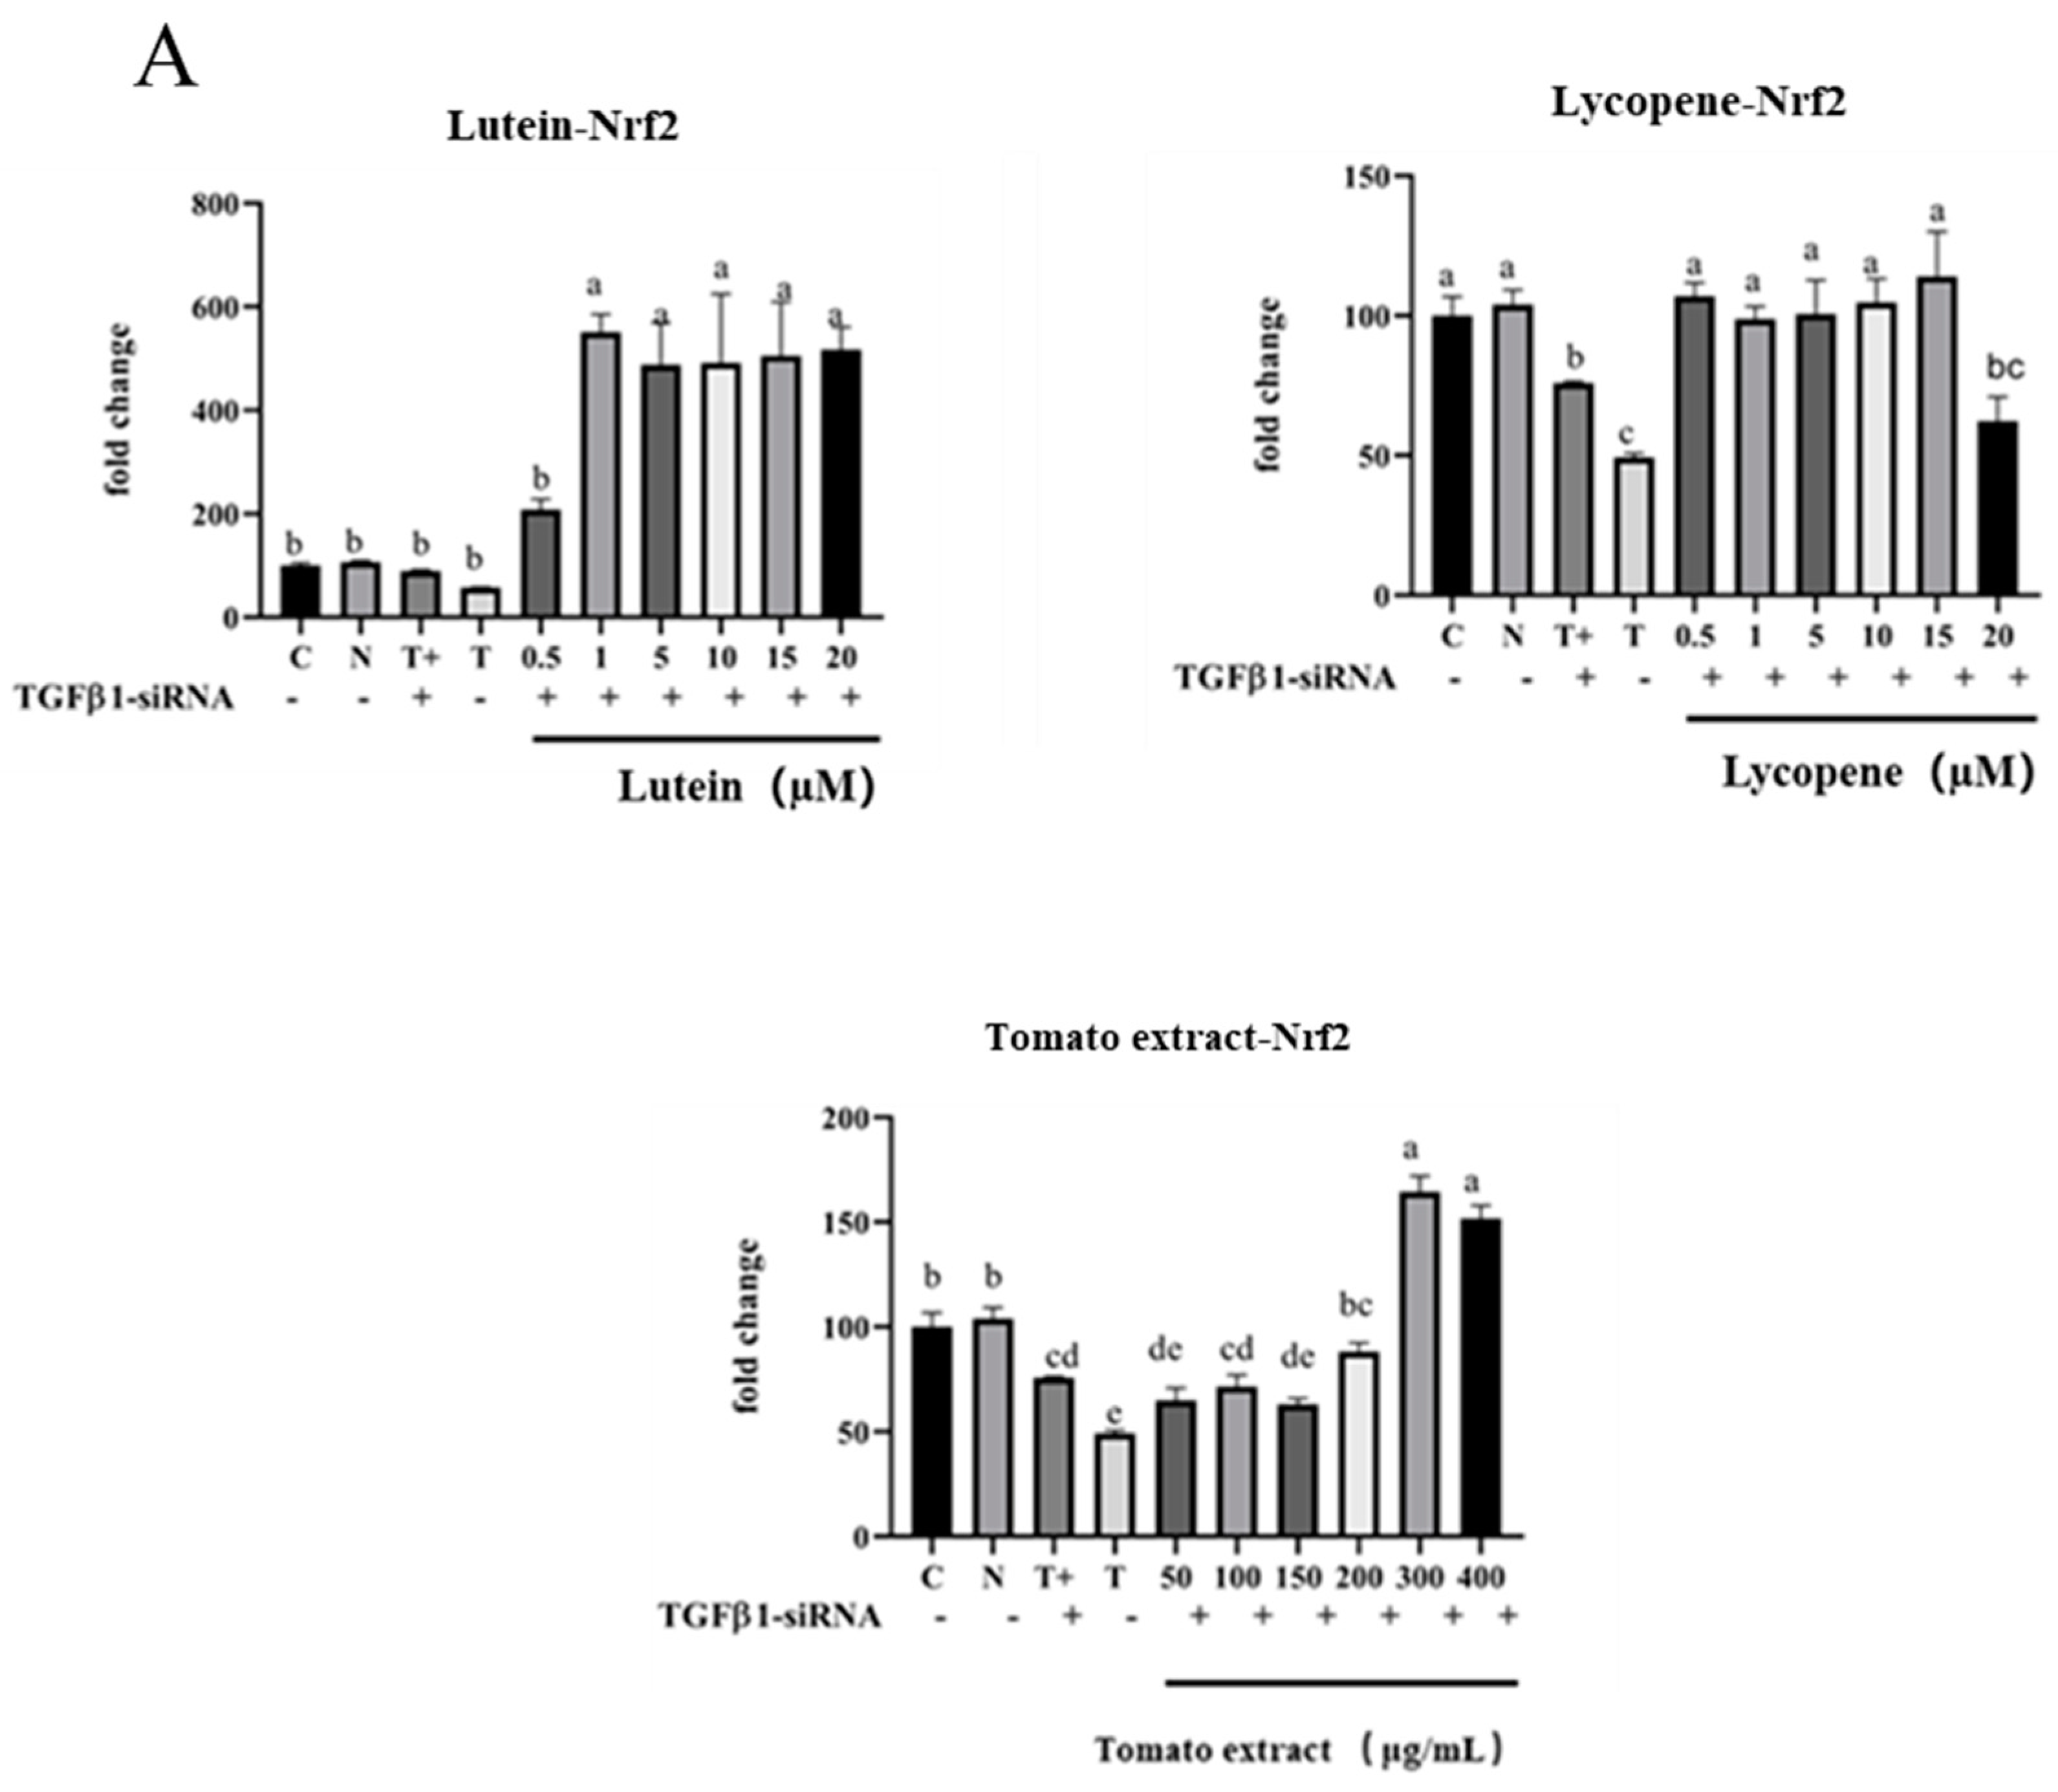
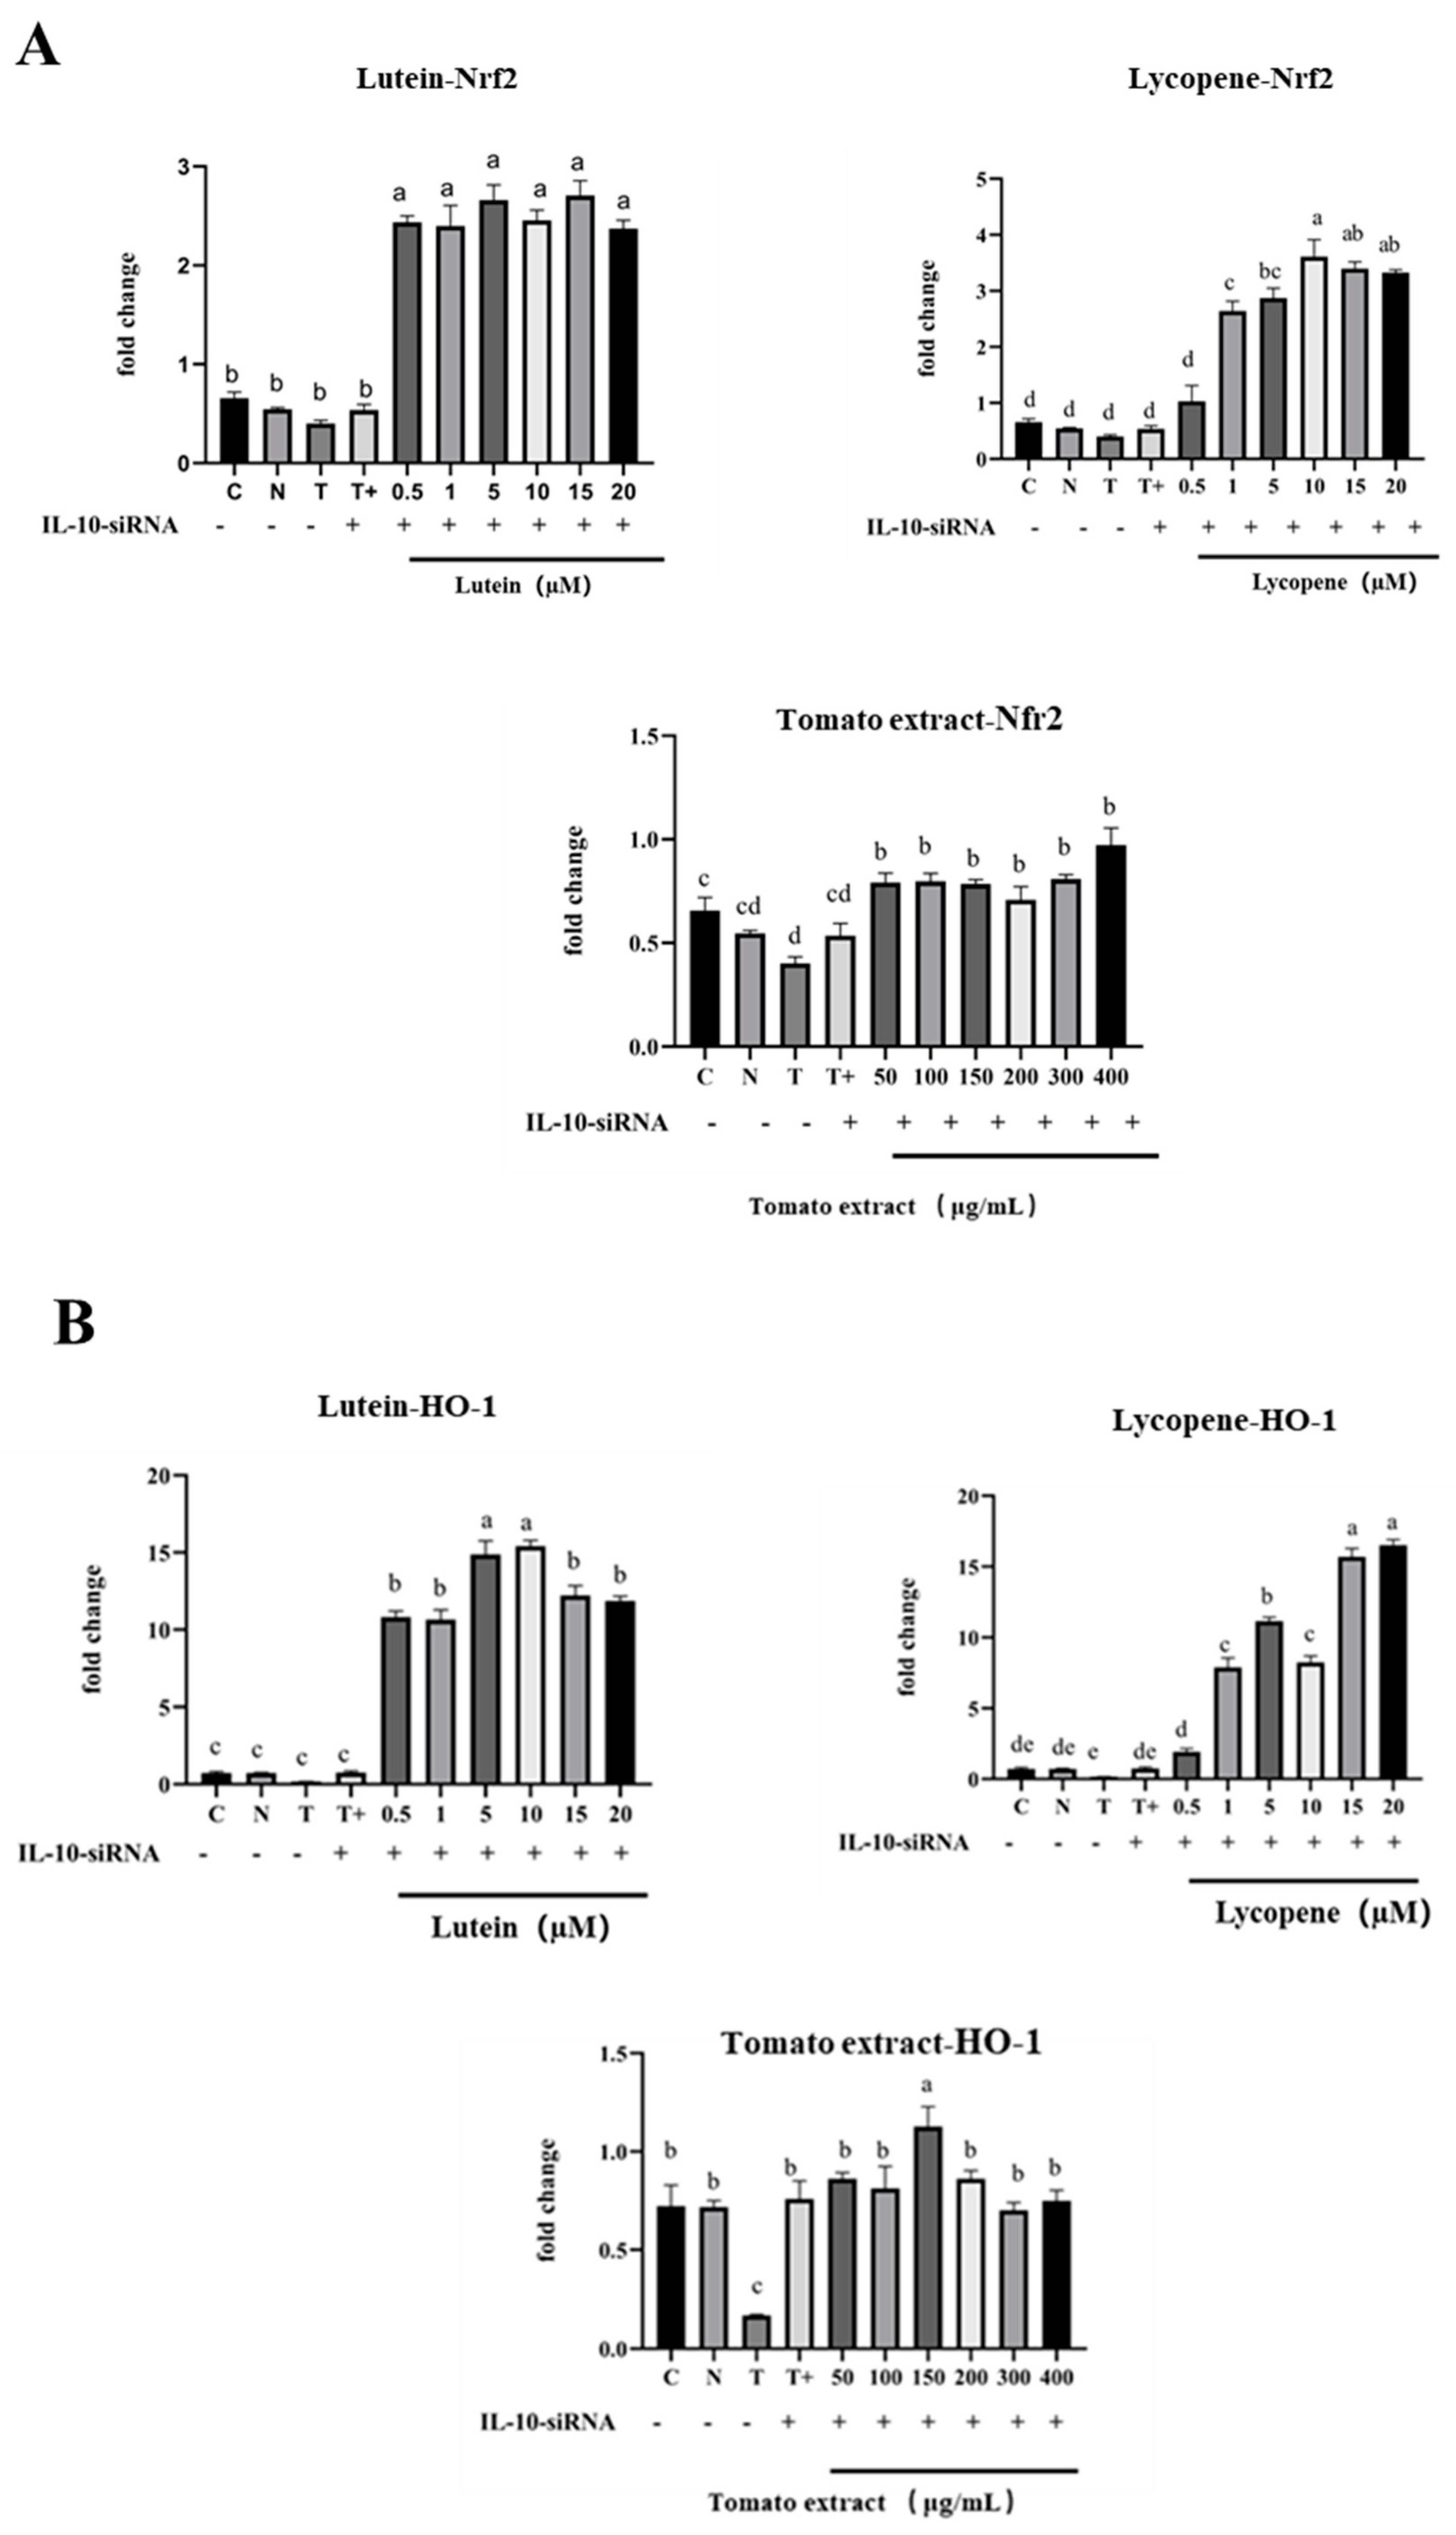
3.12. TGF-β1/IL-10 Regulates the Effect of Nrf2 and NF-κB mRNA Expression
3.12.1. Regulation of Nrf2 mRNA, HO-1 mRNA, and NF-κB mRNA by TGF-β1
3.12.2. Regulation of Nrf2 mRNA, HO-1 mRNA, and NF-κB mRNA by IL-10
4. Discussion
4.1. The Explanation of Antioxidation and Pro-Oxidation Effects
4.2. Interpretation of Anti-Inflammatory Vitality
4.3. Activation of Nrf2 Signaling Pathway and Inhibition of NF-κB Signaling Pathway
4.4. Modulation of Nrf2 and NF-κB Signaling Pathways by Anti-Inflammatory Factors
5. Conclusions
Supplementary Materials
Author Contributions
Funding
Institutional Review Board Statement
Informed Consent Statement
Data Availability Statement
Conflicts of Interest
References
- Nichols, M.; Townsend, N.; Scarborough, P.; Rayner, M. Cardiovascular Disease in Europe 2014: Epidemiological Update. Eur. Heart J. 2014, 35, 2950–2959. [Google Scholar] [CrossRef]
- Wu, J.; Xia, S.; Kalionis, B.; Wan, W.; Sun, T. The Role of Oxidative Stress and Inflammation in Cardiovascular Aging. BioMed. Res. Int. 2014, 2014, 1–13. [Google Scholar] [CrossRef]
- Ungvari, Z.; Orosz, Z.; Labinskyy, N.; Rivera, A.; Xiangmin, Z.; Smith, K.; Csiszar, A. Increased Mitochondrial H2O2 Production Promotes Endothelial NF-κB Activation in Aged Rat Arteries. Am. J. Physiol. Heart Circ. Physiol. 2007, 293, H37–H47. [Google Scholar] [CrossRef]
- Skeoch, S.; Bruce, I.N. Atherosclerosis in Rheumatoid Arthritis: Is It All about Inflammation? Nat. Rev. Rheumatol. 2015, 11, 390–400. [Google Scholar] [CrossRef]
- Lazzerini, P.E.; Capecchi, P.L.; Laghi-Pasini, F. The volume number of this article cannot be provided: Lessons from Rheumatoid Arthritis. Eur. Heart J. 2017, 38, 1717–1727. [Google Scholar] [CrossRef]
- Lugrin, J.; Rosenblatt-Velin, N.; Parapanov, R.; Liaudet, L. The Role of Oxidative Stress during Inflammatory Processes. Biol. Chem. 2014, 395, 203–230. [Google Scholar] [CrossRef]
- Kay, J.; Thadhani, E.; Samson, L.; Engelward, B. Inflammation-Induced DNA Damage, Mutations and Cancer. DNA Repair 2019, 83, 102673. [Google Scholar] [CrossRef]
- Alotaibi, B.S.; Ijaz, M.; Buabeid, M.; Kharaba, Z.J.; Yaseen, H.S.; Murtaza, G. Therapeutic Effects and Safe Uses of Plant-Derived Polyphenolic Compounds in Cardiovascular Diseases: A Review. Drug Des. Devel. Ther. 2021, 15, 4713–4732. [Google Scholar] [CrossRef]
- Xu, W.; Lu, H.; Yuan, Y.; Deng, Z.; Zheng, L.; Li, H. The Antioxidant and Anti-Inflammatory Effects of Flavonoids from Propolis via Nrf2 and NF-κB Pathways. Foods 2022, 11, 2439. [Google Scholar] [CrossRef]
- Imran, M.; Ghorat, F.; Ul-Haq, I.; Ur-Rehman, H.; Aslam, F.; Heydari, M.; Shariati, M.A.; Okuskhanova, E.; Yessimbekov, Z.; Thiruvengadam, M.; et al. Lycopene as a Natural Antioxidant Used to Prevent Human Health Disorders. Antioxidants 2020, 9, 706. [Google Scholar] [CrossRef]
- Cha, J.H.; Kim, W.K.; Ha, A.W.; Kim, M.H.; Chang, M.J. Anti-Inflammatory Effect of Lycopene in SW480 Human Colorectal Cancer Cells. Nutr. Res. Pract. 2017, 11, 90. [Google Scholar] [CrossRef]
- Yin, Y.; Zheng, Z.; Jiang, Z. Effects of Lycopene on Metabolism of Glycolipid in Type 2 Diabetic Rats. Biomed. Pharmacother. 2019, 109, 2070–2077. [Google Scholar] [CrossRef]
- Das, K.K.; Razzaghi-Asl, N.; Tikare, S.N.; Di Santo, R.; Costi, R.; Messore, A.; Pescatori, L.; Crucitti, G.C.; Jargar, J.G.; Dhundasi, S.A.; et al. Hypoglycemic Activity of Curcumin Synthetic Analogues in Alloxan-Induced Diabetic Rats. J. Enzyme Inhib. Med. Chem. 2016, 31, 99–105. [Google Scholar] [CrossRef]
- Zhang, X.; Zhou, Q.; Qi, Y.; Chen, X.; Deng, J.; Zhang, Y.; Li, R.; Fan, J. The Effect of Tomato and Lycopene on Clinical Characteristics and Molecular Markers of UV-Induced Skin Deterioration: A Systematic Review and Meta-Analysis of Intervention Trials. Crit. Rev. Food Sci. Nutr. 2023, 1–20. [Google Scholar] [CrossRef] [PubMed]
- Chen, M.-L.; Lin, Y.-H.; Yang, C.-M.; Hu, M.-L. Lycopene Inhibits Angiogenesis Both in Vitro and in Vivo by Inhibiting MMP-2/uPA System through VEGFR2-Mediated PI3K-Akt and ERK/P38 Signaling Pathways. Mol. Nutr. Food Res. 2012, 56, 889–899. [Google Scholar] [CrossRef]
- Khongthaw, B.; Dulta, K.; Chauhan, P.K.; Kumar, V.; Ighalo, J.O. Lycopene: A Therapeutic Strategy against Coronavirus Disease 19 (COVID-19). Inflammopharmacology 2022, 30, 1955–1976. [Google Scholar] [CrossRef] [PubMed]
- Hajizadeh-Sharafabad, F.; Ghoreishi, Z.; Maleki, V.; Tarighat-Esfanjani, A. Mechanistic Insights into the Effect of Lutein on Atherosclerosis, Vascular Dysfunction, and Related Risk Factors: A Systematic Review of in Vivo, Ex Vivo and in Vitro Studies. Pharmacol. Res. 2019, 149, 104477. [Google Scholar] [CrossRef] [PubMed]
- Howard, A.N.; Thurnham, D.I. Lutein and Atherosclerosis: Belfast versus Toulouse Revisited. Med. Hypotheses 2017, 98, 63–68. [Google Scholar] [CrossRef]
- Wang, M.-X.; Jiao, J.-H.; Li, Z.-Y.; Liu, R.-R.; Shi, Q.; Ma, L. Lutein Supplementation Reduces Plasma Lipid Peroxidation and C-Reactive Protein in Healthy Nonsmokers. Atherosclerosis 2013, 227, 380–385. [Google Scholar] [CrossRef]
- Caseiro, M.; Ascenso, A.; Costa, A.; Creagh-Flynn, J.; Johnson, M.; Simões, S. Lycopene in Human Health. LWT 2020, 127, 109323. [Google Scholar] [CrossRef]
- Petyaev, I.M. Lycopene Deficiency in Ageing and Cardiovascular Disease. Oxid. Med. Cell. Longev. 2016, 2016, 1–6. [Google Scholar] [CrossRef] [PubMed]
- Bae, J.W.; Bae, J.-S. Barrier Protective Effects of Lycopene in Human Endothelial Cells. Inflamm. Res. 2011, 60, 751–758. [Google Scholar] [CrossRef] [PubMed]
- Dwyer, J.H.; Navab, M.; Dwyer, K.M.; Hassan, K.; Sun, P.; Shircore, A.; Hama-Levy, S.; Hough, G.; Wang, X.; Drake, T.; et al. Oxygenated Carotenoid Lutein and Progression of Early Atherosclerosis: The Los Angeles Atherosclerosis Study. Circulation 2001, 103, 2922–2927. [Google Scholar] [CrossRef]
- Zhang, P.; Li, J.; Li, M.; Sui, Y.; Zhou, Y.; Sun, Y. Effects of lycopene on metabolism of glycolipid and inflammation in non-alcoholic fatty liver disease rats. J. Hyg. Res. 2020, 49, 254–258+271. [Google Scholar] [CrossRef]
- Kimes, B.; Brandt, B. Properties of a Clonal Muscle Cell Line from Rat Heart. Exp. Cell Res. 1976, 98, 367–381. [Google Scholar] [CrossRef] [PubMed]
- Ransy, C.; Vaz, C.; Lombès, A.; Bouillaud, F. Use of H2O2 to Cause Oxidative Stress, the Catalase Issue. Int. J. Mol. Sci. 2020, 21, 9149. [Google Scholar] [CrossRef]
- Noworyta-Sokołowska, K.; Górska, A.; Gołembiowska, K. LPS-Induced Oxidative Stress and Inflammatory Reaction in the Rat Striatum. Pharmacol. Rep. 2013, 65, 863–869. [Google Scholar] [CrossRef]
- Xu, W.; Deng, Z.; Li, H. The effect of combination of TNF-α and H2O2 induced oxidative stress and inflammatory injury in H9c2 cells. J. Nanchang Univ. (Nat. Sci.) 2023, 47, 175–183. [Google Scholar] [CrossRef]
- Ma, Y.; Zhou, B. Condition Optimization for Extracting Carotenoids in Tomato Fruit by Ultra-sonic. Plant Physiol. J. 2005, 41, 659. [Google Scholar]
- Zhang, Q.; Shen, X.; Liu, S. Determination of lutein, lycopene, and β-carotene in serum by HPLC. Acta Nutr. Sin. 2009, 31, 498–501. [Google Scholar]
- Gill, B.D.; Indyk, H.E. Liquid Chromatographic Method for the Determination of Lutein in Milk and Pediatric Formulas. Int. Dairy J. 2008, 18, 894–898. [Google Scholar] [CrossRef]
- Tzouganaki, Z.D.; Atta-Politou, J.; Koupparis, M.A. Development and Validation of Liquid Chromatographic Method for the Determination of Lycopene in Plasma. Anal. Chim. Acta 2002, 467, 115–123. [Google Scholar] [CrossRef]
- Sahoo, B.M.; Banik, B.K.; Borah, P.; Jain, A. Reactive Oxygen Species (ROS): Key Components in Cancer Therapies. Anticancer Agents Med. Chem. 2022, 22, 215–222. [Google Scholar] [CrossRef] [PubMed]
- Rosa, A.C.; Corsi, D.; Cavi, N.; Bruni, N.; Dosio, F. Superoxide Dismutase Administration: A Review of Proposed Human Uses. Molecules 2021, 26, 1844. [Google Scholar] [CrossRef] [PubMed]
- Forstermann, U.; Sessa, W.C. Nitric Oxide Synthases: Regulation and Function. Eur. Heart J. 2012, 33, 829–837. [Google Scholar] [CrossRef] [PubMed]
- Florio, T.J.; Lokareddy, R.K.; Yeggoni, D.P.; Sankhala, R.S.; Ott, C.A.; Gillilan, R.E.; Cingolani, G. Differential Recognition of Canonical NF-κB Dimers by Importin A3. Nat. Commun. 2022, 13, 1207. [Google Scholar] [CrossRef] [PubMed]
- Gomes, A.; Fernandes, E.; Lima, J.L.F.C. Fluorescence Probes Used for Detection of Reactive Oxygen Species. J. Biochem. Biophys. Methods 2005, 65, 45–80. [Google Scholar] [CrossRef] [PubMed]
- Maoka, T. Carotenoids as Natural Functional Pigments. J. Nat. Med. 2020, 74, 1–16. [Google Scholar] [CrossRef]
- Hedayati, N.; Naeini, M.B.; Nezami, A.; Hosseinzadeh, H.; Wallace Hayes, A.; Hosseini, S.; Imenshahidi, M.; Karimi, G. Protective Effect of Lycopene against Chemical and Natural Toxins: A Review. BioFactors 2019, 45, 5–23. [Google Scholar] [CrossRef]
- Ahn, Y.J.; Kim, H. Lutein as a Modulator of Oxidative Stress-Mediated Inflammatory Diseases. Antioxidants 2021, 10, 1448. [Google Scholar] [CrossRef]
- Alves-Rodrigues, A.; Shao, A. The Science behind Lutein. Toxicol. Lett. 2004, 150, 57–83. [Google Scholar] [CrossRef] [PubMed]
- Inbaraj, B.; Chen, B. Carotenoids in Tomato Plants. In Tomatoes and Tomato Products; Preedy, V., Watson, R., Eds.; Science Publishers: Boca Raton, FL, USA, 2008; pp. 133–164. ISBN 978-1-57808-534-7. [Google Scholar]
- Ribeiro, D.; Freitas, M.; Silva, A.M.S.; Carvalho, F.; Fernandes, E. Antioxidant and Pro-Oxidant Activities of Carotenoids and Their Oxidation Products. Food Chem. Toxicol. 2018, 120, 681–699. [Google Scholar] [CrossRef] [PubMed]
- Srivastava, R. Physicochemical, Antioxidant Properties of Carotenoids and Its Optoelectronic and Interaction Studies with Chlorophyll Pigments. Sci. Rep. 2021, 11, 18365. [Google Scholar] [CrossRef] [PubMed]
- El-Agamey, A.; Lowe, G.M.; McGarvey, D.J.; Mortensen, A.; Phillip, D.M.; Truscott, T.G.; Young, A.J. Carotenoid Radical Chemistry and Antioxidant/pro-Oxidant Properties. Arch. Biochem. Biophys. 2004, 430, 37–48. [Google Scholar] [CrossRef] [PubMed]
- Palozza, P.; Serini, S.; Di Nicuolo, F.; Piccioni, E.; Calviello, G. Prooxidant Effects of β-Carotene in Cultured Cells. Mol. Aspects Med. 2003, 24, 353–362. [Google Scholar] [CrossRef]
- Salgo, M.G.; Cueto, R.; Winston, G.W.; Pryor, W.A. Beta Carotene and Its Oxidation Products Have Different Effects on Microsome Mediated Binding of Benzo[a]Pyrene to DNA. Free Radic. Biol. Med. 1999, 26, 162–173. [Google Scholar] [CrossRef]
- Song, Y. Factors of antioxidant and prooxidant activities of carotenoids. J. Hyg. Res. 2003, 32, 417–419+421. [Google Scholar]
- Tonelli, C.; Chio, I.I.C.; Tuveson, D.A. Transcriptional Regulation by Nrf2. Antioxid. Redox Signal. 2018, 29, 1727–1745. [Google Scholar] [CrossRef]
- Buttari, B.; Arese, M.; Oberley-Deegan, R.E.; Saso, L.; Chatterjee, A. NRF2: A Crucial Regulator for Mitochondrial Metabolic Shift and Prostate Cancer Progression. Front. Physiol. 2022, 13, 989793. [Google Scholar] [CrossRef]
- Liu, S.; Pi, J.; Zhang, Q. Signal Amplification in the KEAP1-NRF2-ARE Antioxidant Response Pathway. Redox Biol. 2022, 54, 102389. [Google Scholar] [CrossRef]
- Kansanen, E.; Kuosmanen, S.M.; Leinonen, H.; Levonen, A.-L. The Keap1-Nrf2 Pathway: Mechanisms of Activation and Dysregulation in Cancer. Redox Biol. 2013, 1, 45–49. [Google Scholar] [CrossRef] [PubMed]
- Wang, X.; Peng, H.; Huang, Y.; Kong, W.; Cui, Q.; Du, J.; Jin, H. Post-Translational Modifications of IκBα: The State of the Art. Front. Cell Dev. Biol. 2020, 8, 574706. [Google Scholar] [CrossRef] [PubMed]
- Wardyn, J.D.; Ponsford, A.H.; Sanderson, C.M. Dissecting Molecular Cross-Talk between Nrf2 and NF-κB Response Pathways. Biochem. Soc. Trans. 2015, 43, 621–626. [Google Scholar] [CrossRef] [PubMed]
- He, F.; Ru, X.; Wen, T. NRF2, a Transcription Factor for Stress Response and Beyond. Int. J. Mol. Sci. 2020, 21, 4777. [Google Scholar] [CrossRef]


Disclaimer/Publisher’s Note: The statements, opinions and data contained in all publications are solely those of the individual author(s) and contributor(s) and not of MDPI and/or the editor(s). MDPI and/or the editor(s) disclaim responsibility for any injury to people or property resulting from any ideas, methods, instructions or products referred to in the content. |
© 2023 by the authors. Licensee MDPI, Basel, Switzerland. This article is an open access article distributed under the terms and conditions of the Creative Commons Attribution (CC BY) license (https://creativecommons.org/licenses/by/4.0/).
Share and Cite
Ba, W.; Xu, W.; Deng, Z.; Zhang, B.; Zheng, L.; Li, H. The Antioxidant and Anti-Inflammatory Effects of the Main Carotenoids from Tomatoes via Nrf2 and NF-κB Signaling Pathways. Nutrients 2023, 15, 4652. https://doi.org/10.3390/nu15214652
Ba W, Xu W, Deng Z, Zhang B, Zheng L, Li H. The Antioxidant and Anti-Inflammatory Effects of the Main Carotenoids from Tomatoes via Nrf2 and NF-κB Signaling Pathways. Nutrients. 2023; 15(21):4652. https://doi.org/10.3390/nu15214652
Chicago/Turabian StyleBa, Wenxiu, Wenzhen Xu, Zeyuan Deng, Bing Zhang, Liufeng Zheng, and Hongyan Li. 2023. "The Antioxidant and Anti-Inflammatory Effects of the Main Carotenoids from Tomatoes via Nrf2 and NF-κB Signaling Pathways" Nutrients 15, no. 21: 4652. https://doi.org/10.3390/nu15214652
APA StyleBa, W., Xu, W., Deng, Z., Zhang, B., Zheng, L., & Li, H. (2023). The Antioxidant and Anti-Inflammatory Effects of the Main Carotenoids from Tomatoes via Nrf2 and NF-κB Signaling Pathways. Nutrients, 15(21), 4652. https://doi.org/10.3390/nu15214652