
Adherence to Infant Feeding Guidelines in the First Foods New Zealand Study

 , , ,
, , ,  , , ,
, , ,  , , , , add
Show full author list
, , , , add
Show full author list
Abstract
:1. Introduction
2. Materials and Methods
2.1. Study Design
2.2. Participants
2.3. Data Collection
2.4. Adherence to National Infant Feeding Guidelines
2.5. Food Coding
2.6. Statistical Analysis
3. Results
3.1. Maternal and Infant Characteristics
3.2. Adherence to Infant Feeding Guidelines
3.2.1. Breastfeeding
3.2.2. Introduction of Solids
3.2.3. Food Group Intake of Infants
3.2.4. Appropriate Foods and Beverages
3.2.5. Feeding Environment
4. Discussion
4.1. Adherence to Breastfeeding Recommendations
4.2. Adherence to Complementary Feeding Recommendation
4.3. Adherence to Food Group Recommendations
4.4. Adherence to Appropriate Food and Beverage Recommendations
4.5. Strengths, Limitations, and Future Research
5. Conclusions
Author Contributions
Funding
Institutional Review Board Statement
Informed Consent Statement
Data Availability Statement
Acknowledgments
Conflicts of Interest
References
- Smithers, L.G.; Golley, R.K.; Brazionis, L.; Emmett, P.; Northstone, K.; Lynch, J.W. Dietary patterns of infants and toddlers are associated with nutrient intakes. Nutrients 2012, 4, 935–948. [Google Scholar]
- Birch, L.; Savage, J.S.; Ventura, A. Influences on the development of children’s eating behaviours: From infancy to adolescence. Can. J. Diet. Pract. Res. 2007, 68, s1. [Google Scholar] [PubMed]
- Lioret, S.; McNaughton, S.; Spence, A.; Crawford, D.; Campbell, K. Tracking of dietary intakes in early childhood: The Melbourne InFANT Program. Eur. J. Clin. Nutr. 2013, 67, 275–281. [Google Scholar] [CrossRef]
- Grummer-Strawn, L.M.; Scanlon, K.S.; Fein, S.B. Infant feeding and feeding transitions during the first year of life. Pediatrics 2008, 122, S36–S42. [Google Scholar] [CrossRef]
- Ministry of Health. Healthy Eating Guidelines for New Zealand Babies and Toddlers (0–2 Years Old); Ministry of Health: Wellington, New Zealand, 2021.
- Plunket. What We Offer. Available online: https://www.plunket.org.nz/ (accessed on 26 October 2023).
- World Health Organization. Infant and Young Child Feeding. Available online: https://www.who.int/news-room/fact-sheets/detail/infant-and-young-child-feeding (accessed on 5 October 2022).
- United Nations International Children’s Emergency Fund. Too Many Children Are Not Eating the Nutrient-Rich Foods They Need to Grow and Develop. Available online: https://data.unicef.org/topic/nutrition/diets/ (accessed on 5 October 2022).
- Golley, R.K.; Smithers, L.G.; Mittinty, M.N.; Brazionis, L.; Emmett, P.; Northstone, K.; Campbell, K.; McNaughton, S.A.; Lynch, J.W. An index measuring adherence to complementary feeding guidelines has convergent validity as a measure of infant diet quality. J. Nutr. 2012, 142, 901–908. [Google Scholar] [PubMed]
- Gontijo de Castro, T.; Gerritsen, S.; Wall, C.; Grant, C.; Teixeira, J.; Marchioni, D.; Pillai, A.; Morton, S. Infant Feeding in New Zealand: Adherence to Food and Nutrition Guidelines among the Growing up in New Zealand Cohort; Ministry of Social Development: Wellington, New Zealand, 2018.
- Morton, S.M.B.; Atatoa Carr, P.E.; Grant, C.C.; Lee, A.C.; Bandara, D.K.; Mohal, J.; Kinloch, J.M.; Schmidt, J.M.; Hedges, M.R.; Ivory, V.C.; et al. Growing up in New Zealand report 2: Now we are born. In Growing up in New Zealand; University of Auckland: Auckland, New Zealand, 2012. [Google Scholar]
- United Nations International Children’s Emergency Fund. Breastfeeding: A Mother’s Gift, for Every Child; Unicef: Geneva, Switzerland, 2018. [Google Scholar]
- Netting, M.J.; Moumin, N.A.; Knight, E.J.; Golley, R.K.; Makrides, M.; Green, T.J. The Australian Feeding Infants and Toddler Study (OzFITS 2021): Breastfeeding and Early Feeding Practices. Nutrients 2022, 14, 206. [Google Scholar] [CrossRef] [PubMed]
- Centers for Disease Control and Prevention. Breastfeeding among U.S. Children Born 2011–2018, CDC National Immunization Survey. 2021. Available online: https://www.cdc.gov/breastfeeding/data/nis_data/results.html (accessed on 16 September 2020).
- Castro, T.; Grant, C.; Wall, C.; Welch, M.; Marks, E.; Fleming, C.; Teixeira, J.; Bandara, D.; Berry, S.; Morton, S. Breastfeeding indicators among a nationally representative multi-ethnic sample of New Zealand children. N. Z. Med. J. 2017, 130, 34–44. [Google Scholar]
- Manhire, K.M.; Williams, S.M.; Tipene-Leach, D.; Baddock, S.A.; Abel, S.; Tangiora, A.; Jones, R.; Taylor, B.J. Predictors of breastfeeding duration in a predominantly Māori population in New Zealand. BMC Pediatr. 2018, 18, 299. [Google Scholar]
- Au, L.E.; Gurzo, K.; Paolicelli, C.; Whaley, S.E.; Weinfield, N.S.; Ritchie, L.D. Diet quality of US infants and toddlers 7–24 months old in the WIC Infant and Toddler Feeding Practices Study-2. J. Nutr. 2018, 148, 1786–1793. [Google Scholar] [CrossRef]
- Fu, X.; Conlon, C.A.; Haszard, J.J.; Beck, K.L.; von Hurst, P.R.; Taylor, R.W.; Heath, A.-L.M. Food fussiness and early feeding characteristics of infants following Baby-Led Weaning and traditional spoon-feeding in New Zealand: An internet survey. Appetite 2018, 130, 110–116. [Google Scholar]
- Grimes, C.A.; Szymlek-Gay, E.A.; Campbell, K.J.; Nicklas, T.A. Food sources of total energy and nutrients among US infants and toddlers: National Health and Nutrition Examination Survey 2005–2012. Nutrients 2015, 7, 6797–6836. [Google Scholar] [CrossRef] [PubMed]
- Roess, A.A.; Jacquier, E.F.; Catellier, D.J.; Carvalho, R.; Lutes, A.C.; Anater, A.S.; Dietz, W.H. Food consumption patterns of infants and toddlers: Findings from the Feeding Infants and Toddlers Study (FITS) 2016. J. Nutr. 2018, 148, 1525S–1535S. [Google Scholar] [PubMed]
- Fox, M.K.; Pac, S.; Devaney, B.; Jankowski, L. Feeding infants and toddlers study: What foods are infants and toddlers eating? J. Am. Diet. Assoc. 2004, 104, 22–30. [Google Scholar] [CrossRef] [PubMed]
- Pak-Gorstein, S.; Haq, A.; Graham, E.A. Cultural influences on infant feeding practices. Pediatr. Rev. 2009, 30, e11–e21. [Google Scholar] [CrossRef] [PubMed]
- Brown, A.; Lee, M. An exploration of experiences of mothers following a baby-led weaning style: Developmental readiness for complementary foods. Matern. Child Nutr. 2013, 9, 233–243. [Google Scholar] [CrossRef]
- Robinson, S.; Marriott, L.; Poole, J.; Crozier, S.; Borland, S.; Lawrence, W.; Law, C.; Godfrey, K.; Cooper, C.; Inskip, H. Dietary patterns in infancy: The importance of maternal and family influences on feeding practice. Br. J. Nutr. 2007, 98, 1029–1037. [Google Scholar] [CrossRef]
- O’Donovan, S.M.; Murray, D.M.; Hourihane, J.O.B.; Kenny, L.C.; Irvine, A.D.; Kiely, M. Adherence with early infant feeding and complementary feeding guidelines in the Cork Baseline birth cohort study. Public Health Nutr. 2015, 18, 2864–2873. [Google Scholar] [CrossRef]
- Gage, H.; Williams, P.; Rosen-Von Hoewel, V.; Laitinen, K.; Jakobik, V.; Martin-Bautista, E.; Schmid, M.; Egan, B.; Morgan, J.; Decsi, T. Influences on infant feeding decisions of first-time mothers in five European countries. Eur. J. Clin. Nutr. 2012, 66, 914–919. [Google Scholar] [CrossRef]
- Synnott, K.; Bogue, J.; Edwards, C.; Scott, J.; Higgins, S.; Norin, E.; Frias, D.; Amarri, S.; Adam, R. Parental perceptions of feeding practices in five European countries: An exploratory study. Eur. J. Clin. Nutr. 2007, 61, 946–956. [Google Scholar] [CrossRef]
- Anderson, A.S.; Guthrie, C.-A.; Alder, E.M.; Forsyth, S.; Howie, P.W.; Williams, F.L. Rattling the plate: Reasons and rationales for early weaning. Health Educ. Res. 2001, 16, 471–479. [Google Scholar] [CrossRef]
- Katiforis, I.; Fleming, E.A.; Haszard, J.J.; Hape-Cramond, T.; Taylor, R.W.; Heath, A.-L.M. Energy, Sugars, Iron, and Vitamin B12 Content of Commercial Infant Food Pouches and Other Commercial Infant Foods on the New Zealand Market. Nutrients 2021, 13, 657. [Google Scholar] [CrossRef]
- Padarath, S.; Gerritsen, S.; Mackay, S. Nutritional aspects of commercially available complementary foods in New Zealand supermarkets. Nutrients 2020, 12, 2980. [Google Scholar] [CrossRef] [PubMed]
- Brown, A.; Jones, S.W.; Rowan, H. Baby-led weaning: The evidence to date. Curr. Nutr. Rep. 2017, 6, 148–156. [Google Scholar] [CrossRef] [PubMed]
- Cameron, S.L.; Taylor, R.W.; Heath, A.-L.M. Parent-led or baby-led? Associations between complementary feeding practices and health-related behaviours in a survey of New Zealand families. BMJ Open 2013, 3, e003946. [Google Scholar] [CrossRef] [PubMed]
- Morison, B.J.; Taylor, R.W.; Haszard, J.J.; Schramm, C.J.; Erickson, L.W.; Fangupo, L.J.; Fleming, E.A.; Luciano, A.; Heath, A.-L.M. How different are baby-led weaning and conventional complementary feeding? A cross-sectional study of infants aged 6–8 months. BMJ Open 2016, 6, e010665. [Google Scholar] [CrossRef]
- Taylor, R.W.; Conlon, C.A.; Beck, K.L.; von Hurst, P.R.; Te Morenga, L.A.; Daniels, L.; Haszard, J.J.; Meldrum, A.M.; McLean, N.H.; Cox, A.M. Nutritional implications of baby-led weaning and baby food pouches as novel methods of infant feeding: Protocol for an observational study. JMIR Res. Protoc. 2021, 10, e29048. [Google Scholar] [CrossRef]
- Ministry of Health. HISO 10001: 2017 Ethnicity Data Protocols; Ministry of Health: Wellington, New Zealand, 2017.
- Atkinson, J.; Salmond, C.; Crampton, P. NZDep2013 Index of Deprivation; University of Otago: Wellington, New Zealand, 2014. [Google Scholar]
- Thoyre, S.M.; Pados, B.F.; Park, J.; Estrem, H.; Hodges, E.A.; McComish, C.; Van Riper, M.; Murdoch, K. Development and content validation of the pediatric eating assessment tool (Pedi-EAT). Am. J. Speech-Lang. Pathol. 2014, 23, 46–59. [Google Scholar] [CrossRef]
- Daniels, L.; Haszard, J.J.; Taylor, R.W.; Taylor, B.J. Prevalence of low and high BMI during the first 3 years of life: Using New Zealand national electronic health data. Pediatr. Obes. 2023, 18, e13013. [Google Scholar] [CrossRef]
- Plunket. Annual Breastfeeding Statistics. Available online: https://www.plunket.org.nz/news-and-research/research-from-plunket/plunket-breastfeeding-data-analysis/annual-breastfeeding-statistics/ (accessed on 16 September 2020).
- Ministry of Health. Release of the Regional Results: 2017–2020: New Zealand Health Survey; Ministry of Health: Wellington, New Zealand, 2021.
- United Nations Children’s Fund. The Extension of the 2025 Maternal, Infant and Young Child Nutrition Targets to 2030. Available online: https://data.unicef.org/resources/who-unicef-discussion-paper-nutrition-targets/ (accessed on 15 August 2023).
- McAndrew, F.; Thompson, J.; Fellows, L.; Large, A.; Speed, M.; Renfrew, M.J. Infant Feeding Survey 2010; Health and Social Care Information Centre: Leeds, UK, 2012.
- Wong, M.S.; Mou, H.; Chien, W.T. Effectiveness of educational and supportive intervention for primiparous women on breastfeeding related outcomes and breastfeeding self-efficacy: A systematic review and meta-analysis. Int. J. Nurs. Stud. 2021, 117, 103874. [Google Scholar] [CrossRef]
- Mangrio, E.; Persson, K.; Bramhagen, A.C. Sociodemographic, physical, mental and social factors in the cessation of breastfeeding before 6 months: A systematic review. Scand. J. Caring Sci. 2018, 32, 451–465. [Google Scholar] [CrossRef]
- Gallegos, D.; Parkinson, J.; Duane, S.; Domegan, C.; Jansen, E.; Russell-Bennett, R. Understanding breastfeeding behaviours: A cross-sectional analysis of associated factors in Ireland, the United Kingdom and Australia. Int. Breastfeed. J. 2020, 15, 103. [Google Scholar] [CrossRef] [PubMed]
- McIntyre, E.; Hiller, J.E.; Turnbull, D. Determinants of infant feeding practices in a low socio-economic area: Identifying environmental barriers to breastfeeding. Aust. N. Z. J. Public Health 1999, 23, 207–209. [Google Scholar] [CrossRef] [PubMed]
- Mitra, A.K.; Khoury, A.J.; Hinton, A.W.; Carothers, C. Predictors of breastfeeding intention among low-income women. Matern. Child Health J. 2004, 8, 65–70. [Google Scholar] [CrossRef] [PubMed]
- Scott, V.C.; Taylor, Y.J.; Basquin, C.; Venkitsubramanian, K. Impact of key workplace breastfeeding support characteristics on job satisfaction, breastfeeding duration, and exclusive breastfeeding among health care employees. Breastfeed. Med. 2019, 14, 416–423. [Google Scholar] [CrossRef]
- Morton, S.M.B.; Atatoa Carr, P.E.; Grant, C.C.; Berry, S.D.; Bandara, D.K.; Mohal, J.; Tricker, P.J.; Ivory, V.C.; Kingi, T.R.; Liang, R.; et al. Now we are two: Describing our first 1000 days. In Growing Up in New Zealand; Ministry of Health: Wellington, New Zealand, 2014. [Google Scholar]
- Ministry of Health. Indicator: Given Solids before 4 Months (among Children Aged 4 Months to <5 Years). Available online: https://minhealthnz.shinyapps.io/nz-health-survey-2021-22-annual-data-explorer/_w_81846aaf/#!/explore-indicators (accessed on 15 August 2023).
- Arora, A.; Manohar, N.; Hector, D.; Bhole, S.; Hayen, A.; Eastwood, J.; Scott, J.A. Determinants for early introduction of complementary foods in Australian infants: Findings from the HSHK birth cohort study. Nutr. J. 2020, 19, 16. [Google Scholar] [CrossRef]
- Rapley, G. Baby-led weaning: The theory and evidence behind the approach. J. Health Visit. 2015, 3, 144–151. [Google Scholar] [CrossRef]
- Brown, A. Differences in eating behaviour, well-being and personality between mothers following baby-led vs. traditional weaning styles. Matern. Child Nutr. 2016, 12, 826–837. [Google Scholar] [CrossRef] [PubMed]
- Nicklaus, S. Development of food variety in children. Appetite 2009, 52, 253–255. [Google Scholar] [CrossRef]
- Bournez, M.; Ksiazek, E.; Charles, M.-A.; Lioret, S.; Brindisi, M.-C.; de Lauzon-Guillain, B.; Nicklaus, S. Frequency of use of added sugar, salt, and fat in infant foods up to 10 months in the nationwide ELFE cohort study: Associated infant feeding and caregiving practices. Nutrients 2019, 11, 733. [Google Scholar] [CrossRef]
- Wang, Y.; Guglielmo, D.; Welsh, J.A. Consumption of sugars, saturated fat, and sodium among US children from infancy through preschool age, NHANES 2009–2014. Am. J. Clin. Nutr. 2018, 108, 868–877. [Google Scholar] [CrossRef]
- Kay, M.C.; Welker, E.B.; Jacquier, E.F.; Story, M.T. Beverage consumption patterns among infants and young children (0–47.9 months): Data from the Feeding Infants and Toddlers Study, 2016. Nutrients 2018, 10, 825. [Google Scholar] [CrossRef] [PubMed]

| Indicator | Guideline Recommendation | FFNZ Question | FFNZ Indicator |
|---|---|---|---|
| Breastfeeding | |||
| Exclusive breastfeeding duration | Aim to exclusively breastfeed your baby until they are around six months of age. | Questionnaire: “How old was your baby when they first had anything to drink that wasn’t breast milk?” Possible answers: They did not have any breast milk, breast milk is the only drink my baby has had so far, less than 1 month old, 1 month old, 2 months old, 3 months old, 4 months old, 5 months old, 6 months old, 7 months old, 8 months old, 9 months old, 10 months old, 11 months old and “How old was your baby when they first had solid foods?” Possible answers: They haven’t had solids yet, less than 1 month old, 1 month old, 2 months old, 3 months old, 4 months old, 5 months old, 6 months old, 7 months old, 8 months old, 9 months old, 10 months old, 11 months old and “How old was your baby when they first had infant formula?” Possible answers: Less than 1 month old, 1 month old, 2 months old, 3 months old, 4 months old, 5 months old, 6 months old, 7 months old, 8 months old, 9 months old, 10 months old, 11 months old | “5 months” or “6 months” |
| Breastfeeding duration | Continue to breastfeed for up to two years or longer. | Questionnaire: “Is baby still being breastfed?” Possible answers: yes, no | “Yes” |
| Introduction of solids | |||
| Age of solids introduction | Around six months of age, when your baby is showing signs of readiness, introduce complementary foods. | Questionnaire: “How old was your baby when they first had solid foods?” Possible answers: They haven’t had solids yet, less than 1 month old, 1 month old, 2 months old, 3 months old, 4 months old, 5 months old, 6 months old, 7 months old, 8 months old, 9 months old, 10 months old, 11 months old | “5 months” or “6 months” |
| Appropriate foods introduced | Offer iron-rich foods, vegetables and fruit as first foods, and continue to offer these foods every day. | Diet recall data | An iron-rich food a, vegetables, and fruit consumed on both recall days |
| Appropriate food textures | Start with spoon-fed purées, then progress over the next few weeks to mashed/lumpy foods and soft finger foods. | Questionnaire: “What texture was the first food you gave your baby?” Possible answers: puréed, mashed, chopped, finger food, other | “Puréed” |
| Appropriate feeding style | Start with spoon-fed purées, then progress over the next few weeks to mashed/lumpy foods and soft finger foods. | Questionnaire: “How was your baby fed when they first started eating solids?” Possible answers: spoon-fed by an adult, mostly spoon-fed by adult, some baby feeding themselves, about half spoon-fed by an adult and half baby feeding themselves, mostly baby feeding themselves, some spoon-feeding by an adult, baby feeding themselves | “Spoon-fed by an adult” |
| Eating a variety of foods | |||
| Food variety | Once you have started complementary feeding, offer your baby or toddler a variety of nutritious foods every day, including:
| Diet recall data | Selected food group offered during both diet recall days |
| Appropriate foods | |||
| Addition of salt | When preparing food for your baby or toddler, do not add salt. | Diet recall question: “Is salt added to any foods or drinks that baby eats (including on days not covered by the 24-h recall)” Possible answers: yes, no. If yes, what foods/drinks? | “No” |
| Addition of sugar | When preparing food for your baby or toddler, do not add sugar. | Diet recall question: “Is sugar added to any foods or drinks that baby eats (including on days not covered by the 24-h recall)” Possible answers: yes, no. If yes, what foods/drinks? | “No” |
| Appropriate drinks | Recommended drinks for your baby or toddler are breast milk b and water (once they are eating complementary foods). Cow’s milk can be offered as a drink from 12 months of age. | Diet recall question: “Is baby offered any drinks other than breast milk, formula, or water (things like cow’s milk, other milk, juice, soft drinks, tea, alcohol or any other drink)?” Possible answers: yes, no. If yes, what drinks? | “No” |
| Feeding environment | |||
| Self-feeding | From a young age, encourage your child to feed themselves. | Questionnaire: “How is your baby being fed solids now?” Possible answers: spoon-fed by an adult, mostly spoon-fed by adult, some baby feeding themselves, about half spoon-fed by an adult and half baby feeding themselves, mostly baby feeding themselves, some spoon feeding by an adult, baby feeding themselves, baby does not eat solids | “Mostly spoon-fed by adult” or “some baby feeding themselves” or “about half spoon-fed by an adult and half baby feeding themselves” or “mostly baby feeding themselves” or “some spoon feeding by an adult” or “baby feeding themselves” |
| Food/Group | Foods Included | Foods Not Included |
|---|---|---|
| Vegetables | All vegetables (canned, frozen, fresh, commercial infant foods). | Potato chips, potato fries, herbs, spices, cakes/muffins/slices/biscuits/pancakes/scones including vegetables, dried/freeze-dried vegetable snack foods. |
| Fruit | All fruit (canned, frozen, fresh, commercial infant foods). | Fruit juice, fruit jam, cakes/muffins/slices/biscuits/pancakes/scones including fruit, dried/freeze-dried fruit snack foods. |
| Grain foods | Pasta/noodles, rice, bread, cereals, infant cereals, crackers/crispbreads/rice and corn cakes (plain), oats, couscous, semolina, polenta, bulgur, quinoa, buckwheat, muesli, popcorn (plain). | Grain/corn chips, popcorn (butter/sweetened), crackers/crispbreads/rice and corn cakes (flavoured/yoghurt coated), all biscuits, slices, scones, waffles, pikelets/pancakes, bars (muesli bars and other), cakes, pastries, muffins, discretionary snack foods and commercial infant extruded snacks. |
| Milk and milk products | Cow’s milk a, calcium-fortified plant-based milks ab, cow’s milk cheese and yoghurt, homemade custard. | Breast milk, infant formula, sour cream, cream, non-calcium-fortified plant-based milks a, ice cream, butter, sweetened milk puddings. |
| Meat and protein-rich foods | Beef, veal, lamb, mutton, fish, seafood, venison, egg, offal meats, pork, legumes, beans, lentils, nuts, seeds, tofu, tahini, hummus, Quorn, pea-protein products. | Pies, sausages, ham, bacon. |
| Commercial infant foods | Pouches, cans, jars, microwaveable bowls, rusks, cereals, extruded snacks, dried/freeze-dried fruit and vegetable snack foods, baby cereal bars, baby biscuits, discretionary snack foods. |
| Demographic Variable | Descriptive Statistic | |
|---|---|---|
| Infant | ||
| Ethnicity, n (%) | Māori | 131 (21.0) |
| Pacific | 44 (7.0) | |
| European | 344 (55.0) | |
| Asian | 90 (14.4) | |
| Others | 16 (2.6) | |
| Sex a | Male | 335 (53.6) |
| Pre-term birth, n (%) b | 46 (7.4) | |
| Caregiver | ||
| Highest qualification, n (%) c | School | 93 (14.9) |
| Polytechnic or similar | 126 (20.2) | |
| University | 405 (64.9) | |
| Maternal parity, n (%) | Primiparous | 304 (48.7) |
| Employment status, n (%) | Employed full-time | 70 (11.2) |
| Employed part-time | 137 (21.9) | |
| Other d | 418 (66.9) | |
| Environment | ||
| Number of children living in household, n (%) | One | 284 (45.5) |
| Two | 200 (32.1) | |
| Three | 95 (15.2) | |
| Four or more | 45 (7.2) | |
| Number of adults living in household, n (%) | One | 25 (4.0) |
| Two | 517 (82.7) | |
| Three | 42 (6.7) | |
| Four or more | 41 (6.6) | |
| Childcare (ECE) used outside of home, n (%) | 109 (17.4) | |
| Area-level socioeconomic deprivation, n (%) e | 1–3 (low) | 181 (29.0) |
| 4–7 | 282 (45.1) | |
| 8–10 (high) | 162 (25.9) | |
| Recommendation | Indicator a | n (%) Who Met Recommendation | Adjusted Proportion (95% CI) b Who Met Recommendation |
|---|---|---|---|
| Breastfeeding | |||
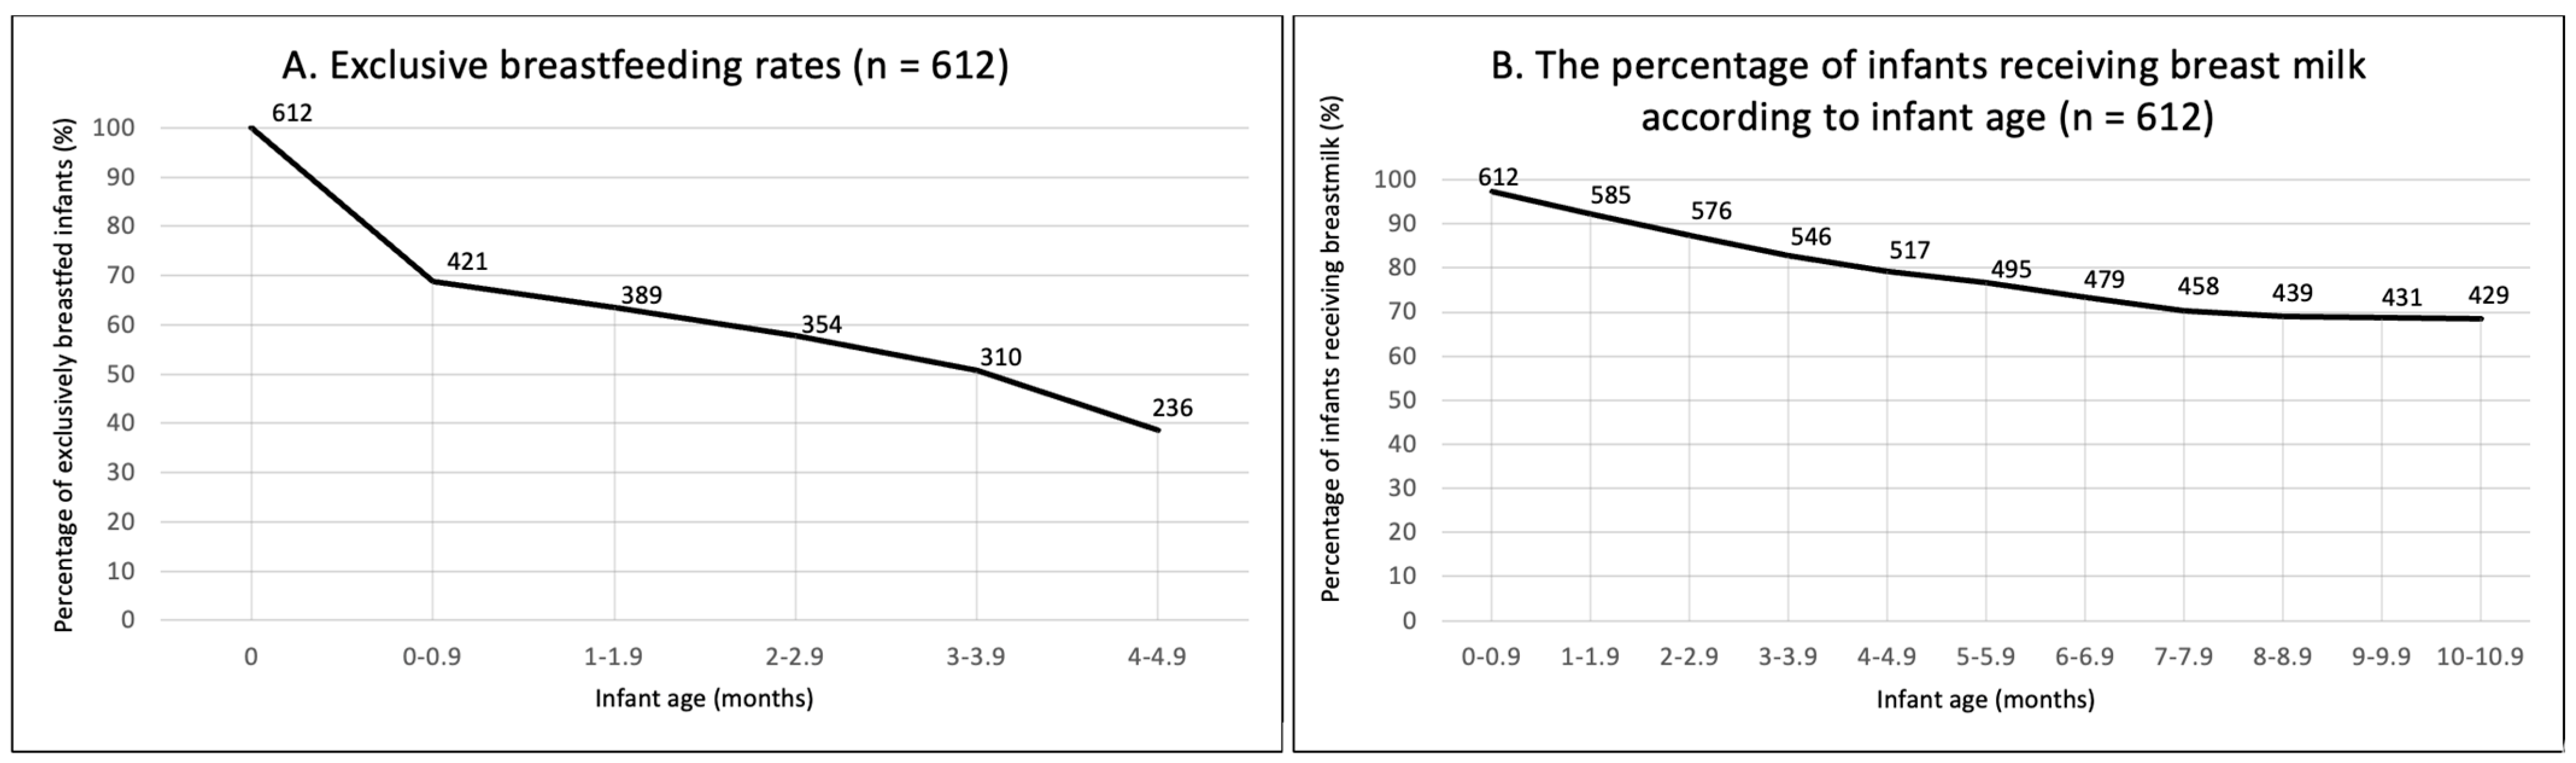
| Aim to exclusively breastfeed your baby until they are around six months of age. | Exclusive breastfeeding to at least 5 and fewer than 7 months | 236 (37.8) | 38.7 (34.7, 42.7) |
| Continue to breastfeed for up to two years or longer. | Current breastfeeding at time of participation | 414 (66.2) | 67.6 (63.7, 71.3) |
| Introduction of solids | |||
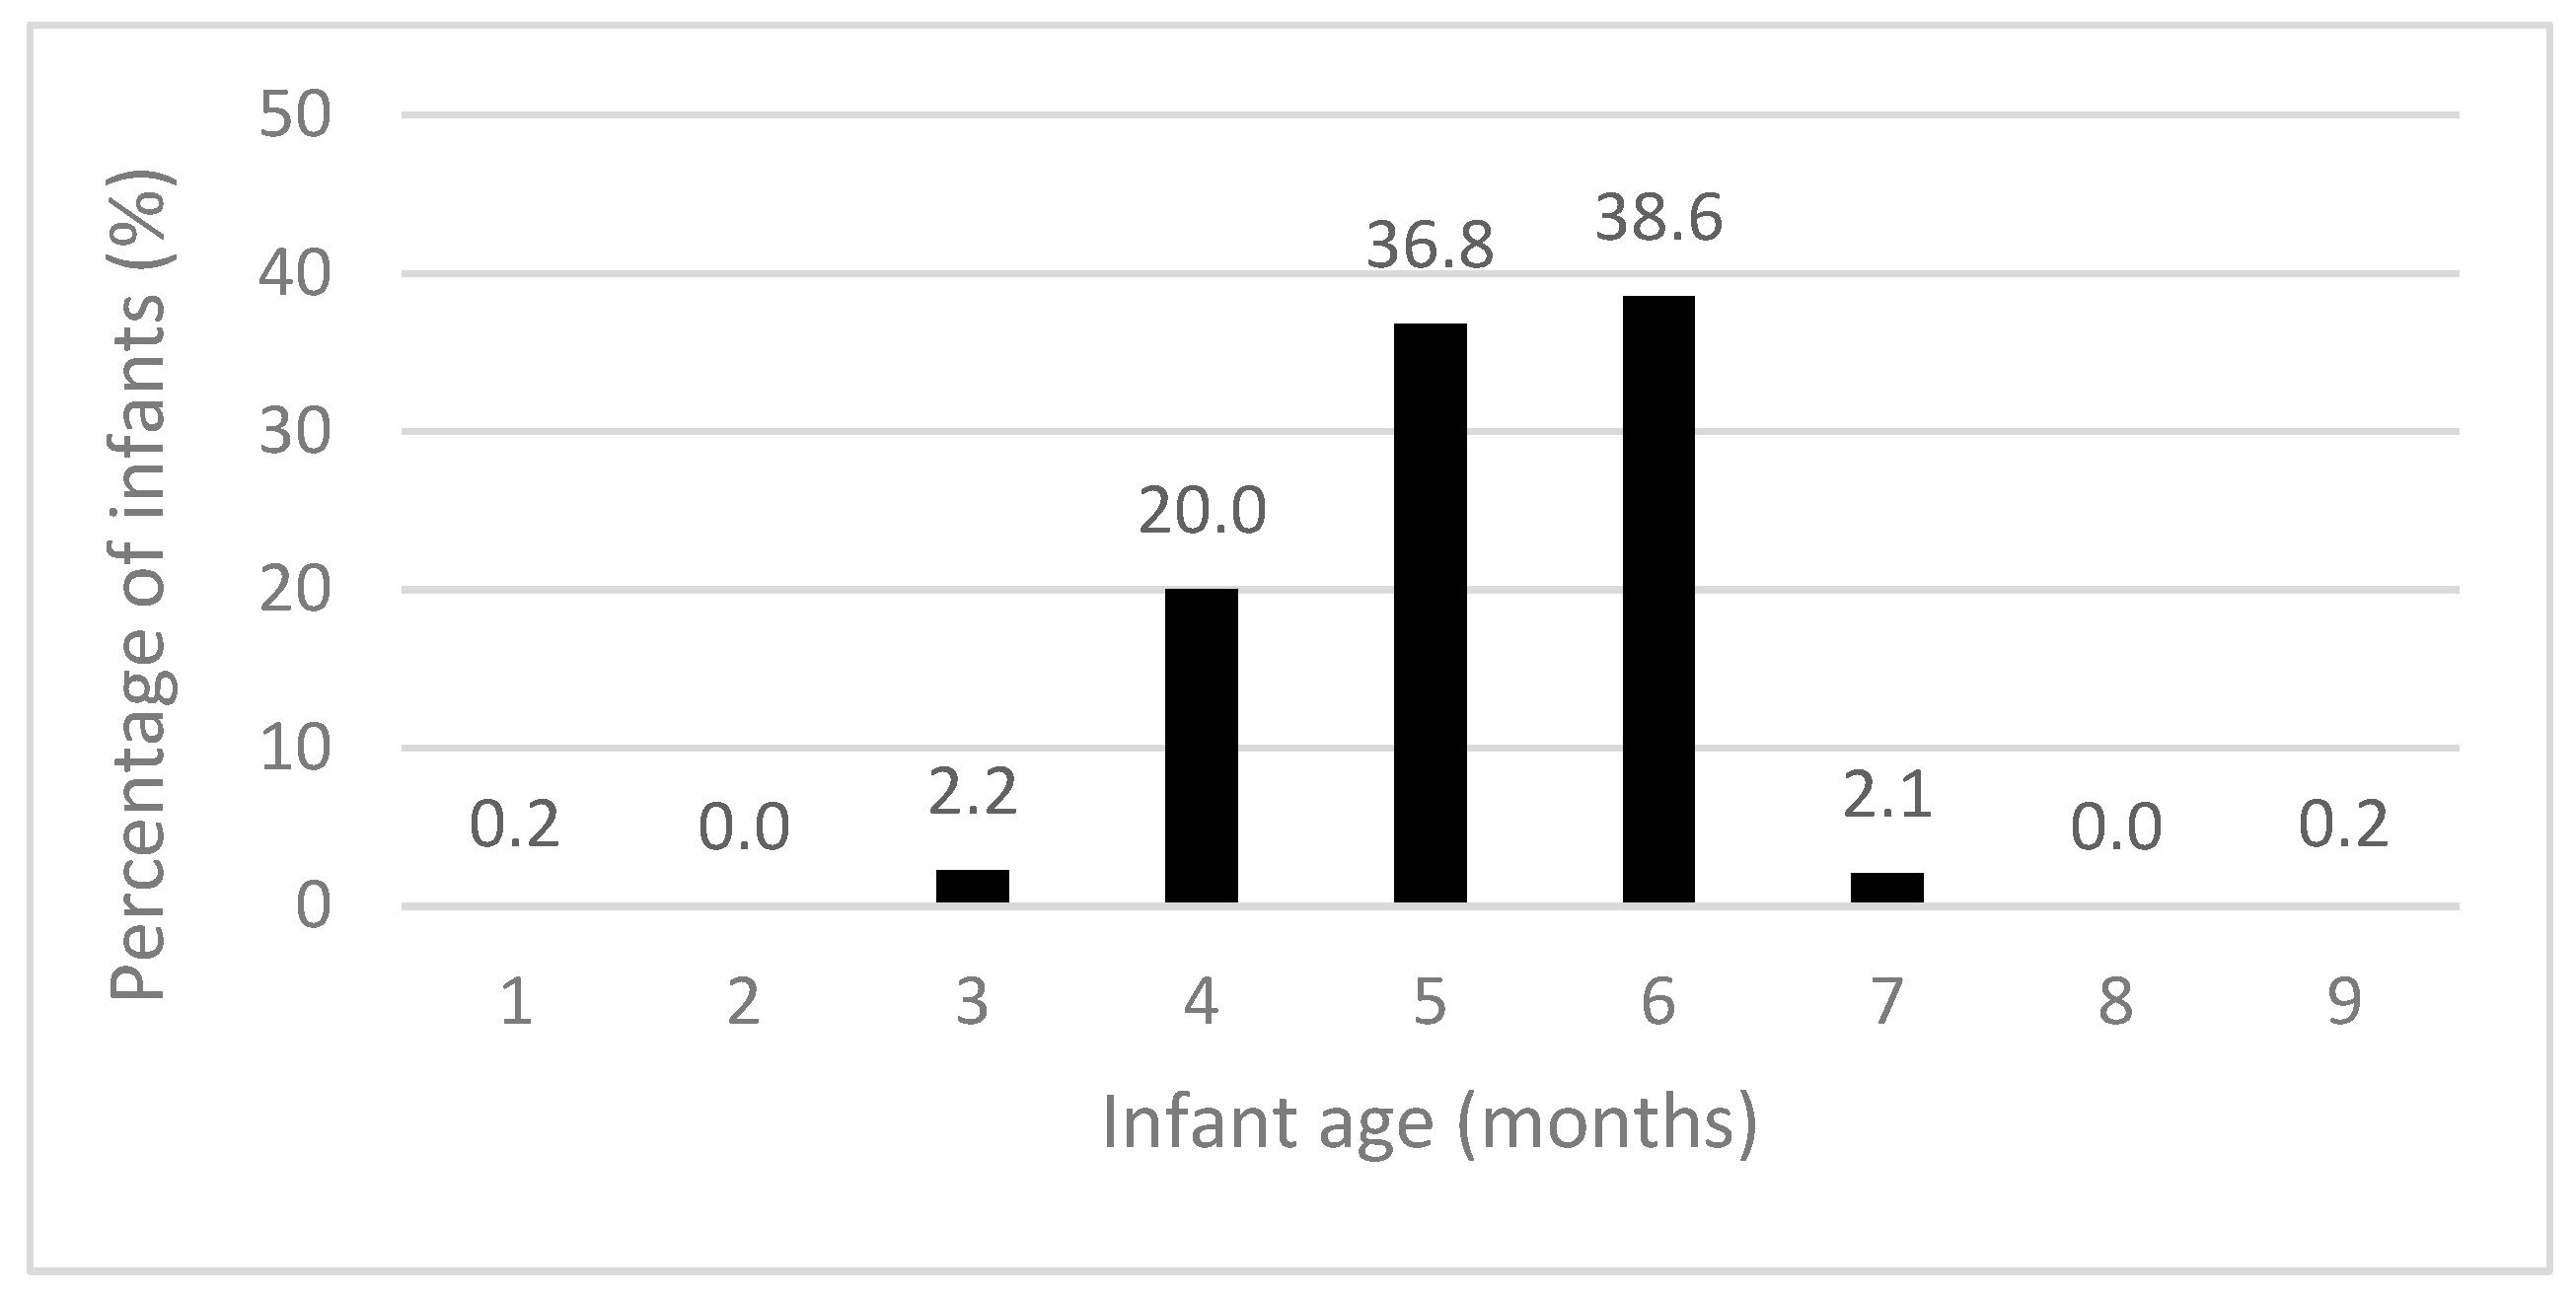
| Around six months of age, when your baby is showing signs of readiness, introduce complementary foods. | Solid food introduced between 5 and fewer than 7 months of age | 471 (75.4) | 77.4 (73.9, 80.6) |
| Puréed-texture food was used when solid foods were introduced | 502 (80.3) | 80.6 (77.2, 83.6) | |
| Spoon-fed by an adult when solid foods were introduced | 463 (74.1) | 74.1 (70.4, 77.5) | |
| Iron-rich foods introduced when solid foods were introduced | 552 (88.3) | 88.7 (85.9, 91.0) | |
| Iron-rich foods, vegetables and fruit consumed daily during recall days | 82 (13.4) | - d | |
| Food variety | |||
Once complementary feeding has started, offer your baby or toddler a variety of nutritious foods every day, including:
| Vegetables consumed daily during recall days c | 388 (63.2) | - d |
| Fruit consumed daily during recall days c | 331 (53.9) | - d | |
| Grain foods consumed daily during recall days c | 304 (49.5) | - d | |
| Milk and milk products consumed daily during recall days c | 237 (38.6) | - d | |
| Meat and protein-rich foods consumed daily during recall days c | 195 (31. 8) | - d | |
| Appropriate foods | |||
| When preparing food for your baby or toddler, do not add salt or sugar. When preparing food for your baby or toddler, do not add salt or sugar. | Salt was not added to foods since solid foods were introduced e | 455 (75.7) | 75.1 (71.3, 78.6) |
| Sugar was not added to foods since solid foods were introduced e | 546 (90.9) | 90.8 (88.1, 93.0) | |
| Recommended drinks for your baby or toddler are breast milk f and water (once they are eating complementary foods). Cow’s milk can be offered as a drink from 12 months of age. Do not give your baby or toddler juice, cordial, fruit drink, flavoured milk, soft drinks, tea, coffee or alcohol. | Only offered breast milk, infant formula, and/or water at time of participation | 587 (93.9) | 94.5 (92.3, 96.1) |
| Feeding environment | |||
| From a young age, encourage your child to feed themselves. | Infants were not 100% spoon-fed at time of participation | 543 (86.9) | 86.1 (82.8, 88.8) |
| Exclusively Breastfed to Around 6 Months | Current Breastfeeding | |||
|---|---|---|---|---|
| Met Recommendation n = 236 | Odds Ratio (95% CI) | Met Recommendation n = 414 | Odds Ratio (95% CI) | |
| Parent/caregiver age, mean (SD) years | ||||
| 33.3 (4.5) | 1.05 (1.01, 1.08) | 32.9 (4.6) | 1.03 (1.00, 1.07) | |
| Highest parent/caregiver qualification, n (%) | ||||
| School | 20 (21.3) | 0.37 (0.22, 0.64) | 49 (52.1) | 0.41 (0.25, 0.64) |
| Polytechnic or similar | 46 (36.8) | 0.80 (0.53, 1.22) | 70 (56.0) | 0.47 (0.31, 0.72) |
| University | 170 (42.0) | Reference | 295 (72.8) | Reference |
| Employment status of parent/caregiver, n (%) | ||||
| Employed full-time | 18 (25.7) | 0.54 (0.31, 0.96) | 49 (52.1) | 0.41 (0.25, 0.64) |
| Employed part-time | 55 (40.2) | 1.05 (0.71, 1.56) | 70 (56.0) | 0.47 (0.31, 0.72) |
| Other a | 163 (39.0) | Reference | 295 (72.8) | Reference |
| Maternal parity, n (%) | ||||
| Primiparous | 100 (33.0) | 0.67 (0.48, 0.93) | 223 (69.5) | 0.74 (0.53, 1.03) |
| Multiparous | 136 (42.4) | Reference | 190 (62.7) | Reference |
| Number of children living in household, n (%) | ||||
| One | 96 (33.9) | Reference | 181 (64.0) | Reference |
| Two | 89 (44.5) | 1.56 (1.08, 2.27) | 146 (73.0) | 1.52 (1.03, 2.26) |
| Three | 38 (40.0) | 1.30 (0.80, 2.10) | 63 (66.3) | 1.11 (0.68, 1.81) |
| Four or more | 13 (28.3) | 0.77 (0.39, 1.53) | 24 (52.2) | 0.61 (1.39, 2.26) |
| Childcare (ECE) outside the home, n (%) | ||||
| No | 205 (39.7) | Reference | 355 (68.8) | Reference |
| Yes | 31 (28.4) | 0.60 (0.38, 0.95) | 59 (54.1) | 0.54 (0.35, 0.81) |
| Socioeconomic deprivation, n (%) b | ||||
| 1–3 (low) | 73 (40.6) | Reference | 125 (69.4) | Reference |
| 4–7 | 106 (37.6) | 0.88 (0.60, 1.29) | 194 (68.8) | 0.97 (0.65, 1.45) |
| 8–10 (high) | 57 (35.0) | 0.79 (0.51, 1.22) | 95 (58.3) | 0.61 (0.39, 0.96) |
| Introduction of Solids between 5 and <7 Months | Puréed Food Texture Introduced First | Spoon-Fed by Adult When Solids First Introduced | Iron-Rich Foods Introduced First | |||||
|---|---|---|---|---|---|---|---|---|
| Met Recommendation n = 471 | Odds Ratio (95% CI) | Met Recommendation n = 502 | Odds Ratio (95% CI) | Met Recommendation n = 463 | Odds Ratio (95% CI) | Met Recommendation n = 552 | Odds Ratio (95% CI) | |
| Parent/caregiver age, mean (SD) years | ||||||||
| 33.4 (4.6) | 1.12 (1.08, 1.16) | 32.7 (4.8) | 1.0 (0.96, 1.04) | 32.6 (5.0) | 0.99 (0.95, 1.02) | 32.6 (4.9) | 0.99 (0.94, 1.04) | |
| Highest parent/caregiver qualification | ||||||||
| School | 47 (50.0) | 0.21 (0.13, 0.34) | 75 (79.8) | 0.99 (0.56, 1.73) | 78 (83.0) | 2.08 (1.16, 3.70) | 84 (89.4) | 1.08 (0.52, 2.22) |
| Polytechnic or similar | 89 (71.2) | 0.53 (0.33, 0.84) | 103 (82.4) | 1.18 (0.70, 1.98) | 100 (80.0) | 1.70 (1.05, 2.77) | 108 (86.4) | 0.81 (0.45, 1.48) |
| University | 334 (82.5) | Reference | 324 (80.0) | Reference | 284 (70.1) | Reference | 359 (88.6) | Reference |
| Employment status of parent/caregiver | ||||||||
| Employed full-time | 49 (70.0) | 0.68 (0.39, 1.19) | 56 (80.0) | 1.03 (0.55, 1.95) | 56 (80.0) | 1.54 (0.82, 2.87) | 58 (82.9) | 0.61 (0.31, 1.22) |
| Employed part-time | 98 (71.5) | 0.73 (0.47, 1.13) | 114 (83.2) | 1.28 (0.77, 2.13) | 105 (76.6) | 1.26 (0.80, 1.98) | 123 (89.8) | 1.11 (0.59, 2.09) |
| Other a | 324 (77.5) | Reference | 332 (79.4) | Reference | 302 (72.3) | Reference | 371 (88.8) | Reference |
| Maternal parity, n (%) | ||||||||
| Primiparous | 244 (76.0) | 0.93 (0.64, 1.33) | 253 (78.8) | 1.21 (0.82, 1.80) | 242 (75.4) | 0.88 (0.61, 1.26) | 282 (87.9) | 1.09 (0.67, 1.78) |
| Multiparous | 226 (74.6) | Reference | 248 (81.9) | Reference | 221 (72.9) | Reference | 269 (88.8) | Reference |
| Number of children living in household, n (%) | ||||||||
| One | 211 (74.6) | Reference | 236 (83.4) | Reference | - c | - c | - c | - c |
| Two | 162 (81.0) | 1.45 (0.93, 2.27) | 157 (78.5) | 0.73 (0.46, 1.15) | - c | - c | - c | - c |
| Three | 71 (74.7) | 1.01 (0.59, 1.72) | 72 (75.8) | 0.62 (0.35, 1.10) | - c | - c | - c | - c |
| Four or more | 26 (56.5) | 0.44 (0.23, 0.84) | 36 (78.3) | 0.72 (0.33, 1.54) | - c | - c | - c | - c |
| Childcare (ECE) outside the home, n (%) | ||||||||
| No | 394 (76.3) | Reference | 409 (79.3) | Reference | 370 (71.7) | Reference | - c | - c |
| Yes | 77 (70.6) | 0.54 (0.35, 0.81) | 93 (85.3) | 1.52 (0.86, 2.63) | 93 (85.3) | 2.29 (1.30, 4.03) | - c | - c |
| Socioeconomic deprivation, n (%) b | ||||||||
| 1–3 (low) | 147 (81.7) | Reference | 139 (77.2) | Reference | 126 (70.0) | Reference | 155 (86.1) | Reference |
| 4–7 | 214 (75.9) | 0.71 (0.44, 1.13) | 231 (81.9) | 1.34 (0.84, 2.12) | 209 (74.1) | 1.23 (0.81, 1.86) | 251 (89.0) | 1.31 (0.74 |
| 8–10 (high) | 110 (67.5) | 0.47 (0.28, 0.77) | 132 (81.0) | 1.26 (0.74, 2.12) | 128 (78.5) | 1.57 (0.96, 2.56) | 146 (89.6) | 1.39 (0.72, 2.67) |
| Iron-Rich Food Consumed on Both Recall Days | Vegetables Consumed on Both Recall Days | Fruit Consumed on Both Recall Days | ||||
|---|---|---|---|---|---|---|
| Met Recommendation n = 179 | Odds Ratio (95% CI) | Met Recommendation n = 388 | Odds Ratio (95% CI) | Met Recommendation n = 388 | Odds Ratio (95% CI) | |
| Parent/caregiver age, mean (SD) years | ||||||
| 33.6 (4.6) | 1.06 (1.02, 1.10) | 33.3 (4.3) | 1.07 (1.04, 1.12) | 33.0 (4.3) | 1.03 (1.00, 1.06) | |
| Highest parent/caregiver qualification | ||||||
| School | 20 (22.7) | 0.60 (0.35, 1.03) | 43 (48.9) | 0.42 (0.27, 0.68) | 35 (39.8) | 0.47 (0.29, 0.75) |
| Polytechnic or similar | 27 (22.1) | 0.58 (0.36, 0.94) | 66 (54.1) | 0.52 (0.35, 0.79) | 60 (49.2) | 0.68 (0.46, 1.03) |
| University | 132 (32.8) | Reference | 279 (69.2) | Reference | 236 (58.6) | Reference |
| Employment status of parent/caregiver | ||||||
| Employed full-time | 20 (29.4) | 1.07 (0.61, 1.88) | 46 (67.6) | 1.31 (0.76, 2.26) | 33 (48.5) | 0.78 (0.47, 1.30) |
| Employed part-time | 44 (32.4) | 1.22 (0.81, 1.87) | 90 (66.2) | 1.22 (0.82, 1.84) | 74 (54.4) | 0.99 (0.47, 1.31) |
| Other a | 115 (28.1) | Reference | 252 (61.5) | Reference | 224 (54.6) | Reference |
| Maternal parity, n (%) | ||||||
| Primiparous | 80 (25.4) | 1.44 (1.01, 2.04) | 178 (56.5) | 1.81 (1.29, 2.52) | 165 (52.4) | 1.14 (0.83, 1.57) |
| Multiparous | 98 (32.9) | Reference | 209 (70.1) | Reference | 166 (55.7) | Reference |
| Number of children living in household, n (%) | ||||||
| One | 93 (33.6) | Reference | 194 (70.0) | Reference | 151 (54.5) | Reference |
| Two | 51 (25.6) | 0.68 (0.46, 1.02) | 126 (63.3) | 0.74 (0.50, 1.09) | 112 (56.2) | 1.07 (0.74, 1.55) |
| Three | 23 (24.5) | 0.64 (0.38, 1.10) | 52 (55.3) | 0.53 (0.33, 0.86) | 49 (52.1) | 0.91 (0.57, 1.45) |
| Four or more | 12 (27.9) | 0.77 (0.37, 1.56) | 15 (34.9) | 0.23 (0.12, 0.45) | 18 (41.9) | 0.60 (0.31, 1.15) |
| Childcare (ECE) outside the home, n (%) | ||||||
| No | 144 (28.4) | Reference | 319 (62.8) | Reference | 277 (54.5) | Reference |
| Yes | 35 (33.0) | 1.24 (0.80, 1.95) | 69 (65.1) | 1.10 (0.71, 1.71) | 54 (50.9) | 0.87 (0.57, 1.32) |
| Socioeconomic deprivation, n (%) b | ||||||
| 1–3 (low) | 56 (31.6) | Reference | 125 (70.6) | Reference | 103 (58.2) | Reference |
| 4–7 | 82 (29.6) | 0.91 (0.60, 1.37) | 180 (65.0) | 0.77 (0.51, 1.16) | 156 (56.3) | 0.93 (0.63, 1.36) |
| 8–10 (high) | 41 (25.6) | 0.74 (0.46, 1.20) | 83 (51.9) | 0.45 (0.29, 0.70) | 72 (45.0) | 0.59 (0.38, 0.91) |
| No Added Salt | No Added Sugar | |||
|---|---|---|---|---|
| Met Recommendation n = 455 | Odds Ratio (95% CI) | Met Recommendation n = 546 | Odds Ratio (95% CI) | |
| Parent/caregiver age, mean (SD) years | ||||
| 32.7 (5.0) | 0.99 (0.95, 1.03) | 32.8 (4.9) | 0.94 (0.88, 0.99) | |
| Highest parent/caregiver qualification | ||||
| School | 63 (69.2) | 1.47 (0.88, 2.44) | 74 (81.3) | 3.20 (1.65, 6.19) |
| Polytechnic or similar | 93 (76.9) | 1.00 (0.61, 1.62) | 109 (90.1) | 1.53 (0.75, 3.14) |
| University | 298 (76.8) | Reference | 362 (93.3) | Reference |
| Employment status of parent/caregiver | ||||
| Employed full-time | 53 (79.0) | 0.85 (0.45, 1.60) | - c | - c |
| Employed part-time | 92 (71.9) | 1.26 (0.81, 1.98) | - c | - c |
| Other a | 310 (76) | Reference | - c | - c |
| Maternal parity, n (%) | ||||
| Primiparous | 213 (70.1) | 0.53 (0.36, 0.78) | 274 (90.1) | 0.84 (0.48, 1.47) |
| Multiparous | 241 (81.4) | Reference | 271 (91.6) | Reference |
| Number of children living in household, n (%) | ||||
| One | 223 (80.8) | Reference | - c | - c |
| Two | 136 (72.0) | 1.64 (1.06, 2.54) | - c | - c |
| Three | 63 (69.2) | 1.87 (1.09, 3.18) | - c | - c |
| Four or more | 32 (72.7) | 1.58 (0.76, 3.28) | - c | - c |
| Childcare (ECE) outside the home, n (%) | ||||
| No | 376 (75.5) | Reference | 453 (91.0) | Reference |
| Yes | 79 (76.7) | 0.94 (0.57, 1.54) | 93 (90.3) | 1.08 (0.53, 2.23) |
| Socioeconomic deprivation, n (%) b | ||||
| 1–3 (low) | 133 (76.9) | Reference | 158 (91.3) | Reference |
| 4–7 | 203 (75.2) | 1.10 (0.70, 1.72) | 257 (95.2) | 0.53 (0.23, 1.15) |
| 8–10 (high) | 119 (75.3) | 1.09 (0.66, 1.81) | 131 (82.9) | 2.17 (1.11, 4.25) |
| Not Fully Spoon-Fed at Current Age | ||
|---|---|---|
| Met Recommendation n = 543 | Odds Ratio (95% CI) | |
| Parent/caregiver age, mean (SD) years | ||
| 32.6 (4.8) | 0.99 (0.94, 1.03) | |
| Highest parent/caregiver qualification | ||
| School | 79 (84.0) | 0.64 (0.34, 1.21) |
| Polytechnic or similar | 103 (82.4) | 0.57 (0.33, 1.00) |
| University | 361 (89.1) | Reference |
| Employment status of parent/caregiver | ||
| Employed full-time | 60 (85.7) | 1.04 (0.51, 2.15) |
| Employed part-time | 127 (92.7) | 2.21 (1.10, 4.44) |
| Other a | 356 (85.2) | Reference |
| Maternal parity, n (%) | ||
| Primiparous | 282 (87.9) | 0.84 (0.53, 1.33) |
| Multiparous | 260 (85.8) | Reference |
| Number of children living in household, n (%) | ||
| One | 247 (87.3) | Reference |
| Two | 179 (89.5) | 1.24 (0.70, 2.20) |
| Three | 82 (86.3) | 0.92 (0.47, 1.82) |
| Four or more | 34 (73.9) | 0.41 (0.20, 0.87) |
| Socioeconomic deprivation, n (%) b | ||
| 1–3 (low) | 162 (90.0) | Reference |
| 4–7 | 242 (85.8) | 0.67 (0.37, 1.21) |
| 8–10 (high) | 139 (85.3) | 0.64 (0.34, 1.23) |
Disclaimer/Publisher’s Note: The statements, opinions and data contained in all publications are solely those of the individual author(s) and contributor(s) and not of MDPI and/or the editor(s). MDPI and/or the editor(s) disclaim responsibility for any injury to people or property resulting from any ideas, methods, instructions or products referred to in the content. |
© 2023 by the authors. Licensee MDPI, Basel, Switzerland. This article is an open access article distributed under the terms and conditions of the Creative Commons Attribution (CC BY) license (https://creativecommons.org/licenses/by/4.0/).
Share and Cite
Brown, K.J.; Beck, K.L.; von Hurst, P.; Heath, A.-L.; Taylor, R.; Haszard, J.; Daniels, L.; Te Morenga, L.; McArthur, J.; Paul, R.; et al. Adherence to Infant Feeding Guidelines in the First Foods New Zealand Study. Nutrients 2023, 15, 4650. https://doi.org/10.3390/nu15214650
Brown KJ, Beck KL, von Hurst P, Heath A-L, Taylor R, Haszard J, Daniels L, Te Morenga L, McArthur J, Paul R, et al. Adherence to Infant Feeding Guidelines in the First Foods New Zealand Study. Nutrients. 2023; 15(21):4650. https://doi.org/10.3390/nu15214650
Chicago/Turabian StyleBrown, Kimberley J., Kathryn L. Beck, Pamela von Hurst, Anne-Louise Heath, Rachael Taylor, Jillian Haszard, Lisa Daniels, Lisa Te Morenga, Jenny McArthur, Rebecca Paul, and et al. 2023. "Adherence to Infant Feeding Guidelines in the First Foods New Zealand Study" Nutrients 15, no. 21: 4650. https://doi.org/10.3390/nu15214650
APA StyleBrown, K. J., Beck, K. L., von Hurst, P., Heath, A.-L., Taylor, R., Haszard, J., Daniels, L., Te Morenga, L., McArthur, J., Paul, R., Jones, E., Katiforis, I., Rowan, M., Casale, M., McLean, N., Cox, A., Fleming, E., Bruckner, B., Jupiterwala, R., ... Conlon, C. (2023). Adherence to Infant Feeding Guidelines in the First Foods New Zealand Study. Nutrients, 15(21), 4650. https://doi.org/10.3390/nu15214650