Systematic Review

Modulatory Properties of Vitamin D in Type 2 Diabetic Patients: A Focus on Inflammation and Dyslipidemia

Department of Life and Consumer Sciences, College of Agriculture and Environmental Sciences, University of South Africa, Florida Campus, Private Bag X6, Roodepoort 1710, South Africa
*
Author to whom correspondence should be addressed.
Nutrients 2023, 15(21), 4575; https://doi.org/10.3390/nu15214575
Submission received: 11 October 2023 / Revised: 25 October 2023 / Accepted: 26 October 2023 / Published: 27 October 2023

Abstract

:
Background: Evidence from preclinical studies has found a correlation between the development of type 2 diabetes (T2D) and vitamin D deficiency. However, evidence from randomized controlled trials (RCTs) revealed inconclusive results on vitamin D supplementation. We explored the effect of vitamin D on inflammation and dyslipidemia in T2D. Methods: We comprehensively searched for RCTs evaluating the effect of vitamin D in T2D on PubMed. Data were analyzed using Review Manager 5.3 and reports, such as standardized mean difference (SMD) and 95% confidence intervals (CI) at a 5% significant level using a random effect model. Results: This study revealed a significant reduction in tumor necrosis factor-alpha (TNF-α) SMD = (−0.51, 95%CI (−0.93, −0.09); p = 0.02), high sensitivity C-reactive protein (hs-CRP) SMD = (−1.06, 95%CI (−1.67, −0.45); p < 0.05) in vitamin D compared to placebo. Additionally, interleukin-6 (IL-6) exhibited a marginal effect SMD = (−0.52, 95%CI (−1.05, 0.01), p = 0.05). Furthermore, a significant reduction in the level of triglycerides SMD = (−0.65, 95%CI (−1.11, −0.18), p < 0.05) was observed, concomitant to a significantly increased high-density lipoprotein (HDL) level SMD = (0.53, 95%CI (0.08, 0.98), p = 0.02). However, no statistically significant changes were observed in total cholesterols SMD = (−0.16, 95%CI (−0.57, 0.24), p = 0.43) and low-density lipoprotein (LDL) SMD = (−0.06, 95%CI (−0.37, 0.24), p = 0.67). Conclusions: These findings suggest that vitamin D supplementation may be beneficial in ameliorating inflammation and dyslipidemia in T2D patients.

1. Introduction

Type 2 diabetes mellitus (T2D) is a chronic disease associated with an increased mortality rate [1] due to impaired pathways that regulate homeostatic and inflammatory responses. A recent report by the International Diabetes Federation (IDF) indicates that 537 million people are estimated to have diabetes worldwide, which is anticipated to rise to 783 million by 2045 [2]. This is alarming given the association between T2D and the risk of cardiovascular diseases (CVD), resulting in a financial burden on the healthcare system [3,4].
Although glucose-lowering pharmacological agents [5] are widely used in T2D, the death rate is continuously increasing due to secondary complications associated with diabetes [5]. Moreover, the T2D population reportedly dies from CVD more frequently than healthy individuals [6]. T2D is associated with obesity, and a correlation exists among body weight, insulin resistance, dyslipidemia, and hypertension [6,7,8]. Hyperglycemia and persistent inflammation in T2D contribute to vascular damage [9,10,11]. This further promotes the progression of CVD. Other studies have shown an increased risk of CVD and secondary complications amongst T2D patients who rely on pharmacological drugs for extended periods [12,13,14]. Thus, this is the motivation for exploring different pharmacological agents to find one with potent antihyperglycemic and hypolipidemic potential.
Other studies have explored the beneficial impact of natural antioxidants on glucose control, inflammation, and lipid metabolism in metabolic conditions [15,16,17]. This is crucial as poor glucose tolerance in T2D has been attributed to an exacerbated pro-inflammatory response and endothelial dysfunction brought on by oxidative stress. There has consistently been a significant interest in exploring the pathways and mechanisms by which dietary antioxidant compounds protect against diabetes-related complications due to their potential effects on inflammation and oxidative stress [18].
Many dietary compounds [19], including vitamin D, are widely used for distinct antioxidant potential. Vitamin D, also called calciferol [20,21], is a membrane antioxidant and a member of a fat-soluble vitamin that alleviates inflammation by inhibiting nuclear-factor-kappa-β (NF-κβ) activity [22,23]. The direct stimulation of pancreatic β-cells to release insulin [24], anti-inflammatory [25] effects to reduce chronic inflammation brought on by insulin resistance, and downregulation of elevated parathyroid hormone levels [26] that inhibit insulin secretion [27] are some of the protective mechanisms of vitamin D that have been proposed. In addition to being present in dietary supplements, a small amount can be found in oily fish, red meat, egg yolk, liver, and fortified cereals [21].
The previous meta-analysis confirmed the beneficial effects of vitamin D in regulating blood glucose; however, the improvement was minimal [28]. This effect might be attributed to vitamin D’s unique property in alleviating oxidative stress and inflammation [29]. Although two previous quantitative studies conducted in 2018 have shown that vitamin D supplementation in T2D patients can reduce inflammation [30,31] and lipid profiles [32], the results are inconsistent, and the markers evaluated were not common in both these reviews. Notably, the above studies did not focus on these parameters simultaneously to explore the effect of vitamin D on T2D. This led us to comprehensively and systematically review and meta-analyze the evidence from randomized controlled trials (RCTs) simultaneously to evaluate [32] the potential benefits of vitamin D in all these parameters. This information is important for understanding the health benefits of this dietary antioxidant in order to reduce the number of diabetic individuals who succumb to CVD complications associated with T2D. Therefore, in this study, we aimed to evaluate the overall effect of vitamin D supplementation on inflammatory markers and lipid profiles in T2D patients.

2. Materials and Methods

2.1. Study Design and Registration

This meta-analysis was conducted according to PICO guidelines [33] and reported per the Preferred Reporting Items for Systematic Reviews and Meta-Analysis (PRISMA) guidelines [34]. The protocol accompanying this review has been registered with the International Platform of Registered Systematic Review and Meta-Analysis Protocols (INPLASY), registration number (INPLASY202260022), and further published [35].

2.2. Adapted Search Strategy and Information Sources

Two independent researchers (RM and KM) identified the eligible studies indexed in the PubMed database using the following MesH terms and Booleans: (“vitamin D” OR “calciferol” OR “1,25-Dihydroxycholecalciferol”) AND (“Type 2 diabetes mellitus” OR “Type 2 diabetes” OR “hyperglycemia” (Supplementary Table S1). The third researcher, WNP, was invited for arbitration if RM and KM disagreed. The last updated search was conducted on 21 June 2023. References of relevant studies were screened manually to identify potentially eligible studies that might have been missed on PubMed. An exact search strategy on PubMed was updated on 21 June 2023 and attached in Supplementary Table S1.

2.3. Study Selection Procedure

The eligibility criteria followed a PICO guideline [26]: population (P)-adult type 2 diabetes patients, Intervention (I)-vitamin D; comparator (C)-patient on placebo treatment or patient without treatment; outcomes (O)-lipid profile and inflammatory markers, study design-randomized controlled trials (RCTs). We selected the recent trial where the author conducted multiple trials using the same sample size. We excluded studies conducted in children, not on diabetes or using vitamin D supplementation in combination with other treatments, experimental models of diabetes, reviews, letters and commentaries, case-control, and cross-sectional studies. The flow diagram in Figure 1 was created following the PRISMA guide.

2.4. Data Extraction, Quality, and Certainty of Evidence Assessment

The following data items were extracted independently by RM and KM: first author and year of publication, the country where the study was conducted, type of study design, population size and the number of patients, description of participants, gender distribution, baseline age of recruited participants, the form of vitamin D, dose, duration of intervention, and outcome measures. Subsequently, RM and KM independently evaluated the study quality using the Jadad scale [36]. This technique considers five domains for evaluating the quality of RCTs in which three or more scores indicate excellent quality. The overall certainty of the evidence obtained from this meta-analysis was evaluated according to the Grading of Recommendations Assessment, Development, and Evaluation (GRADE) guideline [37]. This takes into account the high risk of bias, imprecision, indirectness, heterogeneity, publication bias, and effect size, and these were assessed using the GRADEprofiler tool (https://www.gradepro.org/ accessed on 14 August 2023) and RevMan software (version 5.4). Overall, evaluation results were presented as “very low”, “low”, “moderate”, or “high” risk, presented as a summary of findings in Table S4 of the Supplementary File. Any disagreements were resolved through discussion with a third independent researcher (WNP) and re-evaluating the study or domain in dispute.

2.5. Subgroup, Sensitivity Analysis, and Publication Bias

Subgroup analyses [38] were conducted to investigate the source of heterogeneity. Briefly, this was performed by subgrouping studies based on the dosage of vitamin D and duration of intervention, and this was classified as low- and high-dose, short- and long-term, respectively. To test the stability of the analyzed results, we conducted a leave-out one-study sensitivity analysis to recalculate the effect size of all outcomes. Lastly, for the risk of publication bias, funnel plots and the Egger regression test were used to graphically present and statistically assess the potential publication bias [39]. An Eggers test p-value less than 0.05 is classified as potential evidence of bias, while p > 0.05 signifies no bias.

2.6. Data Synthesis and Statistical Analysis

All extracted data were analyzed using Review Manager [Computer program], Version 5.4, The Cochrane Collaboration, 2020, and metaUN web tool (http://softmed.hacettepe.edu.tr/metaHUN/) accessed on 20 October 2023. For this meta-analysis, continuous data were extracted from RCTs as a change in mean and standard deviation (SD); however, in case a change in mean and SD was not reported, we calculated the mean difference between the baseline (pretest) and final results (post-test) (∆Mean = (Mf − Mb)) and further estimated change in SD by using the formula:  Δ S D   =   ( S D b ) 2 + ( S D f ) 2 2 ( r × S D b × S D f )  outlined by Cochrane guidelines and other researchers, where r, a correlation coefficient of 0.7, was used in both groups in accordance with the previous reports [40,41,42]. In cases where non-parametric data were reported (median, range, or interquartile range (IRQ), we used Hozzo et al., 2005 [43] or  S D   =   I Q R 1.35  [44] accordingly to estimate mean and SD. On the other hand, if the standard error of the mean (SEM) was reported, we estimated SD using the equation  S E M   =   S D n  [45]. All data are presented as standardized mean differences (SMD) and 95% confidence intervals (CI), partly due to different units of measurement used in the trials. Heterogeneity between studies was determined using the I2 statistic [46] (I2 ≥ 50%) was considered significant. A random-effect model was applied for a statistically significant heterogeneity [36]. To test the stability of the analyzed results, we conducted a leave-out one-study sensitivity analysis to recalculate the effect estimates. For converting vitamin D from microgram (µg) to an International Unit (IU), we assumed that 1 IU equals 0.025 µg.

3. Results

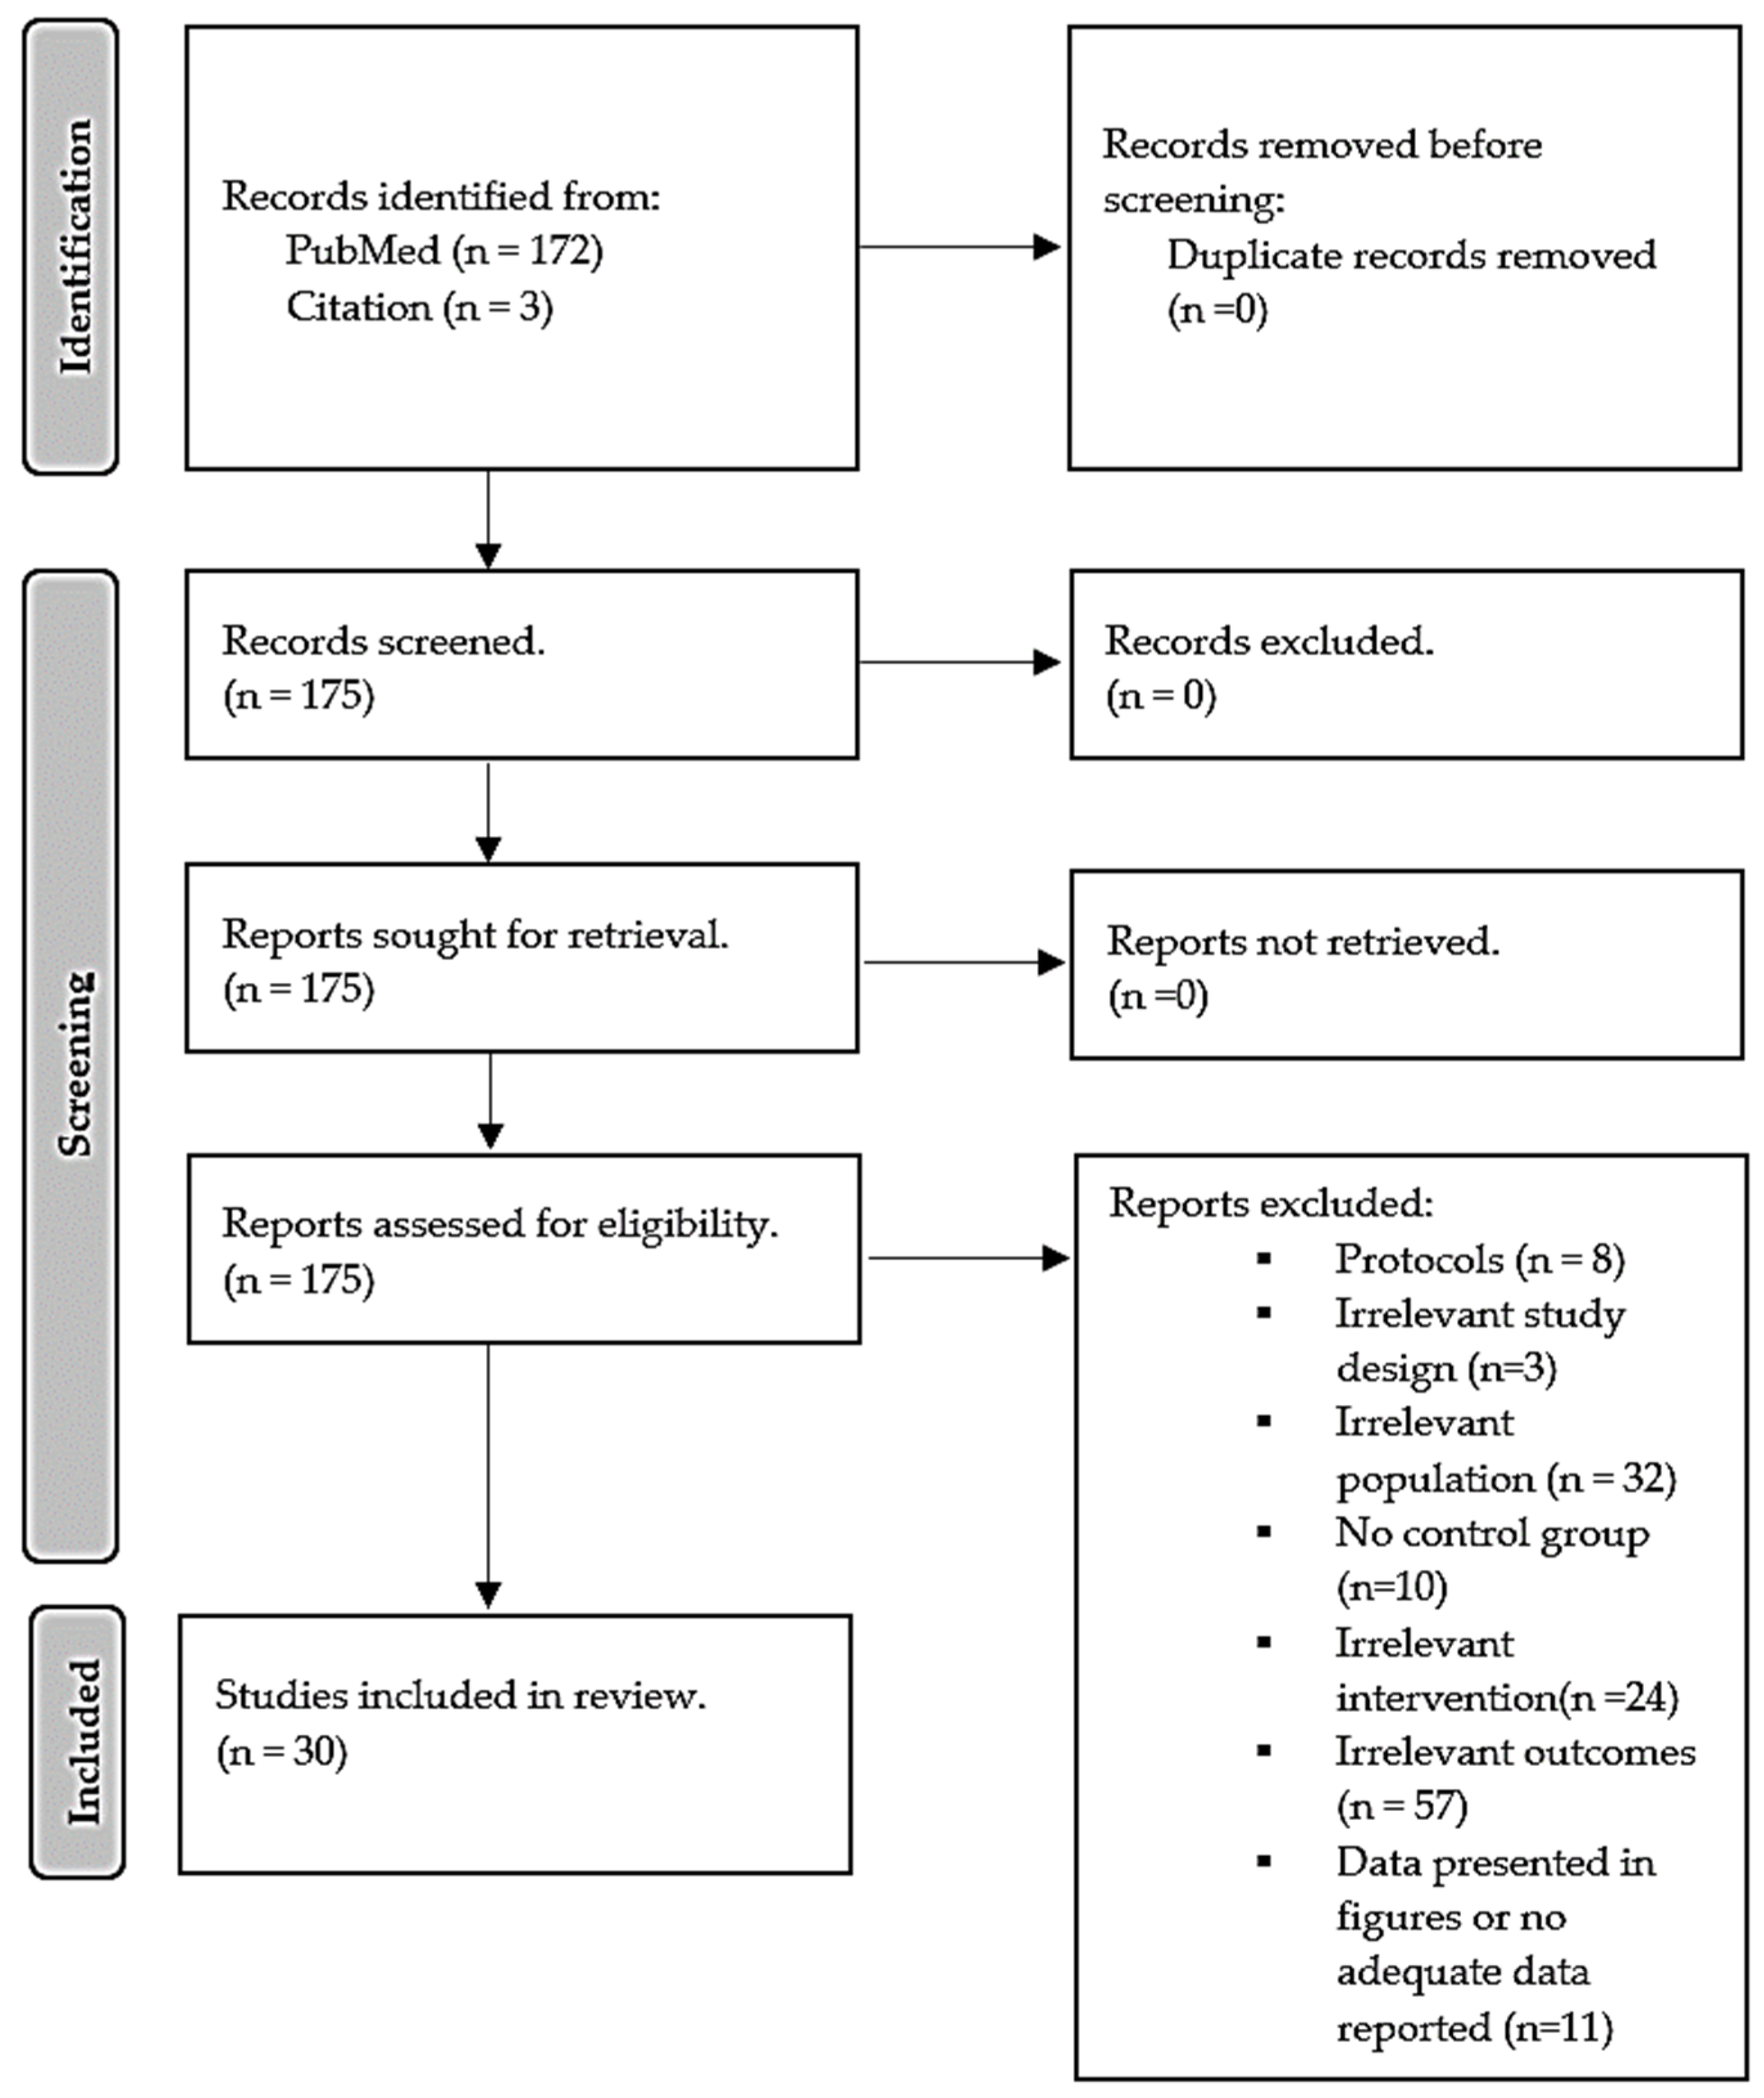
3.1. Comprehensive Search and Information Sources

Our search from the main database, PubMed, yielded about 172 randomized controlled trials, and through hand screening of relevant references, three additional trials were further identified. Study selection was made independently by KM and RM; where there was disagreement, we sought intervention from a third researcher, WNP, for her independent opinion and further discussed with her to reach a conclusion based on the study in question. The selection procedure was a two-step process, initially screening trials through titles, abstracts, and keywords followed by a full-text screening for eligibility. From 165 records, hundred twenty-seven records were excluded based on the following reasons: (1) about 57 had no outcome of interest, (2) eight study protocols, (3) ten trials without control, (4) three irrelevant designs, (5) 32 irrelevant population (pre-diabetes, diabetic neuropathy, gestational diabetes, and chronic kidney diseases), (6) 24 different interventions (metformin, and statin), (7) eleven trials presented data in figures or did not report change after a period of intervention. Therefore, 27 trials from PubMed were found relevant in addition to 3 from the citation list. Hence, this systematic review and meta-analysis consisted of evidence from 30 trials with sufficient data pooled for meta-analysis on different effect measures. A detailed selection procedure is presented as the PRISMA flow diagram in Figure 1.

3.2. General Characteristics of Included Randomized Controlled Trials

The general overview of included randomized controlled trials (RCTs) is shown in Table 1. In brief, all included studies were RCTs published in peer-reviewed journals between 2010 and 2022. The participants recruited from these trials in the intervention group were 2310 who received vitamin D as treatment. Although all included trials were on T2D, one trial also considered patients who were T2D and obese [47]. Briefly, the vitamin D group patients ranged from 8 to 703 participants.
These RCTs were conducted in 14 countries, with at least ten trials conducted from Iran [48,49,50,51,52,53,54,55,56,57], three from the United States of America [58,59,60], Canada [61,62,63], and Italy [64,65,66], respectively; at least one from each of the following countries: Australia [67], China [68], Denmark [69] India [70], Israel [71], Korea [72], Mexico [73], Singapore [74], Switzerland [75], and United Arab Emirates [47]. The mean age of the included participants was 57.80 ± 7.01 years. Regarding gender distribution, 1132 (49.1%) males and 1178 females (50.9%) were on vitamin D treatment. The vitamin D was administered at different doses from as low as 10 IU (0.25 µg) to 300,000 IU (7500 µg) of vitamin D. Duration of intervention ranged from a short period (3 weeks) to a longer period (5 and half years). Different markers of inflammation and lipid profiles were determined from these studies.
Table 1. Characteristics of included randomized controlled trials.
Author, YearStudy Design,
Country
Population and Sample SizeIntervention Group, n.
Male, n (%)
Mean Age of Intervention Group (Years)Vitamin D, Dosage, and Duration of InterventionEffect on Lipids and Inflammatory Markers
Hu et al., 2022 [68]Randomized controlled trial (RCT);
China
T2D patients, 220115;
32 (27.8)
66.05 ± 9.35Oral dose of 800 IU (two capsules) of vitamin D3 for 30 months.Vitamin D supplementation significantly decreased total cholesterol (TC) and CRP.
Hoseini et al., 2022 [57]Randomized, single-blinded, placebo-controlled clinical trial;
Iran
T2D patients, 2010;
10 (100)
49.10 ± 1.2350,000 IU of Vitamin D capsules per week for eight weeks.Vitamin D supplementation significantly reduced tumor necrosis factor-alpha (TNF-α) and CRP.
Limonte et al., 2021 [58]Randomized double-blinded placebo-controlled trial; USAT2D patients, 1312703;
376 (53.5)
67.4 ± 7.02000 IU vitamin D3 per day for five years.Vitamin D supplementation showed no significant changes in interleukin (IL)-6 and CRP compared to the placebo group.
Barale et al., 2020 [65]Open-label randomized-controlled pilot study;
Italy
T2D patients, 3016;
11 (68.8)
71.6 ± 3.5500 IU oral cholecalciferol once a week for one year.Vitamin D supplementation showed no significant difference in lipid profiles compared to the placebo group.
Hajj et al., 2020 [76]Randomized controlled double-blind study;
Lebanon
T2D patients, 8845;
23 (51)
66.9 ± 4.110,000 IU cholecalciferol three times per week for six months.Vitamin D supplementation significantly reduced CRP and TNF-α levels compared to baseline data. No significant changes were observed in terms of IL-6 when compared to baseline data.
Imanparast et al., 2020 [56]Randomized placebo-controlled trial;
Iran
T2D patients, 9223;
11 (47.8)
53.63 ± 12.2950,000 IU of vitamin D3 per week for four monthsVitamin D supplementation significantly decreased TC and TNF-α levels, with no significant changes in LDL, HDL, and triglyceride (TG) levels compared to the placebo group.
Meng et al., 2020 [59]Double-blinded randomized placebo-controlled trial
USA
T2D patients, 12756;
43 (76.8)
65 ± 8.04000 IU per day of vitamin D3 for 24 weeks.Vitamin D supplementation showed no significant difference in serum LDL and HDL-c compared to the placebo.
Mirzavandi et al., 2020 [55]Randomized, controlled clinical trial;
Iran
T2D patients, 5025;
5 (20)
46 ± 1.0 Two intramuscular injections of a
200,000 IU vitamin D supplement at 0 and 4 weeks.
Vitamin D supplementation led to a significant decrease in the levels of CRP and TG in comparison to baseline data.
Dadrass et al., 2019 [54]Randomized, placebo-controlled, double-blinded clinical trial;
Iran
T2D patients, 2412;
12 (100)
53.83 ± 6.6150,000 IU per 2 weeks for three monthsVitamin D supplementation significantly decreased IL-6 and TNF-α without change in CRP compared to placebo.
Omidian et al., 2019 a [52]Randomized double-blinded placebo-controlled trial;
Iran
T2D patients, 6632;
19 (59.4)
49.7 ± 6.54000 IU vitamin D daily for 12 weeks.Vitamin D supplementation significantly increased TG levels compared to baseline data.
Omidian et al., 2019 b [53]Parallel randomized double-blind placebo-controlled clin-
ical trial;
Iran
T2D patients, 4724;
10 (41.6)
51.3 ± 4.74000 IU vitamin D daily for 12 weeks.Vitamin D supplementation significantly decreased IL-6 and MCP-1 levels compared to baseline data.
Wenclewska et al., 2019 [77]Randomized controlled trial;
Poland
T2D patients, 9248;
14 (29)
63.43 ±1.572000 IU of vitamin D3 per day for three months.Vitamin D supplementation increased HDL compared to baseline data.
Angellotti et al., 2019 [60]Randomized, double-blind, placebo-controlled clinical trial;
USA
T2D patients, 11466;
49 (71)
60.1 ± 8.44000 units of vitamin D3 for 48 weeks.Vitamin D supplementation revealed no significant in CRP, with a significant reduction in TG levels.
Fazelian et al., 2018 [51]Randomized double-blind placebo-controlled clinical trial;
Iran
T2D patients, 5126;
0 (0)
48.5 ± 7.58one oral pearl
of 50,000 IU vitamin D3 for 16 weeks.
Vitamin D supplementation significantly reduced CRP and increased IL-10 levels.
Upreti et al., 2018 [70]Parallel randomized, placebo-controlled trial;
India
T2D patients, 6030;
15 (50)
48.3 ± 9.860,000 IU weekly for six weeks, followed by once every four weeks for 24 weeks.Vitamin D supplementation led to a significant difference in total cholesterol compared to the placebo group.
Barchetta et al., 2016 [64]Randomized, double-blind, placebo-controlled trial;
Italy
T2D patients, 6526;
18 (50)
57.4 ± 10.72000 IU cholecalciferol per day for 24 weeks.Vitamin D supplementation showed a significant difference in LDL, HDL, and TG without any significant difference in CRP levels.
Dalan et al., 2016 [74]Parallel randomized, double-blind, placebo-con-
trolled trial;
Singapore
T2D patients, 6131;
14 (45)
52.2 ± 8.24000 IU vitamin D (oral cholecalciferol) and 2000 IU for 16 weeks.Vitamin D supplementation showed no significant effect on
lipid profiles and CRP in comparison to baseline data.
Sadiya et al., 2015 [47]Randomized, double-blind clinical trial;
United Arab Emirates
T2D patients with obesity, 82.43;
9 (20.9)
49 ± 8.0Vitamin D (6000 IU) per day, followed by 3000 IU vitamin D3 daily for six months.Vitamin D supplementation showed no significant differences in lipids and CRP compared to placebo groups.
Muñoz-Aguirre et al., 2014 [73]Randomized, double-blind, placebo-
controlled trial;
Mexico
T2D patients, 104.52;
0 (0)
56.1 ± 5.14000 IU of vitamin D daily for six months.Vitamin D supplementation revealed no significant changes in LDL, and TC levels significantly decreased TG compared to the placebo.
Gagnon et al., 2014 [67]Randomized, double-blinded, placebo-controlled trial;
Australia
T2D patients, 80.35;
10 (28.6)
53.8 ± 11.92000 IU of vitamin D3 for six months.Vitamin D supplementation showed no difference in inflammatory markers compared to placebo.
Jehle et al., 2014 [75]Prospective, randomized, double-blind, placebo-con-
trolled pilot;
Switzerland
T2D patients, 55.29;
10 (34.5)
66.9 ± 3.1A single 300,000 IU intramuscular injection of vitamin D3 for six months.Vitamin D supplementation revealed no significant difference in levels of CRP compared to placebo groups.
Kampmann et al., 2014 [69]Randomized, double-blind, placebo-controlled trial;
Denmark
T2D patients, 16.8;
6 (75)
61.6 ± 4.411,200 IU cholecalciferol per day for ten weeksVitamin D supplementation resulted in no significant difference in HDL, LDL, TC, TG, CRP, TNF-α, IL-6, and IL-8 compared to placebo groups.
Maggi et al., 2014 [66]Randomized, double-blind, placebo-controlled clinical trial;
Italy
T2D patients, 3014;
9 (64)
69 ± 4.5Single oral dose of 300,000 IU of Vitamin D3 for 24 weeks.Vitamin D supplementation led to no significant difference in TNF-α levels compared to the group on placebo.
Ryu et al., 2014 [72]Prospective, randomized, double-blind-
ed, placebo-controlled trial;
Korea
T2D patients, 15879;
NR
54.8 ± 7.61000 IU of vitamin D3 with a combined 100 mg of
calcium twice daily for 24 weeks.
Vitamin D supplementation showed no significant difference in lipid profiles and inflammatory markers compared to placebo groups.
Tabesh et al., 2014 [50]Parallel- randomized placebo-
controlled clinical trial;
Iran
T2D patients, 11829;
15 (51.7)
50.2 ± 6.650,000 IU vitamin D3 per week for eight weeks.Vitamin D supplementation showed no significant effect on serum levels of HDL, LDL, and TG compared to a placebo group.
Akbarzadeh et al., 2013 [49]Randomized
double-blind placebo-controlled trial;
Iran
T2D patients, 7035;
35 (100)
53.8 ± 8.9Two tablets of Calcitriol (0.25 μg 1,25-dihydroxy cholecalciferol) (≈10 IU) per day for 12 weeks.Vitamin D supplementation showed no significant effect on the marker of inflammation, including CRP, IL-6, and IL-18 levels, compared to baseline data.
Breslavsky et al., 2013 [71]Randomized, double-blind, placebo-controlled trial;
Israel
T2D patients, 4724;
11 (45.8)
66.8 ± 9.21000 IU Vitamin D daily for 12 months.Vitamin D supplementation had no significant effect on lipid profile and CRP compared to the placebo group.
Neyestani et al., 2012 [48]Randomized, double-blinded controlled trial;
Iran
T2D
Patients, 60
30;
NR.
51.5 ± 5.4500 IU vitamin D3 and 150 calcium for 12 weeks.Vitamin D supplementation significantly decreased CRP, IL-1β, and IL-6 compared to placebo.
Punthakee et al., 2012 [62]Randomized, double-blind
placebo-controlled trial;
Canada
T2D patients, 1332607;
362 (59.6)
66.7 ± 6.71000 IU daily for five and a half years.Vitamin D supplementation showed no significant effect on HDL, LDL, TG, and TC in comparison to placebo.
Witham et al., 2010 [61]Parallel, randomized, placebo-
controlled trial;
Canada
T2D patients, 9537;
13 (35)
64.27 ± 10.27A single dose of 100,000 IU vitamin D3 or 200,000 IU vitamin D3 for 16 weeks.There was no significant difference in TC levels between the vitamin D and placebo groups.
T2D: type 2 diabetes, RCT: randomized controlled trial, HDL: high-density lipoprotein, LDL: low-density lipoprotein, TNF-α: tumor necrosis factor-alpha, IL-6: interleukin 6, CRP: C-reactive protein.

3.3. The Methodological Quality of Included RCTs

The overall quality of included RCTs was excellent, with a JADAD median and range score of 4 (1–5). Based on the domains, randomization was rated as 2 (1–2), blinding 1.5 (0–2), and the account of all patients was 1 (0–1). Additional details about the methodological quality of these RCTs are presented in Supplementary Table S2.

3.4. Effect of Vitamin D on Markers of Inflammation

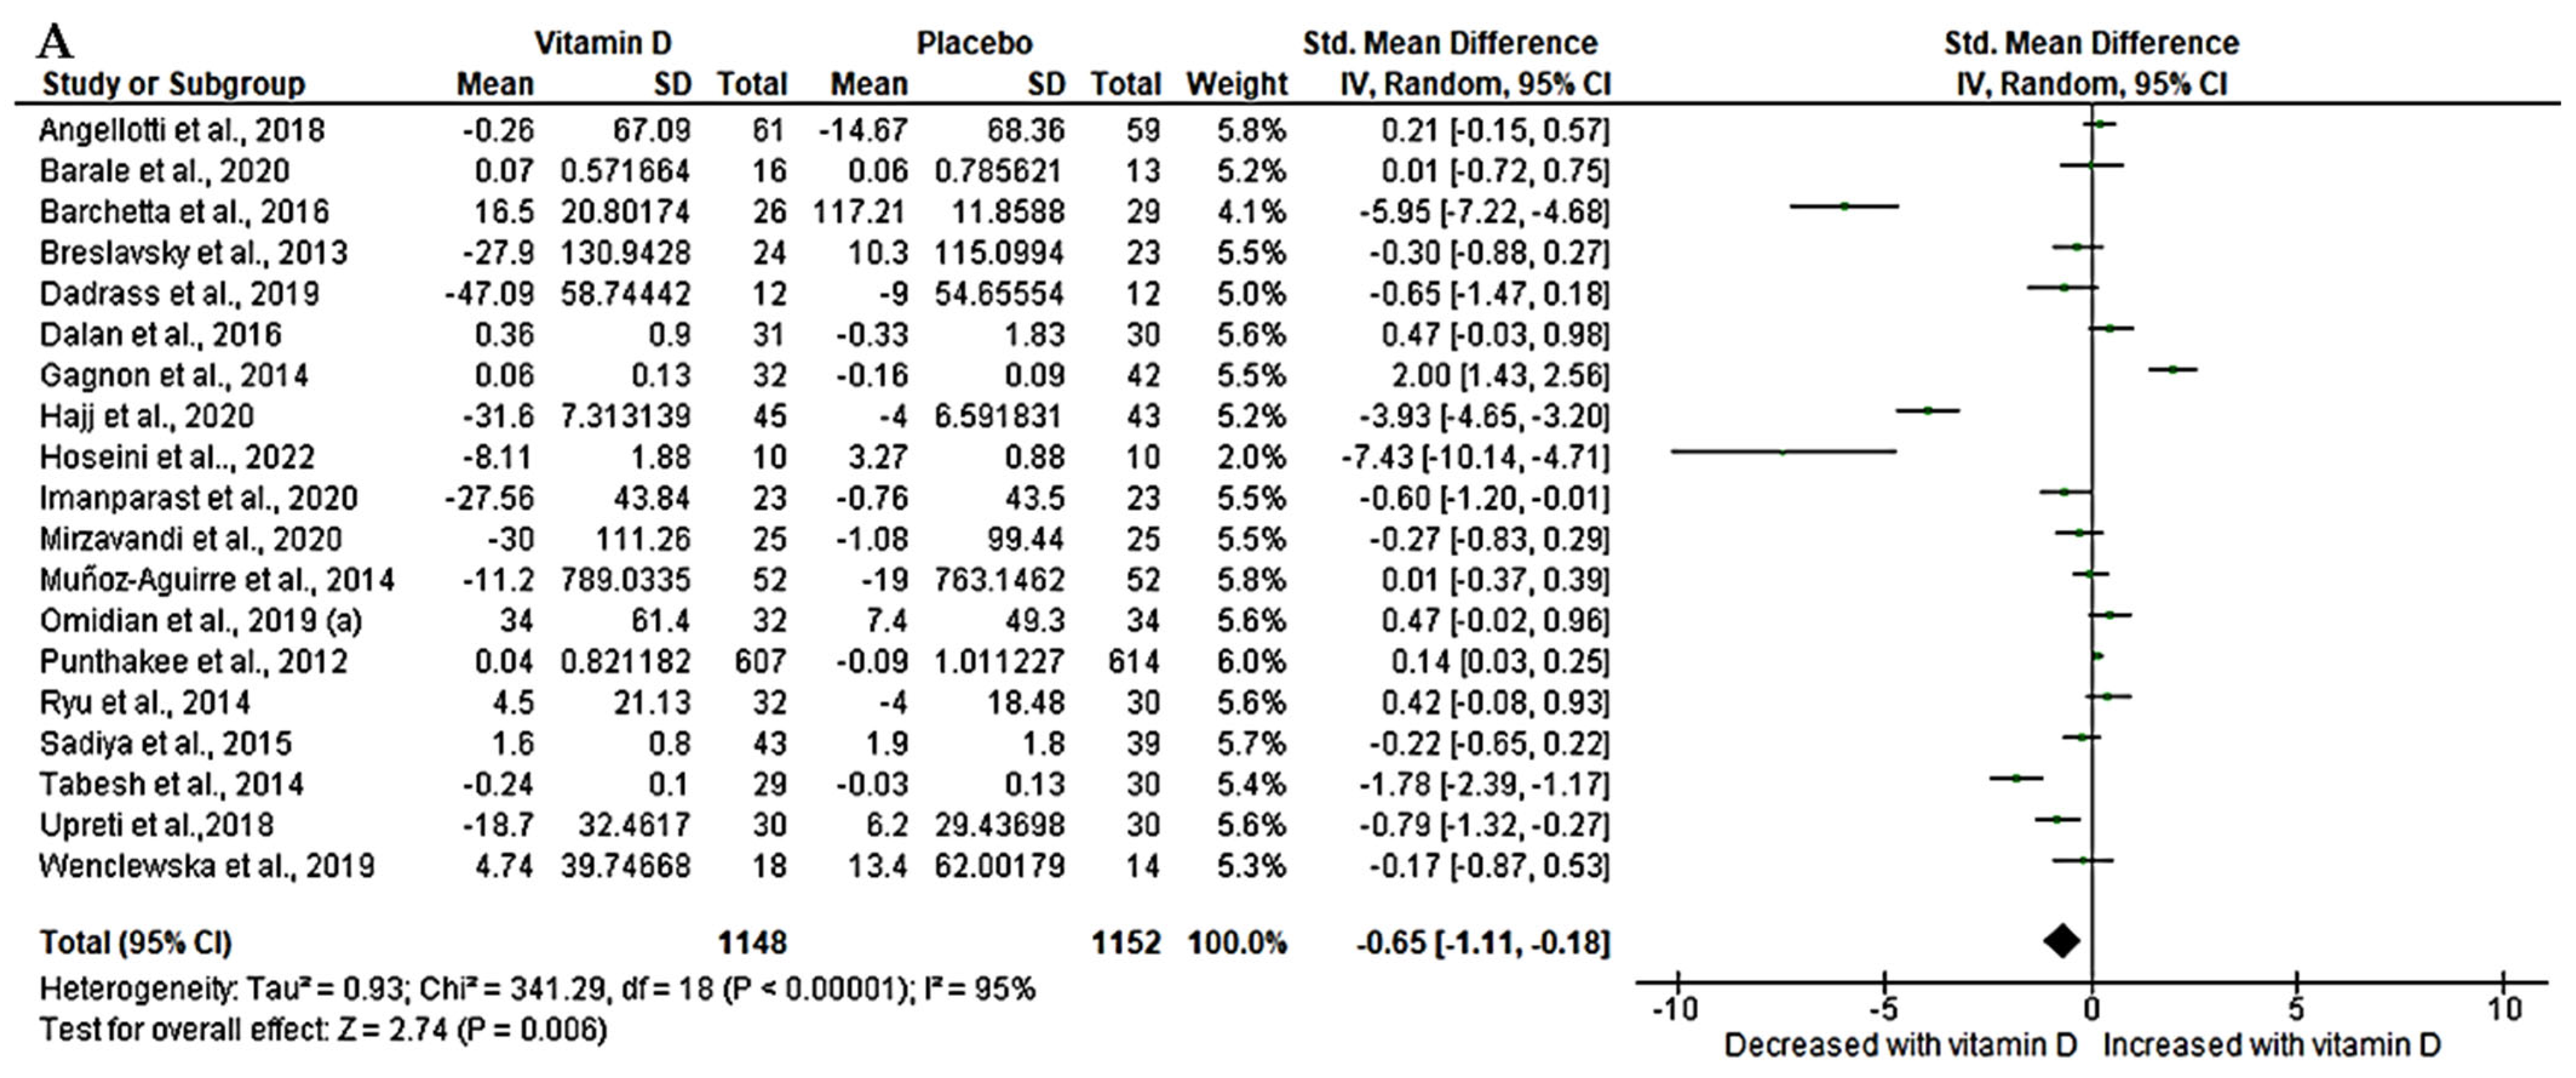
3.4.1. Effect of Vitamin D on High Sensitivity-C-Reactive Protein (hs-CRP) in T2D Patients

The level of hs-CRP was determined in 11 RCTs [49,51,58,67,68,71,72,74,75,76,78] with a sample size of 1676. The overall changes in hs-CRP were either extracted or estimated from baseline and post-treatment results. The analyzed data revealed a significant effect of vitamin D on hs-CRP in T2D patients compared to placebo. This is demonstrated by a significant decrease in the level of circulating hs-CRP (SMD = −1.06, 95%CI (−1.67, −0.45); p < 0.05). We observed a significant statistical heterogeneity amongst the studies (I2 = 95%, p < 0.05) (Figure 2A).

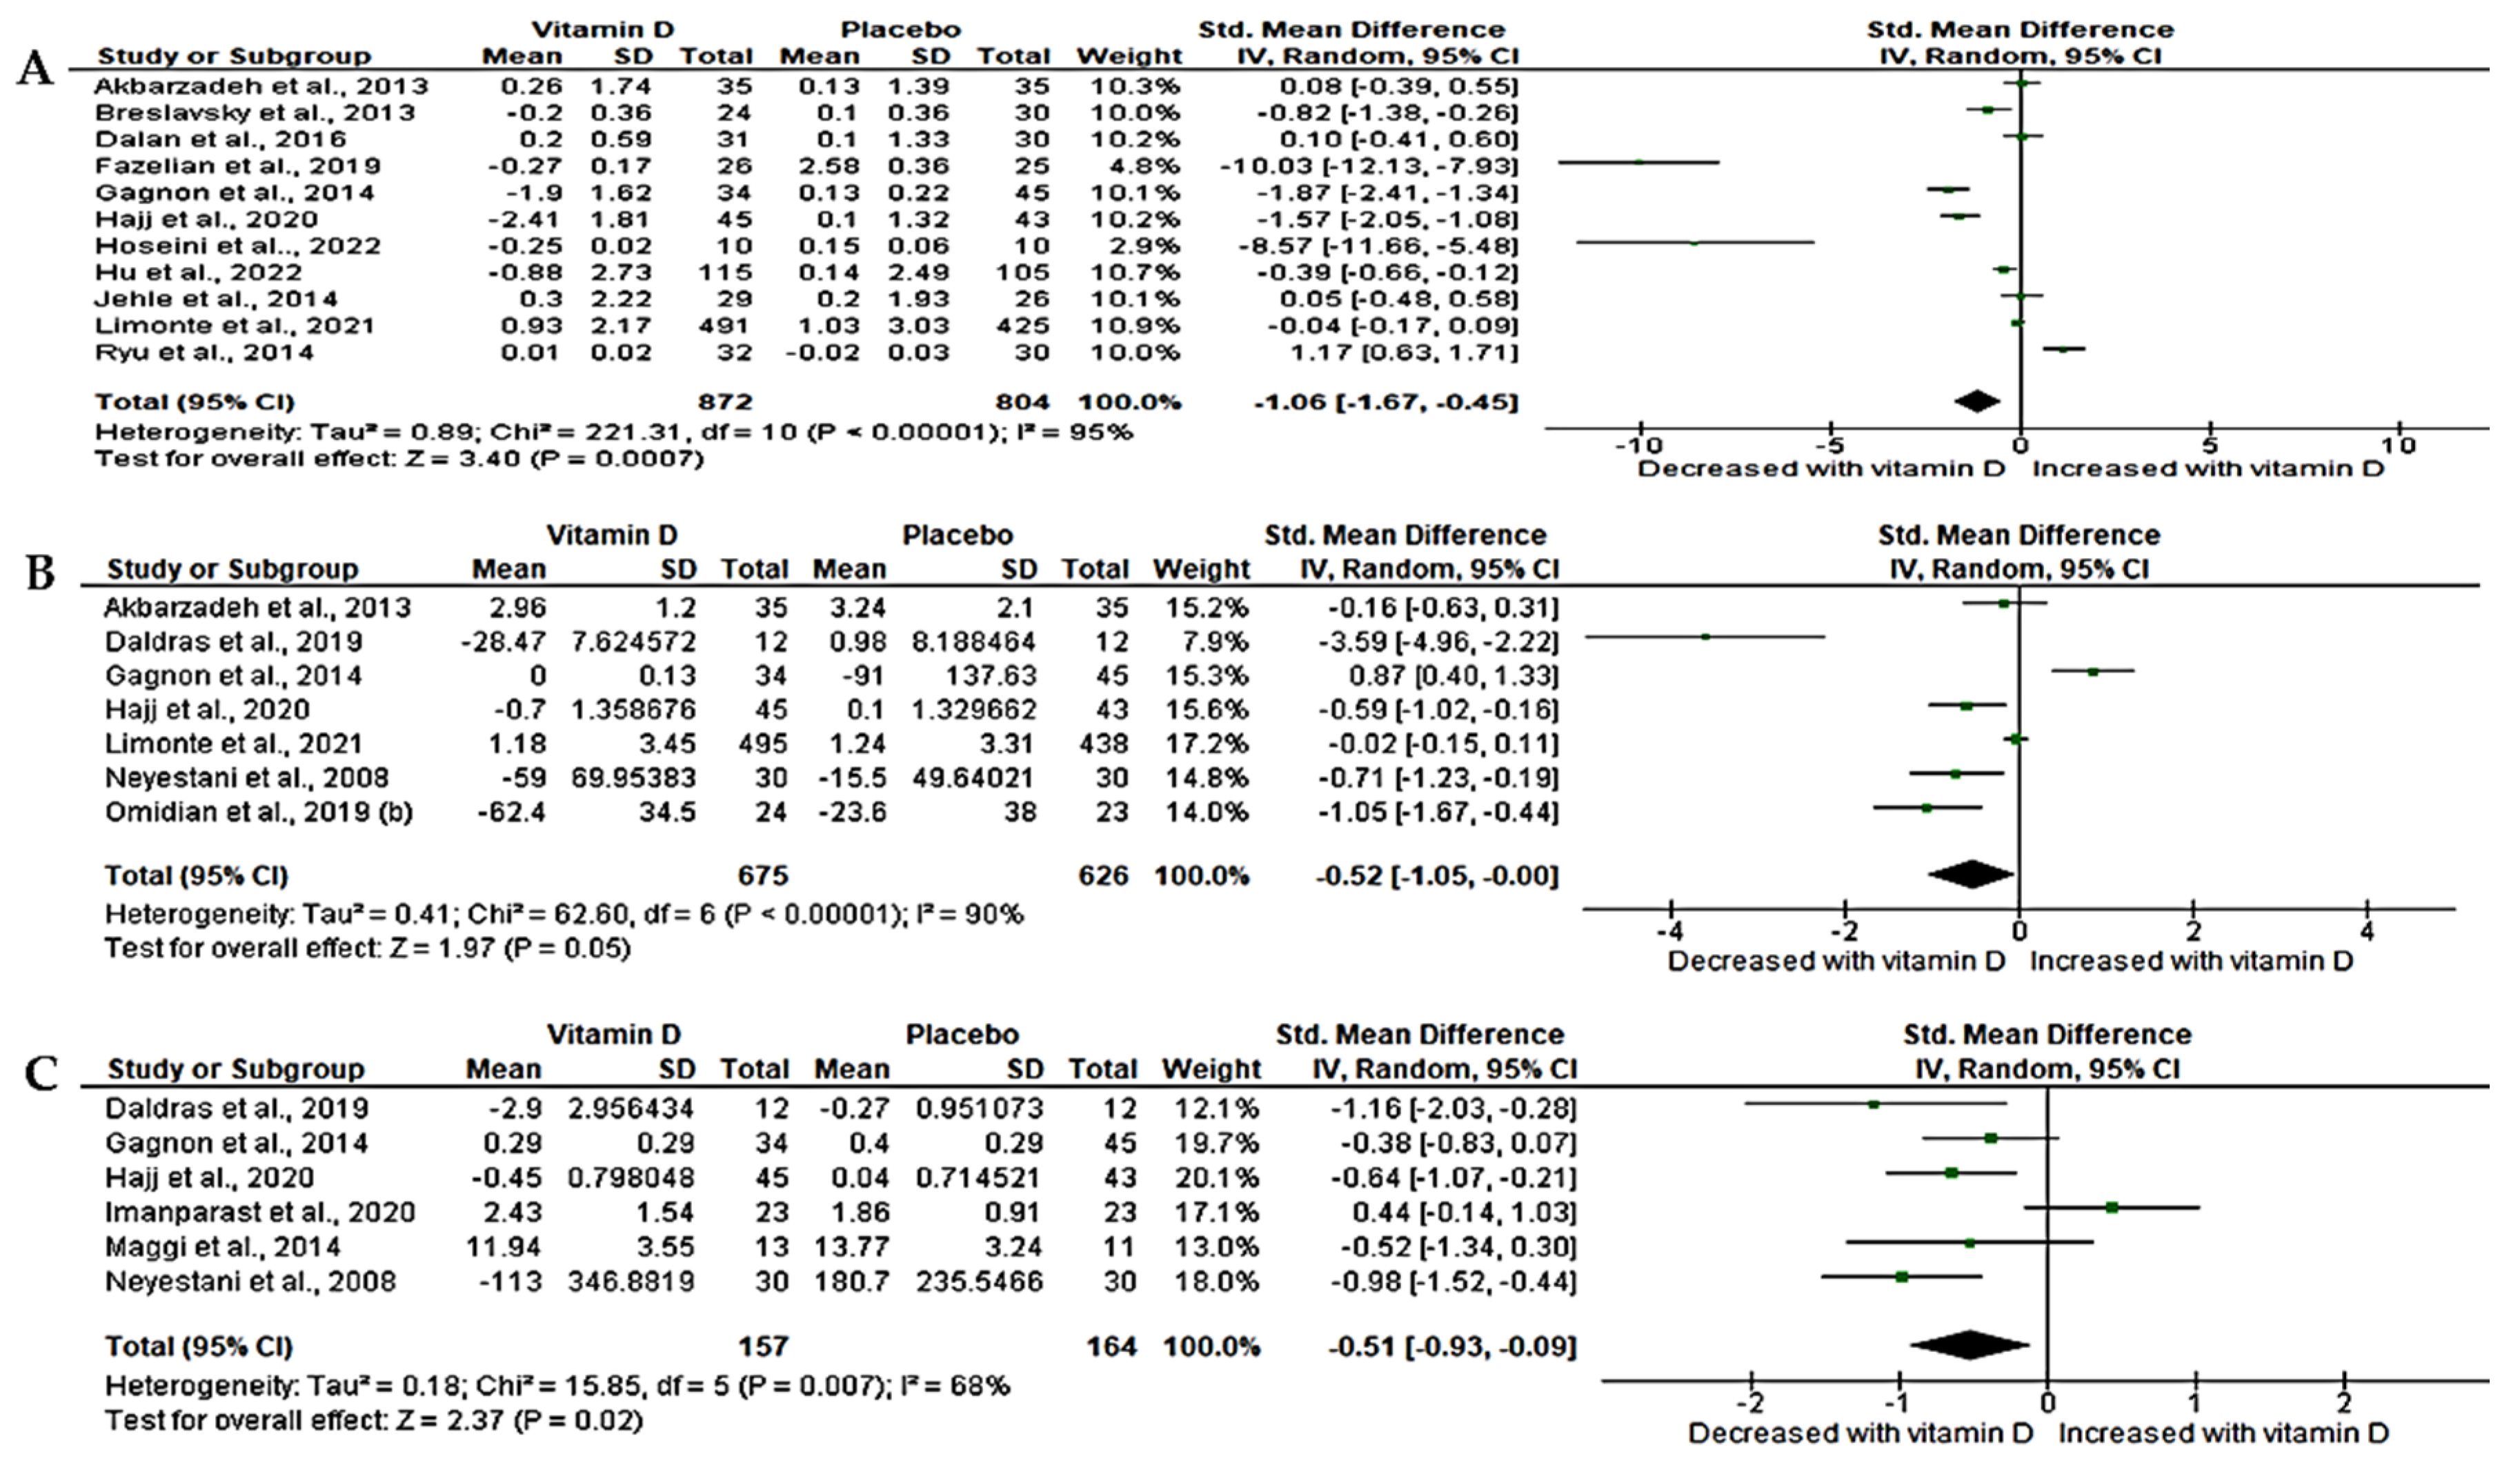
3.4.2. Effect of Vitamin D on Interleukin-6 (IL-6)

We found that only six relevant trials [48,49,53,54,58,67,76] with a sample size of 1301 determined the level of IL-6 following vitamin D supplementation in T2D. Our results showed the beneficial effects of vitamin D on IL-6, which was demonstrated by a marginal decrease in its circulating levels (SMD= −0.52, 95%CI (−1.05, 0.01, p = 0.05). However, statistical heterogeneity was noted across these RCTs (I2 = 90%, p < 0.05) (Figure 2B).

3.4.3. Effect of Vitamin D on Tumor Necrosis Factor-Alpha (TNF-α)

The inflammatory biomarker, TNF-α, was determined in 6 trials [48,54,56,66,67,76] with a sample size of 321. Of interest is that vitamin D exhibited potential benefits on TNF-α as shown by a significant decrease in TNF-α when compared to placebo (SMD = −0.51, 95%CI (−0.93, −0.09); p = 0.02). However, moderate statistical heterogeneity was observed (I2 = 68%, p < 0.05) (Figure 2C).

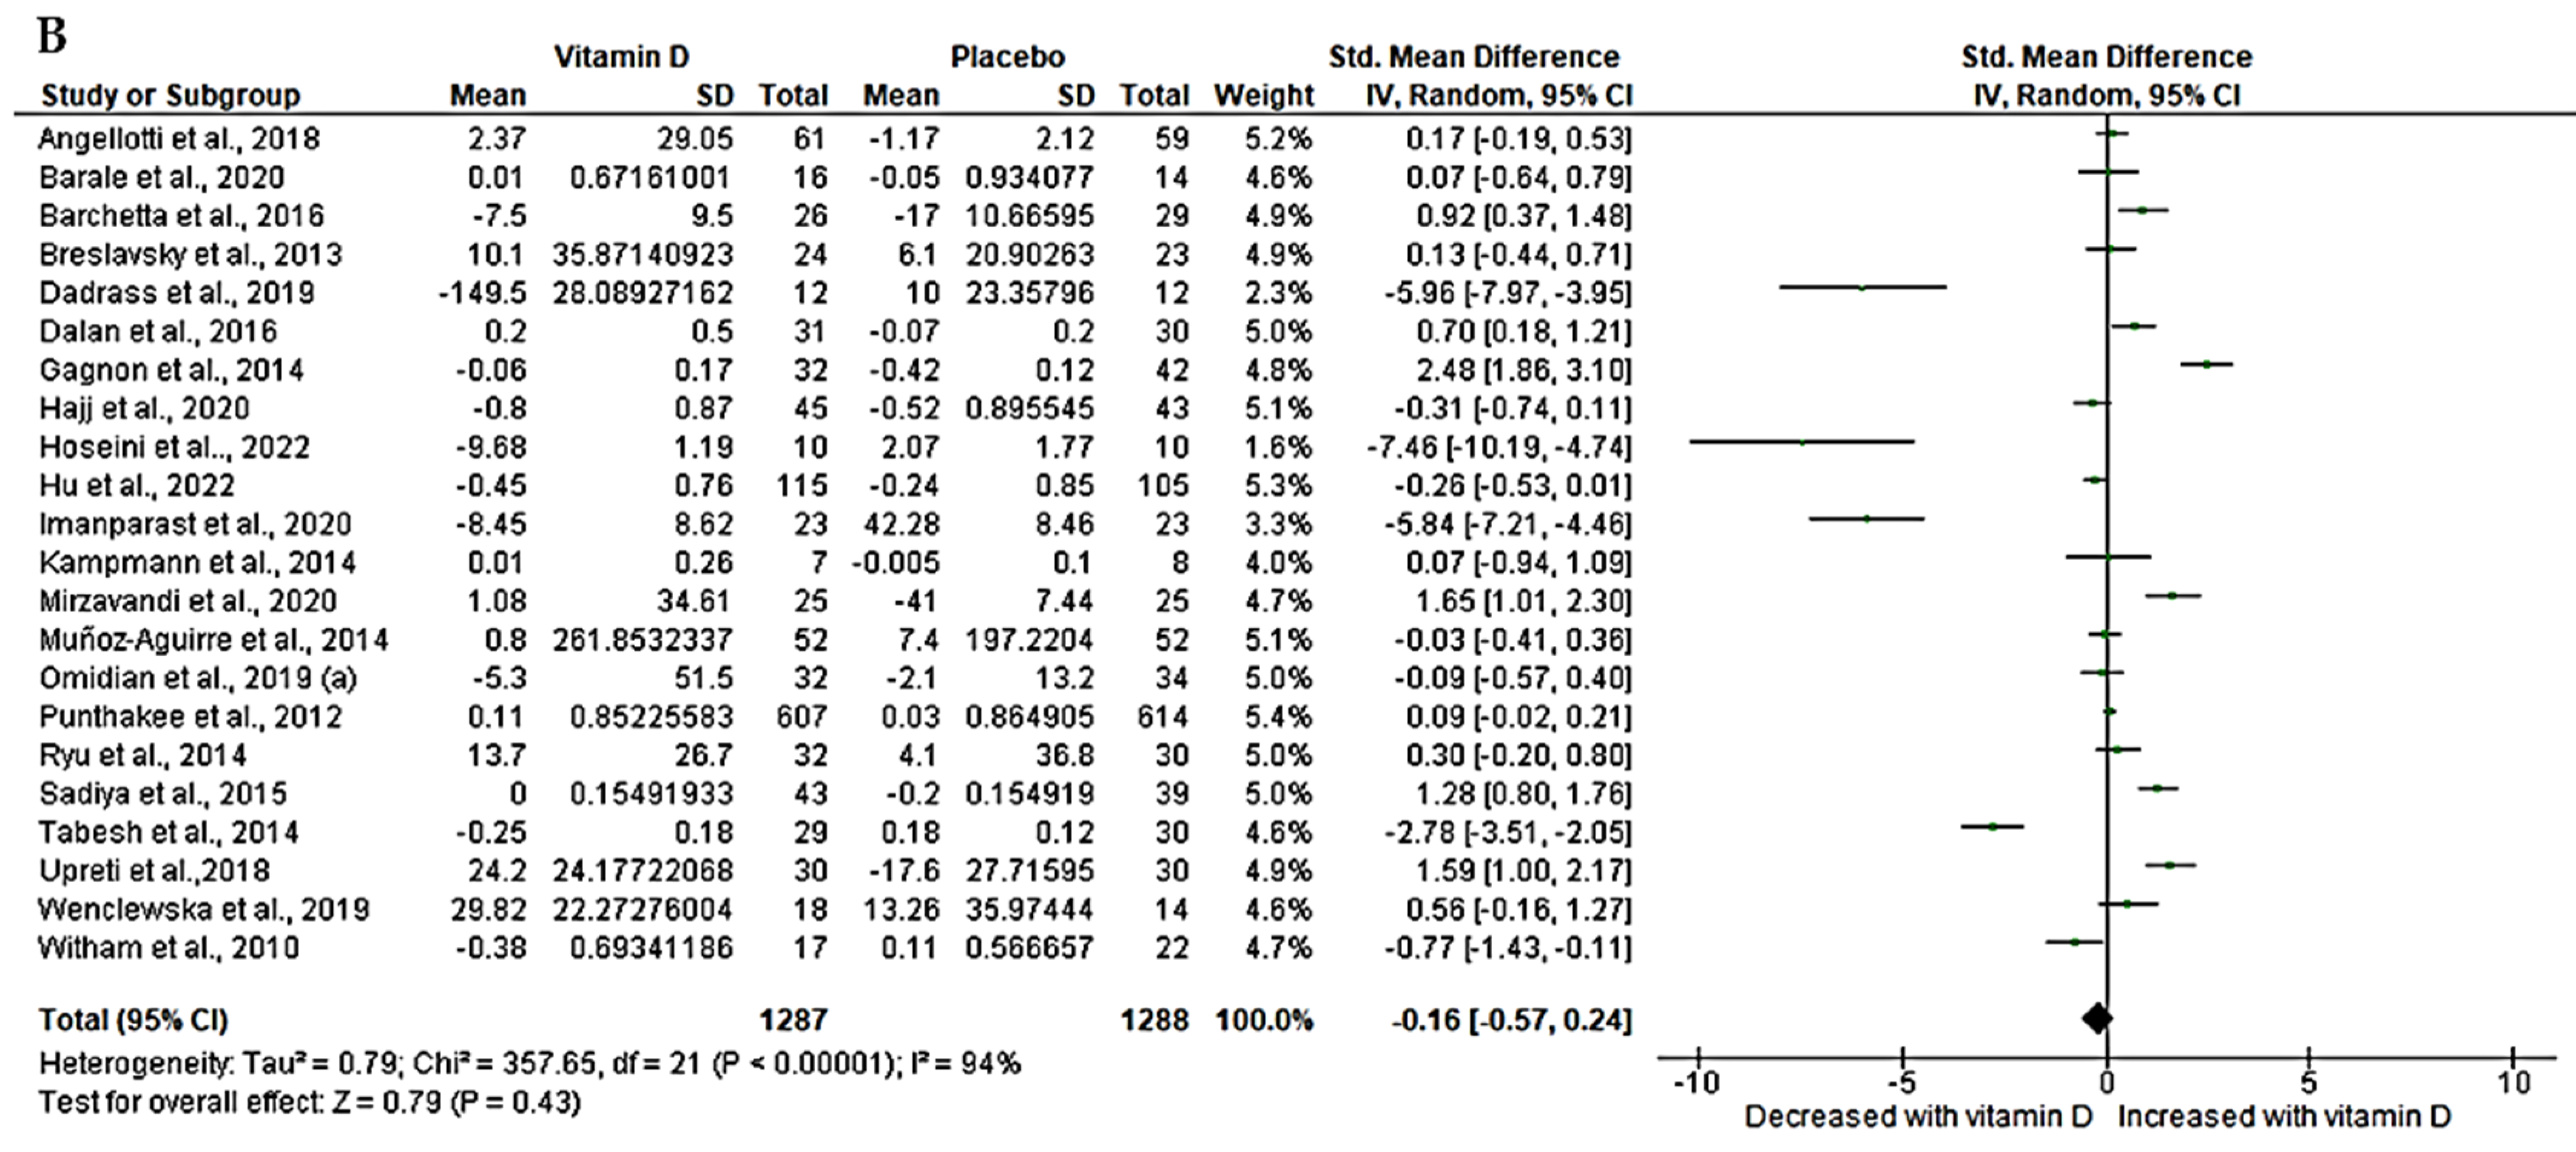
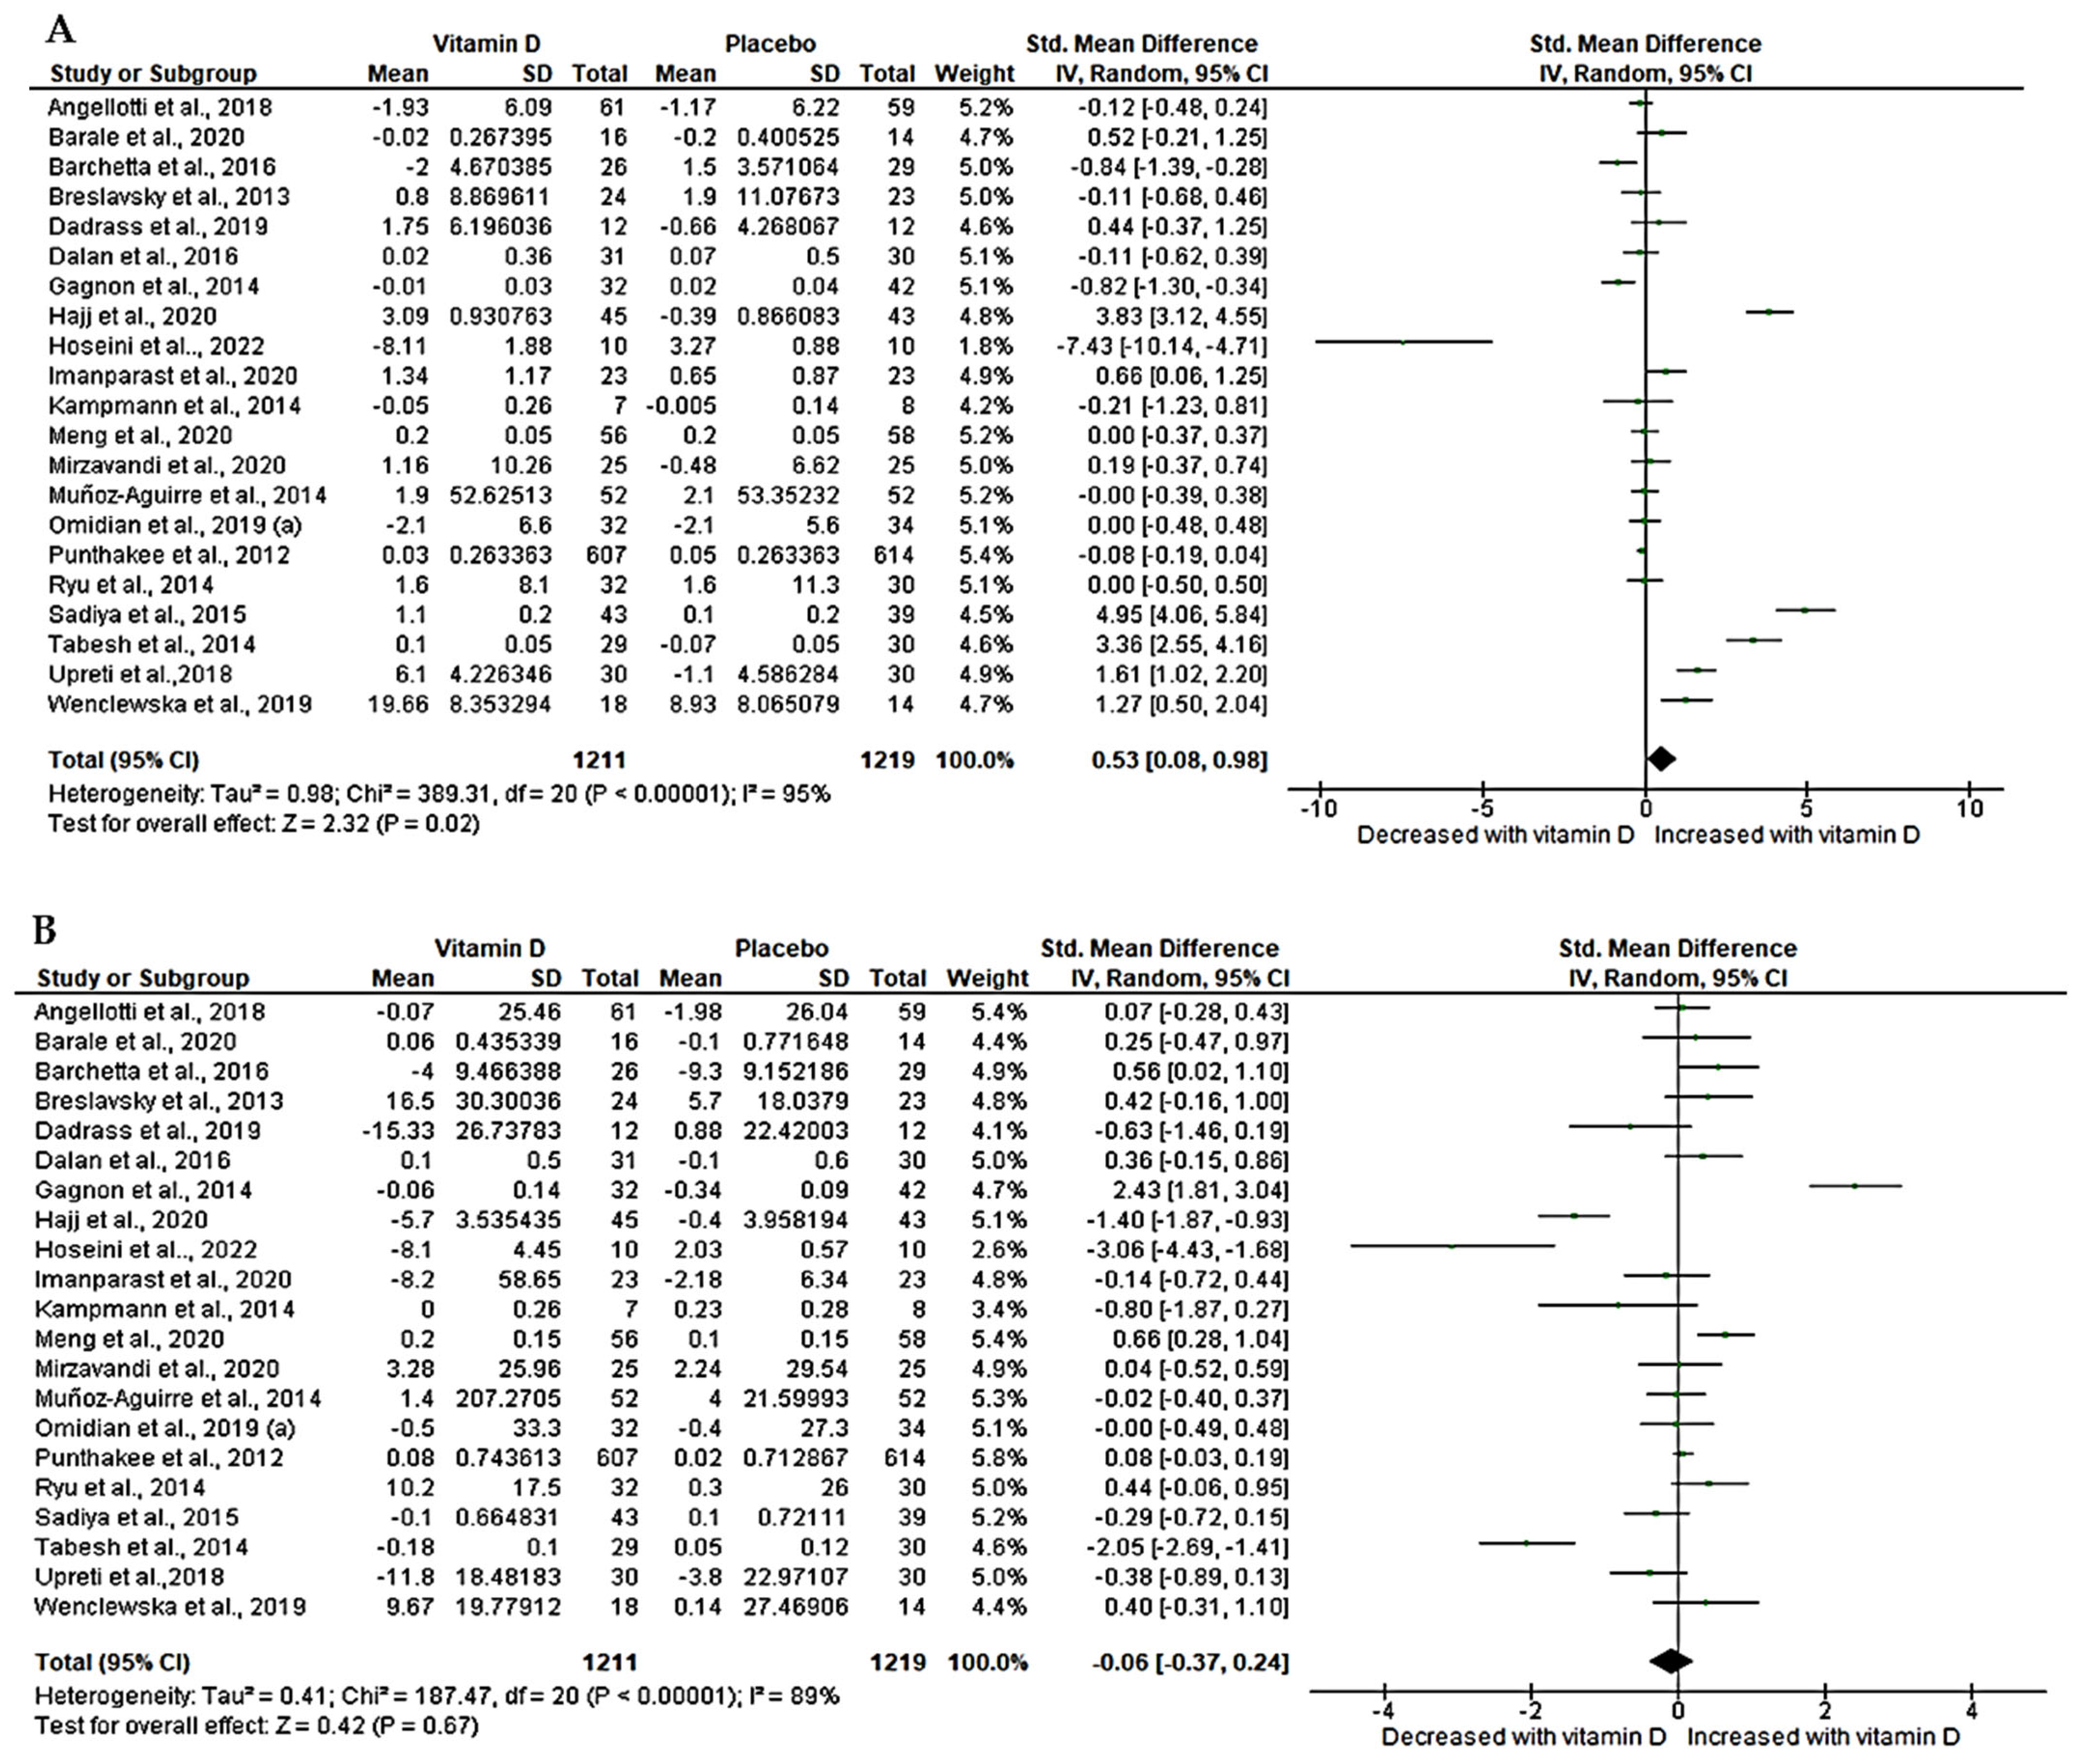
3.5. Effect of Vitamin D on Lipid Profiles (Triglycerides and Total Cholesterol)

From our relevant trials, only 19 [47,50,52,54,55,56,57,60,62,64,65,67,70,71,72,73,74,76,77] with a sample size of 2300 that determined triglycerides had enough data to be pooled for meta-analysis. Our effect estimates demonstrated a significant effect of vitamin D on triglyceride. This is revealed by a significant decrease in triglyceride (SMD = −0.65, 95%CI (−1.11, −0.18), p < 0.05) with a high level of statistical heterogeneity (I2 = 95%, p < 0.05) (Figure 3A). In contrast, total cholesterol was reported in 22 trials [47,50,52,54,55,56,57,60,62,64,65,67,68,70,71,72,73,74,76,77] with a sample size of 2575 between the two groups. Our pooled evidence shows that vitamin D had no significant statistical difference in total cholesterol when T2D patients were given either vitamin D or matched placebo drugs. However, a moderate decrease was observed (SMD = −0.16, 95%CI (−0.57, 0.24), p = 0.43) accompanied by a significant heterogeneity (I2 = 94%, p < 0.05) (Figure 3B).

3.6. Effect of Vitamin D on Lipid Profiles (HDL and LDL)

High-density lipoprotein was determined in 21 trials [47,50,52,54,55,56,57,59,60,62,64,65,67,70,71,72,73,74,76,77] with a sample size of 2430. Our pooled effect estimates showed a significant increase in HDL following vitamin D treatment in T2D patients compared to matched placebo (SMD = 0.53, 95%CI (0.08, 0.98), p = 0.02). Of concern was a high statistical heterogeneity amongst these trials (I2 = 95%, p < 0.05) (Figure 4A). Similarly, low-density lipoprotein was reported in 21 trials [47,50,52,54,55,56,57,59,60,62,64,65,67,70,71,72,73,74,76,77] with a sample size of 2430. Our analysis showed a slight decrease in LDL levels; however, this was not statistically significant (SMD = −0.06, 95CI (−0.37, 0.24), p = 0.67, I2 = 89%, p < 0.05) (Figure 4B).

3.7. Subgroup Analysis

Subgroup analysis was conducted for all effect measures based on gender distribution dose and duration of vitamin D intervention. We classified the doses as low or high, the intervention duration as short- or long-term, and gender as male, female, both, or unreported. The overall results are presented in the Supplementary File as Table S3. Briefly, our results showed no significant changes in heterogeneity (I2 remained constant or changed minimally) following subgroup analysis. For instance, the dosage, duration, and gender subgroup test revealed no major change in heterogeneity (I2 > 50%) on hs-CRP (Supplementary Table S3). For IL-6, the subgroup on dosage and gender distribution revealed minimal heterogeneity (I2 = 31.2%) and (I2 = 13.9%), respectively (Supplementary Table S3). Test for subgroup analysis on TNF-α showed a decrease in heterogeneity following subgroup on dosage and gender (Supplementary Table S3). Interestingly, the subgroup based on the duration of intervention revealed no evidence of heterogeneity (I2 = 0%), which was associated with the longer duration of vitamin D supplementation (Supplementary Table S3). Following subgroup analysis, on duration of intervention, a longer duration showed no evidence of heterogeneity in total cholesterol (I2 = 0%) and triglyceride (I2 = 0%) (Supplementary Table S3). Similarly, HDL and LDL duration and dosage seem to reduce heterogeneity to minimal, with long vitamin D supplementation resulting in zero heterogeneity (I2 = 0%) (Supplementary Table S3).

3.8. Sensitivity Analysis

Sensitivity was performed using the leave-one-study-out approach to evaluate the stability of the effect size across all outcomes. Results are presented in Supplementary Table S4–S10. For hs-CRP, exclusion of a trial by Fazelian [51] due to low weight led to SMD = −0.58, 95%CI (−0.19, −0.24), p = 0.03, I2 = 94% (Supplementary Table S4). We found that for IL-6, removing one study [54] due to the small sample size resulted in a change in effect size from original to SMD = −0.25, 95%CI (−0.68, 0.18), p = 0.26, I2 = 87% (Supplementary Table S5), for TNF-α, exclusion of [54] resulted in SMD = −0.42, 95%CI (−0.87, 0.02), p = 0.06, I2 = 70.5% (Supplementary Table S6). For triglycerides and total cholesterol, a study with a small sample size was excluded [57], and the effect size changed to (SMD = −0.06, 95%CI (0.20, −0.32), p = 0.77, I2 = 94%) (Supplementary Table S7) and SMD = −0.04, 95%CI (−0.43, 0.36), p = 0.85, I2 = 94% (Supplementary Table S8) respectively. Lastly, when the same study [57] was excluded for both HDL and LDL, there was a change in effect size SMD = 0.68, 95%CI (0.39, 0.97), p < 0.05, I2 = 95% (Supplementary Table S9) and SMD = 0.02 (−0.17, 0.21), p = 0.91, I2 = 89% (Supplementary Table S10), respectively.

3.9. Publication Bias

The publication bias was assessed visually and graphically through a funnel plot symmetrical shape (Supplementary Figures S1 and S2). For inflammatory markers, asymmetrical plot visualization was noted on IL-6 and hs-CRP, which suggests evidence of publication bias (Supplementary Figure S1A,B). The Eggers regression test further supports this, IL-6 (Z score = −3.21, p < 0.05), hs-CRP (Z-score = −7.74, p < 0.05). Interestingly, there was no evidence of publication bias on hs-CRP and TNF-α graphically (Supplementary Figure S1C) and statistically TNF-α (Z score = −0.49, p = 0.62). The visual examination of the funnel plot indicates the presence of publication bias for lipid profiles (Supplementary Figure S2A–D). This was also corroborated by Egger’s regression test total cholesterol (Z score = −6.84, p < 0.05), triglycerides (Z score = −5.88, p < 0.05), HDL (Z score = −2.23, p = 0.03) and LDL (Z score = −2.31, p = 0.02). One of the factors contributing to the observed publication bias is the disproportionate publication of studies from Iran compared to other countries. This can be attributed to the high prevalence of vitamin D deficiency among the Iranian population, suggesting a reliance on vitamin D supplementation in this region as opposed to other countries.

3.10. Certainty of Evidence

We further evaluated certainty by GRADING evidence gathered in this review using GRADEprofiler. The results are presented in Supplementary Table S11. In brief, our results were rated high-quality for TNF-α, IL-6, triglyceride, and total cholesterol, moderate for CRP and HDL, and low for LDL.

4. Discussion

We gathered evidence from 30 RCTs to simultaneously evaluate the effect of vitamin D on inflammatory markers and lipid profiles in type 2 diabetic patients. This meta-analysis included trials with at least 2310 T2D patients on vitamin D supplementation and revealed vitamin D’s potential to ameliorate inflammation. This is demonstrated by a significant reduction in circulating hs-CRP and TNF-α. A marginal potential effect was also observed on IL-6 following vitamin D supplementation. These results suggest that vitamin D supplementation in T2D may be beneficial in alleviating inflammatory-associated complications. Moreover, our findings are supported by Gu et al., 2022 [79]. Our results are corroborated by Calton et al., 2015, who demonstrated an anti-inflammatory effect of vitamin D through evidence from an in vitro study [80]. These researchers assessed monocyte chemoattractant protein-1 (MCP-1), IL-6, and IL-8 as markers of inflammation, which were reduced after 1,25(OH)2, cholecalciferol, and 25(OH)D treatment. This meta-analysis demonstrated the ameliorative effect of vitamin D on inflammation by reducing the level of CRP and TNF-α. Notably, our study indicated a marginal decrease in IL-6 (p = 0.05) in T2D following vitamin D supplementation. However, it is noteworthy that a prior meta-analysis by Yu et al., 2018, revealed no significant effect of vitamin D supplementation on TNF-α and IL-6 despite supporting our findings on the observed significant decrease in hs-CRP [31]. Despite being conducted in T2D, a limitation of the prior meta-analysis lies in its sample size, comprising only 13 studies. Furthermore, the intervention group encompassed studies using combined supplementation, such as calcium and vitamin K, which could influence the overall efficacy of vitamin D. For instance, Jorde has reported a negative correlation between vitamin D and calcium intake with the serum level of vitamin D [81].
Conversely, another study showed no significant effect of vitamin D on CRP and TNF-α serum levels. However, the same study revealed a significant increase in the serum IL-6 [82]. Increased IL-6 observed in this study implies that vitamin D promoted inflammation. This further suggests that vitamin D exhibited no anti-inflammatory effects among the included studies. These conflicting results may be attributed to a different form of vitamin D, dosage, duration of intervention, and the main aspect in terms of population, as evidence was pooled from studies where patients had T2D, human immune-deficiency virus (HIV), pre-diabetes, and non-alcoholic fatty liver diseases. For example, HIV independently is associated with chronic inflammation [83]. Also, non-alcoholic fatty liver disease is an inflammation of the liver due to fat accumulation in the hepatocytes [84]. An existing meta-analysis by Chen and his team in 2014 reported a significant decrease in CRP levels following vitamin D administration [85]. Notably, this meta-analysis evaluated a group of patients with various metabolic conditions ranging from obesity, pregnant women, T2D, coronary artery disease, polycystic ovary syndrome, insulin-resistant condition, or bedridden older patients in addition to healthy participants contrary to our focus, which is strictly on T2D. All these conditions independently may trigger an inflammatory response, and thus, the effect observed might not necessarily be due to vitamin D but be attributed to these conditions. Another qualitative study synthesized by Agbalalah et al., 2017 [86], reported no benefit of vitamin D supplementation in adult patients, and this study was based on a wide range of conditions, including HIV, chronic kidney disease (CKD), and T2D. Although this study reported null findings, this can be due to the fact that HIV is associated with increased immune activation, ongoing HIV replication, and immune dysfunction, which contributes to chronic states of inflammation [83].
Similarly, CKD activates NF-κβ and Toll-like receptor pathways, producing inflammatory molecules that exacerbate inflammation [87]. Hence, our results suggest that vitamin D can inhibit the production of pro-inflammatory markers, including TNF-α, IL-6, and hs-CRP. These markers promote an inflammatory response. Therefore, vitamin D, by reducing their production, may ameliorate inflammation. Some of the mechanisms by which vitamin D regulates inflammation are mediated by signaling pathways, including cyclooxygenase suppression of NF-κβ. These regulate inflammatory gene expression and mitogen-activated protein kinase (MAPK) activation, mediating inflammatory responses [88]. Therefore, by inhibiting p38 MAPK, vitamin D can suppress the production of pro-inflammatory cytokines, such as TNF-α and IL-6 in macrophages [89]. Inhibition of p38 gene expression in macrophages activates MAPK phosphatase-1 (MKP1), which dephosphorylates p38 and thus reduces p38 activation. Vitamin D and its receptor complex can interact with NF-κβ, or the glucocorticoid receptor, which results in anti-inflammatory effects [88]. Likewise, vitamin D modulates T-cells through its receptors. This action inhibits the differentiation of T-cells into pro-inflammatory subsets and thus promotes the development of regulatory T-cells, which exhibit anti-inflammatory properties [90,91].
Secondly, in terms of the effects of vitamin D on lipid profiles, we found that vitamin D administration can ameliorate dyslipidemia, as shown by a significant decrease in triglycerides, concomitant to an increased HDL. Increased triglyceride levels in the body are associated with atherosclerosis and increased risk of heart failure. Our findings are supported by these trials [55,60,63,64,73,77]. However, some studies disagree with our findings despite being conducted in T2D [56,59,62,69,71,72,92,93]. It is important to note that reducing triglycerides and increasing HDL, especially in T2D patients, may curb secondary complications associated with T2D. Although there was a notable reduction in total cholesterol and LDL in our current study, this was statistically not significant in the current analysis. These findings are partly supported by Qi et al., 2022, who reported no effect of vitamin D on lipid profile in general; however, this meta-analysis was conducted in patients with metabolic syndromes [94] and might not be comparable to our findings. This is partly due to different underlying mechanisms, severity, individual responses, and management approaches.
The ameliorative effect of vitamin D on cholesterol levels is attributable to its potential to influence insulin-gene expression, the transcription activity on vitamin D receptor (VDR), downregulate activation of sterol regulatory element binding protein-2 (SREBP-2), inhibition of 3-hydroxy-3-methyl glutaryl-coenzyme-A reductase expression, a cofactor for the synthesis of cholesterol with subsequent reduction in cholesterol level [95]. Preclinical evidence also corroborates findings observed in clinical studies by inhibiting SREBP-2 expression [96]. Another animal study also demonstrated vitamin D’s role in maintaining lipid profile by regulating lipogenic genes through downregulating SREBP [97]. In an experimental study, active vitamin D reduced triglycerides in differentiated adipocytes, increased fatty acid β-oxidation, and reduced de novo fatty acid synthesis [98].
Despite the well-designed method used in this systematic review and meta-analysis, the limitations remain; for example, this study included all trials despite different doses and duration of the intervention. Secondly, there was high heterogeneity across the included trials; however, subgroup analyses according to these confounding factors, such as dosage, duration, and gender, proved to have no significant effect on other parameters except TNF-α, total cholesterol, and HDL (I2 = 0%). In addition, sensitivity analysis was performed to evaluate the stability of our effect size and revealed no major changes except a study with a small sample size across all outcome measures. Of interest with this current study is that the sample size used was sufficient as about 30 trials with 2310 T2D patients on vitamin D were included in a meta-analysis. This is a powered sample size and sufficient to make a conclusive statement and recommendation about the efficacy of vitamin D as an anti-inflammatory and anti-dyslipidemic agent in adults with T2D. The overall quality of the included trial was excellent (83%), although two trials individually across all domains were poor (7%), and three were fair (10%) in overall quality. Our certainty of the evidence was high for IL-6, TNF-α, triglyceride, and total cholesterol, moderate for both hs-CRP and HDL, and low for LDL.
Furthermore, the methodology followed in this study was rigorous and adhered to established guidelines of PRISMA. To avoid potential inconsistencies and biases in the selection, extraction, quality assessment, and evidence grading, a minimum of three researchers were involved in each phase. By involving multiple researchers, we ensured that the findings were reliable, thus strengthening the overall validity of the outcomes of this study.

5. Conclusions and Future Perspectives

The evidence obtained in this meta-analysis provides valuable insights into the potential benefits of vitamin D supplementation among T2D patients. Specifically, the results suggest that vitamin D supplementation can have anti-inflammatory and anti-hyperlipidemic effects on T2D. After supplementation, a reduction in TNF-α, IL-6, and hs-CRP levels demonstrates its anti-inflammatory effect, while the decrease in triglycerides and increase in HDL levels demonstrate its anti-hyperlipidemic properties. However, it is important to note that while such benefits were observed, this study found no statistically significant effect of vitamin D supplementation on total cholesterol and LDL amongst these adult T2D patients. This suggests that vitamin D supplementation might not significantly impact these lipid parameters in T2D. The results also raise interesting questions for future research, which needs to focus on proper methodology and powered sample size trials to further investigate the effects of vitamin D supplementation on lipids profiles in T2D patients.
Moreover, exploring different doses of vitamin D, at high and low, with different duration of intervention could provide insights into the optimal dosing and duration of vitamin D for maximum benefits in T2D. Furthermore, the safety of vitamin D should be considered when exploring the long-term effects in this population. Therefore, future trials should also focus on assessing the safety profile of different doses and durations of vitamin D supplementation to ensure that it does not cause adverse effects, especially when administered over extended periods.

Supplementary Materials

The following supporting information can be downloaded at https://www.mdpi.com/article/10.3390/nu15214575/s1, Figure S1: Funnel plots showing bias on inflammatory markers.; Figure S2: Funnel plots showing bias on lipid profile.; Table S1: PubMed Search strategy was updated on the 21 June 2023; Table S2: Quality assessment according to JADAD guidelines; Table S3: Subgroup analysis of RCTs according to dosage, duration of intervention and gender distribution. Table S4: Sensitivity analysis for hs-CRP using leave-one analysis; Table S5: Sensitivity analysis using leave one analysis for IL-6; Table S6: Sensitivity analysis using leave one for TNF-alpha; Table S7: Sensitivity analysis for TG using leave-one analysis; Table S8: Sensitivity analysis for TC using leave-one analysis; Table S9: Sensitivity analysis for HDL using leave-one analysis; Table S10: Sensitivity analysis for LDL using leave-one analysis; Table S11: Summary of findings table to evaluate certainty of evidence.

Author Contributions

Conceptualization, K.M.; methodology, R.M., K.M. and W.N.P.; software, RevMan version 5.4, R.M. and K.M.; validation, K.M. and W.N.P.; formal analysis, R.M. and K.M.; investigation, R.M. and K.M.; resources, K.M.; data curation, R.M. and K.M.; funding, K.M.; writing—original draft preparation, R.M. and K.M.; writing—review and editing, R.M., K.M. and W.N.P.; supervision, K.M. All authors have read and agreed to the published version of the manuscript.

Funding

This research received no external funding.

Institutional Review Board Statement

Not applicable.

Informed Consent Statement

Not applicable.

Data Availability Statement

All data supporting this manuscript is supplied in the form of a Supplementary File.

Acknowledgments

K.M. is partially funded by the Research Excellence Award for Next Generation Researchers (NONF230515106418) and Research Development Grants for nGAP Scholars (NGAP23022780506). Funders have no role in the conceptualization, preparation, data analysis, and conclusion reached in this manuscript. We would also like to thank the University of South Africa for payment of article processing charges.

Conflicts of Interest

The authors declare no conflict of interest.

Abbreviations

CIConfidence intervals.
CRPC-reactive protein.
CVDCardiovascular disease.
GRADEGrading of Recommendation Assessment, Development, and Evaluation.
HDLHigh-density lipoprotein.
IDFInternational Diabetes Federation.
IFγInterferon-gamma.
IL-6Interleukin-6.
IQRInterquartile Range.
IUInternational Unit.
LDLLow-density lipoprotein.
MCP-1Monocyte-Chemoattractant Protein-1.
MDMean difference.
NF-kβNuclear Factor kappa beta.
NONitric oxide.
NRNot Reported.
oxLDLOxidised Low-density lipoprotein.
PRISMAPreferred Reporting Items for Systematic Review and Meta-analysis.
RMRandomized Model.
SDStandard deviation.
SEMStandard Error of Mean.
SMDStandard mean difference.
T2DType 2 diabetes.
TNF-αTumor necrosis factor-alpha.

References

  1. American Diabetes Association. Diagnosis and Classification of Diabetes Mellitus. Diabetes Care 2014, 37, S81–S90. [Google Scholar] [CrossRef] [PubMed]
  2. International Diabetes Federation (IDF). IDF Diabetes Atlas 10th Edition. Available online: www.diabetesatlas.org (accessed on 21 July 2023).
  3. Mutyambizi, C.; Pavlova, M.; Chola, L.; Hongoro, C.; Groot, W. Cost of Diabetes Mellitus in Africa: A Systematic Review of Existing Literature. Glob. Health 2018, 14, 3. [Google Scholar] [CrossRef]
  4. World Health Organization. Global Expenditure on Health: Public Spending on the Rise? Available online: https://www.who.int/publications-detail-redirect/9789240041219 (accessed on 20 July 2023).
  5. Matheus, A.S.D.M.; Tannus, L.R.M.; Cobas, R.A.; Palma, C.C.S.; Negrato, C.A.; Gomes, M.D.B. Impact of Diabetes on Cardiovascular Disease: An Update. Int. J. Hypertens. 2013, 2013, 653789. [Google Scholar] [CrossRef] [PubMed]
  6. Yen, F.S.; Wei, J.C.C.; Chiu, L.T.; Hsu, C.C.; Hwu, C.M. Diabetes, Hypertension, and Cardiovascular Disease Development. J. Transl. Med. 2022, 20, 9. [Google Scholar] [CrossRef]
  7. Rohm, T.V.; Meier, D.T.; Olefsky, J.M.; Donath, M.Y. Inflammation in Obesity, Diabetes, and Related Disorders. Immunity 2022, 55, 31–55. [Google Scholar] [CrossRef]
  8. Sowers, J.R.; Epstein, M.; Frohlich, E.D. Diabetes, Hypertension, and Cardiovascular Disease: An Update Hypertension in the Diabetic Patient. Hypertension 2001, 37, 1053–1059. [Google Scholar] [CrossRef]
  9. Meza, C.A.; La Favor, J.D.; Kim, D.H.; Hickner, R.C. Endothelial Dysfunction: Is There a Hyperglycemia-Induced Imbalance of NOX and NOS? Int. J. Mol. Sci. 2019, 20, 3775. [Google Scholar] [CrossRef]
  10. Funk, S.D.; Yurdagul, A.; Orr, A.W. Hyperglycemia and Endothelial Dysfunction in Atherosclerosis: Lessons from Type 1 Diabetes. Int. J. Vasc. Med. 2012, 2012, 569654. [Google Scholar] [CrossRef]
  11. Castellon, X.; Bogdanova, V. Chronic Inflammatory Diseases and Endothelial Dysfunction. Aging Dis. 2016, 7, 81–89. [Google Scholar] [CrossRef]
  12. Ghosal, S. The Side Effects of Metformin—A Review. Diabetes Metab. Disord. 2019, 6, 1–7. [Google Scholar] [CrossRef]
  13. Shurrab, N.T.; Arafa, E.-S.A. Metformin: A Review of Its Therapeutic Efficacy and Adverse Effects. Obes. Med. 2020, 17, 100186. [Google Scholar] [CrossRef]
  14. Infante, M.; Leoni, M.; Caprio, M.; Fabbri, A. Long-Term Metformin Therapy and Vitamin B12 Deficiency: An Association to Bear in Mind. World J. Diabetes 2021, 12, 916–931. [Google Scholar] [CrossRef] [PubMed]
  15. Kanwugu, O.N.; Glukhareva, T.V.; Danilova, I.G.; Kovaleva, E.G. Natural Antioxidants in Diabetes Treatment and Management: Prospects of Astaxanthin. Crit. Rev. Food Sci. Nutr. 2021, 62, 5005–5028. [Google Scholar] [CrossRef] [PubMed]
  16. Mokgalaboni, K.; Ntamo, Y.; Ziqubu, K.; Nyambuya, T.M.; Nkambule, B.B.; Mazibuko-Mbeje, S.E.; Gabuza, K.B.; Chellan, N.; Tiano, L.; Dludla, P.V. Curcumin Supplementation Improves Biomarkers of Oxidative Stress and Inflammation in Conditions of Obesity, Type 2 Diabetes and NAFLD: Updating the Status of Clinical Evidence. Food Funct. 2021, 12, 12235–12249. [Google Scholar] [CrossRef]
  17. Mokgalaboni, K.; Lebelo, L.S.; Modjadji, P.; Ghaffary, S. Okra Ameliorates Hyperglycaemia in Pre-Diabetic and Type 2 Diabetic Patients: A Systematic Review and Meta-Analysis of the Clinical Evidence. Front. Pharmacol. 2023, 14, 1132650. [Google Scholar] [CrossRef]
  18. Matough, F.A.; Budin, S.B.; Hamid, Z.A.; Alwahaibi, N.; Mohamed, J. The Role of Oxidative Stress and Antioxidants in Diabetic Complications. SQU Med. J. 2012, 12, 5–18. [Google Scholar]
  19. Mokgalaboni, K.; Nkambule, B.B.; Ntamo, Y.; Ziqubu, K.; Nyambuya, T.M.; Mazibuko-Mbeje, S.E.; Gabuza, K.B.; Chellan, N.; Cirilli, I.; Tiano, L.; et al. Vitamin K: A Vital Micronutrient with the Cardioprotective Potential against Diabetes-Associated Complications. Life Sci. 2021, 286, 120068. [Google Scholar] [CrossRef]
  20. Ross, A.C.; Institute of Medicine (U.S.). Committee to Review Dietary Reference Intakes for Vitamin D and Calcium. In DRI, Dietary Reference Intakes: Calcium, Vitamin D; National Academies Press: Washington, DC, USA, 2011; ISBN 978-0-30916-394-1. [Google Scholar]
  21. National Institute of Health; Office of Dietary Supplements. Vitamin D Fact Sheet for Consumer. Available online: https://ods.od.nih.gov/factsheets/VitaminD-HealthProfessional/ (accessed on 21 July 2023).
  22. Riis, J.L.; Johansen, C.; Gesser, B.; Møller, K.; Larsen, C.G.; Kragballe, K.; Iversen, L. 1α,25(OH)2D3 Regulates NF-ΚB DNA Binding Activity in Cultured Normal Human Keratinocytes through an Increase in IκBα Expression. Arch. Dermatol. Res. 2004, 296, 195–202. [Google Scholar] [CrossRef]
  23. Mousa, A.; Naderpoor, N.; Johnson, J.; Sourris, K.; de Courten, M.P.J.; Wilson, K.; Scragg, R.; Plebanski, M.; de Courten, B. Effect of Vitamin D Supplementation on Inflammation and Nuclear Factor Kappa-B Activity in Overweight/Obese Adults: A Randomized Placebo-Controlled Trial. Sci. Rep. 2017, 7, 15154. [Google Scholar] [CrossRef]
  24. Harinarayan, C.V.; Arvind, S.; Joshi, S.; Thennarasu, K.; Vedavyas, V.; Baindur, A. Improvement in Pancreatic β-Cell Function with Vitamin d and Calcium Supplementation in Vitamin d-Deficient Nondiabetic Subjects. Endocr. Pract. 2014, 20, 129–138. [Google Scholar] [CrossRef]
  25. Liu, W.; Zhang, L.; Xu, H.J.; Li, Y.; Hu, C.M.; Yang, J.Y.; Sun, M.Y. The Anti-Inflammatory Effects of Vitamin D in Tumorigenesis. Int. J. Mol. Sci. 2018, 19, 2736. [Google Scholar] [CrossRef] [PubMed]
  26. Ponvilawan, B.; Charoenngam, N. Vitamin D and Uric Acid: Is Parathyroid Hormone the Missing Link? J. Clin. Transl. Endocrinol. 2021, 25, 100263. [Google Scholar] [CrossRef] [PubMed]
  27. Szymczak-Pajor, I.; Drzewoski, J.; Śliwińska, A. The Molecular Mechanisms by Which Vitamin d Prevents Insulin Resistance and Associated Disorders. Int. J. Mol. Sci. 2020, 21, 6644. [Google Scholar] [CrossRef] [PubMed]
  28. George, P.S.; Pearson, E.R.; Witham, M.D. Effect of Vitamin D Supplementation on Glycaemic Control and Insulin Resistance: A Systematic Review and Meta-Analysis. Diabet. Med. 2012, 29, e142–e150. [Google Scholar] [CrossRef]
  29. Nikooyeh, B.; Neyestani, T.R. Oxidative Stress, Type 2 Diabetes and Vitamin D: Past, Present and Future. Diabetes Metab. Res. Rev. 2016, 32, 260–267. [Google Scholar] [CrossRef]
  30. Mousa, A.; Naderpoor, N.; Teede, H.; Scragg, R.; de Courten, B. Vitamin D Supplementation for Improvement of Chronic Low-Grade Inflammation in Patients with Type 2 Diabetes: A Systematic Review and Meta-Analysis of Randomized Controlled Trials. Nutr. Rev. 2018, 76, 380–394. [Google Scholar] [CrossRef]
  31. Yu, Y.; Tian, L.; Xiao, Y.; Huang, G.; Zhang, M. Effect of Vitamin D Supplementation on Some Inflammatory Biomarkers in Type 2 Diabetes Mellitus Subjects: A Systematic Review and Meta-Analysis of Randomized Controlled Trials. Ann. Nutr. Metab. 2018, 73, 62–73. [Google Scholar] [CrossRef]
  32. Jafari, T.; Fallah, A.A.; Barani, A. Effects of Vitamin D on Serum Lipid Profile in Patients with Type 2 Diabetes: A Meta-Analysis of Randomized Controlled Trials. Clin. Nutr. 2016, 35, 1259–1268. [Google Scholar] [CrossRef]
  33. Frandsen, T.F.; Bruun Nielsen, M.F.; Lindhardt, C.L.; Eriksen, M.B. Using the Full PICO Model as a Search Tool for Systematic Reviews Resulted in Lower Recall for Some PICO Elements. J. Clin. Epidemiol. 2020, 127, 69–75. [Google Scholar] [CrossRef]
  34. Page, M.J.; McKenzie, J.E.; Bossuyt, P.M.; Boutron, I.; Hoffmann, T.C.; Mulrow, C.D.; Shamseer, L.; Tetzlaff, J.M.; Akl, E.A.; Brennan, S.E.; et al. The PRISMA 2020 Statement: An Updated Guideline for Reporting Systematic Reviews. BMJ 2021, 372, n71. [Google Scholar] [CrossRef]
  35. MacGirlley, R.; Mokgalaboni, K. The Effect of Vitamin D on Inflammation and Dyslipidemia in Type 2 Diabetes Mellitus: Protocol for a Systematic Review and Meta-Analysis of Randomized Controlled Trials. JMIR Res. Protoc. 2023, 12, e42193. [Google Scholar] [CrossRef] [PubMed]
  36. Jadad, A.R.; Andrew Moore, R.; Carroll, D.; Jenkinson, C.; John Reynolds, D.M.; Gavaghan, D.J.; McQuay DM, H.J. Assessing the Quality of Reports of Randomized Clinical Trials: Is Blinding Necessary? Control. Clin. Trials 1996, 17, 1–12. [Google Scholar] [CrossRef] [PubMed]
  37. Luis Aguayo-Albasini, J.; Flores-Pastor, B.; Soria-Aledo, V. GRADE System: Classification of Quality of Evidence and Strength of Recommendation. Cir. Esp. 2014, 92, 82–88. [Google Scholar] [CrossRef]
  38. Sedgwick, P. Meta-Analyses: Heterogeneity and Subgroup Analysis. BMJ 2013, 346, f4040. [Google Scholar] [CrossRef]
  39. Doleman, B.; Freeman, S.C.; Lund, J.N.; Williams, J.P.; Sutton, A.J. Funnel Plots May Show Asymmetry in the Absence of Publication Bias with Continuous Outcomes Dependent on Baseline Risk: Presentation of a New Publication Bias Test. Res. Synth. Methods 2020, 11, 522–534. [Google Scholar] [CrossRef]
  40. Cochrane Handbook 6.1.3.2 Imputing Standard Deviations for Changes from Baseline. Available online: https://handbook-5-1.cochrane.org/chapter_16/16_1_3_2_imputing_standard_deviations_for_changes_from_baseline.htm (accessed on 28 July 2023).
  41. Yagiz, G.; Akaras, E.; Kubis, H.P.; Owen, J.A. The Effects of Resistance Training on Architecture and Volume of the Upper Extremity Muscles: A Systematic Review of Randomised Controlled Trials and Meta-Analyses. Appl. Sci. 2022, 12, 1593. [Google Scholar] [CrossRef]
  42. Deeks, J.J.; Higgins, J.P.T. Statistical Algorithms in Review Manager 5. Available online: https://training.cochrane.org/handbook/current/chapter-10-statistical-algorithms-revman-5-1 (accessed on 28 July 2023).
  43. Hozo, S.P.; Djulbegovic, B.; Hozo, I. Estimating the Mean and Variance from the Median, Range, and the Size of a Sample. BMC Med. Res. Methodol. 2005, 5, 1–10. [Google Scholar] [CrossRef]
  44. Wan, X.; Wang, W.; Liu, J.; Tong, T. Estimating the Sample Mean and Standard Deviation from the Sample Size, Median, Range and/or Interquartile Range. BMC Med. Res. Methodol. 2014, 14, 135. [Google Scholar] [CrossRef]
  45. Hassani, H.; Ghodsi, M.; Howell, G. A Note on Standard Deviation and Standard Error. Teach. Math. Appl. 2010, 29, 108–112. [Google Scholar] [CrossRef]
  46. Schroll, J.B.; Moustgaard, R.; Gøtzsche, P.C. Dealing with Substantial Heterogeneity in Cochrane Reviews. Cross-Sectional Study. BMC Med. Res. Methodol. 2011, 11, 22. [Google Scholar] [CrossRef]
  47. Sadiya, A.; Ahmed, S.M.; Carlsson, M.; Tesfa, Y.; George, M.; Ali, S.H.; Siddieg, H.H.; Abusnana, S. Vitamin D Supplementation in Obese Type 2 Diabetes Subjects in Ajman, UAE: A Randomized Controlled Double-Blinded Clinical Trial. Eur. J. Clin. Nutr. 2015, 69, 707–711. [Google Scholar] [CrossRef] [PubMed]
  48. Neyestani, T.R.; Nikooyeh, B.; Alavi-Majd, H.; Shariatzadeh, N.; Kalayi, A.; Tayebinejad, N.; Heravifard, S.; Salekzamani, S.; Zahedirad, M. Improvement of Vitamin D Status via Daily Intake of Fortified Yogurt Drink Either with or without Extra Calcium Ameliorates Systemic Inflammatory Biomarkers, Including Adipokines, in the Subjects with Type 2 Diabetes. J. Clin. Endocrinol. Metab. 2012, 97, 2005–2011. [Google Scholar] [CrossRef] [PubMed]
  49. Akbarzadeh, M.; Eftekhari, M.H.; Dabbaghmanesh, M.H.; Hasanzadeh, J.; Bakhshayeshkaram, M. Serum IL-18 and HsCRP Correlate with Insulin Resistance without Effect of Calcitriol Treatment on Type 2 Diabetes. Iran. J. Immunol. 2013, 10, 167–176. [Google Scholar]
  50. Tabesh, M.; Azadbakht, L.; Faghihimani, E.; Tabesh, M.; Esmaillzadeh, A. Effects of Calcium–Vitamin D Co-Supplementation on Metabolic Profiles in Vitamin D Insufficient People with Type 2 Diabetes: A Randomised Controlled Clinical Trial. Diabetologia 2014, 57, 2038–2047. [Google Scholar] [CrossRef]
  51. Fazelian, S.; Paknahad, Z.; Khajehali, L.; Kheiri, S.; Amani, R. The Effects of Supplementation with Vitamin D on Inflammatory Biomarkers, Omentin, and Vaspin in Women with Type 2 Diabetes: A Randomized Double-Blind Placebo-Controlled Clinical Trial. J. Food Biochem. 2018, 42, e12631. [Google Scholar] [CrossRef]
  52. Omidian, M.; Mahmoudi, M.; Abshirini, M.; Eshraghian, M.R.; Javanbakht, M.H.; Zarei, M.; Hasani, H.; Djalali, M. Effects of Vitamin D Supplementation on Depressive Symptoms in Type 2 Diabetes Mellitus Patients: Randomized Placebo-Controlled Double-Blind Clinical Trial. Diabetes Metab. Syndr. Clin. Res. Rev. 2019, 13, 2375–2380. [Google Scholar] [CrossRef] [PubMed]
  53. Omidian, M.; Mahmoudi, M.; Javanbakht, M.H.; Eshraghian, M.R.; Abshirini, M.; Daneshzad, E.; Hasani, H.; Alvandi, E.; Djalali, M. Effects of Vitamin D Supplementation on Circulatory YKL-40 and MCP-1 Biomarkers Associated with Vascular Diabetic Complications: A Randomized, Placebo-Controlled, Double-Blind Clinical Trial. Diabetes Metab. Syndr. Clin. Res. Rev. 2019, 13, 2873–2877. [Google Scholar] [CrossRef]
  54. Dadrass, A.; Mohamadzadeh Salamat, K.; Hamidi, K.; Azizbeigi, K. Anti-Inflammatory Effects of Vitamin D and Resistance Training in Men with Type 2 Diabetes Mellitus and Vitamin D Deficiency: A Randomized, Double-Blinded, Placebo-Controlled Clinical Trial. J. Diabetes Metab. Disord. 2019, 18, 323–331. [Google Scholar] [CrossRef]
  55. Mirzavandi, F.; Talenezhad, N.; Razmpoosh, E.; Nadjarzadeh, A.; Mozaffari-Khosravi, H. The Effect of Intramuscular Megadose of Vitamin D Injections on E-Selectin, CRP and Biochemical Parameters in Vitamin D-Deficient Patients with Type-2 Diabetes Mellitus: A Randomized Controlled Trial. Complement. Ther. Med. 2020, 49, 102346. [Google Scholar] [CrossRef]
  56. Imanparast, F.; Javaheri, J.; Kamankesh, F.; Rafiei, F.; Salehi, A.; Mollaaliakbari, Z.; Rezaei, F.; Rahimi, A.; Abbasi, E. The Effects of Chromium and Vitamin D3 Co-Supplementation on Insulin Resistance and Tumor Necrosis Factor-Alpha in Type 2 Diabetes: A Randomized Placebo-Controlled Trial. Appl. Physiol. Nutr. Metab. 2019, 45, 471–477. [Google Scholar] [CrossRef]
  57. Hoseini, R.; Rahim, H.A.; Ahmed, J.K. Decreased Inflammatory Gene Expression Accompanies the Improvement of Liver Enzyme and Lipid Profile Following Aerobic Training and Vitamin D Supplementation in T2DM Patients. BMC Endocr. Disord. 2022, 22, 245. [Google Scholar] [CrossRef] [PubMed]
  58. Limonte, C.P.; Zelnick, L.R.; Ruzinski, J.; Hoofnagle, A.N.; Thadhani, R.; Melamed, M.L.; Lee, I.M.; Buring, J.E.; Sesso, H.D.; Manson, J.A.E.; et al. Effects of Long-Term Vitamin D and n-3 Fatty Acid Supplementation on Inflammatory and Cardiac Biomarkers in Patients with Type 2 Diabetes: Secondary Analyses from a Randomised Controlled Trial. Diabetologia 2021, 64, 437–447. [Google Scholar] [CrossRef] [PubMed]
  59. Meng, H.; Matthan, N.R.; Angellotti, E.; Pittas, A.G.; Lichtenstein, A.H. Exploring the Effect of Vitamin D3 Supplementation on Surrogate Biomarkers of Cholesterol Absorption and Endogenous Synthesis in Patients with Type 2 Diabetes-Randomized Controlled Trial. Am. J. Clin. Nutr. 2020, 112, 538–547. [Google Scholar] [CrossRef] [PubMed]
  60. Angellotti, E.; D’Alessio, D.; Dawson-Hughes, B.; Chu, Y.; Nelson, J.; Hu, P.; Cohen, R.M.; Pittas, A.G. Effect of Vitamin D Supplementation on Cardiovascular Risk in Type 2 Diabetes. Clin. Nutr. 2019, 38, 2449–2453. [Google Scholar] [CrossRef]
  61. Witham, M.D.; Dove, F.J.; Dryburgh, M.; Sugden, J.A.; Morris, A.D.; Struthers, A.D. The Effect of Different Doses of Vitamin D3 on Markers of Vascular Health in Patients with Type 2 Diabetes: A Randomised Controlled Trial. Diabetologia 2010, 53, 2112–2119. [Google Scholar] [CrossRef]
  62. Punthakee, Z.; Bosch, J.; Dagenais, G.; Diaz, R.; Holman, R.; Probstfield, J.L.; Ramachandran, A.; Riddle, M.C.; Rydén, L.E.; Zinman, B.; et al. Design, History and Results of the Thiazolidinedione Intervention with Vitamin D Evaluation (TIDE) Randomised Controlled Trial. Diabetologia 2012, 55, 36–45. [Google Scholar] [CrossRef]
  63. Lemieux, P.; John Weisnagel, S.; Caron, A.Z.; Julien, A.S.; Morisset, A.S.; Carreau, A.M.; Poirier, J.; Tchernof, A.; Robitaille, J.; Bergeron, J.; et al. Effects of 6-Month Vitamin D Supplementation on Insulin Sensitivity and Secretion: A Randomised, Placebo-Controlled Trial. Eur. J. Endocrinol. 2019, 181, 287–299. [Google Scholar] [CrossRef]
  64. Barchetta, I.; Del Ben, M.; Angelico, F.; Di Martino, M.; Fraioli, A.; La Torre, G.; Saulle, R.; Perri, L.; Morini, S.; Tiberti, C.; et al. No Effects of Oral Vitamin D Supplementation on Non-Alcoholic Fatty Liver Disease in Patients with Type 2 Diabetes: A Randomized, Double-Blind, Placebo-Controlled Trial. BMC Med. 2016, 14, 92. [Google Scholar] [CrossRef]
  65. Barale, M.; Rossetto Giaccherino, R.; Ghigo, E.; Procopio, M. Effect of 1-Year Oral Cholecalciferol on a Metabolic Profile and Blood Pressure in Poor-Controlled Type 2 Diabetes Mellitus: An Open-Label Randomized Controlled Pilot Study. J. Endocrinol. Investig. 2021, 44, 791–802. [Google Scholar] [CrossRef]
  66. Maggi, S.; Siviero, P.; Brocco, E.; Albertin, M.; Romanato, G.; Crepaldi, G. Vitamin D Deficiency, Serum Leptin and Osteoprotegerin Levels in Older Diabetic Patients: An Input to New Research Avenues. Acta Diabetol. 2014, 51, 461–469. [Google Scholar] [CrossRef]
  67. Gagnon, C.; Daly, R.M.; Carpentier, A.; Lu, Z.X.; Shore-Lorenti, C.; Sikaris, K.; Jean, S.; Ebeling, P.R. Effects of Combined Calcium and Vitamin D Supplementation on Insulin Secretion, Insulin Sensitivity and β-Cell Function in Multi-Ethnic Vitamin D-Deficient Adults at Risk for Type 2 Diabetes: A Pilot Randomized, Placebo-Controlled Trial. PLoS ONE 2014, 9, e109607. [Google Scholar] [CrossRef] [PubMed]
  68. Hu, Z.; Zhi, X.; Li, J.; Li, B.; Wang, J.; Zhu, J.; Zhang, Z. Effects of Long-Term Vitamin D Supplementation on Metabolic Profile in Middle-Aged and Elderly Patients with Type 2 Diabetes. J. Steroid Biochem. Mol. Biol. 2022, 225, 106198. [Google Scholar] [CrossRef] [PubMed]
  69. Kampmann, U.; Mosekilde, L.; Juhl, C.; Moller, N.; Christensen, B.; Rejnmark, L.; Wamberg, L.; Orskov, L. Effects of 12 Weeks High Dose Vitamin D3 Treatment on Insulin Sensitivity, Beta Cell Function, and Metabolic Markers in Patients with Type 2 Diabetes and Vitamin D Insufficiency—A Double-Blind, Randomized, Placebo-Controlled Trial. Metabolism 2014, 63, 1115–1124. [Google Scholar] [CrossRef] [PubMed]
  70. Upreti, V.; Maitri, V.; Dhull, P.; Handa, A.; Prakash, M.S.; Behl, A. Effect of Oral Vitamin D Supplementation on Glycemic Control in Patients with Type 2 Diabetes Mellitus with Coexisting Hypovitaminosis D: A Parellel Group Placebo Controlled Randomized Controlled Pilot Study. Diabetes Metab. Syndr. Clin. Res. Rev. 2018, 12, 509–512. [Google Scholar] [CrossRef] [PubMed]
  71. Breslavsky, A.; Frand, J.; Matas, Z.; Boaz, M.; Barnea, Z.; Shargorodsky, M. Effect of High Doses of Vitamin D on Arterial Properties, Adiponectin, Leptin and Glucose Homeostasis in Type 2 Diabetic Patients. Clin. Nutr. 2013, 32, 970–975. [Google Scholar] [CrossRef] [PubMed]
  72. Ryu, O.H.; Chung, W.; Lee, S.; Hong, K.S.; Choi, M.G.; Yoo, H.J. The Effect of High-Dose Vitamin D Supplementation on Insulin Resistance and Arterial Stiffness in Patients with Type 2 Diabetes. Korean J. Intern. Med. 2014, 29, 620–629. [Google Scholar] [CrossRef] [PubMed]
  73. Muñoz-Aguirre, P.; Flores, M.; Macias, N.; Quezada, A.D.; Denova-Gutiérrez, E.; Salmerón, J. The Effect of Vitamin D Supplementation on Serum Lipids in Postmenopausal Women with Diabetes: A Randomized Controlled Trial. Clin. Nutr. 2015, 34, 799–804. [Google Scholar] [CrossRef]
  74. Dalan, R.; Liew, H.; Assam, P.N.; Chan, E.S.Y.; Siddiqui, F.J.; Tan, A.W.K.; Chew, D.E.K.; Boehm, B.O.; Leow, M.K.S. A Randomised Controlled Trial Evaluating the Impact of Targeted Vitamin D Supplementation on Endothelial Function in Type 2 Diabetes Mellitus: The DIMENSION Trial. Diab Vasc. Dis. Res. 2016, 13, 192–200. [Google Scholar] [CrossRef]
  75. Jehle, S.; Lardi, A.; Felix, B.; Hulter, H.N.; Stettler, C.; Krapf, R. Effect of Large Doses of Parenteral Vitamin D on Glycaemic Control and Calcium/Phosphate Metabolism in Patients with Stable Type 2 Diabetes Mellitus: A Randomised, Placebo-Controlled, Prospective Pilot Study. Swiss Med. Wkly. 2014, 144, w13942. [Google Scholar] [CrossRef]
  76. El Hajj, C.; Walrand, S.; Helou, M.; Yammine, K. Effect of Vitamin D Supplementation on Inflammatory Markers in Non-Obese Lebanese Patients with Type 2 Diabetes: A Randomized Controlled Trial. Nutrients 2020, 12, 2033. [Google Scholar] [CrossRef]
  77. Wenclewska, S.; Szymczak-Pajor, I.; Drzewoski, J.; Bunk, M.; Śliwińska, A. Vitamin d Supplementation Reduces Both Oxidative Dna Damage and Insulin Resistance in the Elderly with Metabolic Disorders. Int. J. Mol. Sci. 2019, 20, 2891. [Google Scholar] [CrossRef] [PubMed]
  78. Hoseini, R.; Damirchi, A.; Babaei, P. Vitamin D Increases PPARγ Expression and Promotes Beneficial Effects of Physical Activity in Metabolic Syndrome. Nutrition 2017, 36, 54–59. [Google Scholar] [CrossRef] [PubMed]
  79. Gu, J.C.; Wu, Y.G.; Huang, W.G.; Fan, X.J.; Chen, X.H.; Zhou, B.; Lin, Z.J.; Feng, X.L. Effect of Vitamin D on Oxidative Stress and Serum Inflammatory Factors in the Patients with Type 2 Diabetes. J. Clin. Lab. Anal. 2022, 36, e24430. [Google Scholar] [CrossRef] [PubMed]
  80. Calton, E.K.; Keane, K.N.; Newsholme, P.; Soares, M.J. The Impact of Vitamin D Levels on Inflammatory Status: A Systematic Review of Immune Cell Studies. PLoS ONE 2015, 10, e0141770. [Google Scholar] [CrossRef]
  81. Jorde, R.; Grimnes, G. Increased Calcium Intake Is Associated Lower Serum 25-Hydroxyvitamin D Levels in Subjects with Adequate Vitamin D Intake: A Population-Based Observational Study. BMC Nutr. 2020, 6, 49. [Google Scholar] [CrossRef]
  82. Mazidi, M.; Rezaie, P.; Vatanparast, H. Impact of Vitamin D Supplementation on C-Reactive Protein; A Systematic Review and Meta-Analysis of Randomized Controlled Trials. BMC Nutr. 2018, 4, 1. [Google Scholar] [CrossRef]
  83. Caetano, D.G.; Ribeiro-Alves, M.; Hottz, E.D.; Vilela, L.M.; Cardoso, S.W.; Hoagland, B.; Grinsztejn, B.; Veloso, V.G.; Morgado, M.G.; Bozza, P.T.; et al. Increased Biomarkers of Cardiovascular Risk in HIV-1 Viremic Controllers and Low Persistent Inflammation in Elite Controllers and Art-Suppressed Individuals. Sci. Rep. 2022, 12, 6569. [Google Scholar] [CrossRef]
  84. Gao, B.; Tsukamoto, H. Inflammation in Alcoholic and Non-alcoholic Fatty Liver Disease: Friend or Foe? Gastroenterology 2016, 150, 1704–1709. [Google Scholar] [CrossRef]
  85. Chen, N.; Wan, Z.; Han, S.F.; Li, B.Y.; Zhang, Z.L.; Qin, L.Q. Effect of Vitamin D Supplementation on the Level of Circulating High-Sensitivity C-Reactive Protein: A Meta-Analysis of Randomized Controlled Trials. Nutrients 2014, 6, 2206–2216. [Google Scholar] [CrossRef]
  86. Agbalalah, T.; Hughes, S.F.; Freeborn, E.J.; Mushtaq, S. Impact of Vitamin D Supplementation on Endothelial and Inflammatory Markers in Adults: A Systematic Review. J. Steroid Biochem. Mol. Biol. 2017, 173, 292–300. [Google Scholar] [CrossRef]
  87. Stenvinkel, P.; Chertow, G.M.; Devarajan, P.; Levin, A.; Andreoli, S.P.; Bangalore, S.; Warady, B.A. Chronic Inflammation in Chronic Kidney Disease Progression: Role of Nrf2. Kidney Int. Rep. 2021, 6, 1775–1787. [Google Scholar] [CrossRef]
  88. Wöbke, T.K.; Sorg, B.L.; Steinhilber, D. Vitamin D in Inflammatory Diseases. Front. Physiol. 2014, 7, 69–87. [Google Scholar] [CrossRef] [PubMed]
  89. Zhang, Y.; Leung, D.Y.M.; Richers, B.N.; Liu, Y.; Remigio, L.K.; Riches, D.W.; Goleva, E. Vitamin D Inhibits Monocyte/Macrophage Pro-inflammatory Cytokine Production by Targeting MAPK Phosphatase-1. J. Immunol. 2012, 188, 2127–2135. [Google Scholar] [CrossRef] [PubMed]
  90. Lahore, G.F.; Raposo, B.; Lagerquist, M.; Ohlsson, C.; Sabatier, P.; Xu, B.; Aoun, M.; James, J.; Cai, X.; Zubarev, R.M.; et al. Vitamin D3 Receptor Polymorphisms Regulate T Cells and T Cell-Dependent Inflammatory Diseases. Proc. Natl. Acad. Sci USA 2020, 117, 24986–24997. [Google Scholar] [CrossRef] [PubMed]
  91. Kongsbak, M.; Levring, T.B.; Geisler, C.; von Essen, M.R. The Vitamin D Receptor and T Cell Function. Front. Immunol. 2013, 4, 148. [Google Scholar] [CrossRef] [PubMed]
  92. Riek, A.E.; Oh, J.; Darwech, I.; Worthy, V.; Lin, X.; Ostlund, R.E.; Zhang, R.M.; Bernal-Mizrachi, C. Vitamin D 3 Supplementation Decreases a Unique Circulating Monocyte Cholesterol Pool in Patients with Type 2 Diabetes. J. Steroid Biochem. Mol. Biol. 2018, 177, 187–192. [Google Scholar] [CrossRef]
  93. Yiu, Y.F.; Yiu, K.H.; Siu, C.W.; Chan, Y.H.; Li, S.W.; Wong, L.Y.; Lee, S.W.L.; Tam, S.; Wong, E.W.K.; Lau, C.P.; et al. Randomized Controlled Trial of Vitamin D Supplement on Endothelial Function in Patients with Type 2 Diabetes. Atherosclerosis 2013, 227, 140–146. [Google Scholar] [CrossRef]
  94. Qi, K.J.; Zhao, Z.T.; Zhang, W.; Yang, F. The Impacts of Vitamin D Supplementation in Adults with Metabolic Syndrome: A Systematic Review and Meta-Analysis of Randomized Controlled Trials. Front. Pharmacol. 2022, 13, 1033026. [Google Scholar] [CrossRef]
  95. Li, S.; He, Y.; Lin, S.; Hao, L.; Ye, Y.; Lv, L.; Sun, Z.; Fan, H.; Shi, Z.; Li, J.; et al. Increase of Circulating Cholesterol in Vitamin D Deficiency Is Linked to Reduced Vitamin D Receptor Activity via the Insig-2/SREBP-2 Pathway. Mol. Nutr. Food Res. 2016, 60, 798–809. [Google Scholar] [CrossRef]
  96. Wang, X.X.; Jiang, T.; Shen, Y.; Santamaria, H.; Solis, N.; Arbeeny, C.; Levi, M.; Levi, M. Vitamin D Receptor Agonist Doxercalciferol Modulates Dietary Fat-Induced Renal Disease and Renal Lipid Metabolism. Am. J. Physiol. Ren. Physiol. 2011, 300, 801–810. [Google Scholar] [CrossRef]
  97. Asano, L.; Watanabe, M.; Ryoden, Y.; Usuda, K.; Yamaguchi, T.; Khambu, B.; Takashima, M.; Sato, S.-i.; Sakai, J.; Nagasawa, K.; et al. Vitamin D Metabolite, 25-Hydroxyvitamin D, Regulates Lipid Metabolism by Inducing Degradation of SREBP/SCAP. Cell Chem. Biol. 2017, 24, 207–217. [Google Scholar] [CrossRef] [PubMed]
  98. Larrick, B.M.; Kim, K.H.; Donkin, S.S.; Teegarden, D. 1,25-Dihydroxyvitamin D Regulates Lipid Metabolism and Glucose Utilization in Differentiated 3T3-L1 Adipocytes. Nutr. Res. 2018, 58, 72–83. [Google Scholar] [CrossRef] [PubMed]
Figure 1. Preferred Reporting Items for Systematic Review and Meta-Analysis (PRISMA) flow diagram illustrates the trial selection procedure.
Nutrients 15 04575 g001
Figure 2. Effect of vitamin D on pro-inflammatory markers, (A) high sensitivity-C-reactive protein, (B) Interleukin-6, (C) Tumor necrosis factor-α in T2D patients compared to matched-placebo. Std: standard mean difference, CI: confidence intervals. Data are reported as standard mean difference and 95% confidence intervals with a p-value set at <0.05. Akbarzadeh et al., 2013 [49]; Breslavsky et al., 2013 [71]; Dalan et al., 2016 [74]; Daldras et al., 2019 [54]; Fazelian et al., 2018 [51]; Gagnon et al., 2014 [67]; Hajj et al., 2020 [76]; Hoseini et al., 2022 [57]; Hu et al., 2022 [68]; Jehle et al., 2014 [75]; Limonte et al., 2021 [58]; Ryu et al., 2014 [72]; Neyestani et al., 2008 [48]; Omidian et al., 2019 (b) [53]; Maggi et al., 2014 [66]; Imanparast et al., 2020 [56].
Nutrients 15 04575 g002
Figure 3. Effect of vitamin D on lipid profile, (A) triglycerides, (B) total cholesterol in type 2 diabetes. Std: standard mean difference, CI: confidence intervals. Data are reported as standard mean difference and 95% confidence intervals with a p-value set at p < 0.05. Angellotti et al., 2018 [60]; Barale et al., 2020 [65]; Barchetta et al., 2016 [64]; Breslavsky et al., 2013 [71]; Dadras et al., 2019 [54]; Dalan et al., 2016 [74]; Gagnon et al., 2014 [67]; Hajj et al., 2020 [76]; Hoseini et al., 2022 [57]; Hu et al., 2022 [68]; Imanparast et al., 2020 [56]; Kampmann et al., 2014 [69]; Mirzavandi et al., 2020 [55]; Muñoz-Aguirre et al., 2014 [73]; Omidian et al., 2019 (a) [52]; Punthakee et al., 2012 [62]; Ryu et al., 2014 [72]; Sadiya et al., 2015 [47]; Tabesh et al., 2014 [50]; Upreti et al., 2018 [70]; Wenclewska et al., 2019 [77]; Withan et al., 2010 [61].
Nutrients 15 04575 g003aNutrients 15 04575 g003b
Figure 4. Effect of vitamin D on lipid profiles, (A) high-density lipoprotein (HDL), (B) low-density lipoprotein (LDL). Std: standard mean difference, CI: confidence intervals. Data are reported as standard mean difference and 95% confidence intervals with p set at p < 0.05. Angellotti et al., 2018 [60]; Barale et al., 2020 [65]; Barchetta et al., 2016 [64]; Breslavsky et al., 2013 [71]; Dadrass et al., 2019 [54]; Dalan et al., 2016 [74]; Gagnon et al., 2014 [67]; Hajj et al., 2020 [76]; Hoseini et al., 2022 [57]; Imanparast et al., 2020 [56]; Kampmann et al., 2014 [69]; Meng et al., 2020 [59]; Mirzavandi et al., 2020 [55]; Muñoz-Aguirre et al., 2014 [73]; Omidian et al., 2019 (a) [52]; Punthakee et al., 2012 [62]; Ryu et al., 2014 [72]; Sadiya et al., 2015 [47]; Tabesh et al., 2014 [50]; Upreti et al., 2018 [70]; Wenclewska et al., 2019 [77].
Nutrients 15 04575 g004
Disclaimer/Publisher’s Note: The statements, opinions and data contained in all publications are solely those of the individual author(s) and contributor(s) and not of MDPI and/or the editor(s). MDPI and/or the editor(s) disclaim responsibility for any injury to people or property resulting from any ideas, methods, instructions or products referred to in the content.

