1. Introduction
The current Dietary Guidelines for Americans (DGAs) report [
1] indicates that the inadequate intake of nutrient-dense foods has resulted in the under-consumption of some nutrients. Consumers can come closer to meeting nutrient recommendations by shifting their eating patterns to include more vegetables, fruits, whole grains, nuts and seeds, and dairy. Shifting to more plant-based diet patterns in particular may provide health benefits.
Walnuts are high in fiber, potassium, calcium, magnesium, folate, vitamin E, phytosterols, polyphenols, and polyunsaturated fatty acids (PUFAs) [
2], especially alpha-Linolenic acid (ALA) and linoleic acid (LA) [
3]. Replacing some animal protein in one’s diet with walnuts, a plant protein, could increase the intake of several under-consumed nutrients and PUFAs while decreasing saturated fat intake, thus providing health benefits. Observational studies and randomized controlled trials support the association between walnut consumption and cardiovascular health [
4,
5,
6,
7,
8]. Other observational studies have reported reduced incidences of diabetes with walnut consumption [
9,
10]. The consumption of walnuts may also benefit cognitive function as several components of walnuts have antioxidant and anti-inflammatory effects that may play an important role in oxidative stress and neuroinflammation [
11,
12].
The current study modeled the effects of a dose-escalated replacement of meat with walnuts in the usual US dietary intake pattern (0.5, 1, 1.5, and 2 oz walnuts per day replaced 1, 2, 3, and 4 oz meat because 0.5 oz nuts and 1 oz meat are considered as 1 oz equivalent [eq.] from the USDA Protein Foods Group). The researchers hypothesized that the partial replacement of meat with walnuts would improve diet quality and the intake of fiber, omega-3 PUFA, potassium, calcium, magnesium, folate, and vitamin E, and would reduce saturated fat, cholesterol, and sodium intake. This partial replacement of meat with walnuts in a dose–escalation manner was expected to lead to a favorable shift in nutrient intake to better align with dietary recommendations and increase the percentage of individuals who meet nutrient recommendations among each age–sex-stratified subpopulation. The researchers further hypothesized that replacing some meat with walnuts could improve the intake of nutrients being consumed below the recommended levels while not significantly impacting the ability to meet the recommendation for iron and vitamin B12 intake.
2. Materials and Methods
2.1. The Study Population
The National Health and Nutrition Examination Survey (NHANES) is a nationally representative, cross-sectional survey of the US population. NHANES data are collected by the National Center for Health Statistics (NCHSs) of the Centers for Disease Control and Prevention. Written informed consent was obtained from the participants or their proxies, and the survey protocol was approved by the Research Ethics Review Board at the NCHS. Dietary data were obtained from NHANES cycles: 2015–2016 and 2017–2018.
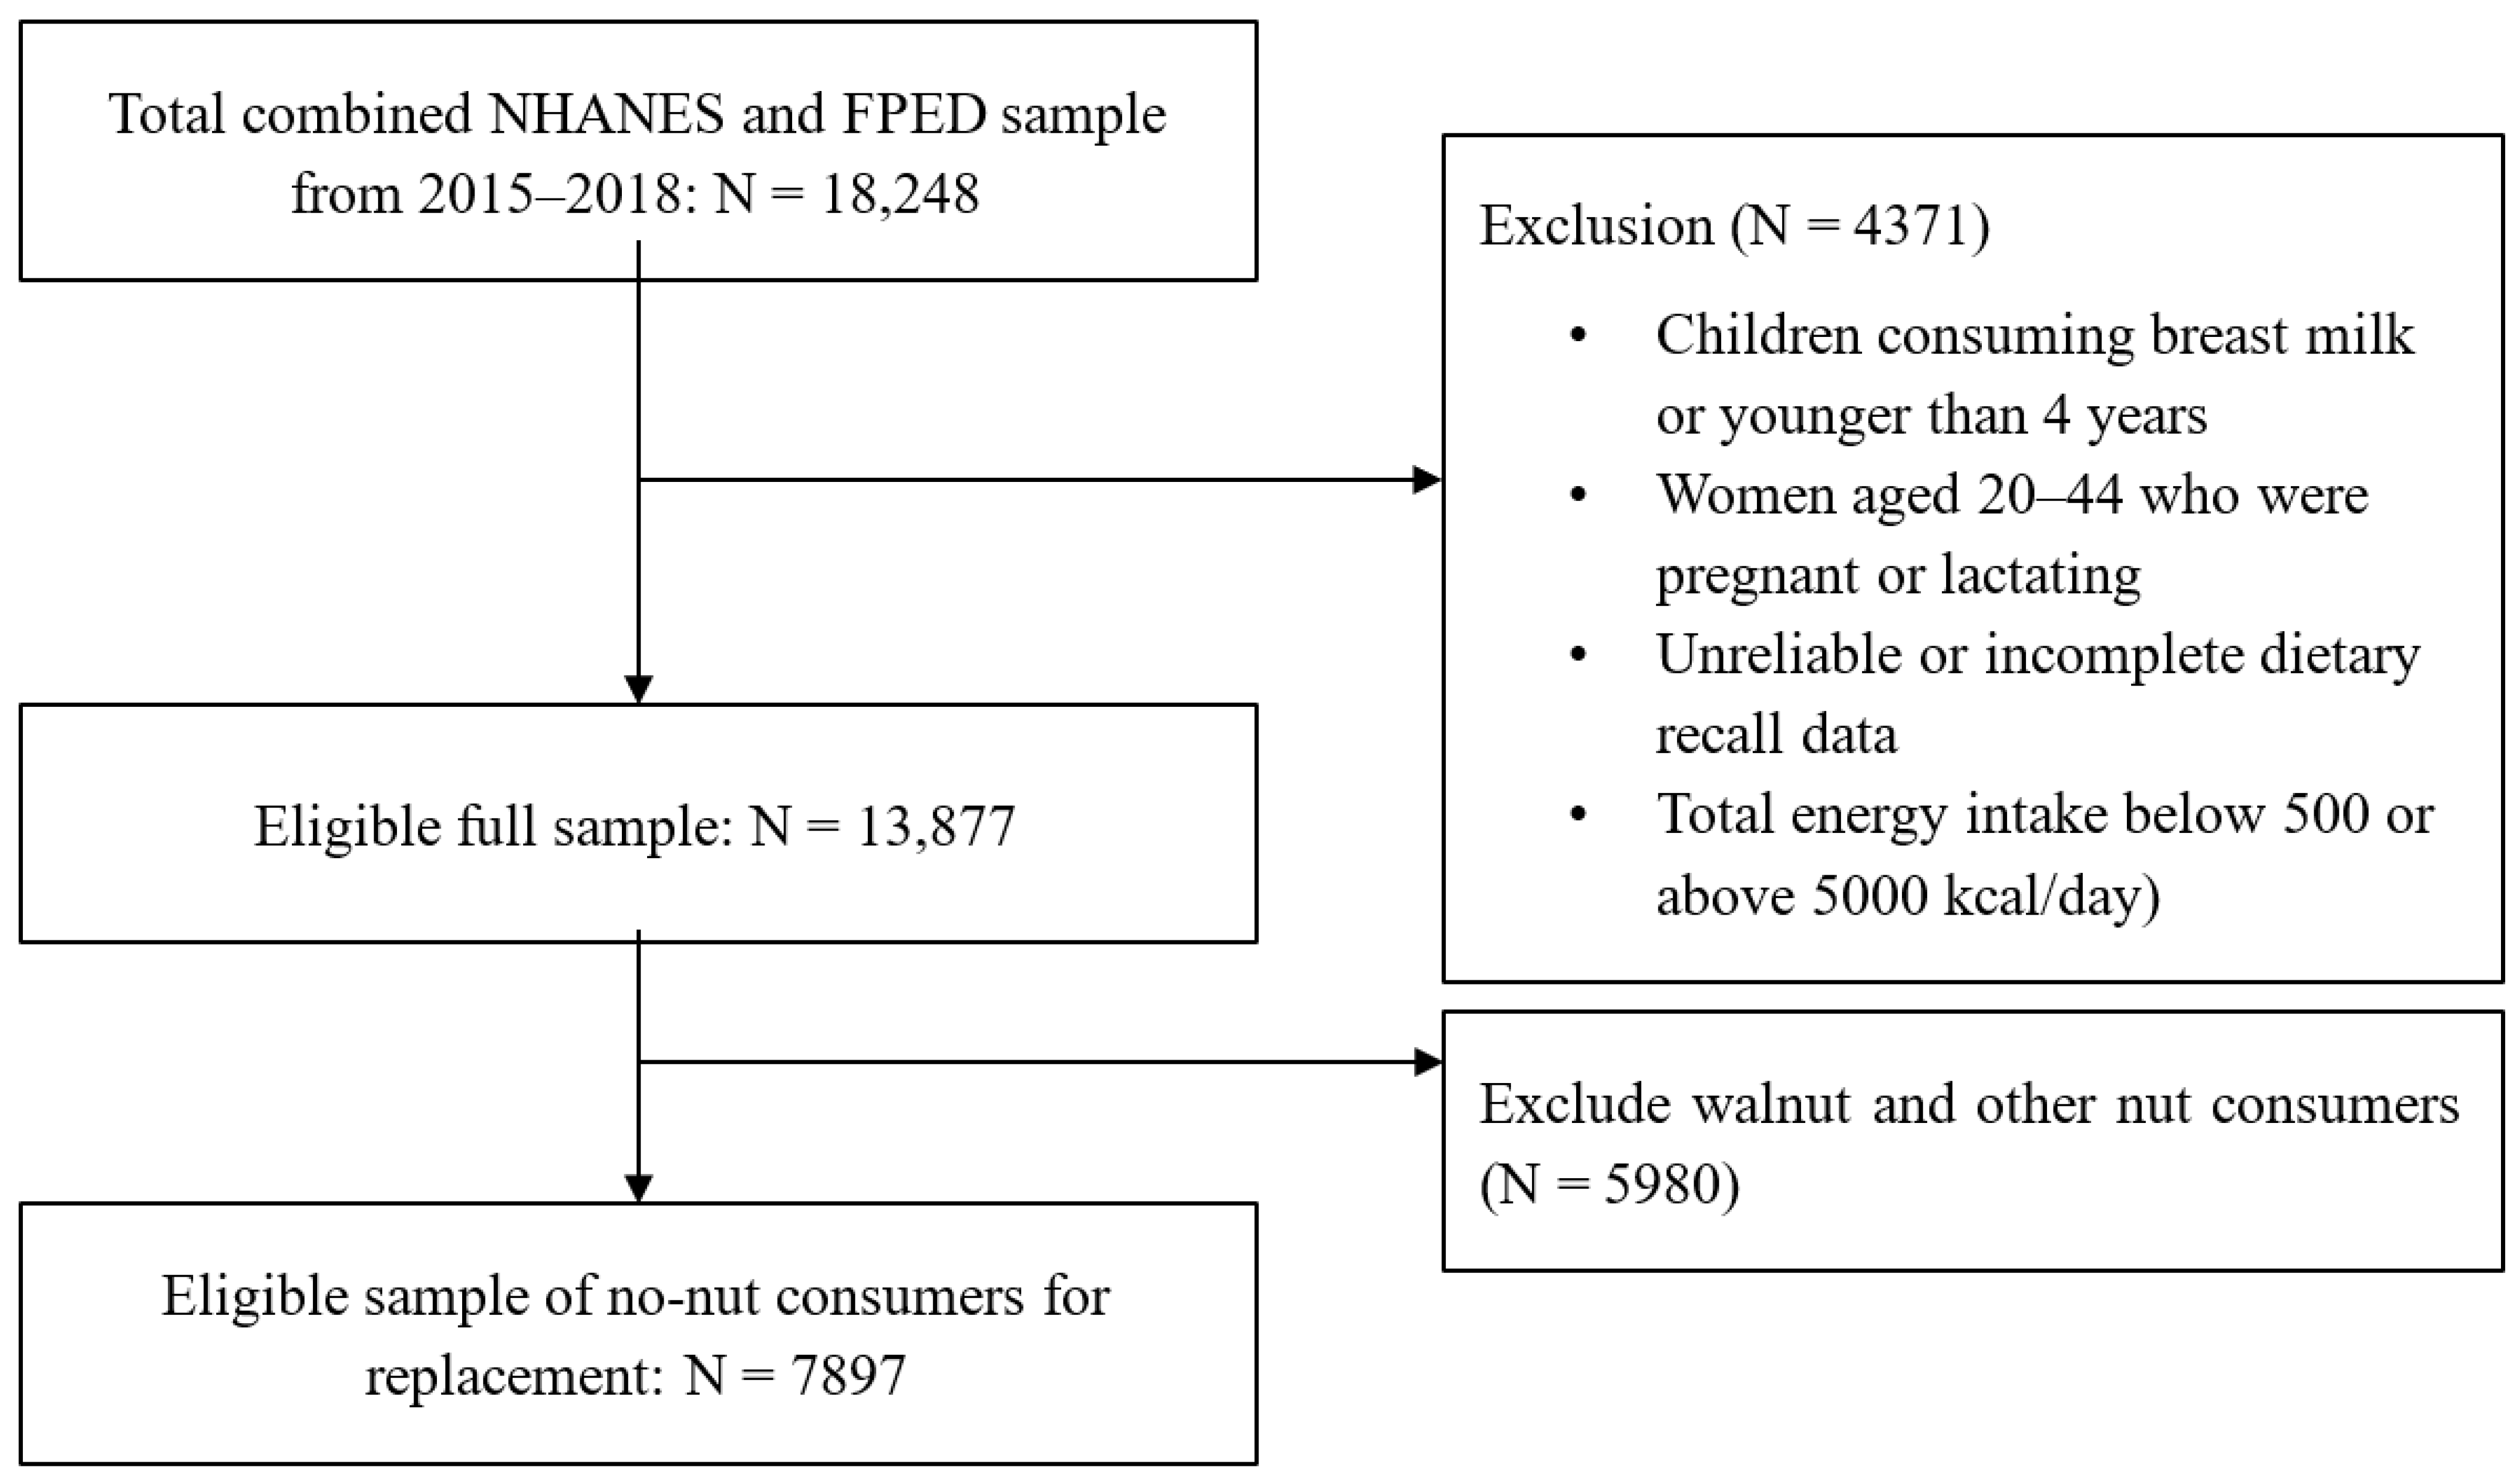
Figure 1 illustrates this study’s population selection process. Children consuming breast milk or those younger than 4 years, women aged 20–44 years who were pregnant or lactating, respondents with unreliable food recall data, individuals reporting below 500 or above >5000 kcal/d [
13], and respondents with missing information on animal protein intake (meats, cured meat, organ meat, poultry, seafood, or eggs) in the Food Patterns Equivalent Database (FPED) were excluded from our study. Prior studies indicated that tree nut consumers report better dietary quality and improved nutrient intake than no-nut consumers [
14,
15]. Therefore, we focused on no-nut consumers, excluding nut consumers from the analyses. The sample of no-nut consumers included 2707 children and adolescents (aged 4–18 years) and 5190 adults (19 years and older), as presented in
Table 1. We divided the sample into age–gender groups; boys 4–8 years, 9–13 years, 14–18 years; girls 4–8 years, 9–13 years, 14–18 years; men 19–50 years, 51–70 years; women 19–50 years, 51–70 years; adults 71+ years.
2.2. Dietary Intake Measures
What We Eat in America (WWEIA) is the dietary intake interview component of the NHANES. We examined data from two non-consecutive 24 h dietary recalls, of which the first recall was completed in person at the mobile examination center with a trained interviewer, and the second was completed over the phone 3–10 days later. Detailed descriptions of the interview methods can be found in the NHANES Dietary Interviews Procedure Manual [
16]. The present study included only the dietary recall data considered complete and reliable by the United States Department of Agriculture (USDA) Food Surveys Research Group. In our study sample of no-nut consumers, 79% completed both dietary recalls.
2.3. Food Composition Data
We obtained nutrient data from the Food and Nutrient Database for Dietary Studies (FNDDSs) and data on food consumption by food groups, such as protein foods, from the FPED. Both the FNDDSs and the FPED were mapped to the specific cycles of the NHANES data: e.g., the 2015–2016 NHANES data were analyzed with the FNDDSs 2015–2016 [
17] and the FPED 2015–2016 [
18], and likewise for 2017–2018 [
19,
20].
2.4. Walnut Consumption Classification
We used the FNDDSs ingredient list to identify food items that contained walnuts (ingredient codes 12155 “Nuts, walnuts, English” and 12154 “Nuts, walnuts, black, dried”) and identified NHANES respondents who consumed walnuts using the food codes for those items. Using the FPED, we identified other nut consumers who reported non-zero amounts for the component “Nuts and Seeds (Peanuts, tree nuts, and seeds (ounce equivalent); excludes coconut)” and were not already counted as walnut consumers. All remaining respondents were considered no-nut consumers.
Table 1 provides the demographics of the no-nut consumers included in the modeling study.
2.5. Modeling
We modeled the nutritional outcomes of partial meat replacement with walnuts using a dose–escalation approach. According to the FPED documentation, the Protein Foods Groups consider 1 oz meat and 0.5 oz nuts to be 1 oz eqs. (p. 49, [
20]). Therefore, we modeled the replacement of 1, 2, 3, and 4 oz meat with 0.5, 1, 1.5, and 2 oz walnuts. Meat is defined as the sum of the oz eqs. of the FPED categories of meat (beef, veal, pork, lamb, and game meat), cured meat (frankfurters, sausages, corned beef, cured ham, and luncheon meat that are made from beef, pork, or poultry), and organ meat (from beef, veal, pork, lamb, game, and poultry). The primary outcome measures were changes in the intake of potassium, dietary fiber, and magnesium—nutrients of public health concern identified by the current DGA—and iron, vitamin B12, saturated fat, and cholesterol, of which meat is a significant source [
21].
According to the USDA, 1 oz of walnuts contains 185 kcal, 4.32 g protein, 1.74 g saturated fat, 2.57 g omega-3 PUFA (ALA), 10.8 g omega-6 PUFA (Linoleic acid), 27.8 mg calcium, 0.825 mg iron, 44.8 mg magnesium, 125 mg potassium 0.451 mg copper, 0.876 mg zinc, 27.8 µg dietary folate equivalents (DFEs) folate, 0.198 mg vitamin E, and 1.9 g fiber [
22]. One ounce of meat (includes meat, cured meat, and organ meat but excludes poultry) contains 49 kcal, 7.1 g protein, 0.76 g saturated fat, 20 mg cholesterol, 0.01 g omega-3 PUFA (ALA), 2 mg calcium, 0.5 mg iron, 6 mg magnesium, 93 mg potassium, 1.2 mg zinc, and 0.6 µg Vitamin B12 [
23].
We used the Healthy Eating Index (HEI-2015) as a composite measure of diet quality. The HEI-2015 is based on at total of 13 components, 9 that are encouraged including total fruit, whole fruit, total vegetables, greens and beans, whole grains, dairy, total protein, protein from plant, and seafood sources, and the fatty acid ratio (favoring a higher ratio of monounsaturated fatty acids and PUFAs to saturated fatty acids), and 4 that are discouraged, including refined grains, saturated fat, added sugars, and sodium. HEI scores range from 0 to 100, with higher scores indicating a better alignment with DGA and, therefore, a better diet quality. The HEI-2015 algorithm has been described previously [
24]. A version of the HEI corresponding to the current DGA was not yet available upon analysis, but the nutrients and food groups that should be encouraged or limited are generally comparable between the 2020 and 2025 (current) and 2015 and 2020 DGA [
1,
24].
2.6. Analyses
We used the National Cancer Institute (NCI) method [
25,
26] to estimate the usual dietary intake of selected nutrients in the participants’ current diets, and this estimation was repeated after modeling the replacement of 1, 2, 3, and 4 oz meat with 0.5, 1, 1.5, and 2 oz walnuts, respectively. We used balanced repeated replication weights to account for the complex survey design used by NHANES [
27]. We used the Mixtran (version 2.1), Distrib (version 2.1), and BRR_PValue_CI (version 1.0) macros provided by the NCI to run our analyses. Covariates in the NCI method included the sequence of the participant’s intake (day 1 or 2), age (7 categories), gender (male/female), race (4 categories), energy intake (kcal), and an indicator for weekday consumption as Monday–Thursday and weekend consumption as Friday–Sunday.
We calculated the mean and corresponding 95% confidence intervals (CIs) for each nutrient of interest and age–gender subgroup and determined the percentages of the population with intakes below the estimated adequate requirement (EAR) for magnesium, vitamin B12, and iron. We also examined the percentages of the population with intakes above the recommended adequate intake (AI) for potassium, fiber, cholesterol, and ALA, as recommended by published Dietary Reference Intakes [
28].
The HEI-2015 score was estimated using the population ratio method described previously [
29] with data from the first 24 h recall (day 1). We adapted the SAS macro provided by the NCI (hei2015.score.macro.sas) [
26] for the 2015–2016 and 2017–2018 NHANES and FPED cycles used in this study. We modeled HEI scores based on reported intake, adding the nutrient contents of walnuts and subtracting the nutrient contents of meat in the dose-escalating manner described above.
The following values were used for the addition of 1 oz walnuts: 2.53 g monounsaturated fatty acids, 13.4 g PUFAs, 1.74 g saturated fats, 185 calories, 2 oz eq. total protein, 2 oz eq. seafood and plant proteins, and 0.567 mg sodium. Similarly, we used the following values to subtract 1 oz eq. meat: 0.87 g monounsaturated fatty acids, 0.12 g PUFAs, 0.76 g saturated fats, 49 calories, 1 oz eq. total protein, 1 oz eq. seafood and plant proteins, and 127 mg sodium.
2.7. Cost Analysis
We followed a multi-step process to assess the financial influence on the consumers’ spending with partial replacement of meat with walnuts. We first obtained food prices from the Center for Nutrition Policy and Promotion Food Prices Database for 2003–2004 [
30], which includes the average prices of approximately 4600 food items (excluding alcoholic beverages) reported by participants of the 2003–2004 NHANES cycle [
31]. In the second step, we merged food codes and food categories from the 2015 to 2016 and 2017 to 2018 cycles of the WWEIA database and FNDDSs [
32] into the Food Prices Database to prepare the dataset for inflation adjustment. However, approximately 5000 food items reported by participants in the 2015–2016 and 2017–2018 NHANES cycles were not in the 2003–2004 Food Prices Database. Therefore, in the third step, we assigned prices to those new food items using prices from similar food items.
In the fourth step, we adjusted the 2003–2004 food prices for inflation using the consumer price index (obtained from the USDA Economic Research Service [
33]) by food categories. In the fifth step, we calculated the daily cost of all food/meat items by multiplying the inflation-adjusted prices by the consumed amount of food/meat items from day 1 of the food recall. Meat/food items were classified using the WWEIA food categories “Protein Foods–Meats” and “Protein Foods–Cured Meats/Poultry”.
In step 6, we calculated the daily cost of the partial replacement of meat with walnuts for the four replacement levels detailed above (0.5 oz walnuts replacing 1 oz meat, …, 2 oz walnuts replacing 4 oz meat). If an NHANES participant reported meat consumption of less than 4 oz, we only modeled the replacement of meat up to the reported level. Similarly, if a participant reported no meat consumption, we held their daily food expenses constant. Lastly, we obtained the average daily expenses for specific age (4–18 years, 19–50 years, 51–70 years, and 71 years and older) and gender groups for the current diet and the four modeled diets considering the NHANES survey weights.
The results are presented by age and gender subgroups. Significant differences between nutrient intakes (including % below EAR and % above adequate intake) and HEI scores for the current and modeled intakes were determined using non-overlapping 95% CIs. We used version 9.4 SAS software (SAS Institute Inc., Cary, NC, USA) for all data analyses with an alpha level of 0.05.
3. Results
In our sample of no-nut consumers, approximately 25% were children or adolescents, 44% were between 19 and 50 years old, and 31% were 51 years or older. Fifty-two percent of the sample was male. The majority were non-Hispanic white (52%), had an annual household income between USD 20,000 and 75,000 (50%), and had at least some college education (42%).
Table 2 presents the total mean protein food intake and the distribution of type of protein food intake among children and adults. Over 90% of the protein food intake expressed in oz equivalents was from animal food (meat, poultry, seafood, and eggs), and, of this, over 50% was from meat. In this study, meat includes meat, cured meat, and organ meat but excludes poultry. Moreover, boys/men consumed more protein than girls/women.
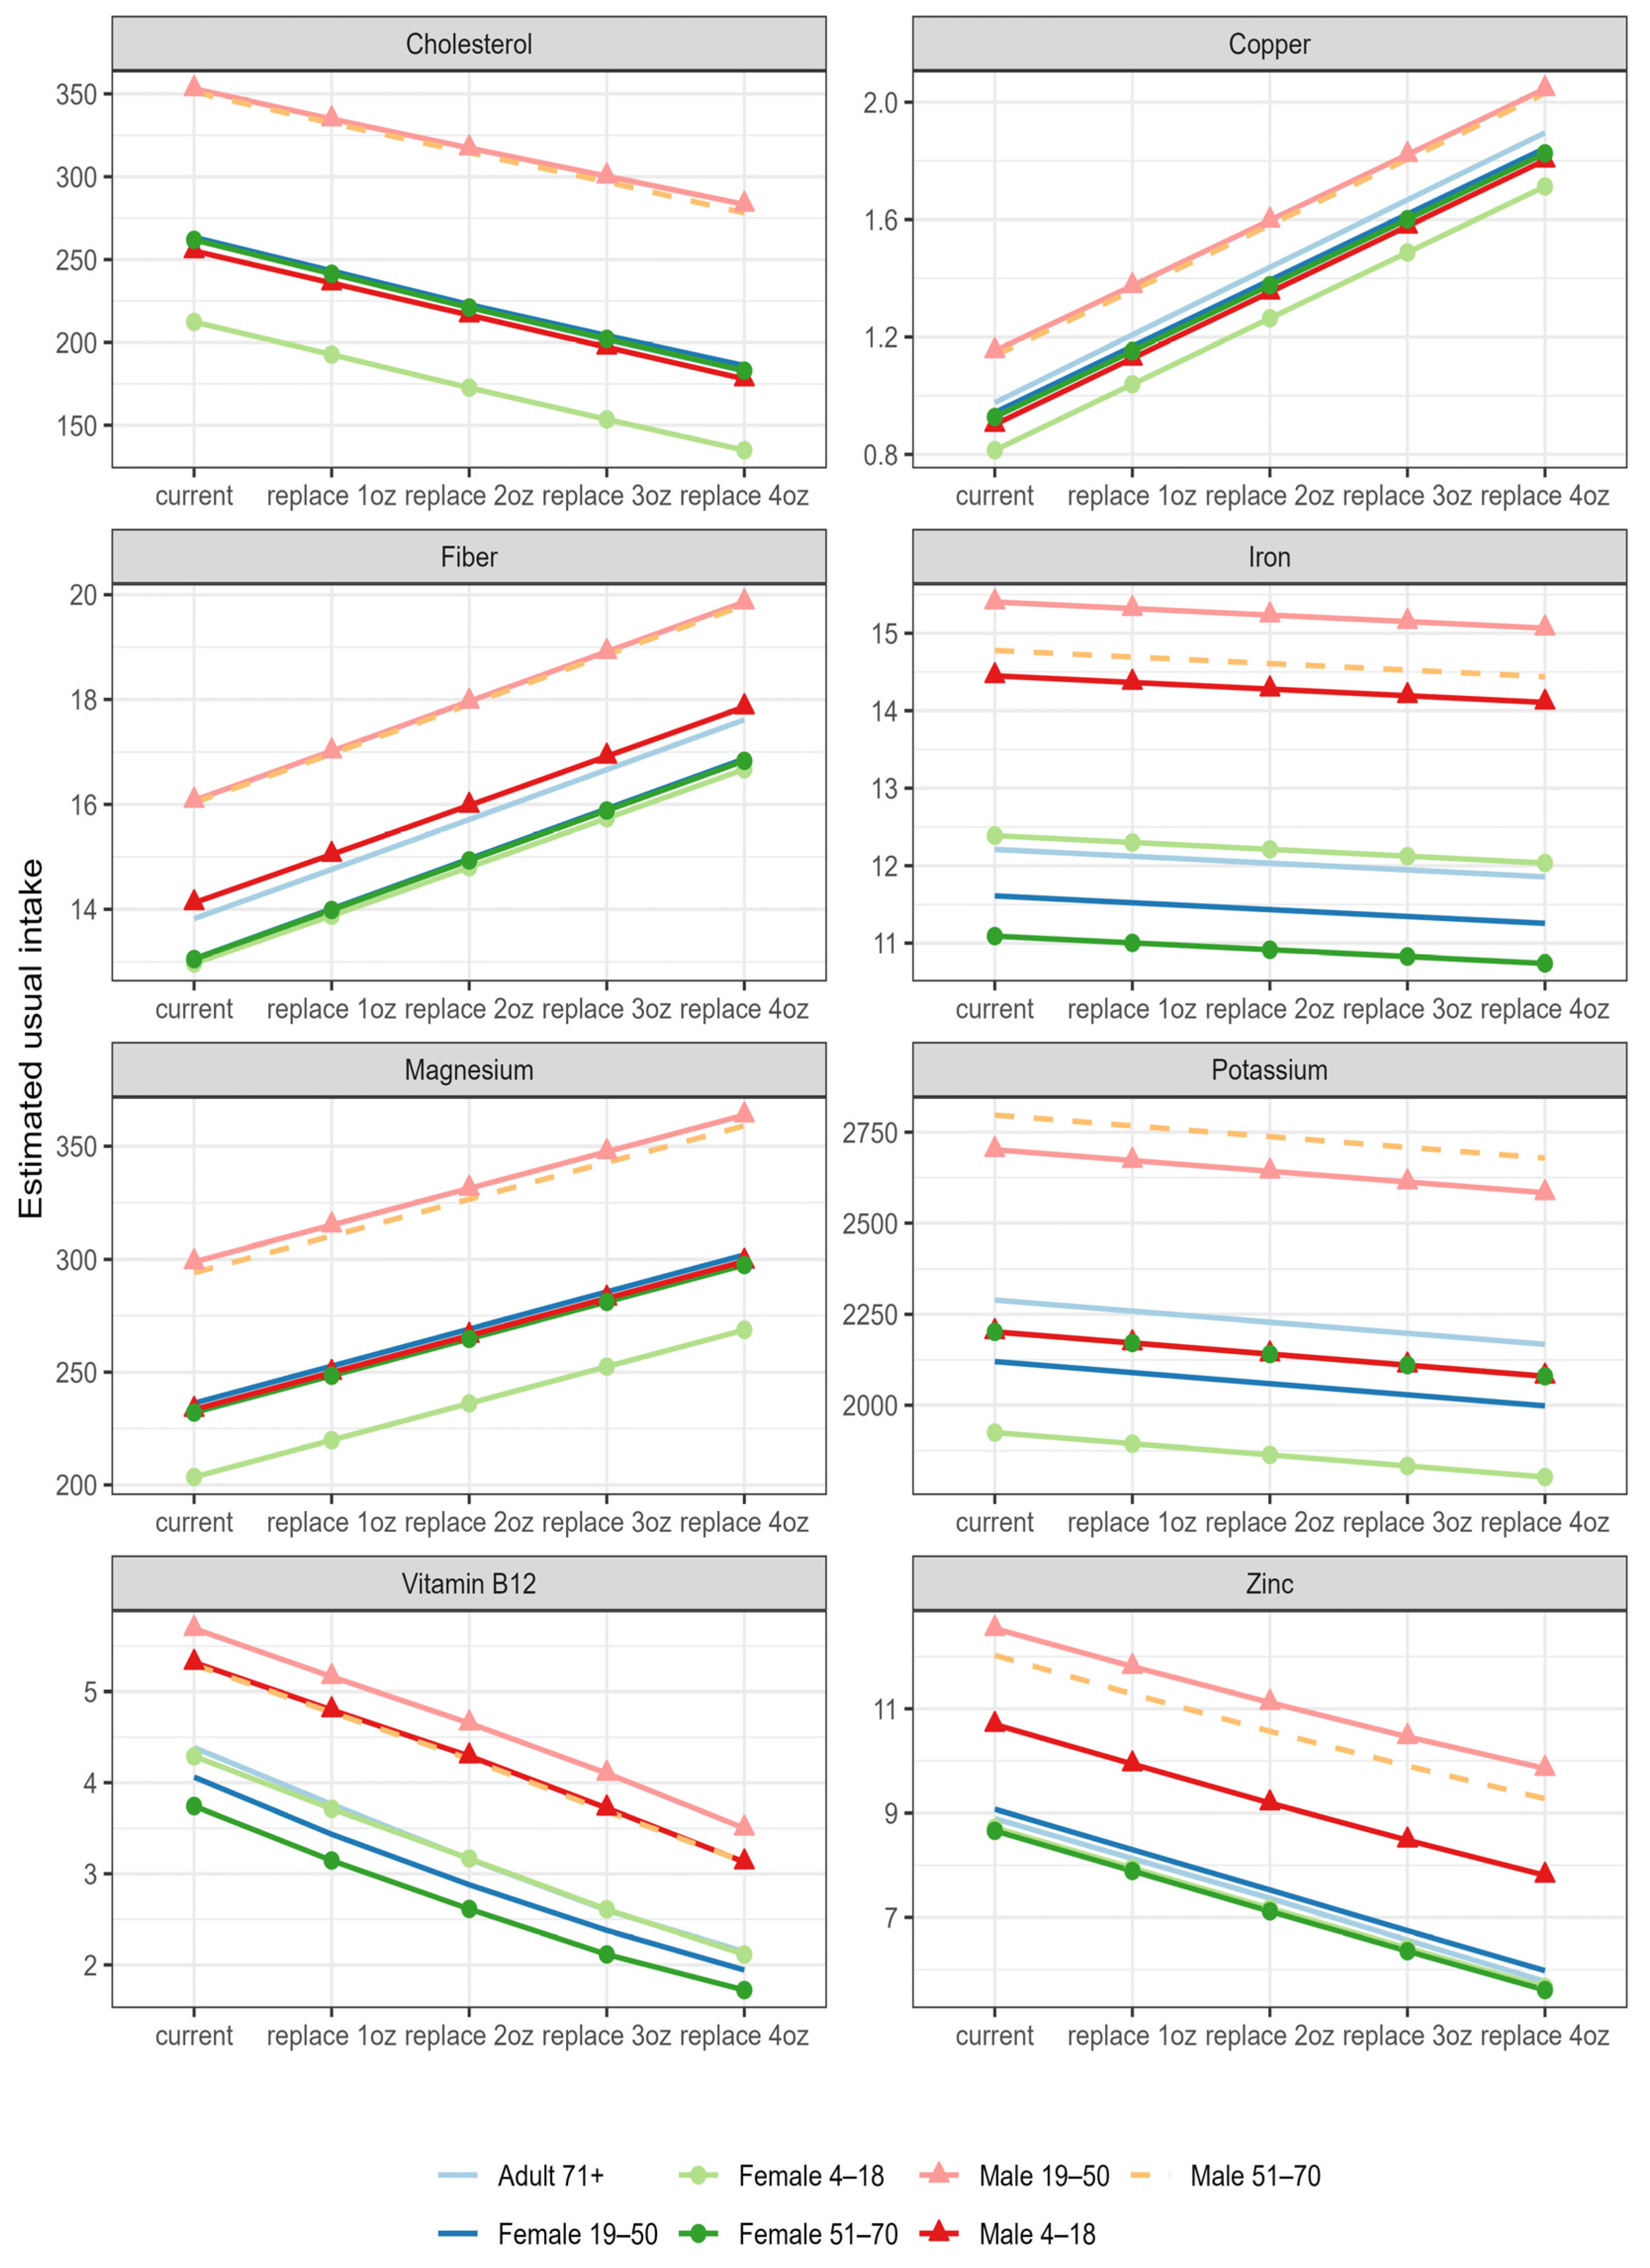
The results of the food modeling study suggest that replacing up to 4 ounces of meat with walnuts may improve the intake of several nutrients inadequately consumed by the US population. For all the age and gender groups, the partial replacement of meat with walnuts in the modeled diet resulted in a greater intake of magnesium, copper, and fiber and a lower intake of cholesterol and vitamin B12. No significant changes were observed in iron and potassium intake (
Figure 2). Similar patterns were observed in all gender and age groups.
3.1. Change in Percent of Population Meeting Recommendations
Replacing meat with walnuts in a dose-escalating manner (replacing 1, 2, 3, and 4 oz meat with 0.5, 1, 1.5, and 2 oz walnuts, respectively) resulted in a significant decline in protein intake in all four models for children and adults (see
Supplemental Table S5). The Acceptable Macronutrients Distribution Range (AMDR) for protein is 10–35% of energy intake. The current dietary intake meets the AMDR recommendation for protein for all age and gender groups, ranging from 14% to 16% of energy intake as protein. When replacing meat (1, 2, 3, 4 oz) with walnuts (0.5, 1, 1.5, and 2 oz, respectively), the AMDR recommendation for protein was met for all age and gender categories, but only up to 1 oz walnuts.
When replacing meat with walnuts in a dose-escalating manner, intake of magnesium significantly increased in all four models for children (4–18 years) and adults (
Figure 2). Replacing 2 oz meat with 1 oz walnuts was enough to significantly improve magnesium intake in all age and gender groups. A similar observation was noted for fiber intake. Moreover, replacing 4 oz meat with 2 oz walnuts significantly improved potassium intake in children and adults compared with the usual diet, but the same effect was not observed for the other modeled doses.
Vitamin B12 intake significantly decreased in all four models for children (4–18 years) and adults (
Figure 2). Furthermore, a minimum of 1 oz walnuts (2 oz meat eq.) significantly decreased vitamin B12 intake in the modeled diet for all age and gender groups. Replacing meat with walnuts also led to a significant decline in zinc intake in children and adults but improved copper intake, especially with a replacement of 1 oz or more of walnuts (
Figure 2).
3.2. Changes in Dietary Fat Intake
Replacing 1 oz meat with 0.5 oz walnuts allowed for the omega-3 fatty acids recommendation to be met and significantly increased PUFA and linoleic acid intake in the modeled diet for all age and gender categories.
3.3. Changes in Diet Quality
We examined the HEI-2015 to measure the influence of the replacement models on diet quality (
Table 3). Based on current diets, the population mean HEI-2015 value was 49.1 (95% CI 47.94, 50.37) for children and adolescents (4–18 years) and 52.4 (95% CI 50.99, 53.79) for adults (19 years and older). Replacing 1, 2, 3, and 4 oz meat with 0.5, 1, 1.5, and 2 oz walnuts, respectively, significantly improved diet quality for children (4–18 years) and adults (19 years and older) (HEI-2015 scores for children: 55.0, 57.6, 60.2, 61.8; for adults: 56.4, 59.0, 61.5, 62.4, respectively). Further, adding 1.5–2 oz walnuts to the diet significantly improved diet quality in all gender and age subcategories. When evaluating individual HEI-2015 components, values for seafood and plant protein and the fatty acid ratio improved and contributed most to the improved diet quality.
3.4. Changes in Cost with Replacement
The estimated cost per ounce of meat was USD 0.38 in both 2015–2016 and 2017–2018, and the cost per ounce of walnuts was USD 0.26 in 2015–2016 and USD 0.27 in 2017–2018. Although daily expenses for food decreased by USD 0.08–0.13 (1 oz replacement, decrease of 1.4–2.1%), USD 0.13–0.22 (2 oz replacement, decrease of 2.5–3.7%), USD 0.16–0.32 (3 oz replacement, decrease of 3.3–4.9%), and USD 0.19–0.39 (4 oz replacement, decrease of 3.8–5.6%), these changes were not significant when compared with the current daily expenses.
4. Discussion
Over 90% of the protein food intake in the current study came from animal sources, and of animal-sourced protein food, more than 50% came from meat. The saturated fat intake for all age and gender categories was above 10% of the total calories of the current dietary intake. The DGA recommends increasing consumption of unsaturated fatty acids and limiting saturated fat intake. We hypothesized that partially replacing meat with walnuts might reduce the intake of saturated fat and cholesterol. However, this modeling study demonstrated that partially replacing meat with walnuts did not significantly reduce the saturated fat intake, although a trend toward decreased intake was observed. Compared with meat, nuts generally have an intermediate amount of saturated fat, whereas other plant-based proteins have lower levels of saturated fat [
34], which could potentially reduce saturated fat intake. We also observed significant increases in polyunsaturated fat intake along with reductions in cholesterol intake in the modeled diet of partial replacement of meat with walnuts.
Increasing PUFA intake by partially replacing meat with walnuts, as examined in this modeling study, may provide health benefits. Studies indicate that the abundance of omega-3 and omega-6 fatty acids in walnuts may contribute to their cardioprotective properties [
5]. Other studies indicate that intakes of red and processed meat are associated with modest increases in total mortality, cardiovascular disease mortality [
35,
36], and cancer mortality [
36]. A modeling study demonstrated that replacing red and processed meat with other protein sources may reduce the incidence of type 2 diabetes [
37]. Moreover, red meat consumption may increase the risk of frailty in older women [
38]. Despite the health concerns associated with processed meat, the processed meat intake among adults 20 years and older has not changed since 1999, although there has been a decline in unprocessed red meat intake [
39]. The 2020–2025 DGA cites a need to improve the US diet, further noting that small shifts in eating patterns can make a considerable difference in overall diet quality [
1].
Some nutrient concerns with reducing meat intake include the potential for reduced iron intake and vitamin B12 deficiency [
40]. We hypothesized that replacing some meat with walnuts could increase the intake of nutrients such as magnesium, potassium, and fiber to meet the recommended intake levels while not significantly impacting the intake of iron and vitamin B12. The current modeling study found no significant changes in iron intake when meat was partially replaced with walnuts in a dose-escalating manner. A similar outcome was observed in a modeling study conducted with young, Dutch, female participants [
41]. In this modeling study, replacing at least 2 oz of meat with walnuts showed a significant reduction in mean vitamin B12 intake for all age and gender groups. However, all age and gender groups maintained a mean vitamin B12 intake above the recommended daily allowance when replacing 2–3 oz of meat with walnuts. Nevertheless, the percentage of participants below the EAR for vitamin B12 increased with meat replacement. A similar observation was noted for zinc. Therefore, it is important to monitor vitamin B12 and zinc intake in diets that may replace meat with walnuts. This modeling study observed a significant increase in the mean intake of magnesium, copper, and fiber for all age and gender groups when replacing at least 2 oz of meat with walnuts. A similar result was found in another study, which modeled a reference omnivore diet using NHANES 2017–2018 data and compared it with diets that substituted animal products in the reference diet with either traditional or novel plant-based foods to create flexitarian, vegetarian, and vegan diets matched for calories and macronutrients [
42].
Studies have shown that limiting meat intake may improve diet quality [
43,
44]. In this modeling study, replacing some meat with walnuts significantly improved diet quality. Moreover, our cost analysis indicates that replacing meat with walnuts does not increase the cost of food in the diet; instead, there is a declining trend in cost, although it is not significant compared with current food cost.
The strengths of this study include its use of data from the nationally representative NHANES survey of 2015–2018 and its consideration of multiple doses in a dose-escalating replacement of meat with walnuts. Furthermore, the study assessed the range of meat intake that could be replaced with walnuts without compromising diet quality and nutrient intake. A limitation of this study is its use of 24 h dietary recalls, which might be subject to error when assessing nutrient intake. The cross-sectional survey design of NHANES data allowed us to examine population level associations, but it prevents us from assessing causality.
5. Conclusions
The results of this modeling study reveal that the partial replacement of meat with 1–1.5 oz walnuts may improve the dietary intake of some nutrients, such as dietary fiber, magnesium, and PUFA, including omega-3 fatty acids, and may decrease the intake of cholesterol among the US population. However, it is not likely to change saturated fat intake. The partial replacement of meat with walnuts enhanced overall diet quality, as assessed by HEI. Individuals replacing meat with walnuts in their diet should be cautious about the potential risk of zinc and vitamin B12 deficiencies.
Supplementary Materials
The following supporting information can be downloaded at:
https://www.mdpi.com/article/10.3390/nu15214518/s1, Supplemental Table S1: Percentage of individuals with nutrient intakes below the EAR
a at current intake (usual diet) and modeled intake when replacing meat with equivalent
b amount of walnuts. Supplemental Table S2: Percentage of individuals below EAR
a for magnesium and above AI
b for fiber (both under-consumed nutrients) at current intake (usual diet) and modeled intake when replacing meat with equivalentc amount of walnuts. Supplemental Table S3: Percentage of individuals with nutrient intake levels above the AI
a at current intake (usual diet) and modeled intake when replacing meat with equivalentb amount of walnuts. Supplemental Table S4: Percentage of individuals with nutrient intakes below the EAR
a at current intake (usual diet) and modeled intake when replacing meat with equivalentb amount of walnuts. Supplemental Table S5: AMDRa of protein intake (protein as % energy) at current intake and modeled intake when replacing meat with equivalentb amount of walnuts. Supplemental Table S6: Saturated fat intake in grams and percentage of individuals with cholesterol intake levels above 300 mg at current intake (usual diet) and modeled for replacing meat with an equivalenta amount of walnuts. Supplemental Table S7: Percentage of individuals with nutrient intake levels above the AI
a at current intake (usual diet) and modeled at replacing meat with an equivalentb amount of walnuts.
Author Contributions
K.T. and L.A.S.: project conception, research design, and manuscript writing; C.D.T.: supervised data analysis and manuscript revision; B.H. and R.L.: data analysis and manuscript revision. All authors have read and agreed to the published version of the manuscript.
Funding
This research was funded by the California Walnut Commission. Carmen Tekwe’s research was funded in part by an award from the National Institute of Diabetes and Digestive and Kidney Diseases Award # R01DK132385.
Institutional Review Board Statement
We used NHANES data for our research study, and the NHANES has been reviewed and approved by an Institutional Review Board at the US Centers for Disease Control and Prevention. This study involves secondary data in the research; therefore, permission is not required from the Indiana Institutional Review Board.
Informed Consent Statement
Written informed consent was obtained from participants or their proxies, and the survey protocol was approved by the Research Ethics Review Board at the National Center for Health Statistics (NCHS).
Data Availability Statement
Conflicts of Interest
No potential conflicts of interest are reported by Krisha Thiagarajah, Lisa Spence, Carmen Tekwe, and Rui Li. In the past 36 months, Beate Henschel has been involved in research for which her institution, Indiana University, has received grants from NIH and the National Cattlemen’s Beef Association. The funders had no role in the design of the study; in the collection, analyses, or interpretation of the data; in the writing of the manuscript; or in the decision to publish the results.
References
- U.S. Department of Agriculture; U.S. Department of Health and Human Services. Dietary Guidelines for Americans, 2020–2025, 9th ed.; U.S. Department of Agriculture, U.S. Department of Health and Human Services: Washington, DC, USA, 2020. Available online: DietaryGuidelines.gov (accessed on 8 September 2023).
- Ros, E.; Hu, F.B. Consumption of plant seeds and cardiovascular health: Epidemiological and clinical trial evidence. Circulation 2013, 128, 553–565. [Google Scholar] [CrossRef] [PubMed]
- Li, L.; Tsao, R.; Yang, R.; Kramer, A.J.K.G.; Hernandez, M. Fatty Acid Profiles, Tocopherol Contents, and Antioxidant Activities of Heartnut (Juglans ailanthifolia var. cordiformis) and Persian Walnut (Juglans regia L.). J. Agric. Food Chem. 2007, 55, 1164–1169. [Google Scholar] [CrossRef] [PubMed]
- Guasch-Ferré, M.; Li, J.; Hu, F.B.; Salas-Salvadó, J.; Tobias, D.K. Effects of walnut consumption on blood lipids and other cardiovascular risk factors: An updated meta-analysis and systematic review of controlled trials. Am. J. Clin. Nutr. 2018, 108, 174–187. [Google Scholar] [CrossRef]
- Guasch-Ferré, M.; Liu, X.; Malik, V.S.; Sun, Q.; Willett, W.C.; Manson, J.E.; Rexrode, K.M.; Li, Y.; Hu, F.B.; Bhupathiraju, S.N. Nut Consumption and Risk of Cardiovascular Disease. J. Am. Coll. Cardiol. 2017, 70, 2519–2532. [Google Scholar] [CrossRef] [PubMed]
- Becerra-Tomás, N.; Paz-Graniel, I.; WC Kendall, C.; Kahleova, H.; Rahelić, D.; Sievenpiper, J.L.; Salas-Salvadó, J. Nut consumption and incidence of cardiovascular diseases and cardiovascular disease mortality: A meta-analysis of prospective cohort studies. Nutr. Rev. 2019, 77, 691–709. [Google Scholar] [CrossRef]
- Xiao, Y.; Huang, W.; Peng, C.; Zhang, J.; Wong, C.; Kim, J.H.; Yeoh, E.-K.; Su, X. Effect of nut consumption on vascular endothelial function: A systematic review and meta-analysis of randomized controlled trials. Clin. Nutr. 2018, 37, 831–839. [Google Scholar] [CrossRef]
- Mohammadi-Sartang, M.; Bellissimo, N.; de Zepetnek, J.O.T.; Bazyar, H.; Mahmoodi, M.; Mazloom, Z. Effects of walnuts consumption on vascular endothelial function in humans: A systematic review and meta-analysis of randomized controlled trials. Clin. Nutr. ESPEN 2018, 28, 52–58. [Google Scholar] [CrossRef]
- Arab, L.; Dhaliwal, S.K.; Martin, C.J.; Larios, A.D.; Jackson, N.J.; Elashoff, D. Association between walnut consumption and diabetes risk in NHANES. Diabetes Metab. Res. Rev. 2018, 34, e3031. [Google Scholar] [CrossRef]
- Pan, A.; Sun, Q.; Manson, J.E.; Willett, W.C.; Hu, F.B. Walnut consumption is associated with lower risk of type 2 diabetes in women. J. Nutr. 2013, 143, 512–518. [Google Scholar] [CrossRef]
- Chauhan, A.; Chauhan, V. Beneficial effects of walnuts on cognition and brain health. Nutrients 2020, 12, E550. [Google Scholar] [CrossRef]
- Poulose, S.M.; Miller, M.G.; Shukitt-Hale, B. Role of walnuts in maintaining brain health with age. J. Nutr. 2014, 144 (Suppl. S4), 561S–566S. [Google Scholar] [CrossRef]
- Corwin, R.L.; Hartman, T.J.; Maczuga, S.A.; Graubard, B.I. Dietary saturated fat intake is inversely associated with bone density in humans: Analysis of NHANES III. J. Nutr. 2006, 136, 159–165. [Google Scholar] [CrossRef] [PubMed]
- Dikariyanto, V.; Berry, S.E.; Pot, G.K.; Francis, L.; Smith, L.; Hall, W.L. Tree nut snack consumption is associated with better diet quality and CVD risk in the UK adult population: National Diet and Nutrition Survey (NDNS) 2008–2014. Public Health Nutr. 2020, 23, 3160–3169. [Google Scholar] [CrossRef] [PubMed]
- O’Neil, C.E.; Keast, D.R.; Fulgoni, V.L.; Nicklas, T.A. Tree nut consumption improves nutrient intake and diet quality in US adults: An analysis of National Health and Nutrition Examination Survey (NHANES) 1999–2004. Asia Pac. J. Clin. Nutr. 2010, 19, 142–150. [Google Scholar] [PubMed]
- National Health and Nutrition Examination Survey (NHANES). MEC In-Person Dietary Interviewers Procedural Manual. 2017. Available online: https://wwwn.cdc.gov/nchs/data/nhanes/2017-2018/manuals/2017_MEC_In-Person_Dietary_Interviewers_Manual.pdf (accessed on 8 September 2023).
- U.S. Department of Agriculture, Agricultural Research Service. USDA Food and Nutrient Database for Dietary Studies 2015–2016. Food Surveys Research Group Home Page; 2018. Available online: http://www.ars.usda.gov/nea/bhnrc/fsrg (accessed on 8 September 2023).
- Bowman, S.A.; Clemens, J.C.; Shimizu, M.; Friday, J.E.; Moshfegh, A.J. Food Patterns Equivalents Database 2015–2016: Methodology and User Guide; Food Surveys Research Group, Beltsville Human Nutrition Research Center, Agricultural Research Service, U.S. Department of Agriculture: Beltsville, MD, USA, 2018. Available online: http://www.ars.usda.gov/nea/bhnrc/fsrg (accessed on 8 September 2023).
- U.S. Department of Agriculture, Agricultural Research Service. USDA Food and Nutrient Database for Dietary Studies 2017–2018. Food Surveys Research Group Home Page; 2020. Available online: http://www.ars.usda.gov/nea/bhnrc/fsrg (accessed on 8 September 2023).
- Bowman, S.A.; Clemens, J.C.; Friday, J.E.; Moshfegh, A.J. Food Patterns Equivalents Database 2017–2018: Methodology and User Guide; Food Surveys Research Group, Beltsville Human Nutrition Research Center, Agricultural Research Service, U.S. Department of Agriculture: Beltsville, MD, USA, 2020. Available online: http://www.ars.usda.gov/nea/bhnrc/fsrg (accessed on 8 September 2023).
- Pereira, P.M.; Vicente, A.F. Meat nutritional composition and nutritive role in the human diet. Meat Sci. 2013, 93, 586–592. [Google Scholar] [CrossRef]
- U.S. Department of Agriculture, Agricultural Research Service. FoodData Central. 2019. Available online: https://fdc.nal.usda.gov/fdc-app.html#/food-details/170187/nutrients (accessed on 8 September 2023).
- U.S. Department of Agriculture, Food and Nutrition Service. Nutrient Profiles for Food Groups and Subgroups in the 2015 USDA Food Patterns. 2015. Available online: https://fns-prod.azureedge.us/sites/default/files/usda_food_patterns/NutrientProfiles.pdf (accessed on 8 September 2023).
- Krebs-Smith, S.M.; Pannucci, T.E.; Subar, A.F.; Kirkpatrick, S.I.; Lerman, J.L.; Tooze, J.A.; Wilson, M.M.; Reedy, J. Update of the Healthy Eating Index: HEI-2015. J. Acad. Nutr. Diet. 2018, 118, 1591–1602. [Google Scholar] [CrossRef]
- Tooze, J.A.; Kipnis, V.; Buckman, D.W.; Carroll, R.J.; Freedman, L.S.; Guenther, P.M.; Krebs-Smith, S.M.; Subar, A.F.; Dodd, K.W. A mixed-effects model approach for estimating the distribution of usual intake of nutrients: The NCI method. Stat. Med. 2010, 29, 2857–2868. [Google Scholar] [CrossRef]
- Usual Dietary Intakes: SAS Macros for Analysis of a Single Dietary Component 2015-2-18. Available online: https://epi.grants.cancer.gov/diet/usualintakes/macros.html (accessed on 8 September 2023).
- Herrick, K.A.; Rossen, L.M.; Parsons, R.; Dodd, K.W. Estimating usual dietary intake from National Health and Nutrition Examination Survey data using the National Cancer Institute method. National Center for Health Statistics. Vital. Health Stat. 2018, 2, 178. [Google Scholar]
- Institute of Medicine (US) Subcommittee on Interpretation and Uses of Dietary Reference Intakes; Institute of Medicine (US) Standing Committee on the Scientific Evaluation of Dietary Reference Intakes. Dietary Reference Intakes: Applications in Dietary Planning; National Academies Press (US): Washington, DC, USA, 2003.
- National Cancer Institute. The Healthy Eating Index- Population Ratio Method. Available online: https://epi.grants.cancer.gov/hei/population-ratio-method.html (accessed on 8 September 2023).
- U.S. Department of Agriculture, Food and Nutrition Service. Food Prices Database, 2003–2004. Available online: https://www.fns.usda.gov/food-prices-database-2003-04 (accessed on 8 September 2023).
- U.S. Department of Agriculture, Center for Nutrition Policy and Promotion. Food Prices Database, 2003–2004, User’s Guide. Available online: https://fns-prod.azureedge.us/sites/default/files/usda_food_plans_cost_of_food/UserGuide.pdf (accessed on 8 September 2023).
- U.S. Department of Agriculture. USDA Agriculture Research Service; Food Surveys Research Group: Beltsville, MD, USA, 2022. Available online: https://www.ars.usda.gov/northeast-area/beltsville-md-bhnrc/beltsville-human-nutrition-research-center/food-surveys-research-group/docs/dmr-food-categories/ (accessed on 8 September 2023).
- U.S. Department of Agriculture, Economic Research Service, Food Price Outlook. Available online: https://www.ers.usda.gov/data-products/food-price-outlook/ (accessed on 8 September 2023).
- Bohrer, B.M. Nutrient density and nutritional value of meat products and non-meat foods high in protein. Trends Food Sci. Technol. 2017, 65, 103–112. [Google Scholar] [CrossRef]
- Sinha, R.; Cross, A.J.; Graubard, B.I.; Leitzmann, M.F.; Schatzkin, A. Meat intake and mortality: A prospective study of over half a million people. Arch. Intern. Med. 2009, 169, 562–571. [Google Scholar] [CrossRef]
- Wang, X.; Lin, X.; Ouyang, Y.Y.; Liu, J.; Zhao, G.; Pan, A.; Hu, F.B. Red and processed meat consumption and mortality: Dose-response meta-analysis of prospective cohort studies. Public Health Nutr. 2016, 19, 893–905. [Google Scholar] [CrossRef] [PubMed]
- Ibsen, D.B.; Steur, M.; Imamura, F.; Overvad, K.; Schulze, M.B.; Bendinelli, B.; Guevara, M.; Agudo, A.; Amiano, P.; Aune, D.; et al. Replacement of red and processed meat with other food sources of protein and the risk of type 2 diabetes in European Populations: The EPIC-InterAct Study. Diabetes Care 2020, 43, 2660–2667. [Google Scholar] [CrossRef] [PubMed]
- Struijk, E.A.; Fung, T.T.; Sotos-Prieto, M.; Rodriguez-Artalejo, F.; Willett, W.C.; Hu, F.B.; Lopez-Garcia, E. Red meat consumption and risk of frailty in older women. J. Cachexia Sarcopenia Muscle 2022, 13, 210–219. [Google Scholar] [CrossRef] [PubMed]
- Zeng, L.; Ruan, M.; Liu, J.; Wilde, P.; Naumova, E.N.; Mozaffarian, D.; Zhang, F.F. Trends in Processed Meat, Unprocessed Red Meat, Poultry, and Fish Consumption in the United States, 1999-2016. J. Acad. Nutr. Diet 2019, 119, 1085–1098.e12. [Google Scholar] [CrossRef] [PubMed]
- Farsi, D.N.; Uthumange, D.; Munoz, J.M.; Commane, D.M. The nutritional impact of replacing dietary meat with meat alternatives in the UK: A modelling analysis using nationally representative data. Br. J. Nutr. 2022, 127, 1731–1741. [Google Scholar] [CrossRef] [PubMed]
- Temme, E.H.; van der Voet, H.; Thissen, J.T.; Verkaik-Kloosterman, J.; van Donkersgoed, G.; Nonhebel, S. Replacement of meat and dairy by plant-derived foods: Estimated effects on land use, iron and SFA intakes in young Dutch adult females. Public Health Nutr. 2013, 16, 1900–1907. [Google Scholar] [CrossRef]
- Tso, R.; Forde, C.G. Unintended Consequences: Nutritional Impact and Potential Pitfalls of Switching from Animal- to Plant-Based Foods. Nutrients 2021, 13, 2527. [Google Scholar] [CrossRef]
- Parker, H.W.; Vadiveloo, M.K. Diet quality of vegetarian diets compared with nonvegetarian diets: A systematic review. Nutr. Rev. 2019, 77, 144–160. [Google Scholar] [CrossRef]
- van de Kamp, M.E.; Seves, S.M.; Temme, E.H.M. Reducing GHG emissions while improving diet quality: Exploring the potential of reduced meat, cheese and alcoholic and soft drinks consumption at specific moments during the day. BMC Public Health 2018, 18, 264. [Google Scholar] [CrossRef]
| Disclaimer/Publisher’s Note: The statements, opinions and data contained in all publications are solely those of the individual author(s) and contributor(s) and not of MDPI and/or the editor(s). MDPI and/or the editor(s) disclaim responsibility for any injury to people or property resulting from any ideas, methods, instructions or products referred to in the content. |
© 2023 by the authors. Licensee MDPI, Basel, Switzerland. This article is an open access article distributed under the terms and conditions of the Creative Commons Attribution (CC BY) license (https://creativecommons.org/licenses/by/4.0/).


