
Novel Therapeutic Potentials of Taxifolin for Obesity-Induced Hepatic Steatosis, Fibrogenesis, and Tumorigenesis
 ,
,  , ,
, ,  , ,
, ,  ,
,  , and
, and 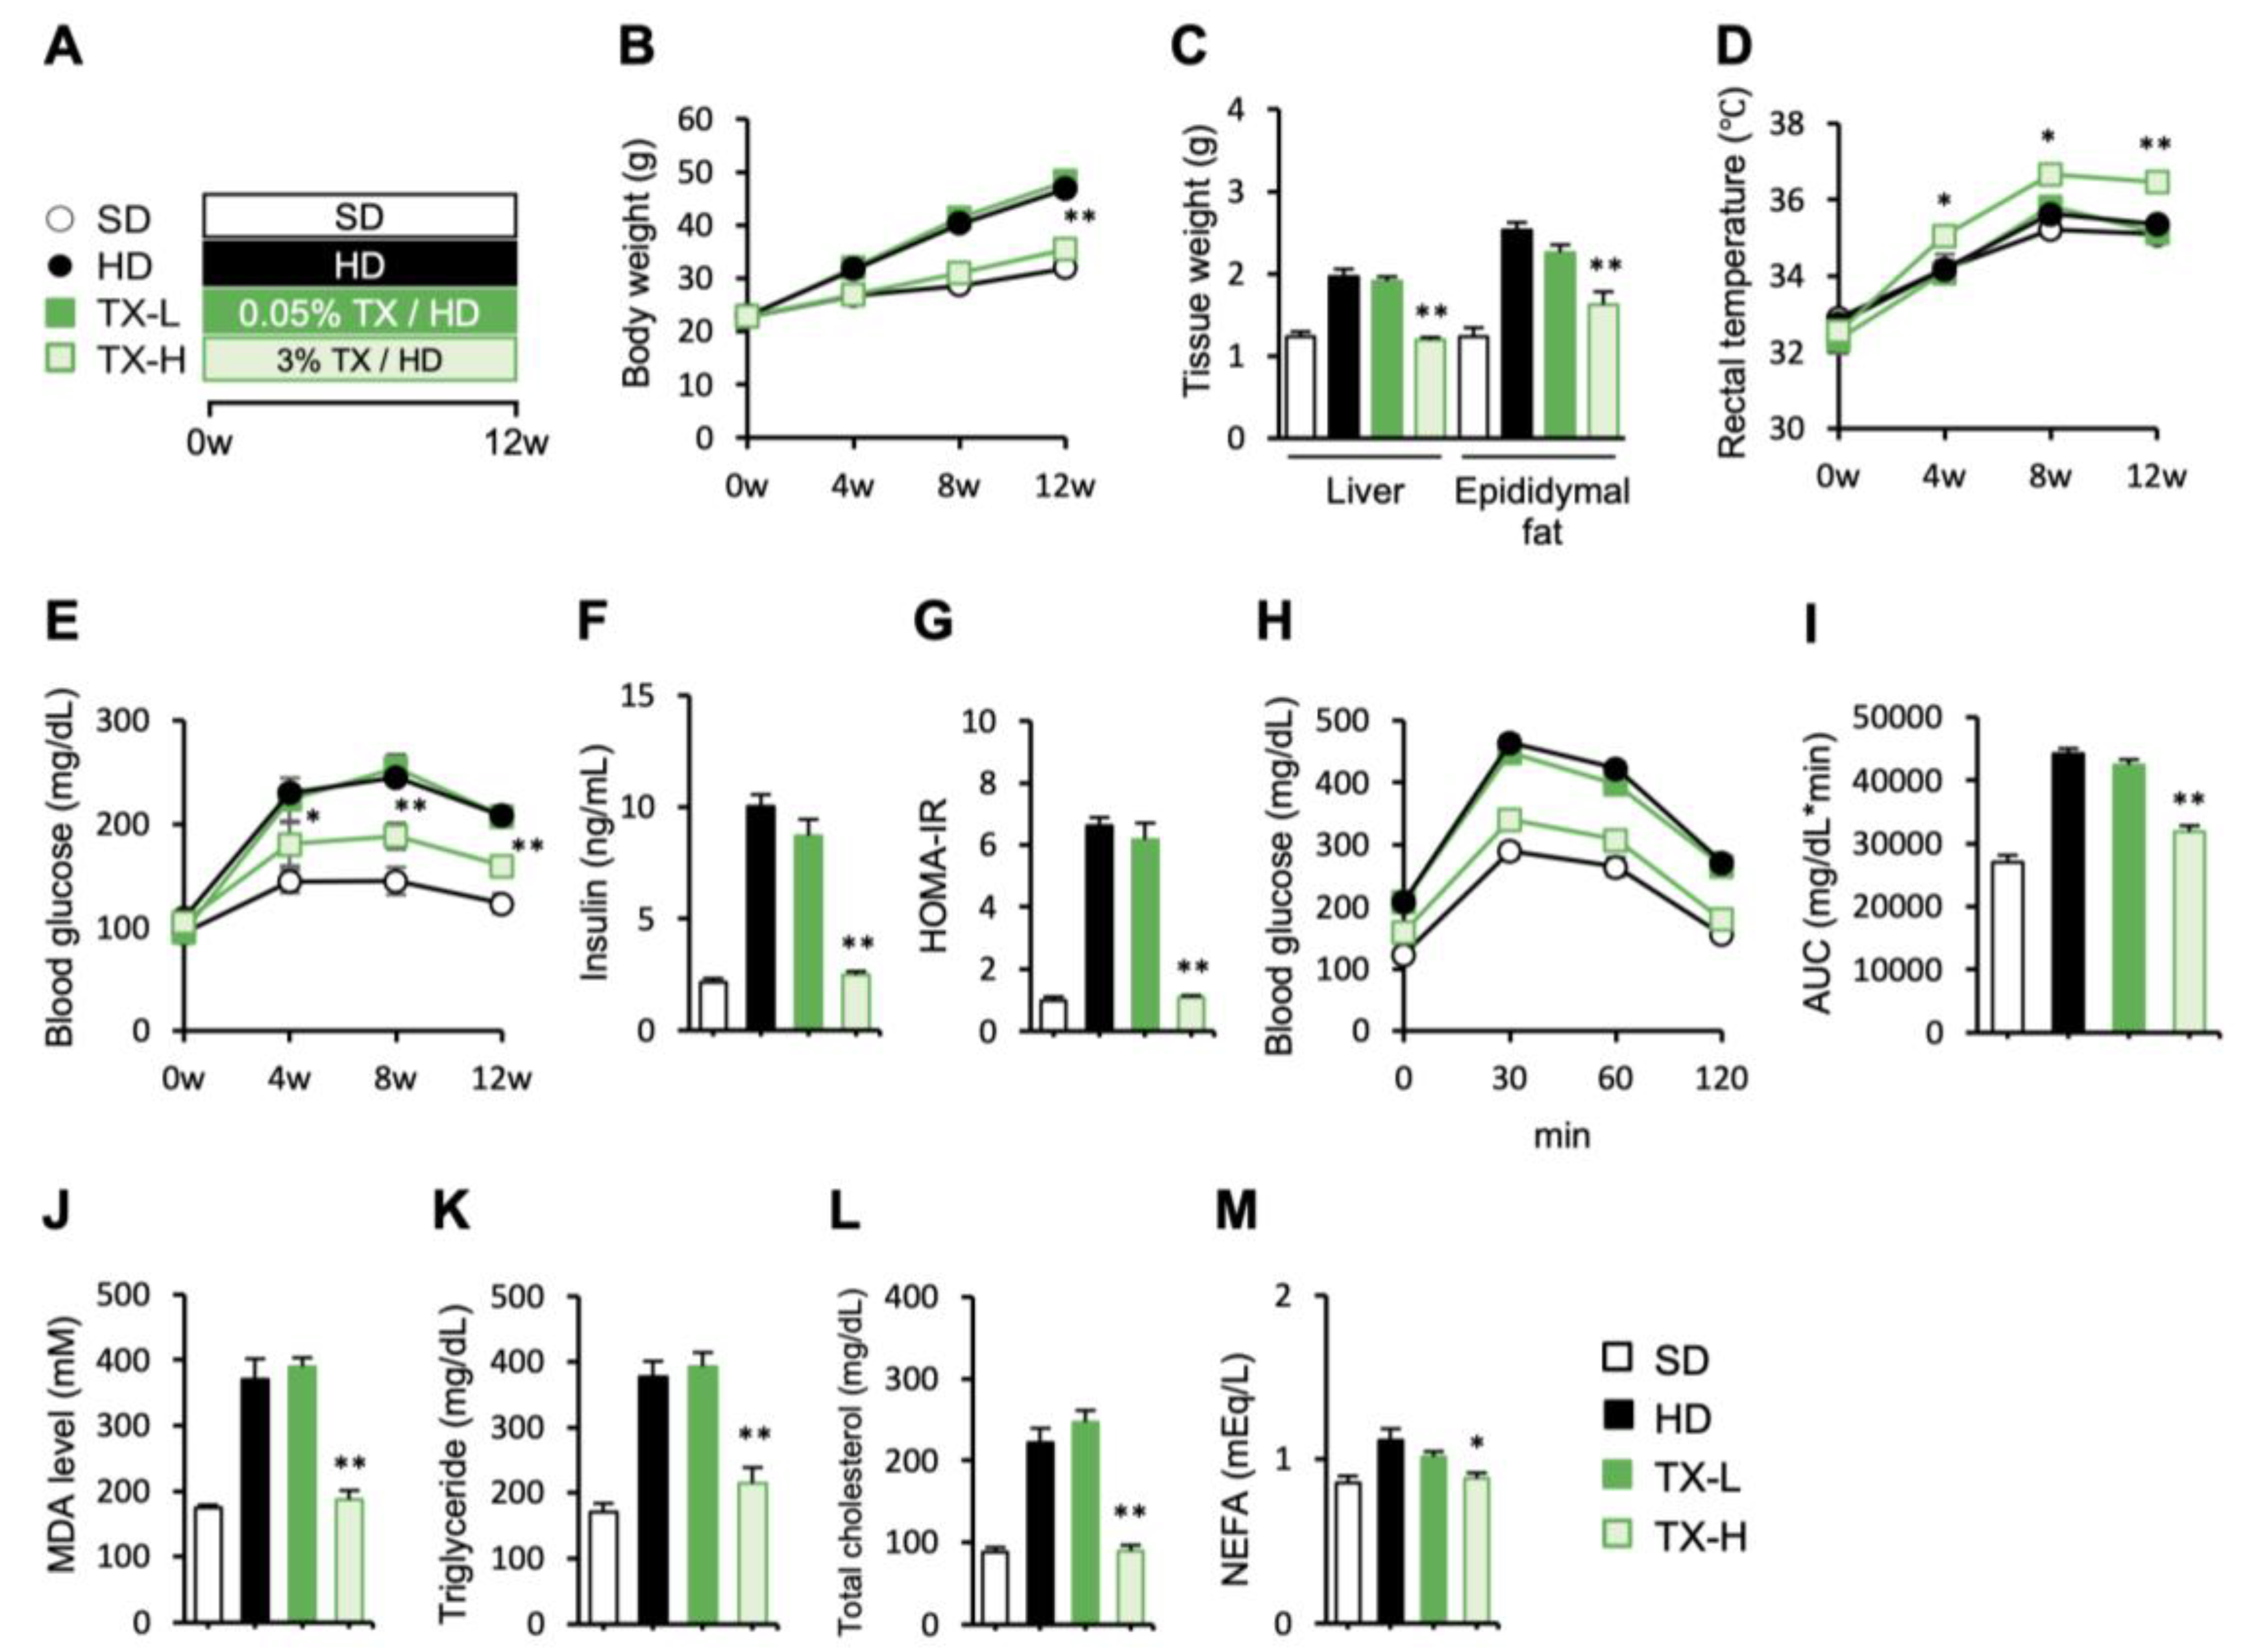
Abstract
1. Introduction
2. Materials and Methods
2.1. Materials
2.2. Animals
2.3. Diet-Induced Obesity Model
2.4. NASH and Liver Tumor Models
2.5. Blood Analysis
2.6. Lipid Contents and Hydroxyproline Levels of the Liver
2.7. Serum and Hepatic Malondialdehyde Contents
2.8. Quantitative Real-Time PCR
2.9. Western Blotting
2.10. Histological Analysis
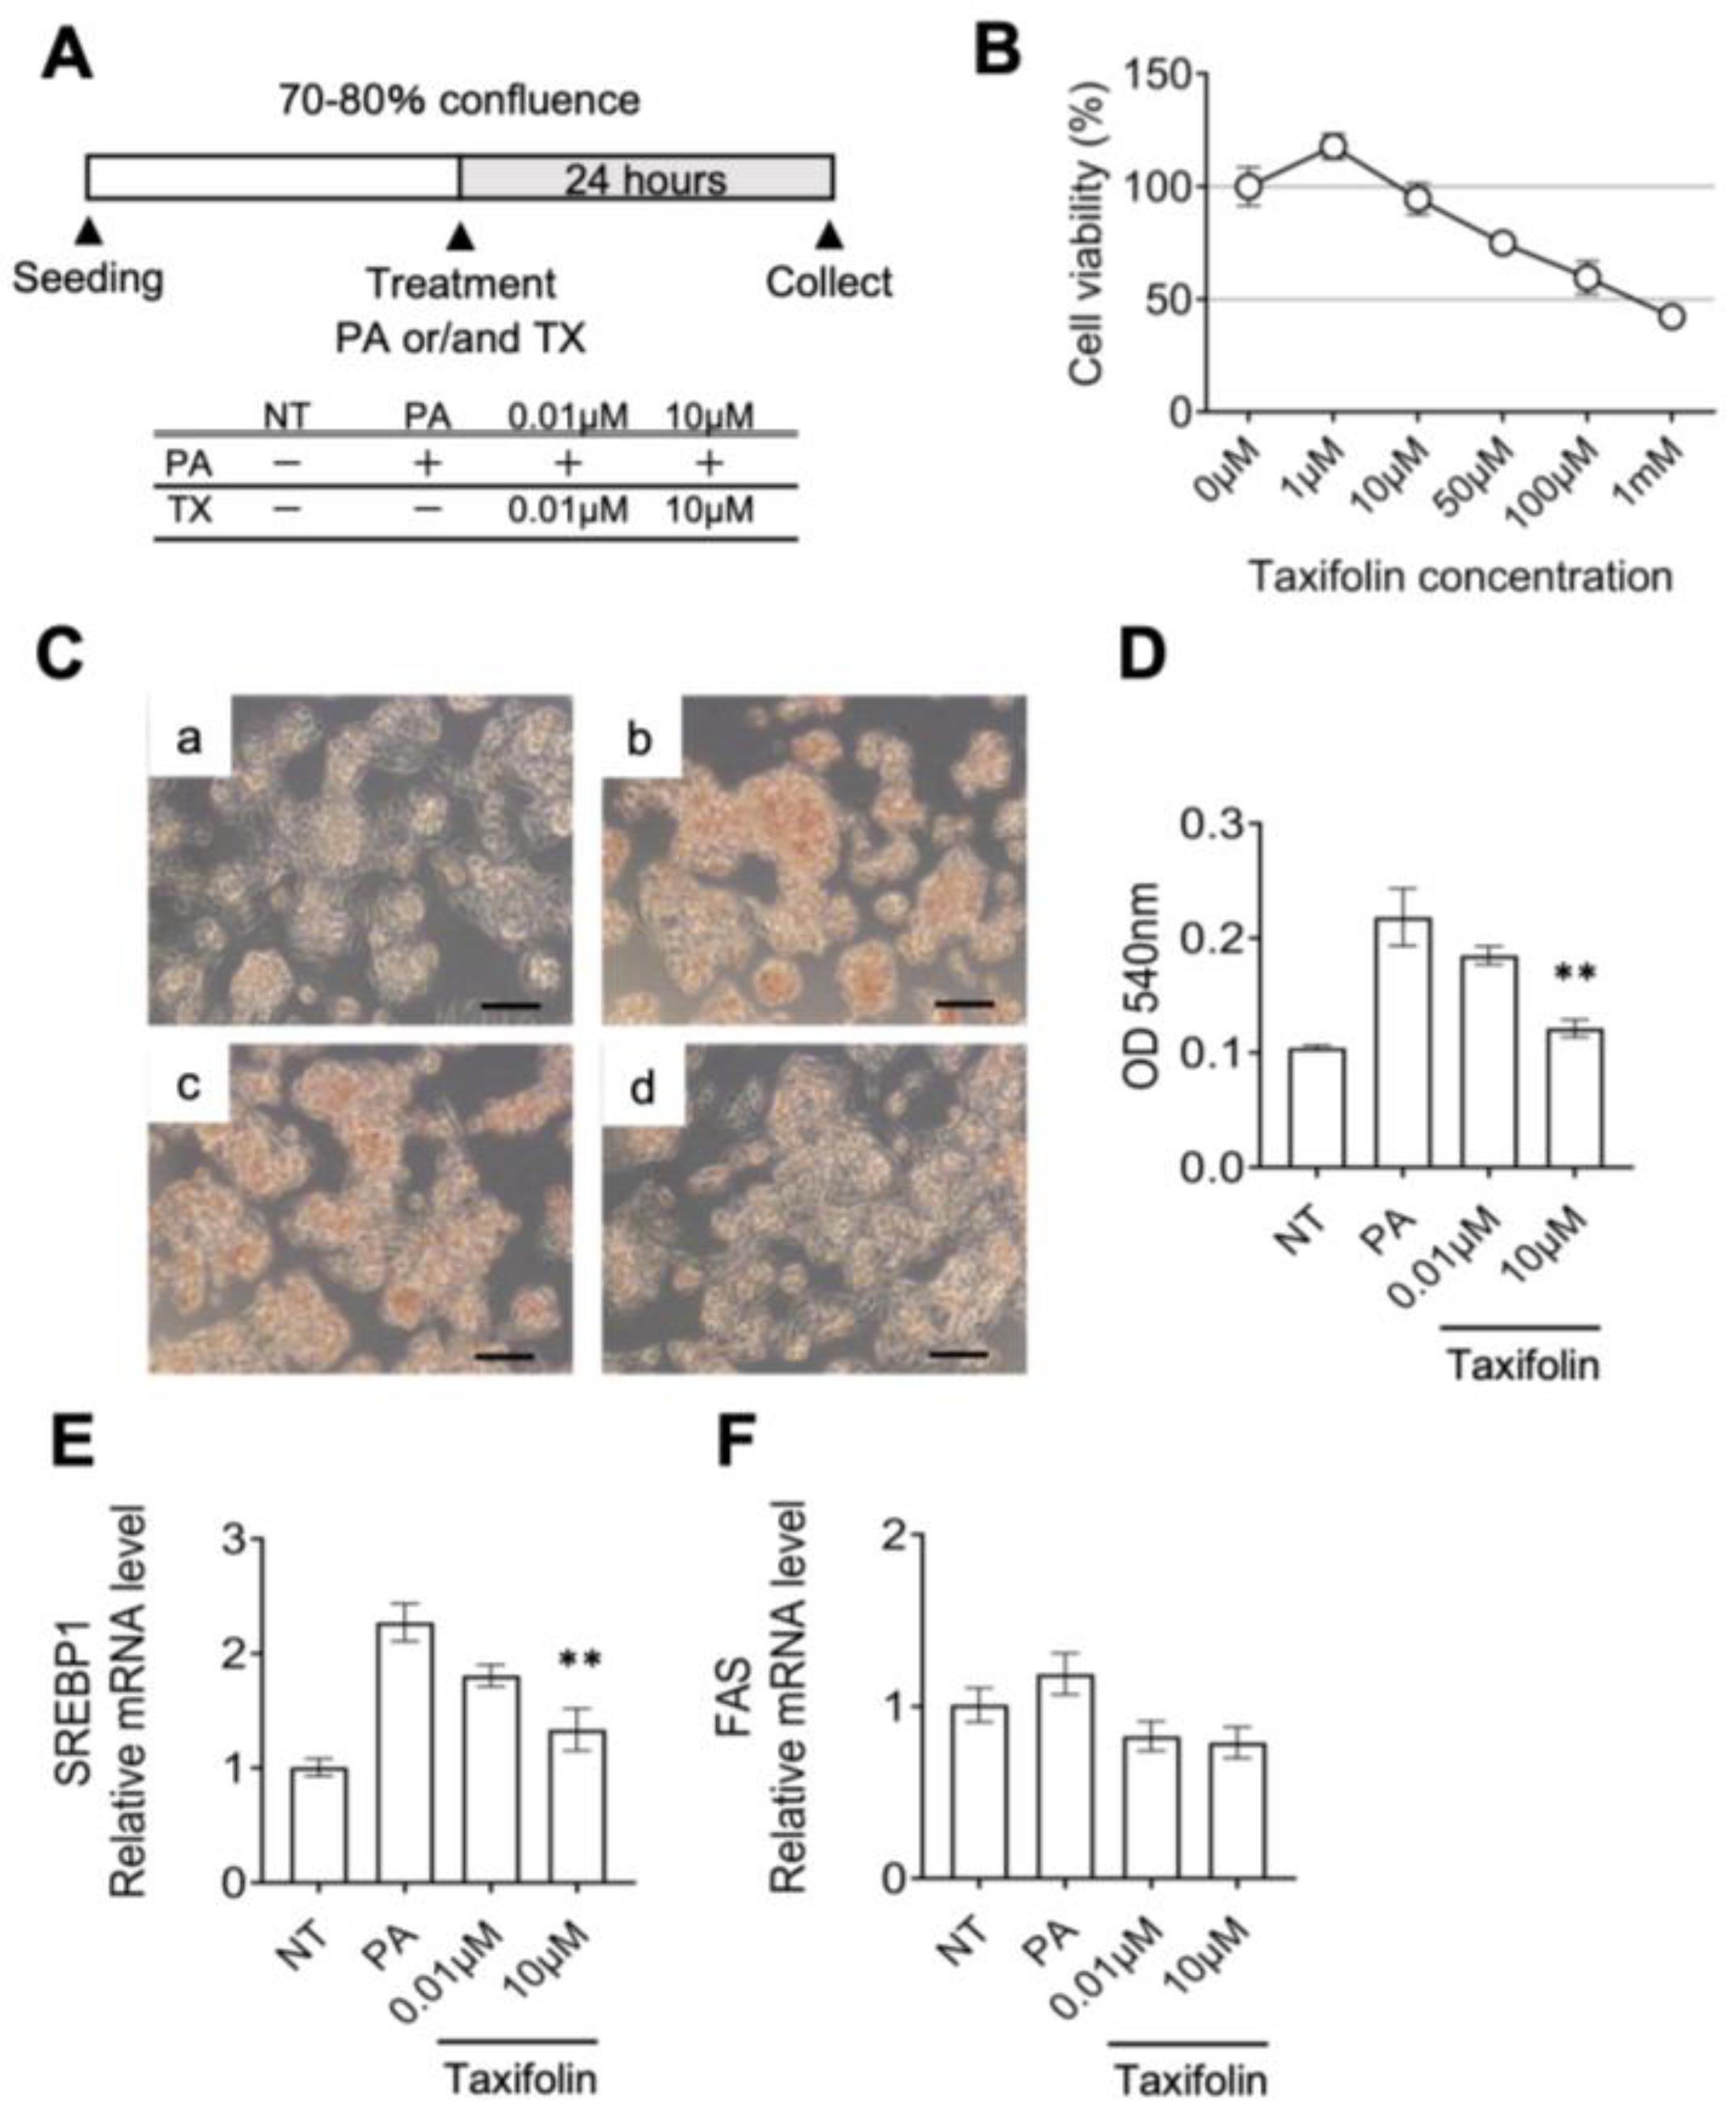
2.11. Experiments Using HepG2
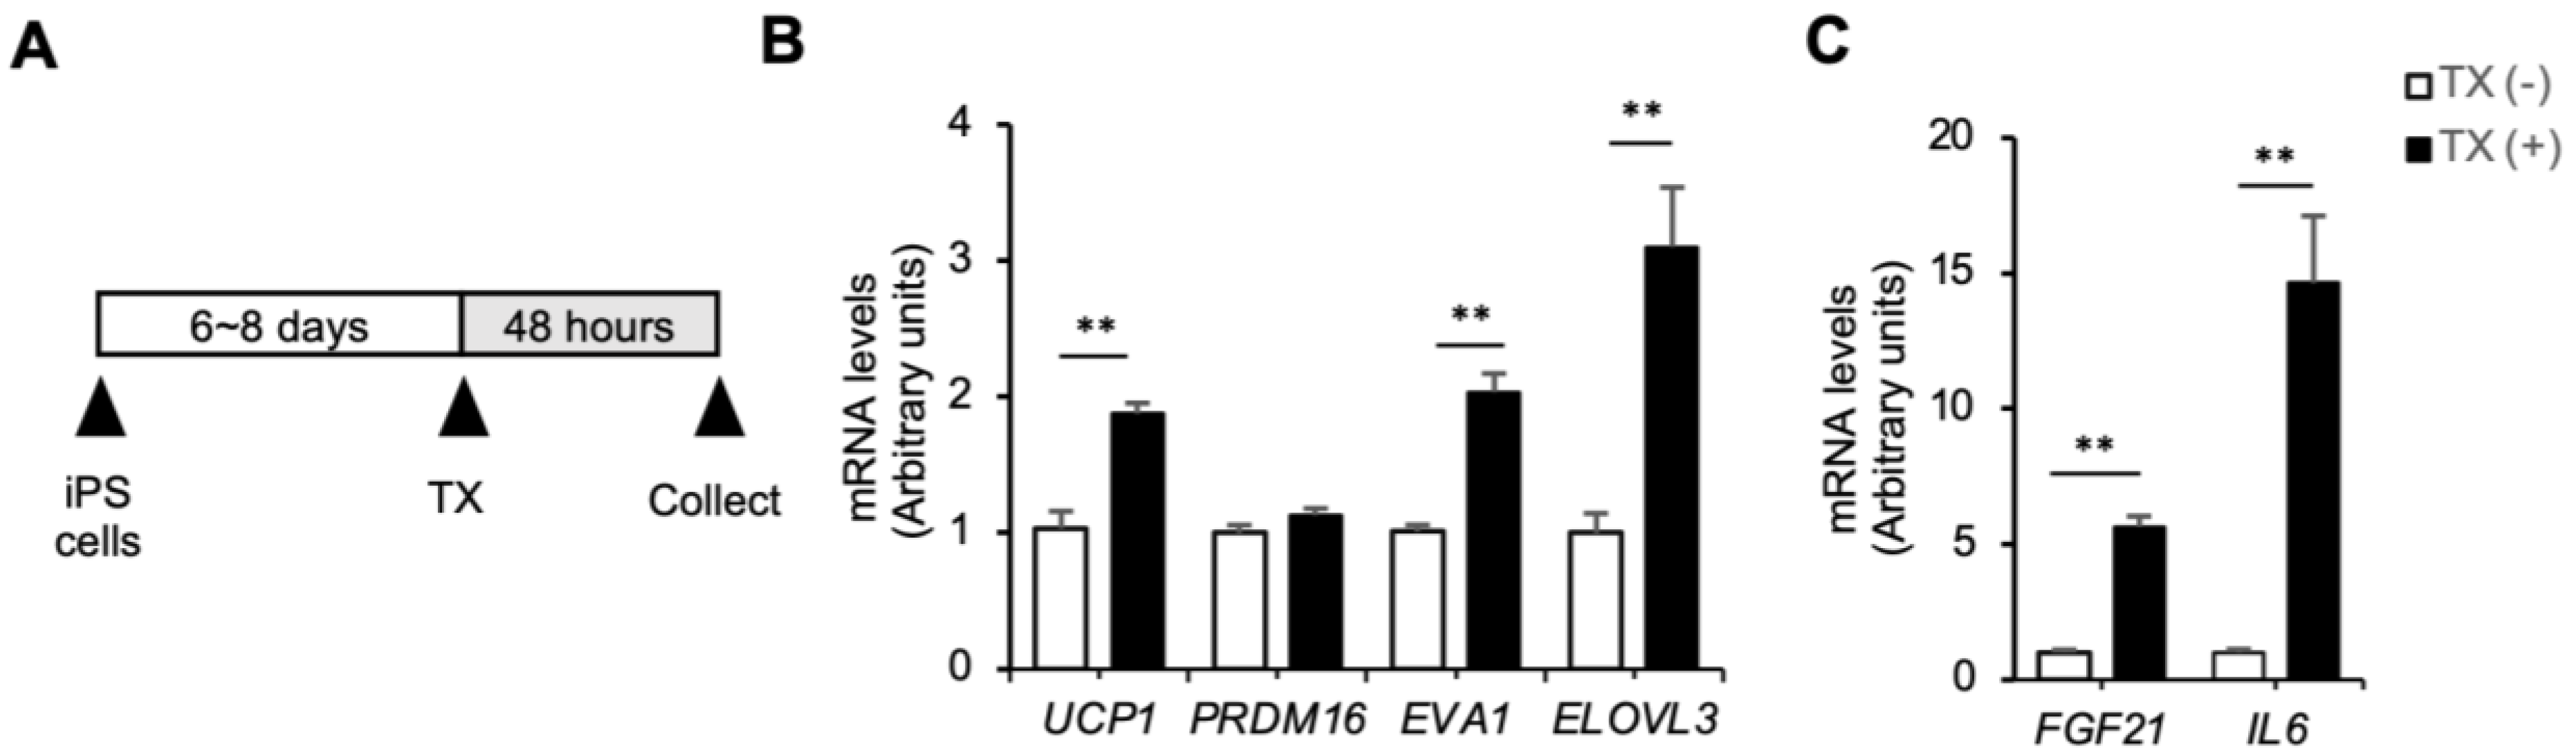
2.12. Experiments Using Human iPS Cell-Derived Brown Adipocytes
2.13. Statistical Analysis
3. Results
3.1. Preventive Effects of Taxifolin on Body Weight Gain, Metabolic Derangements, and Hepatic Steatosis in Diet-Induced Obese Mice
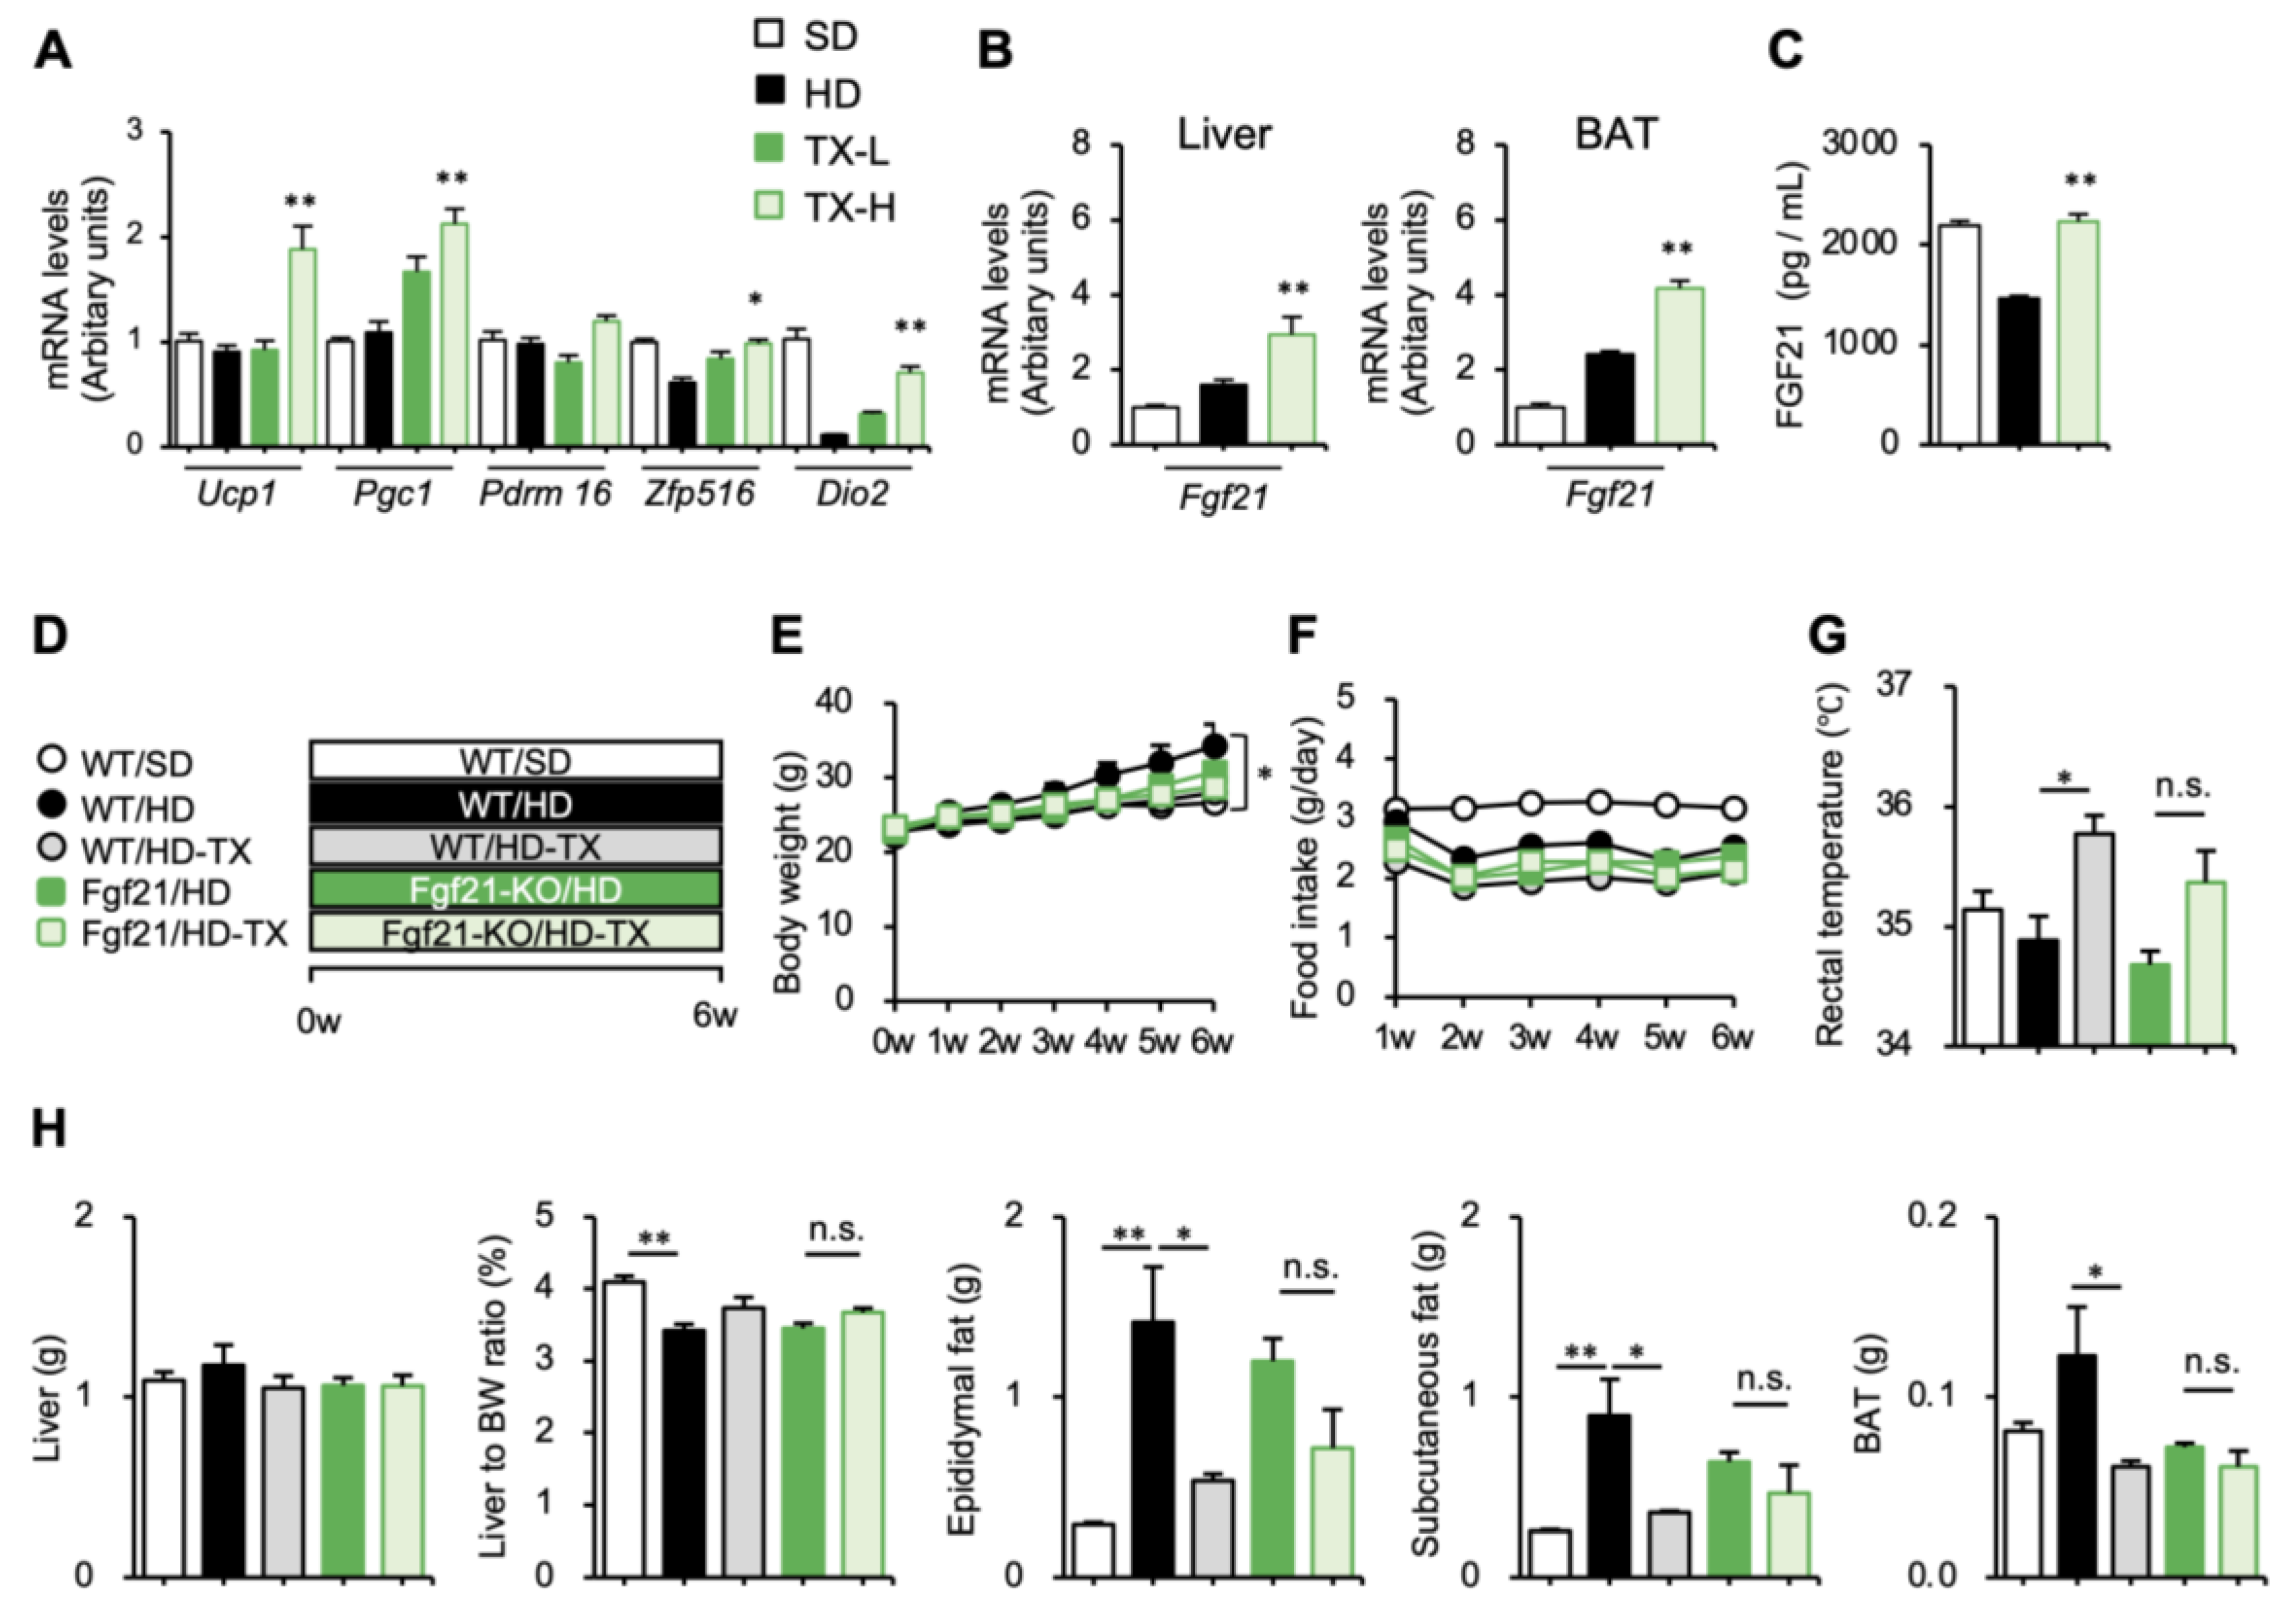
3.2. Molecular Mechanism Underlying the Anti-Obesity Effects of Taxifolin
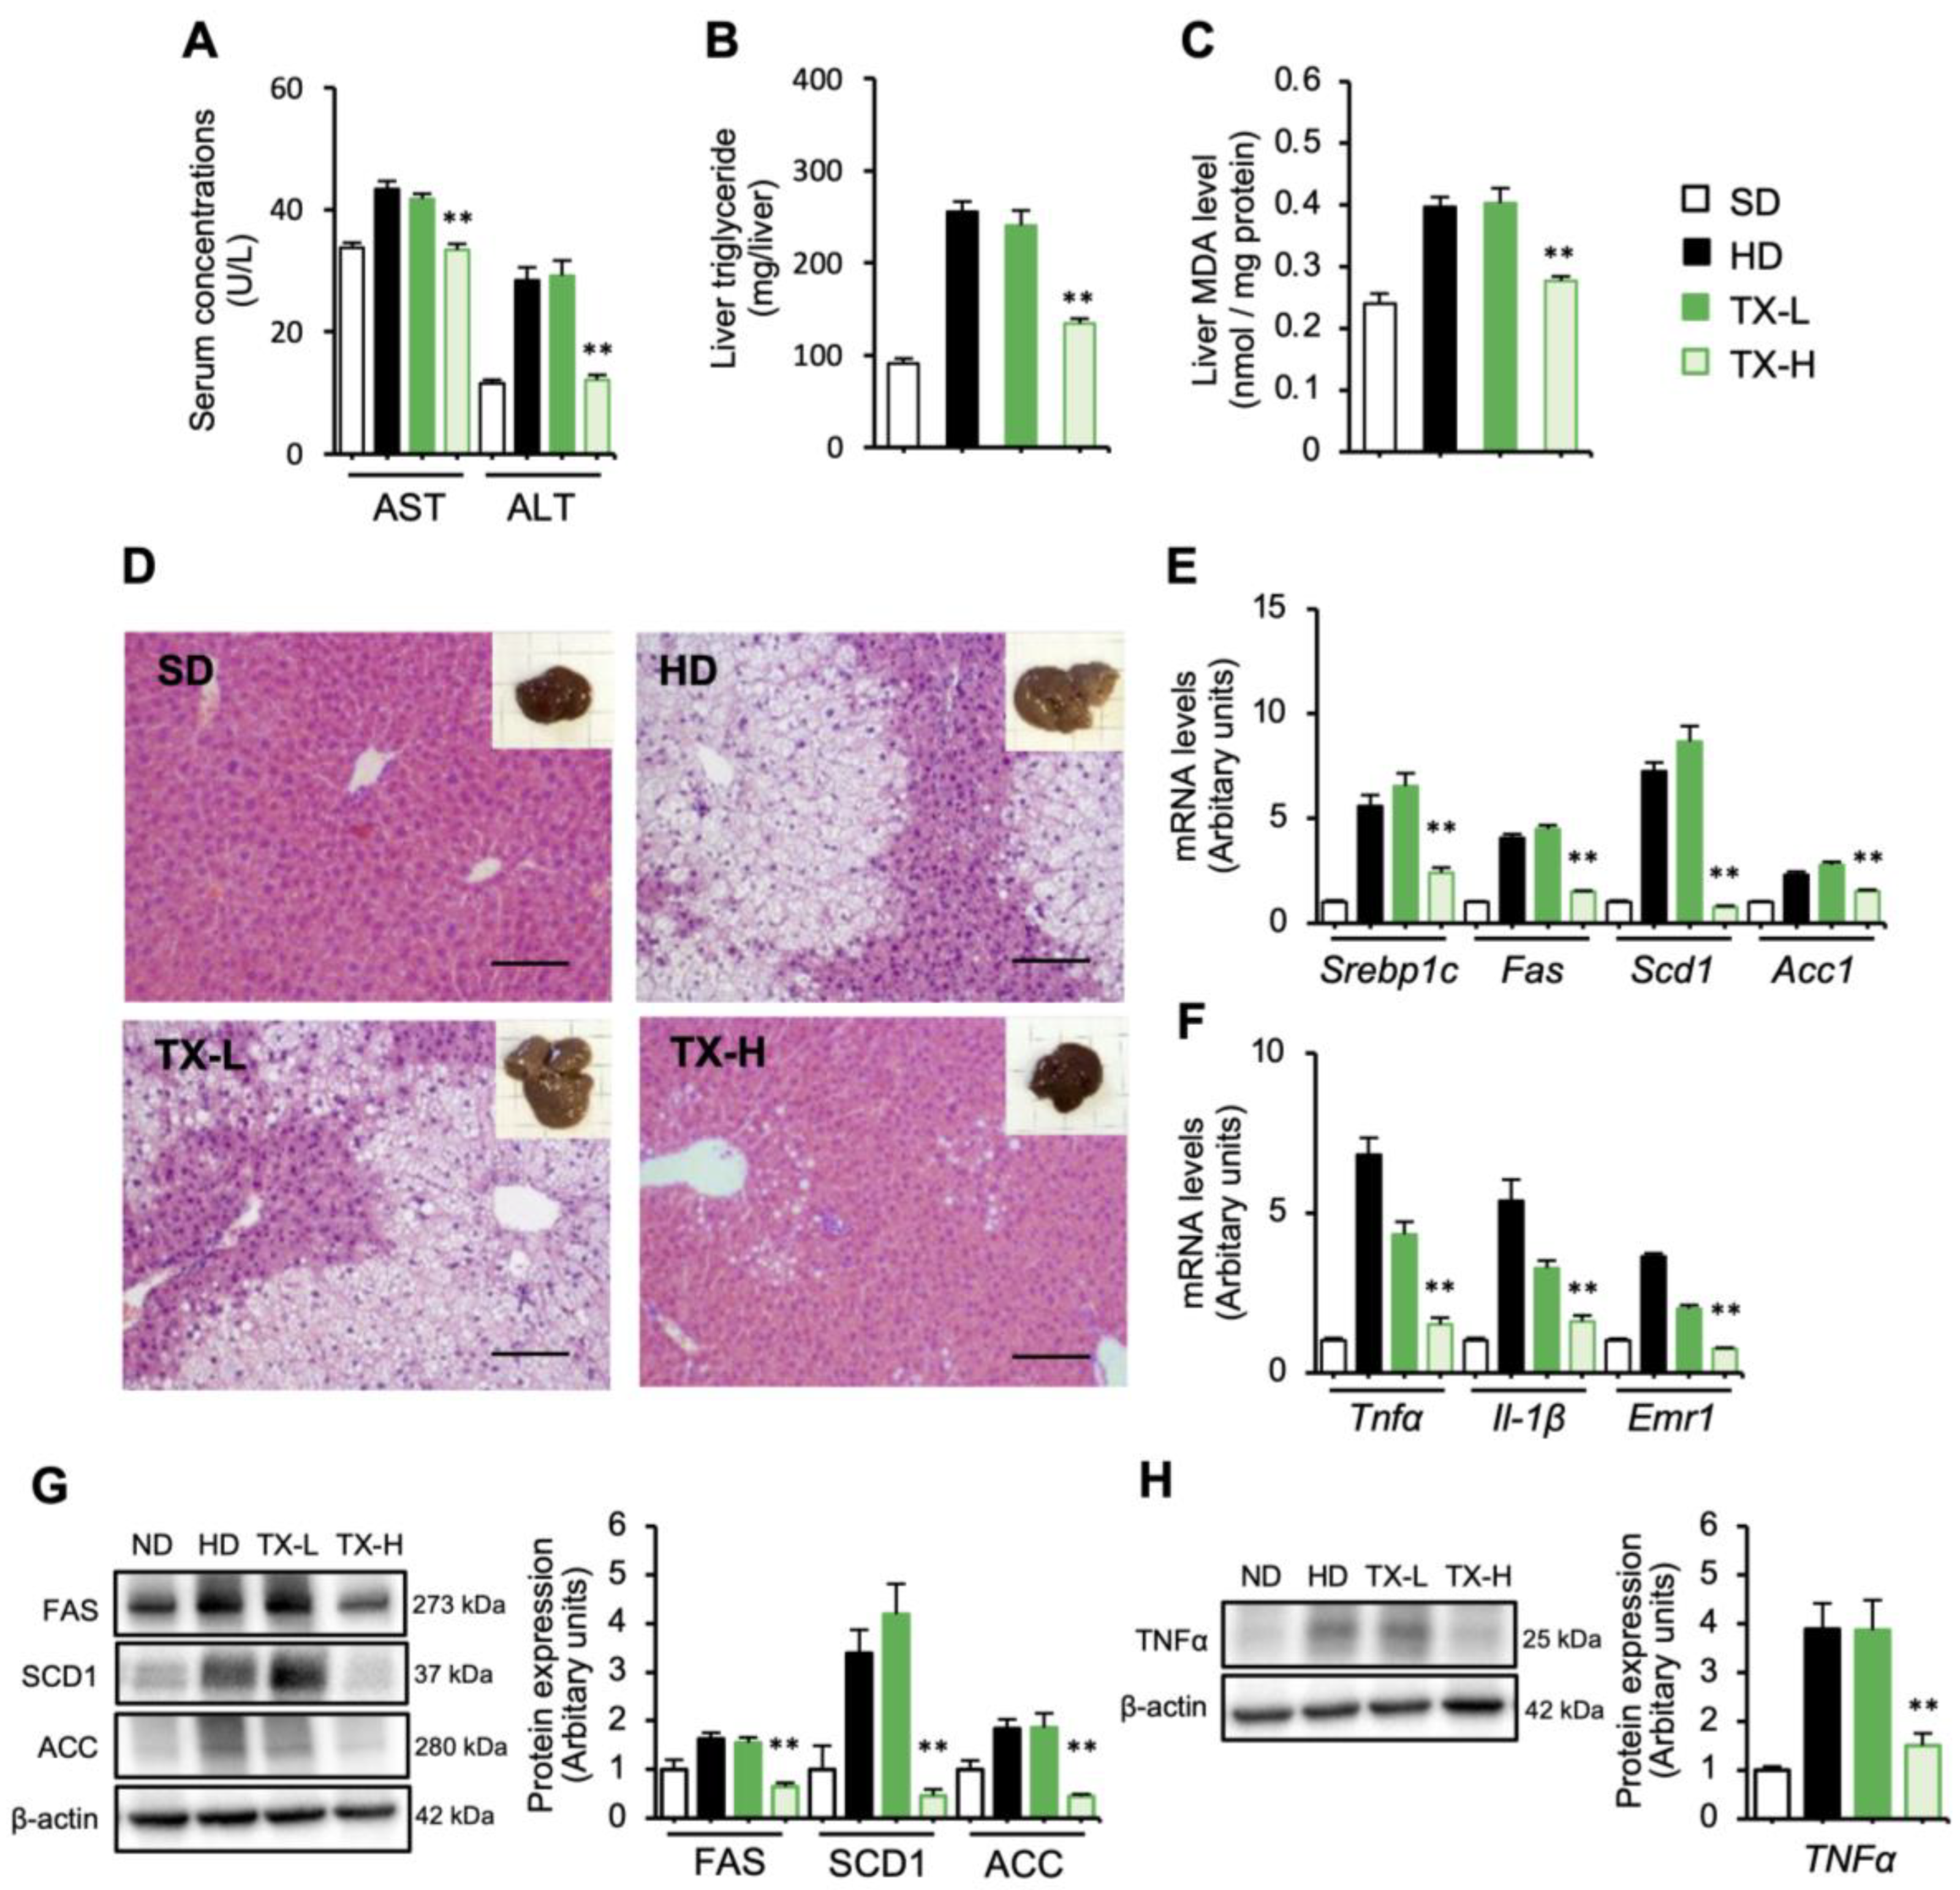
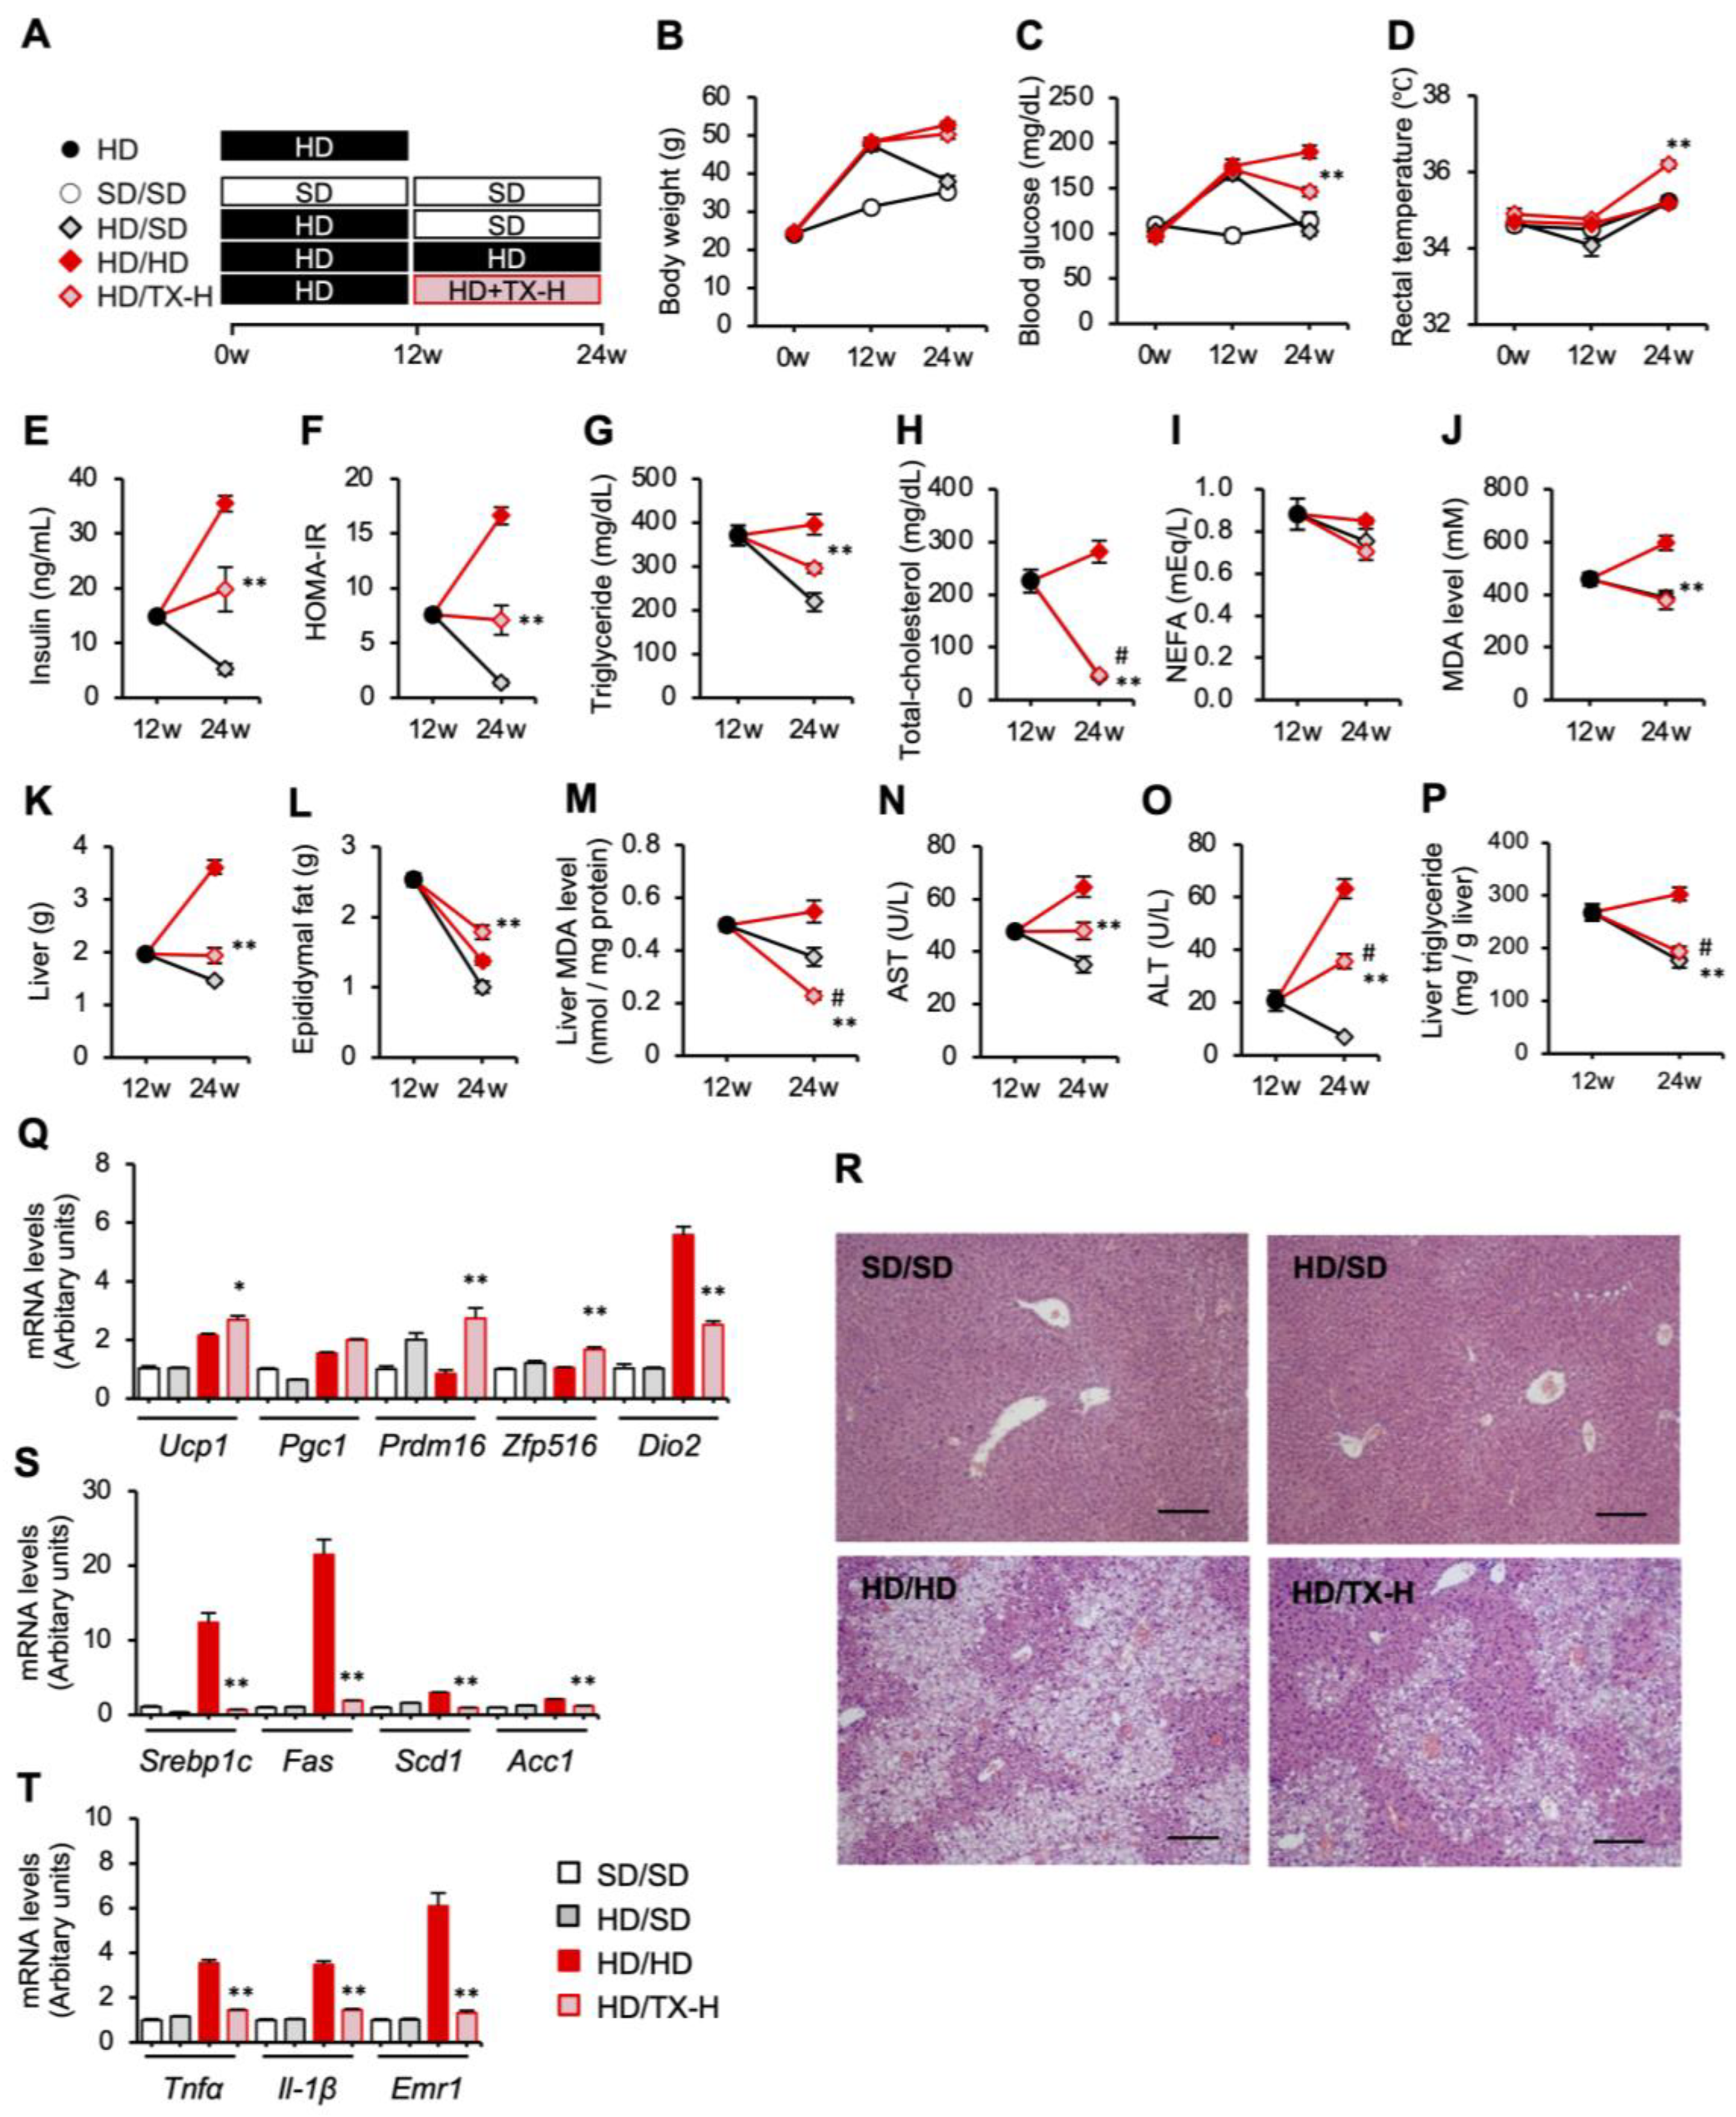
3.3. Therapeutic Effects of Taxifolin on Hepatic Steatosis in Diet-Induced Obese Mice
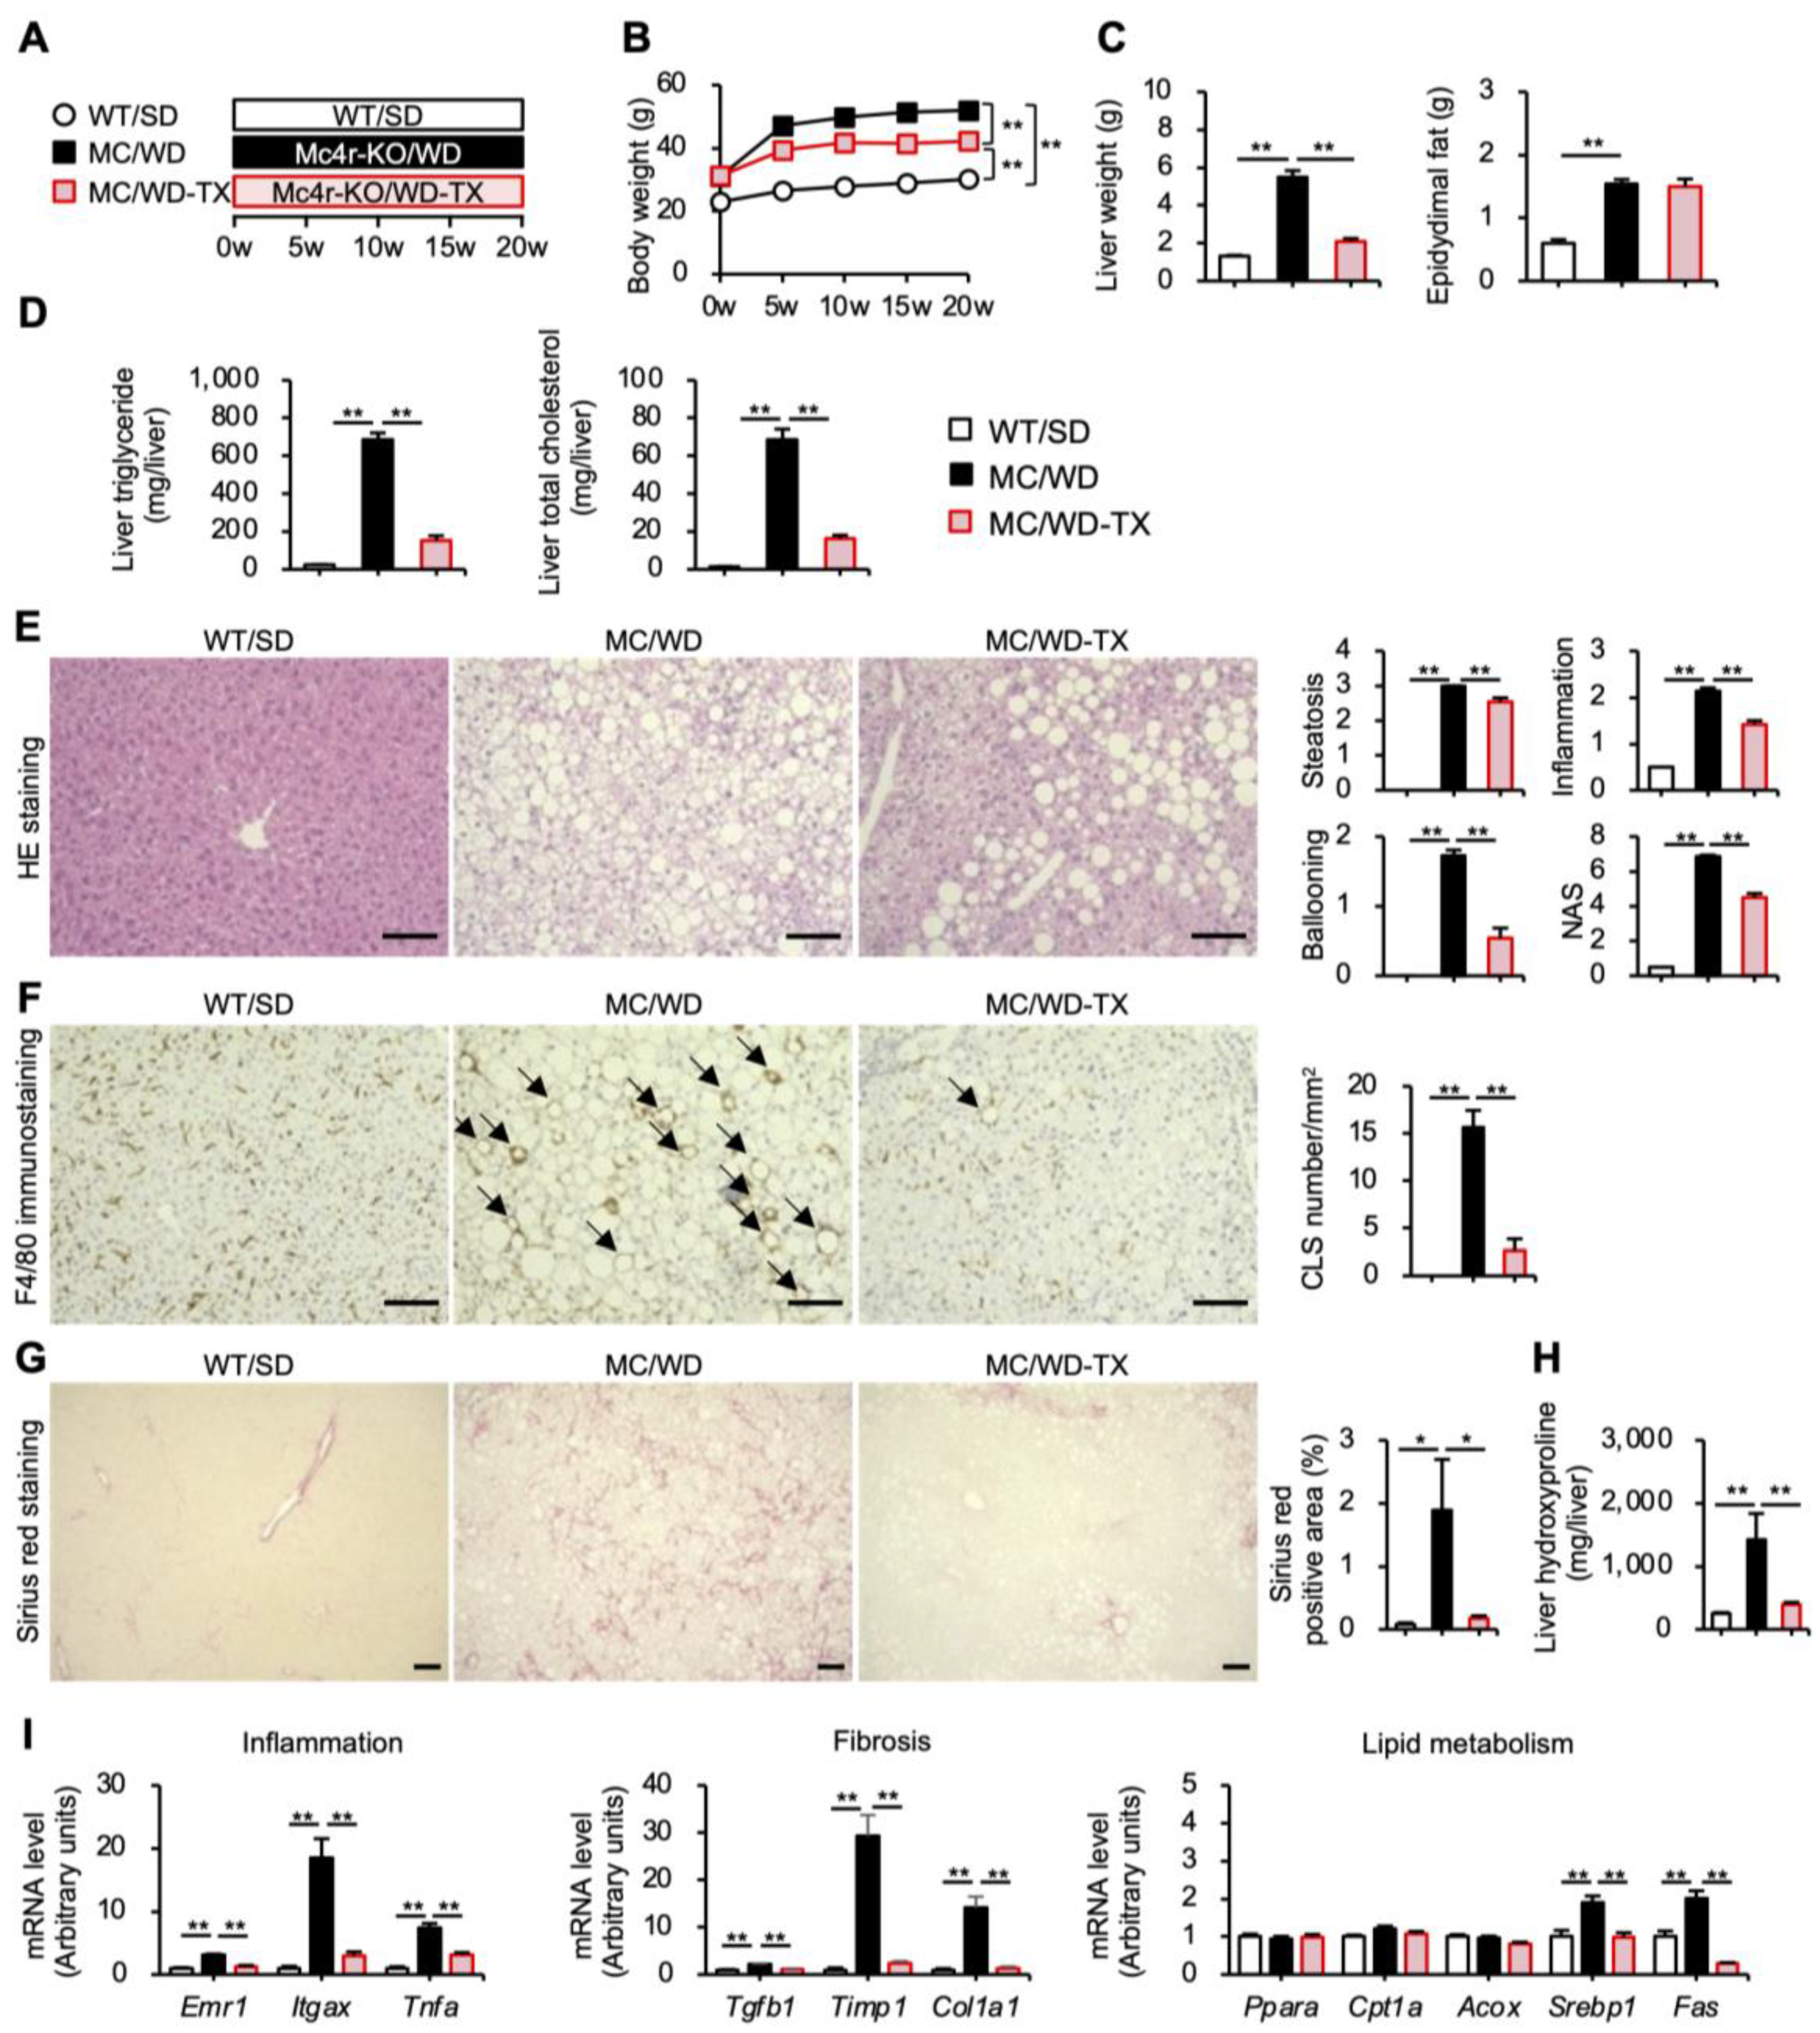
3.4. Preventive Effects of Taxifolin on the Development of NASH in a Murine Model
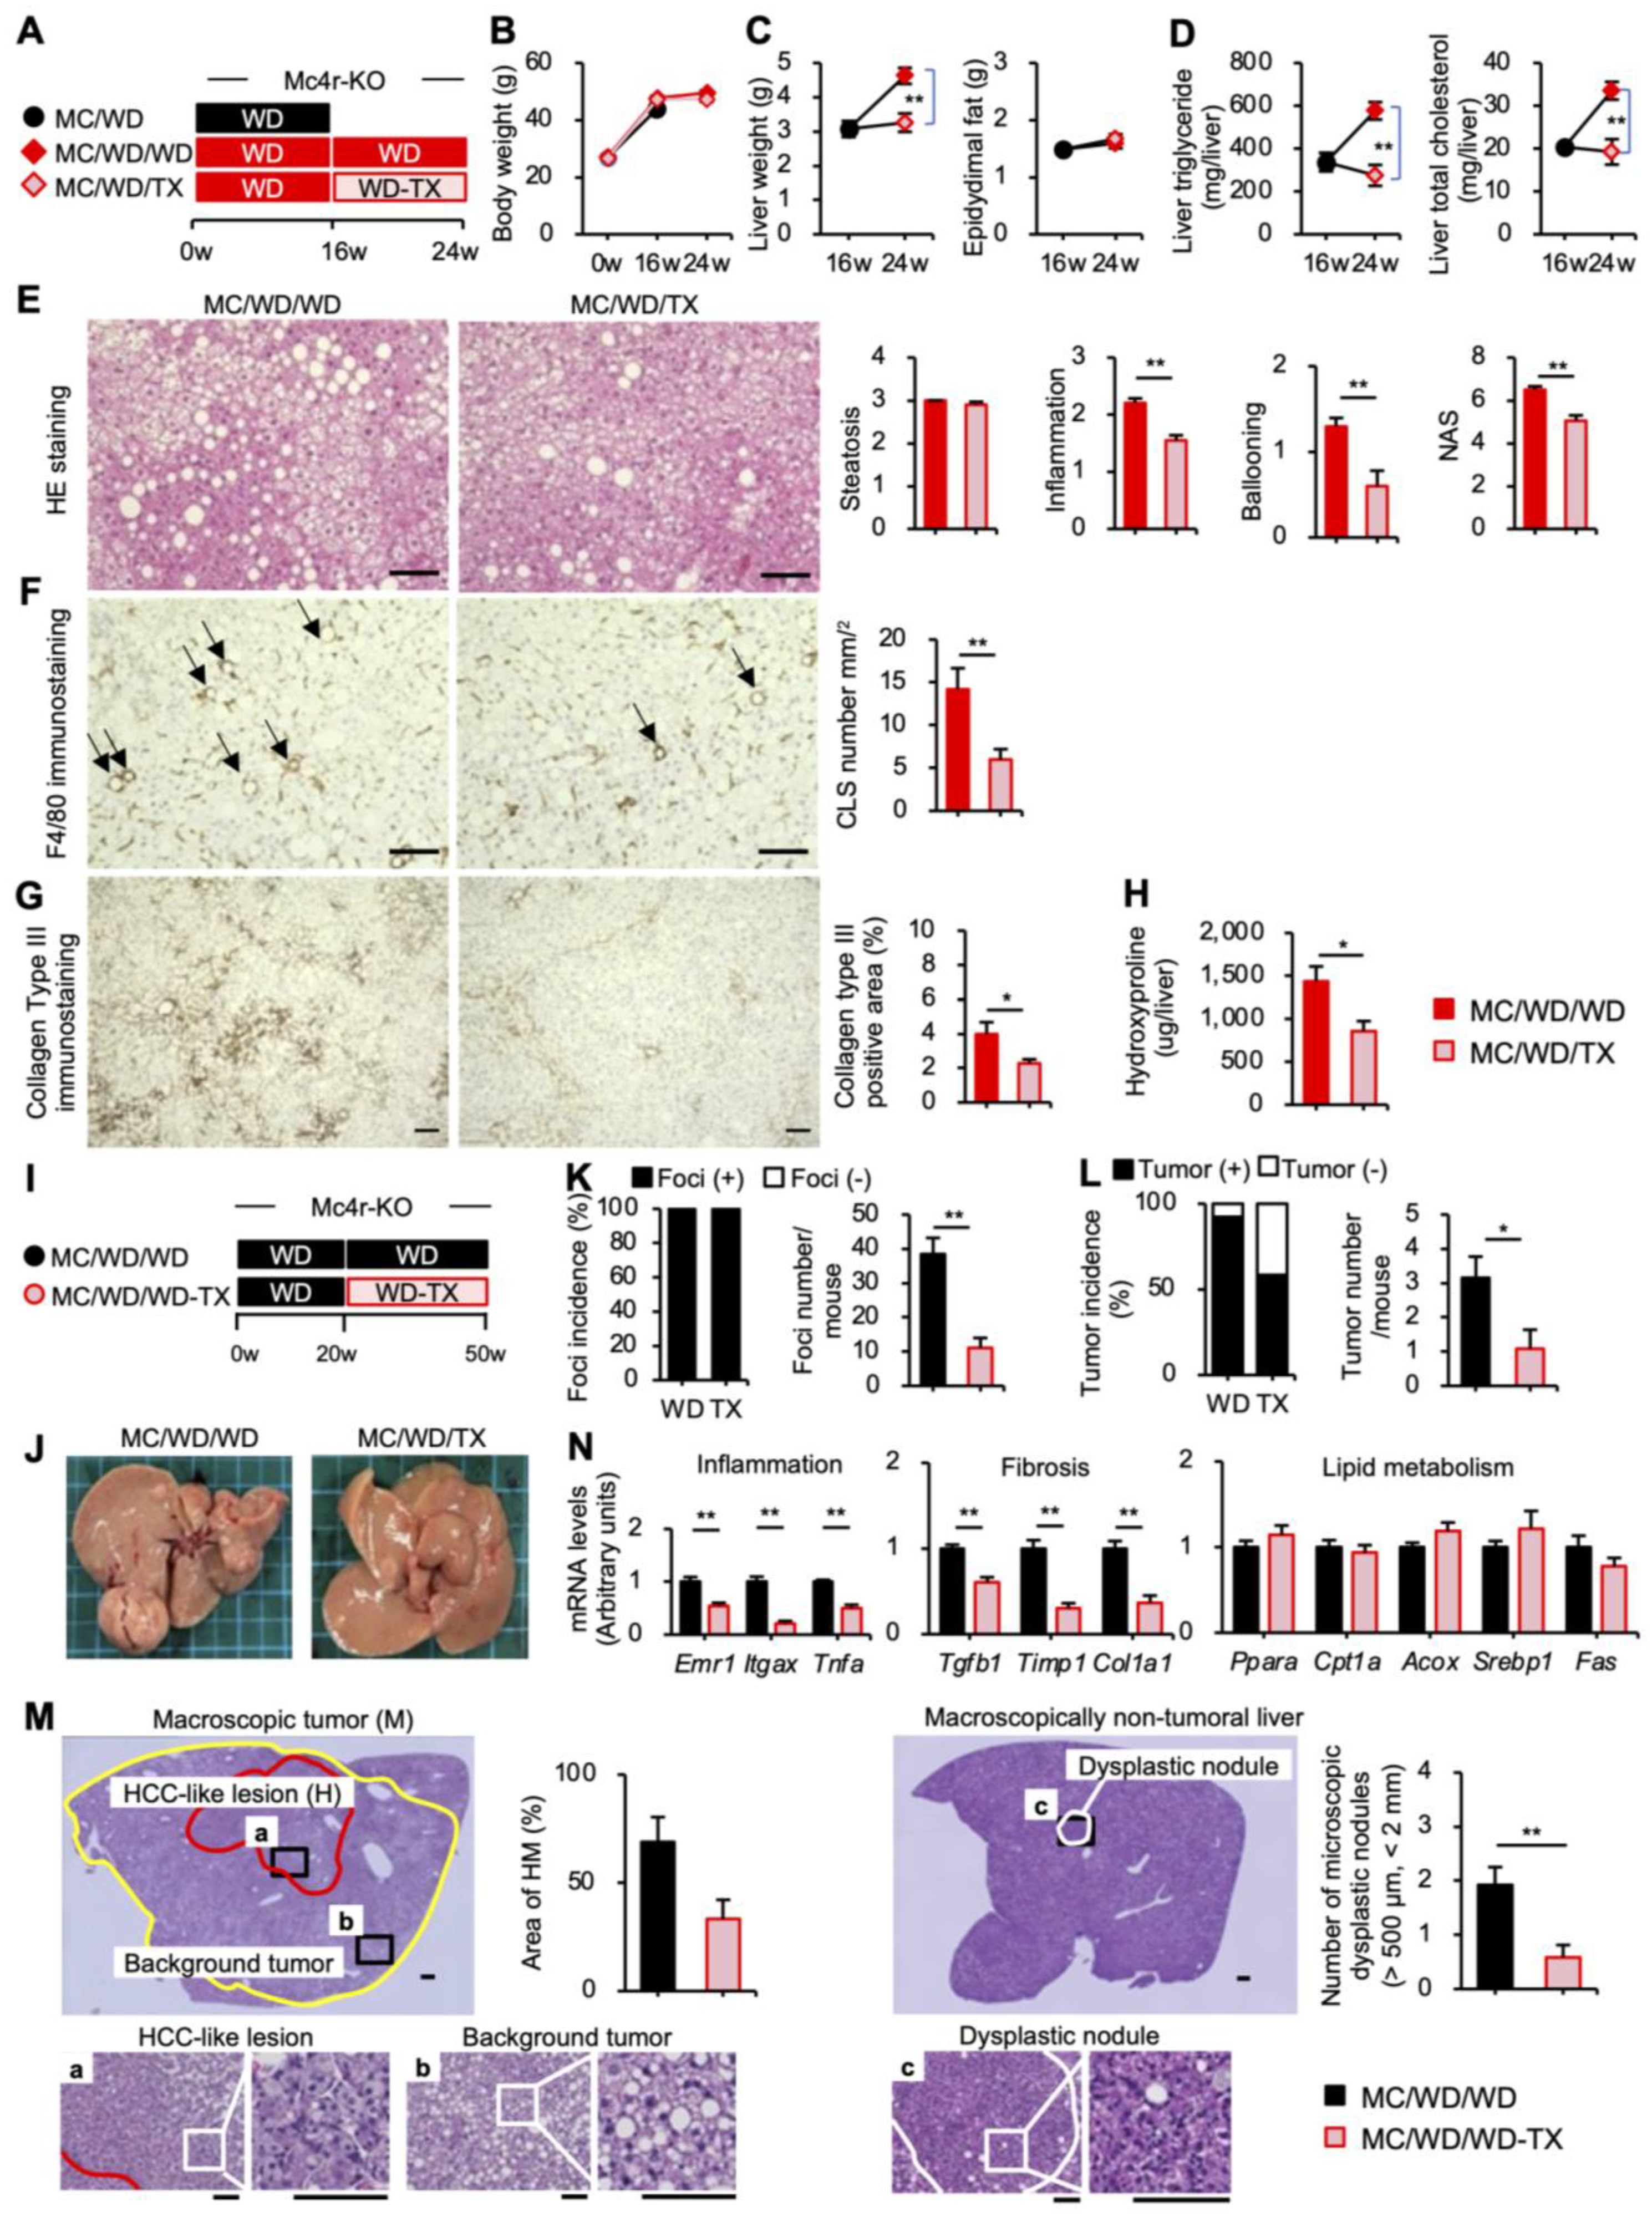
3.5. Therapeutic Effects of Taxifolin during the Progression from NASH to Liver Tumors
4. Discussion
5. Conclusions
Supplementary Materials
Author Contributions
Funding
Institutional Review Board Statement
Informed Consent Statement
Data Availability Statement
Acknowledgments
Conflicts of Interest
References
- Vuppalanchi, R.; Noureddin, M.; Alkhouri, N.; Sanyal, A.J. Therapeutic pipeline in nonalcoholic steatohepatitis. Nat. Rev. Gastroenterol. Hepatol. 2021, 18, 373–392. [Google Scholar] [CrossRef] [PubMed]
- Tilg, H.; Moschen, A.R. Evolution of inflammation in nonalcoholic fatty liver disease. The multiple parallel hits hypothesis. Hepatology 2010, 52, 1836–1846. [Google Scholar] [CrossRef] [PubMed]
- Itoh, M.; Suganami, T.; Nakagawa, N.; Tanaka, M.; Yamamoto, Y.; Kamei, Y.; Terai, S.; Sakaida, I.; Ogawa, Y. Melanocortin 4 receptor-deficient mice as a novel mouse model of nonalcoholic steatohepatitis. Am. J. Pathol. 2011, 79, 2454–2463. [Google Scholar] [CrossRef] [PubMed]
- Yoshioka, N.; Tanaka, M.; Ochi, K.; Watanabe, A.; Ono, K.; Sawada, M.; Ogi, T.; Itoh, M.; Ito, A.; Shiraki, Y.; et al. The sodium-glucose cotransporter-2 inhibitor Tofogliflozin prevents the progression of nonalcoholic steatohepatitis-associated liver tumors in a novel murine model. Biomed. Pharmacother. 2021, 140, 111738. [Google Scholar] [CrossRef] [PubMed]
- Kawakubo, M.; Tanaka, M.; Ochi, K.; Watanabe, A.; Saka-Tanaka, M.; Kanamori, Y.; Yoshioka, N.; Yamashita, S.; Goto, M.; Itoh, M.; et al. Dipeptidyl peptidase-4 inhibition prevents nonalcoholic steatohepatitis-associated liver fibrosis and tumor development in mice independently of its anti-diabetic effects. Sci. Rep. 2020, 10, 983. [Google Scholar] [CrossRef] [PubMed]
- Shiba, K.; Tsuchiya, K.; Komiya, C.; Miyachi, Y.; Mori, K.; Shimazu, N.; Yamaguchi, S.; Ogasawara, N.; Katoh, M.; Itoh, M.; et al. Canagliflozin, an SGLT2 inhibitor, attenuates the development of hepatocellular carcinoma in a mouse model of human NASH. Sci. Rep. 2018, 8, 2362. [Google Scholar] [CrossRef]
- Yang, P.; Xu, F.; Li, H.F.; Wang, Y.; Li, F.C.; Shang, M.Y.; Liu, G.X.; Wang, X.; Cai, S.Q. Detection of 191 Taxifolin Metabolites and Their Distribution in Rats Using HPLC-ESI-IT-TOF-MS(n). Molecules 2016, 21, 1209. [Google Scholar] [CrossRef]
- Das, A.; Baidya, R.; Chakraborty, T.; Samanta, A.K.; Roy, S. Pharmacological basis and new insights of taxifolin: A comprehensive review. Biomed. Pharmacother. 2021, 142, 112004. [Google Scholar] [CrossRef]
- Guo, H.; Zhang, X.; Cui, Y.; Zhou, H.; Xu, D.; Shan, T.; Zhang, F.; Guo, Y.; Chen, Y.; Wu, D. Taxifolin protects against cardiac hypertrophy and fibrosis during biomechanical stress of pressure overload. Toxicol. Appl. Pharmacol. 2015, 287, 168–177. [Google Scholar] [CrossRef]
- Wang, Y.H.; Wang, W.Y.; Chang, C.C.; Liou, K.T.; Sung, Y.J.; Liao, J.F.; Chen, C.F.; Chang, S.; Hou, Y.C.; Chou, Y.C.; et al. Taxifolin ameliorates cerebral ischemia-reperfusion injury in rats through its anti-oxidative effect and modulation of NF-kappa B activation. J. Biomed. Sci. 2006, 13, 127–141. [Google Scholar] [CrossRef]
- Inoue, T.; Saito, S.; Tanaka, M.; Yamakage, H.; Kusakabe, T.; Shimatsu, A.; Ihara, M.; Satoh-Asahara, N. Pleiotropic neuroprotective effects of taxifolin in cerebral amyloid angiopathy. Proc. Natl. Acad. Sci. USA 2019, 116, 10031–10038. [Google Scholar] [CrossRef]
- Saito, S.; Yamamoto, Y.; Maki, T.; Hattori, Y.; Ito, H.; Mizuno, K.; Harada-Shiba, M.; Kalaria, R.N.; Fukushima, M.; Takahashi, R.; et al. Taxifolin inhibits amyloid-beta oligomer formation and fully restores vascular integrity and memory in cerebral amyloid angiopathy. Acta Neuropathol. Commun. 2017, 5, 26. [Google Scholar] [CrossRef]
- Su, H.; Wang, W.J.; Zheng, G.D.; Yin, Z.P.; Li, J.E.; Chen, L.L.; Zhang, Q.F. The anti-obesity and gut microbiota modulating effects of taxifolin in C57BL/6J mice fed with a high-fat diet. J. Sci. Food Agric. 2022, 102, 1598–1608. [Google Scholar] [CrossRef]
- Kondo, S.; Adachi, S.I.; Yoshizawa, F.; Yagasaki, K. Antidiabetic Effect of Taxifolin in Cultured L6 Myotubes and Type 2 Diabetic Model KK-A(y)/Ta Mice with Hyperglycemia and Hyperuricemia. Curr. Issues Mol. Biol. 2021, 43, 1293–1306. [Google Scholar] [CrossRef]
- Rehman, K.; Chohan, T.A.; Waheed, I.; Gilani, Z.; Akash, M.S.H. Taxifolin prevents postprandial hyperglycemia by regulating the activity of alpha-amylase: Evidence from an in vivo and in silico studies. J. Cell. Biochem. 2019, 120, 425–438. [Google Scholar] [CrossRef]
- Yu, X.; Hussein, S.; Li, L.; Liu, Q.; Ban, Z.; Jiang, H. Effect of Dihydroquercetin on Energy Metabolism in LPS-Induced Inflammatory Mice. Biomed. Res Int. 2022, 2022, 6491771. [Google Scholar] [CrossRef]
- Yang, C.L.; Lin, Y.S.; Liu, K.F.; Peng, W.H.; Hsu, C.M. Hepatoprotective Mechanisms of Taxifolin on Carbon Tetrachloride-Induced Acute Liver Injury in Mice. Nutrients 2019, 11, 2655. [Google Scholar] [CrossRef]
- Liu, X.; Liu, W.; Ding, C.; Zhao, Y.; Chen, X.; Ling, D.; Zheng, Y.; Cheng, Z. Taxifolin, Extracted from Waste Larix olgensis Roots, Attenuates CCl4-Induced Liver Fibrosis by Regulating the PI3K/AKT/mTOR and TGF-beta1/Smads Signaling Pathways. Drug Des. Devel. Ther. 2021, 15, 871–887. [Google Scholar] [CrossRef]
- Ding, C.; Zhao, Y.; Chen, X.; Zheng, Y.; Liu, W.; Liu, X. Taxifolin, a novel food, attenuates acute alcohol-induced liver injury in mice through regulating the NF-kappaB-mediated inflammation and PI3K/Akt signalling pathways. Pharm. Biol. 2021, 59, 868–879. [Google Scholar] [CrossRef]
- Tanaka, M.; Saka-Tanaka, M.; Ochi, K.; Fujieda, K.; Sugiura, Y.; Miyamoto, T.; Kohda, H.; Ito, A.; Miyazawa, T.; Matsumoto, A.; et al. C-type lectin Mincle mediates cell death-triggered inflammation in acute kidney injury. J. Exp. Med. 2020, 217, e20192230. [Google Scholar] [CrossRef]
- Tanaka, M.; Ikeda, K.; Suganami, T.; Komiya, C.; Ochi, K.; Shirakawa, I.; Hamaguchi, M.; Nishimura, S.; Manabe, I.; Matsuda, T.; et al. Macrophage-inducible C-type lectin underlies obesity-induced adipose tissue fibrosis. Nat. Commun. 2014, 5, 4982. [Google Scholar] [CrossRef] [PubMed]
- Inoue, T.; Yamakage, H.; Tanaka, M.; Kusakage, T.; Shimatsu, A.; Satoh-Asahara, N. Oxytocin Suppresses Inflammatory Responses Induced by Lipopolysaccharide through Inhibition of the eIF-2-ATF4 Pathway in Mouse Microglia. Cells 2019, 8, 527. [Google Scholar] [CrossRef] [PubMed]
- Kanamori, Y.; Tanaka, M.; Itoh, M.; Ochi, K.; Ito, A.; Hidaka, I.; Sakaida, I.; Ogawa, Y.; Suganami, T. Iron-rich Kupffer cells exhibit phenotypic changes during the development of liver fibrosis in NASH. iScience 2021, 24, 102032. [Google Scholar] [CrossRef] [PubMed]
- Seo, M.H.; Lee, J.; Hong, S.W.; Rhee, E.J.; Park, S.E.; Park, C.Y.; Oh, K.W.; Park, S.W.; Lee, W.Y. Exendin-4 Inhibits Hepatic Lipogenesis by Increasing be-ta Catenin Signaling. PLoS ONE 2016, 11, e0166913. [Google Scholar] [CrossRef] [PubMed]
- Nishio, M.; Yoneshiro, T.; Nakahara, M.; Suzuki, S.; Saeki, K.; Hasegawa, M.; Kawai, Y.; Akutsu, H.; Umezawa, A.; Yasuda, K.; et al. Production of functional classical brown adipocytes from human pluripotent stem cells using specific hemopoietin cocktail without gene transfer. Cell Metab. 2012, 16, 394–406. [Google Scholar] [CrossRef]
- Villarroya, F.; Cereijo, R.; Villarroya, J.; Giralt, M. Brown adipose tissue as a secretory organ. Nat. Rev. Endocrinol. 2017, 13, 26–35. [Google Scholar] [CrossRef]
- Itoh, M.; Kato, H.; Suganami, T.; Konuma, K.; Marumoto, Y.; Terai, S.; Sakugawa, H.; Kanai, S.; Hamaguchi, M.; Fukaishi, T.; et al. Hepatic crown-like structure: A unique histological feature in non-alcoholic steatohepatitis in mice and humans. PLoS ONE 2013, 8, e82163. [Google Scholar] [CrossRef]
- Itoh, M.; Suganami, T.; Kato, H.; Kanai, S.; Shirakawa, I.; Sakai, T.; Goto, T.; Asakawa, M.; Hidaka, I.; Sakugawa, H.; et al. CD11c+ resident macrophages drive hepatocyte death-triggered liver fibrosis in a murine model of nonalcoholic steatohepatitis. JCI Insight 2017, 2, e92902. [Google Scholar] [CrossRef]
- Tsochatzis, E.A.; Newsome, P.N. Non-alcoholic fatty liver disease and the interface between primary and secondary care. Lancet Gastroenterol. Hepatol. 2018, 3, 509–517. [Google Scholar] [CrossRef]
- Cypess, A.M.; Lehman, S.; Williams, G.; Tal, I.; Rodman, D.; Goldfine, A.B.; Kuo, F.C.; Palmer, E.L.; Tseng, Y.H.; Doria, A.; et al. Identification and importance of brown adipose tissue in adult humans. N. Engl. J. Med. 2009, 360, 1509–1517. [Google Scholar] [CrossRef]
- Ouellet, V.; Routhier-Labadie, A.; Bellemare, W.; Lakhal-Chaieb, L.; Turcotte, E.; Carpentier, A.C.; Richard, D. Outdoor temperature, age, sex, body mass index, and diabetic status determine the prevalence, mass, and glucose-uptake activity of 18F-FDG-detected BAT in humans. J. Clin. Endocrinol. Metab. 2011, 96, 192–199. [Google Scholar] [CrossRef]
- Saito, M.; Okamatsu-Ogura, Y.; Matsushita, M.; Watanabe, K.; Yoneshiro, T.; Nio-Kobayashi, J.; Iwanaga, T.; Miyagawa, M.; Kameya, T.; Nakada, K.; et al. High incidence of metabolically active brown adipose tissue in healthy adult humans: Effects of cold exposure and adiposity. Diabetes 2009, 58, 1526–1531. [Google Scholar] [CrossRef]
- Orava, J.; Nuutila, P.; Noponen, T.; Parkkola, R.; Viljanen, T.; Enerback, S.; Rissanen, A.; Pietilainen, K.H.; Virtanen, K.A. Blunted metabolic responses to cold and insulin stimulation in brown adipose tissue of obese humans. Obesity 2013, 21, 2279–2287. [Google Scholar] [CrossRef]
- Beijer, E.; Schoenmakers, J.; Vijgen, G.; Kessels, F.; Dingemans, A.M.; Schrauwen, P.; Wouters, M.; van Marken Lichtenbelt, W.; Teule, J.; Brans, B. A role of active brown adipose tissue in cancer cachexia? Oncol. Rev. 2012, 6, e11. [Google Scholar] [CrossRef]
- Tsoli, M.; Moore, M.; Burg, D.; Painter, A.; Taylor, R.; Lockie, S.H.; Turner, N.; Warren, A.; Cooney, G.; Oldfield, B.; et al. Activation of thermogenesis in brown adipose tissue and dysregulated lipid metabolism associated with cancer cachexia in mice. Cancer Res. 2012, 72, 4372–4382. [Google Scholar] [CrossRef]
- Zhao, M.; Chen, J.; Zhu, P.; Fujino, M.; Takahara, T.; Toyama, S.; Tomita, A.; Zhao, L.; Yang, Z.; Hei, M.; et al. Dihydroquercetin (DHQ) ameliorated concanavalin A-induced mouse experimental fulminant hepatitis and enhanced HO-1 expression through MAPK/Nrf2 antioxidant pathway in RAW cells. Int. Immunopharmacol. 2015, 28, 938–944. [Google Scholar] [CrossRef]
- Zhang, H.; Wang, Y.J.; Yang, G.T.; Gao, Q.L.; Tang, M.X. Taxifolin Inhibits Receptor Activator of NF-κB Ligand-Induced Osteoclastogenesis of Human Bone Marrow-Derived Macrophages in vitro and Prevents Lipopolysaccharide-Induced Bone Loss in vivo. Pharmacology 2019, 103, 101–109. [Google Scholar] [CrossRef]
- Ametis JSC. Taxifolin from Dahurian Larch-Application for the Approval as Novel Food; Regulation (EC) No 258/97 of the European Parliament and of the Council of 27th January 1997 Concerning Novel Foods and Novel Food Ingredients, 2010; Ametis JSC: Blagoveshchensk, Russia, 2010. [Google Scholar]
- Muramatsu, D.; Uchiyama, H.; Kida, H.; Iwai, A. In vitro anti-inflammatory and anti-lipid accumulation properties of taxifolin-rich extract from the Japanese larch, Larix kaempferi. Heliyon 2020, 6, e05505. [Google Scholar] [CrossRef]
- Lei, L.; Chai, Y.; Lin, H.; Chen, C.; Zhao, M.; Xiong, W.; Zhuang, J.; Fan, X. Dihydroquercetin Activates AMPK/Nrf2/HO-1 Signaling in Macrophages and Attenuates Inflammation in LPS-Induced Endotoxemic Mice. Front. Pharmacol. 2020, 11, 662. [Google Scholar] [CrossRef]
- Jeong, S.Y.; Choi, W.S.; Kwon, O.S.; Lee, J.S.; Son, S.Y.; Lee, C.H.; Lee, S.; Song, J.Y.; Lee, Y.J.; Lee, J.Y. Extract of Pinus densiflora needles suppresses acute inflammation by regulating inflammatory mediators in RAW264.7 macrophages and mice. Pharm. Biol. 2022, 60, 1148–1159. [Google Scholar] [CrossRef]
- Varlamova, E.; Goltyaev, M.V.; Simakin, A.V.; Gudkov, S.V.; Turovsky, E.A. Comparative Analysis of the Cytotoxic Effect of a Complex of Selenium Nanoparticles Doped with Sorafenib, “Naked” Selenium Nanoparticles, and Sorafenib on Human Hepatocyte Carcinoma HepG2 Cells. Int. J. Mol. Sci. 2022, 23, 6641. [Google Scholar] [CrossRef] [PubMed]
- Varlamova, E.G.; Hhabatova, V.V.; Gudkov, S.V.; Plotnikov, E.Y.; Turovsky, E.A. Cytoprotective Properties of a New Nanocomplex of Selenium with Taxifolin in the Cells of the Cerebral Cortex Exposed to Ischemia/Reoxygenation. Phamaceutics 2022, 14, 2477. [Google Scholar] [CrossRef] [PubMed]


Disclaimer/Publisher’s Note: The statements, opinions and data contained in all publications are solely those of the individual author(s) and contributor(s) and not of MDPI and/or the editor(s). MDPI and/or the editor(s) disclaim responsibility for any injury to people or property resulting from any ideas, methods, instructions or products referred to in the content. |
© 2023 by the authors. Licensee MDPI, Basel, Switzerland. This article is an open access article distributed under the terms and conditions of the Creative Commons Attribution (CC BY) license (https://creativecommons.org/licenses/by/4.0/).
Share and Cite
Inoue, T.; Fu, B.; Nishio, M.; Tanaka, M.; Kato, H.; Tanaka, M.; Itoh, M.; Yamakage, H.; Ochi, K.; Ito, A.; et al. Novel Therapeutic Potentials of Taxifolin for Obesity-Induced Hepatic Steatosis, Fibrogenesis, and Tumorigenesis. Nutrients 2023, 15, 350. https://doi.org/10.3390/nu15020350
Inoue T, Fu B, Nishio M, Tanaka M, Kato H, Tanaka M, Itoh M, Yamakage H, Ochi K, Ito A, et al. Novel Therapeutic Potentials of Taxifolin for Obesity-Induced Hepatic Steatosis, Fibrogenesis, and Tumorigenesis. Nutrients. 2023; 15(2):350. https://doi.org/10.3390/nu15020350
Chicago/Turabian StyleInoue, Takayuki, Bin Fu, Miwako Nishio, Miyako Tanaka, Hisashi Kato, Masashi Tanaka, Michiko Itoh, Hajime Yamakage, Kozue Ochi, Ayaka Ito, and et al. 2023. "Novel Therapeutic Potentials of Taxifolin for Obesity-Induced Hepatic Steatosis, Fibrogenesis, and Tumorigenesis" Nutrients 15, no. 2: 350. https://doi.org/10.3390/nu15020350
APA StyleInoue, T., Fu, B., Nishio, M., Tanaka, M., Kato, H., Tanaka, M., Itoh, M., Yamakage, H., Ochi, K., Ito, A., Shiraki, Y., Saito, S., Ihara, M., Nishimura, H., Kawamoto, A., Inoue, S., Saeki, K., Enomoto, A., Suganami, T., & Satoh-Asahara, N. (2023). Novel Therapeutic Potentials of Taxifolin for Obesity-Induced Hepatic Steatosis, Fibrogenesis, and Tumorigenesis. Nutrients, 15(2), 350. https://doi.org/10.3390/nu15020350