
Impact of Nutritional Status on Outcomes of Stroke Survivors: A Post Hoc Analysis of the NHANES


Abstract
1. Introduction
2. Materials and Methods
2.1. Data Sources
2.2. Participants
2.3. Nutritional Status
2.4. Mortality Data
2.5. Statistical Analysis
2.6. Ethics Statement
3. Results
3.1. Participant Characteristics
3.2. Comparison of Survival between the Stroke and Non-Stroke Participants
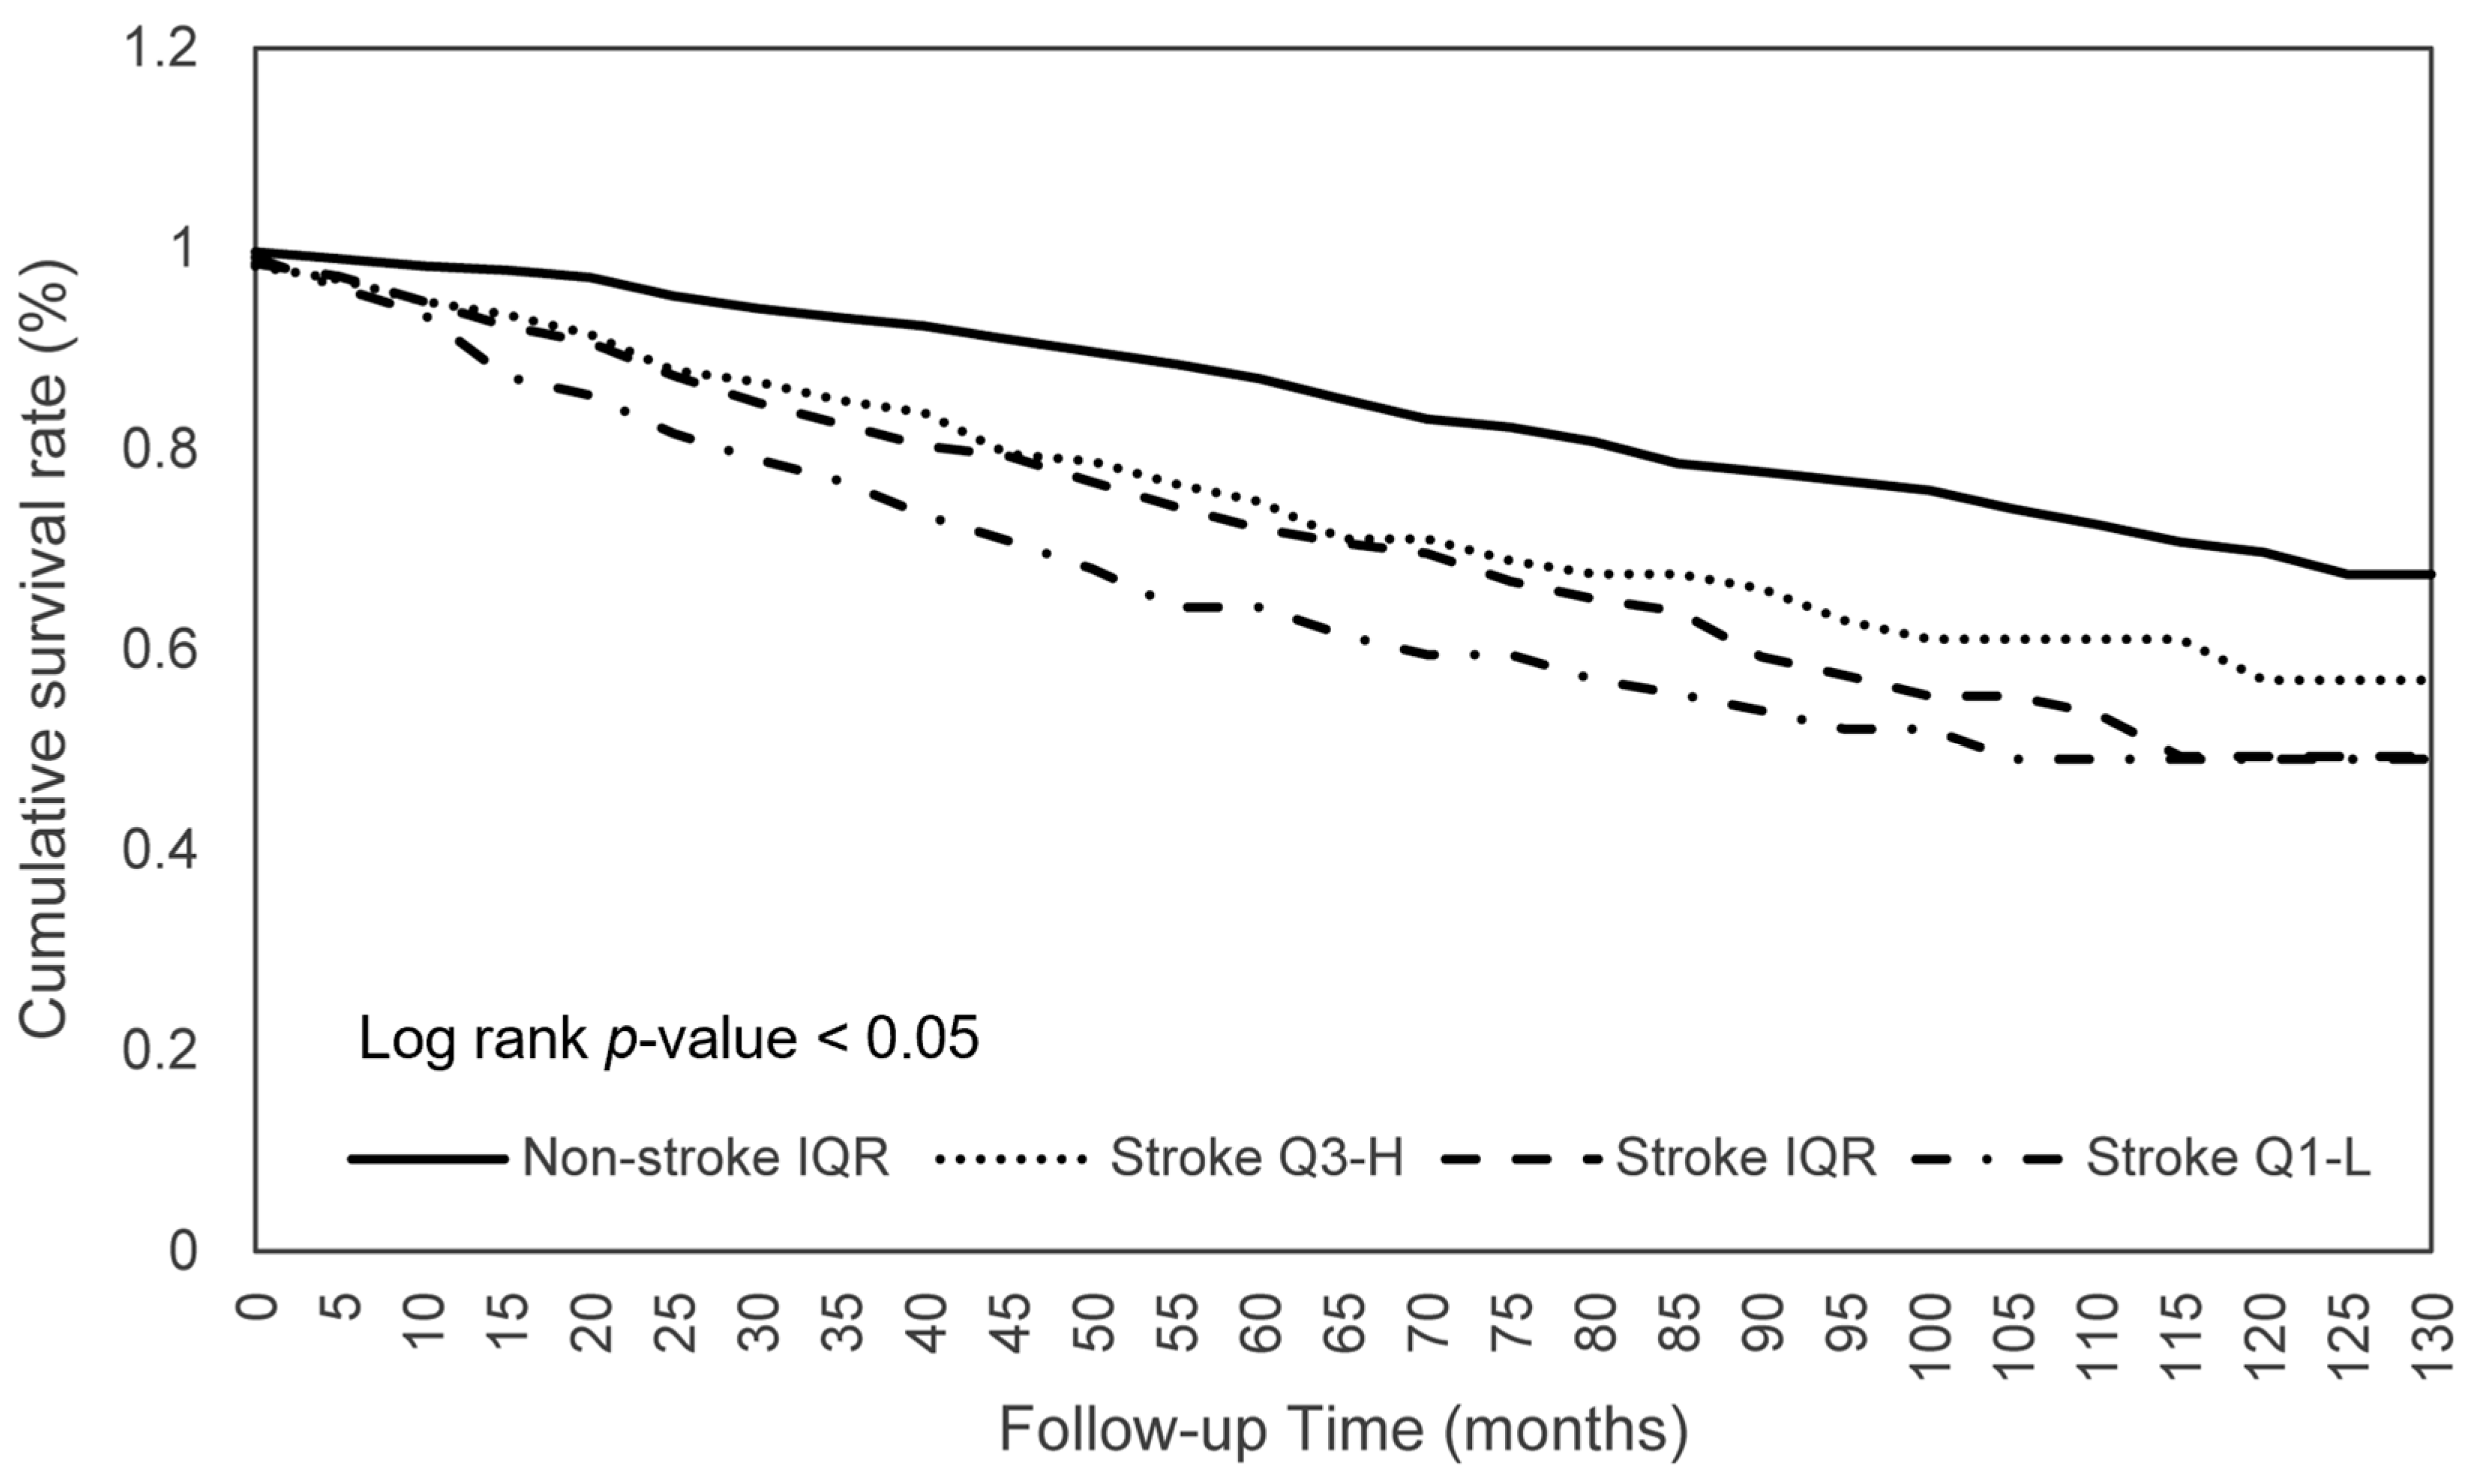
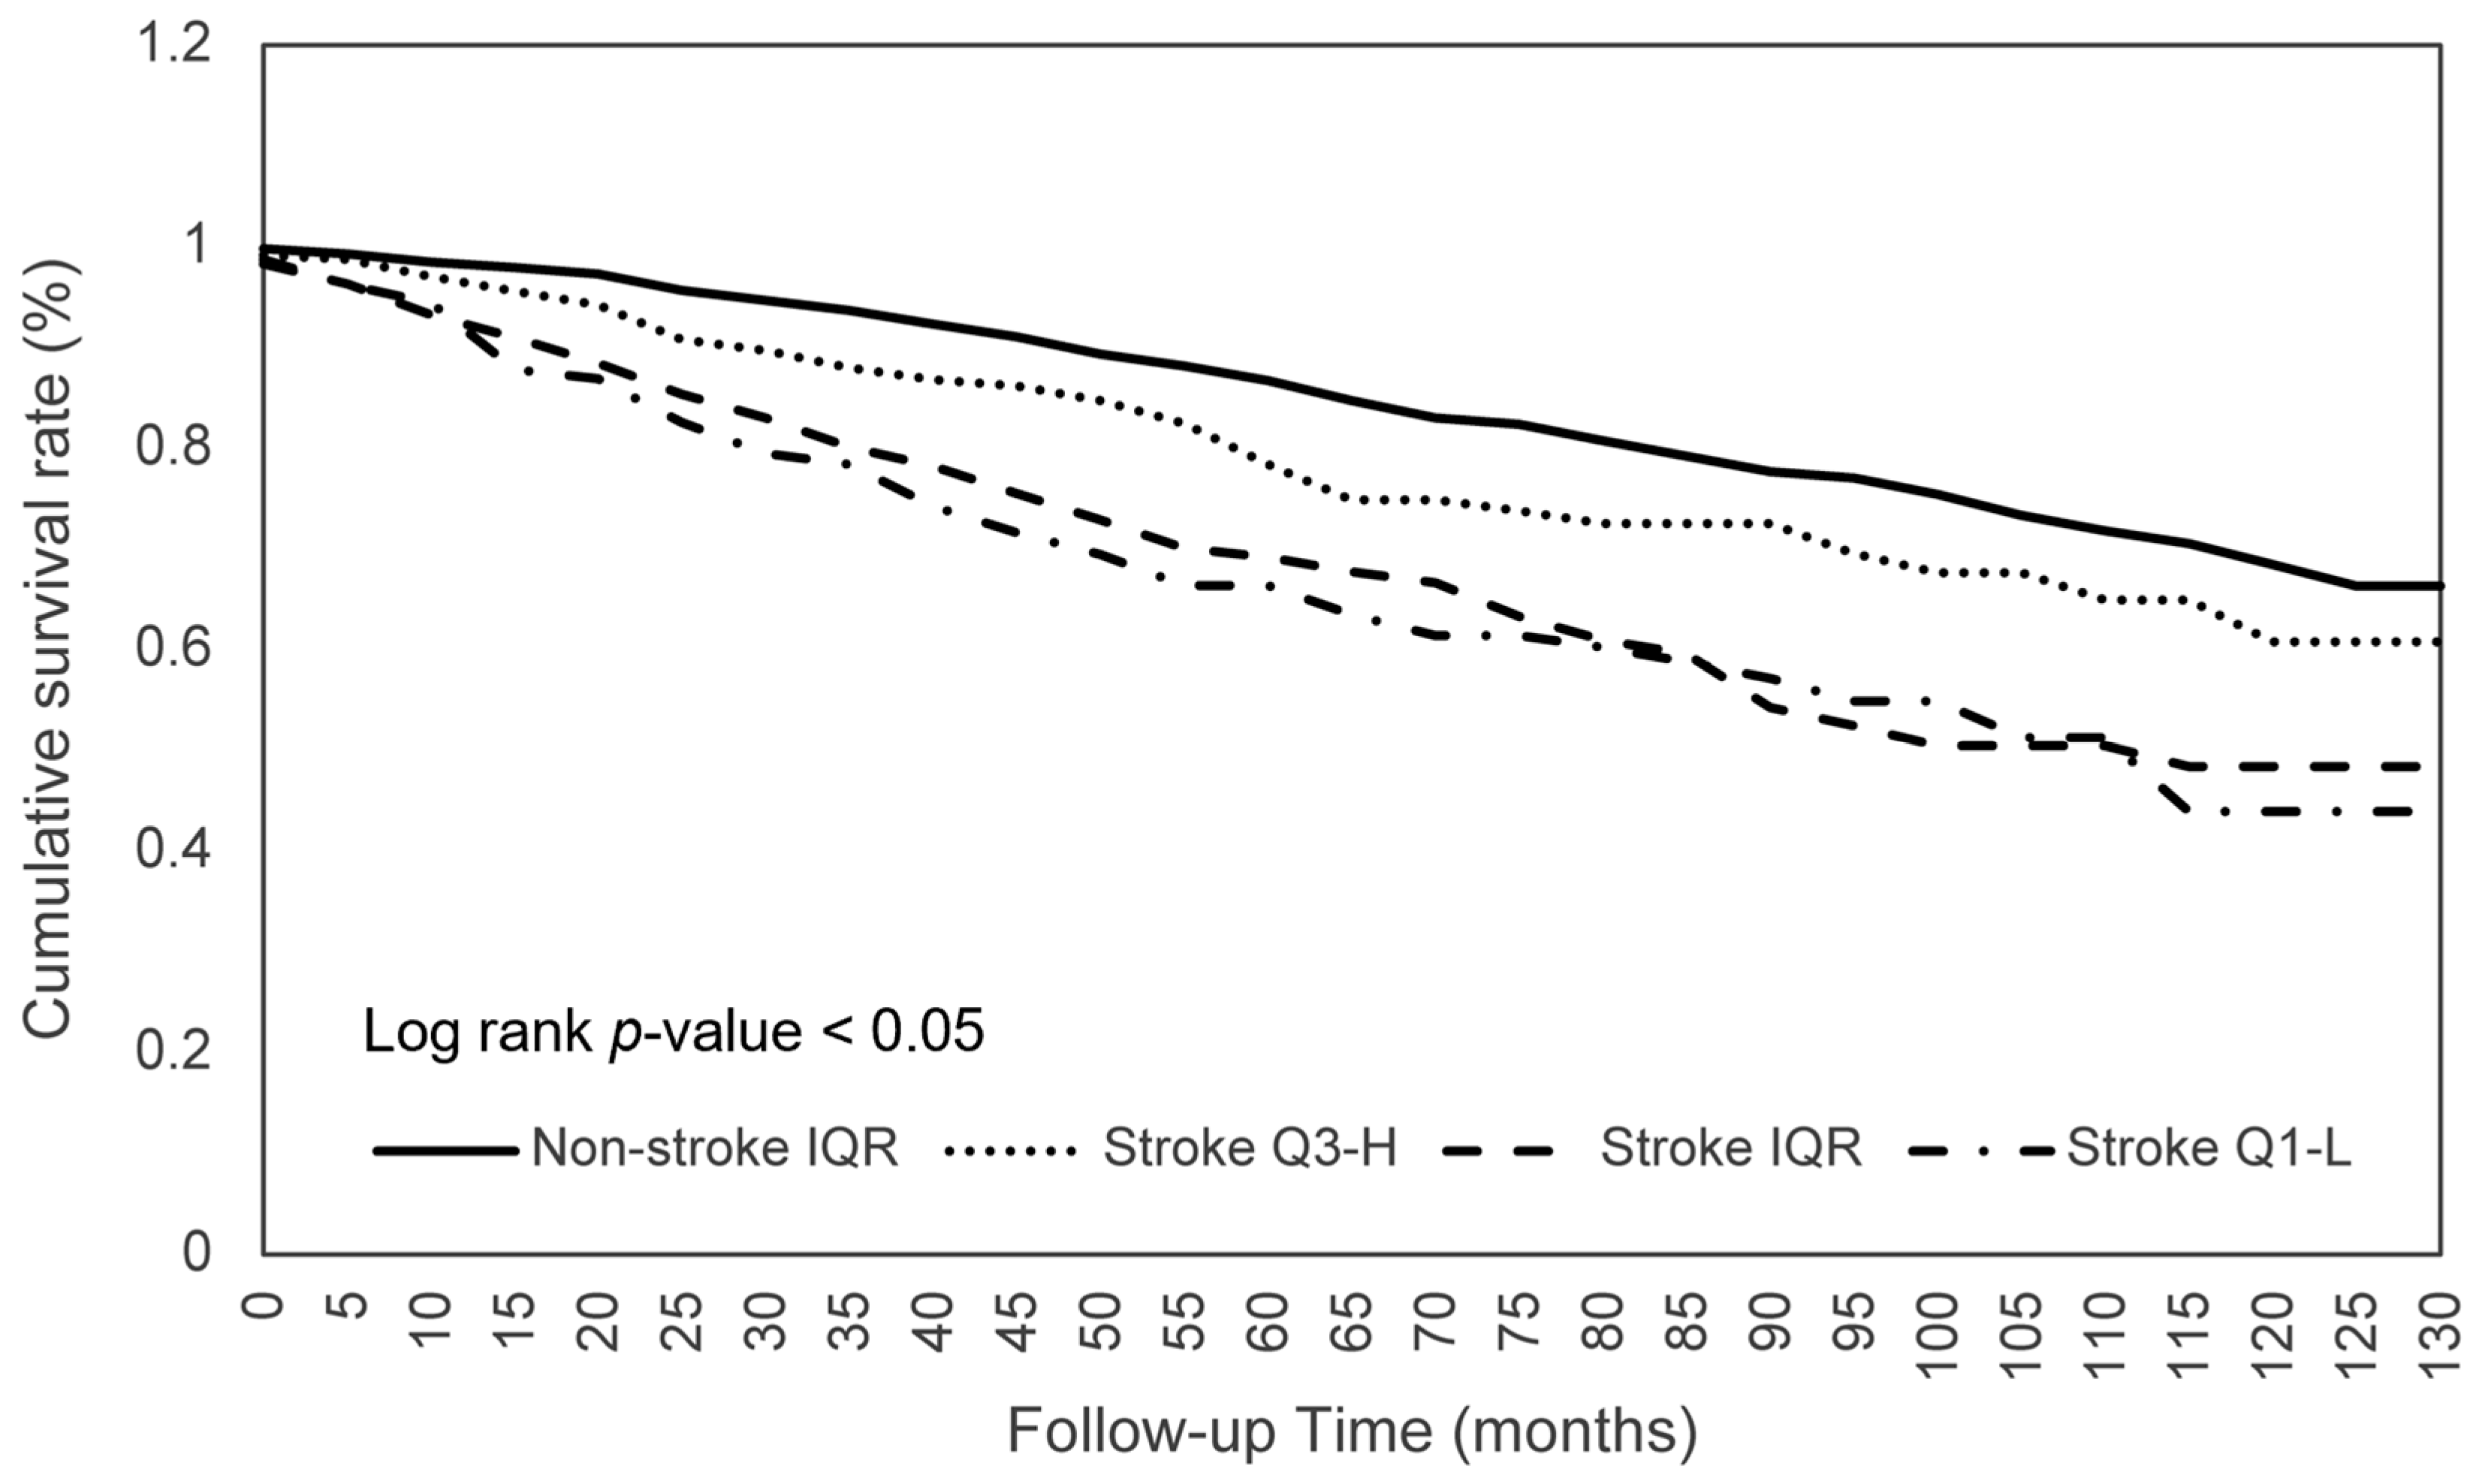
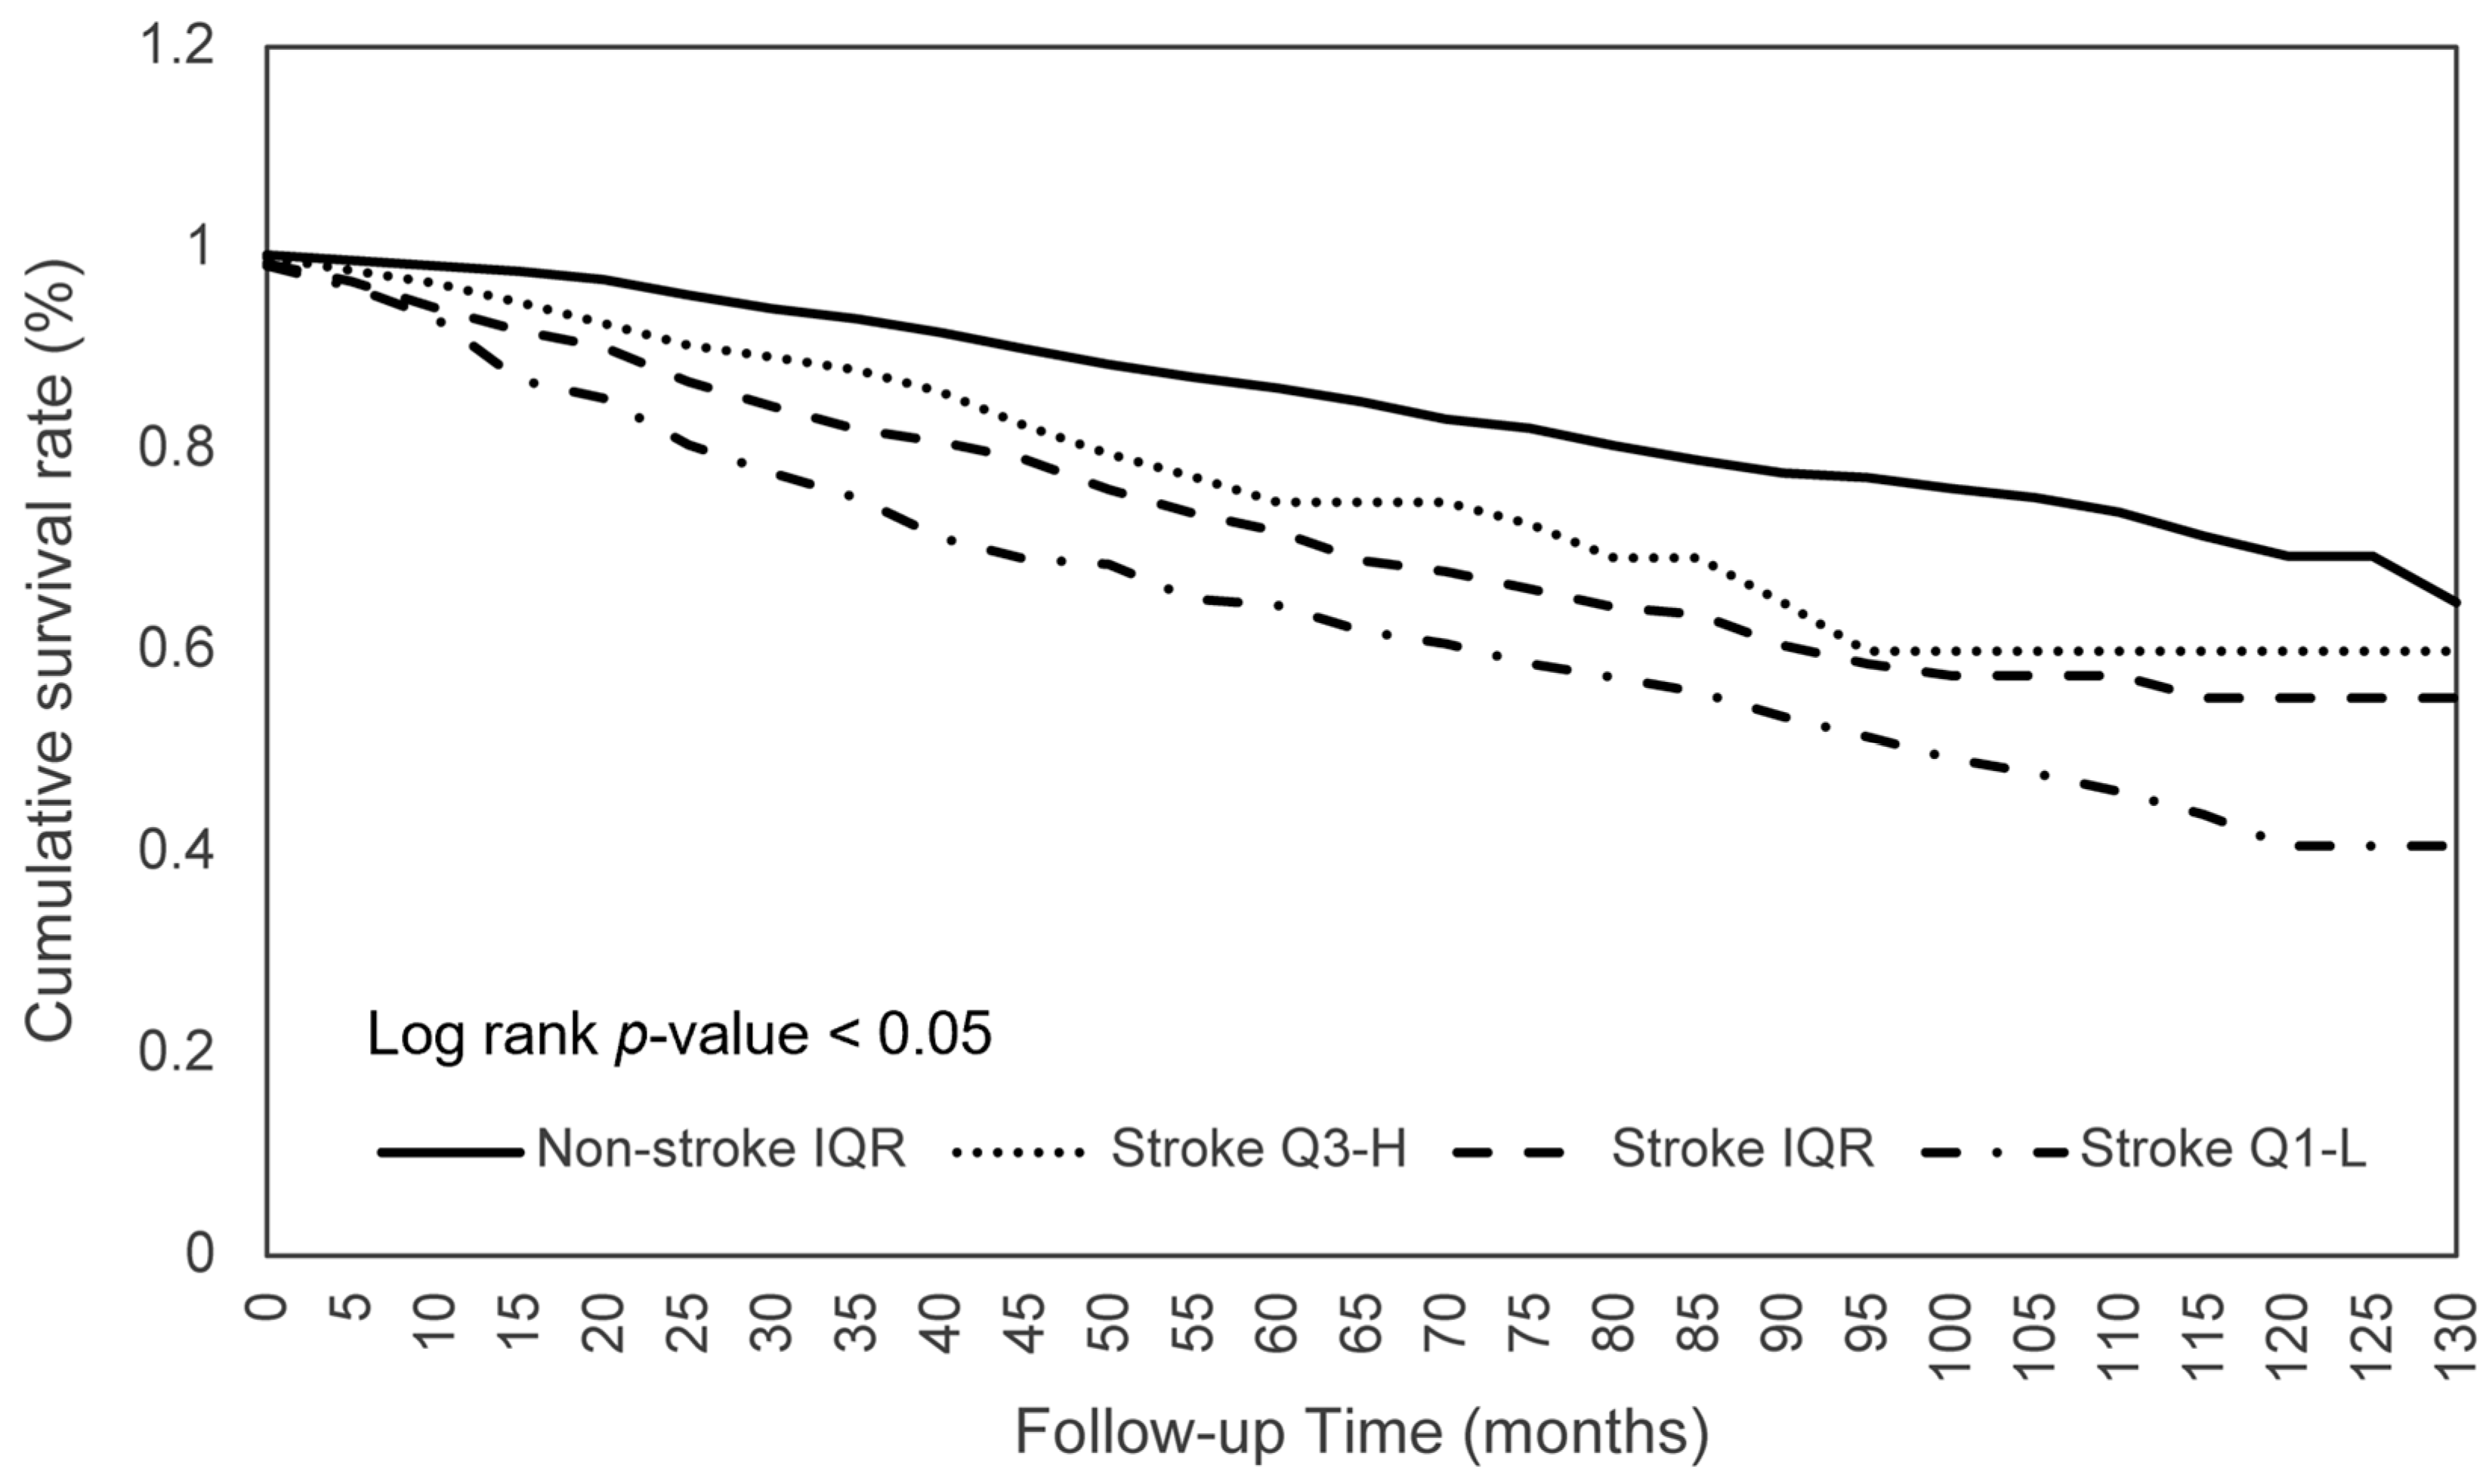
3.3. Dietary Consumption on Survival among Stroke Patients
3.4. Dietary Consumption on Survival between Stroke Q3-H and Non-Stroke Q1-L Patients
4. Discussion
5. Conclusions
Author Contributions
Funding
Institutional Review Board Statement
Informed Consent Statement
Data Availability Statement
Conflicts of Interest
References
- Campbell, B.C.V.; Khatri, P. Stroke. Lancet 2020, 396, 129–142. [Google Scholar] [CrossRef]
- Hendricks, H.T.; van Limbeek, J.; Geurts, A.C.; Zwarts, M.J. Motor recovery after stroke: A systematic review of the literature. Arch. Phys. Med. Rehabil. 2002, 83, 1629–1637. [Google Scholar] [CrossRef]
- Paolucci, S.; Antonucci, G.; Grasso, M.G.; Bragoni, M.; Coiro, P.; De Angelis, D.; Fusco, F.R.; Morelli, D.; Venturiero, V.; Troisi, E.; et al. Functional outcome of ischemic and hemorrhagic stroke patients after inpatient rehabilitation: A matched comparison. Stroke 2003, 34, 2861–2865. [Google Scholar] [CrossRef]
- Cauraugh, J.H.; Summers, J.J. Neural plasticity and bilateral movements: A rehabilitation approach for chronic stroke. Prog. Neurobiol. 2005, 75, 309–320. [Google Scholar] [CrossRef]
- Lee, K.B.; Lim, S.H.; Kim, K.H.; Kim, K.J.; Kim, Y.R.; Chang, W.N.; Yeom, J.W.; Kim, Y.D.; Hwang, B.Y. Six-month functional recovery of stroke patients: A multi-time-point study. Int. J. Rehabil. Res. 2015, 38, 173–180. [Google Scholar] [CrossRef]
- Alawieh, A.; Zhao, J.; Feng, W. Factors affecting post-stroke motor recovery: Implications on neurotherapy after brain injury. Behav. Brain Res. 2018, 340, 94–101. [Google Scholar] [CrossRef]
- Roberts, L.; Counsell, C. Assessment of clinical outcomes in acute stroke trials. Stroke 1998, 29, 986–991. [Google Scholar] [CrossRef]
- Patel, M.D.; Tilling, K.; Lawrence, E.; Rudd, A.G.; Wolfe, C.D.; McKevitt, C. Relationships between long-term stroke disability, handicap and health-related quality of life. Age Ageing 2006, 35, 273–279. [Google Scholar] [CrossRef]
- Goyal, M.; Menon, B.K.; van Zwam, W.H.; Dippel, D.W.; Mitchell, P.J.; Demchuk, A.M.; Davalos, A.; Majoie, C.B.; van der Lugt, A.; de Miquel, M.A.; et al. Endovascular thrombectomy after large-vessel ischaemic stroke: A meta-analysis of individual patient data from five randomised trials. Lancet 2016, 387, 1723–1731. [Google Scholar] [CrossRef]
- Lv, Y.; Sun, Q.; Li, J.; Zhang, W.; He, Y.; Zhou, Y. Disability Status and Its Influencing Factors Among Stroke Patients in Northeast China: A 3-Year Follow-Up Study. Neuropsychiatr. Dis. Treat. 2021, 17, 2567–2573. [Google Scholar] [CrossRef]
- Cifu, D.X.; Stewart, D.G. Factors affecting functional outcome after stroke: A critical review of rehabilitation interventions. Arch Phys. Med. Rehabil. 1999, 80, S35–S39. [Google Scholar] [CrossRef]
- Rabadi, M.H.; Coar, P.L.; Lukin, M.; Lesser, M.; Blass, J.P. Intensive nutritional supplements can improve outcomes in stroke rehabilitation. Neurology 2008, 71, 1856–1861. [Google Scholar] [CrossRef]
- Nii, M.; Maeda, K.; Wakabayashi, H.; Nishioka, S.; Tanaka, A. Nutritional Improvement and Energy Intake Are Associated with Functional Recovery in Patients after Cerebrovascular Disorders. J. Stroke Cerebrovasc. Dis. 2016, 25, 57–62. [Google Scholar] [CrossRef]
- Collaboration, F.T. Poor nutritional status on admission predicts poor outcomes after stroke: Observational data from the FOOD trial. Stroke 2003, 34, 1450–1456. [Google Scholar] [CrossRef]
- Martineau, J.; Bauer, J.D.; Isenring, E.; Cohen, S. Malnutrition determined by the patient-generated subjective global assessment is associated with poor outcomes in acute stroke patients. Clin. Nutr. 2005, 24, 1073–1077. [Google Scholar] [CrossRef]
- Centers for Disease Control and Prevention (CDC). National Health and Nutrition Examination Survey: Questionnaires, Datasets, and Related Documentation. Available online: https://www.cdc.gov/nchs/nhanes/index.htm (accessed on 3 September 2022).
- Centers for Disease Control and Prevention (CDC). National Health and Nutrition Examination Survey: About the National Health and Nutrition Examination Survey. Available online: https://www.cdc.gov/nchs/nhanes/about_nhanes.htm (accessed on 3 September 2022).
- Food Surveys Research Group: Beltsville, MD. Agricultural Research Service, Food Surveys Research Group. Available online: https://www.ars.usda.gov/northeast-area/beltsville-md-bhnrc/beltsville-human-nutrition-research-center/food-surveys-research-group/docs/fndds/ (accessed on 3 September 2022).
- Centers for Disease Control and Prevention (CDC). National Health and Nutrition Examination Survey (NHANES) 1999–2004 Linked Mortality Files. Available online: https://www.cdc.gov/nchs/data/datalinkage/nh99_04_mort_file_layout_public_2010.pdf (accessed on 18 May 2012).
- Centers for Disease Control and Prevention (CDC). NHANES Survey Methods and Analytic Guidelines. Available online: https://wwwn.cdc.gov/nchs/nhanes/analyticguidelines.aspx (accessed on 11 January 2021).
- Larsson, S.C.; Akesson, A.; Wolk, A. Healthy diet and lifestyle and risk of stroke in a prospective cohort of women. Neurology 2014, 83, 1699–1704. [Google Scholar] [CrossRef]
- Spence, J.D. Diet for stroke prevention. Stroke Vasc. Neurol. 2018, 3, 44–50. [Google Scholar] [CrossRef]
- Pandian, J.D.; Gall, S.L.; Kate, M.P.; Silva, G.S.; Akinyemi, R.O.; Ovbiagele, B.I.; Lavados, P.M.; Gandhi, D.B.C.; Thrift, A.G. Prevention of stroke: A global perspective. Lancet 2018, 392, 1269–1278. [Google Scholar] [CrossRef]
- Arnett, D.K.; Blumenthal, R.S.; Albert, M.A.; Buroker, A.B.; Goldberger, Z.D.; Hahn, E.J.; Himmelfarb, C.D.; Khera, A.; Lloyd-Jones, D.; McEvoy, J.W.; et al. 2019 ACC/AHA Guideline on the Primary Prevention of Cardiovascular Disease: A Report of the American College of Cardiology/American Heart Association Task Force on Clinical Practice Guidelines. Circulation 2019, 140, e596–e646. [Google Scholar] [CrossRef]
- Spence, J.D. Nutrition and Risk of Stroke. Nutrients 2019, 11, 647. [Google Scholar] [CrossRef]
- Collaborators, G.B.D.S. Global, regional, and national burden of stroke and its risk factors, 1990–2019: A systematic analysis for the Global Burden of Disease Study 2019. Lancet Neurol. 2021, 20, 795–820. [Google Scholar] [CrossRef]
- Aquilani, R.; Sessarego, P.; Iadarola, P.; Barbieri, A.; Boschi, F. Nutrition for brain recovery after ischemic stroke: An added value to rehabilitation. Nutr. Clin. Pract. 2011, 26, 339–345. [Google Scholar] [CrossRef]
- Nishioka, S.; Okamoto, T.; Takayama, M.; Urushihara, M.; Watanabe, M.; Kiriya, Y.; Shintani, K.; Nakagomi, H.; Kageyama, N. Malnutrition risk predicts recovery of full oral intake among older adult stroke patients undergoing enteral nutrition: Secondary analysis of a multicentre survey (the APPLE study). Clin. Nutr. 2017, 36, 1089–1096. [Google Scholar] [CrossRef]
- Kimura, Y.; Yamada, M.; Kakehi, T.; Itagaki, A.; Tanaka, N.; Muroh, Y. Combination of Low Body Mass Index and Low Serum Albumin Level Leads to Poor Functional Recovery in Stroke Patients. J. Stroke Cerebrovasc. Dis. 2017, 26, 448–453. [Google Scholar] [CrossRef]
- Sato, M.; Ido, Y.; Yoshimura, Y.; Mutai, H. Relationship of Malnutrition During Hospitalization With Functional Recovery and Postdischarge Destination in Elderly Stroke Patients. J. Stroke Cerebrovasc. Dis. 2019, 28, 1866–1872. [Google Scholar] [CrossRef]
- Irisawa, H.; Mizushima, T. Correlation of Body Composition and Nutritional Status with Functional Recovery in Stroke Rehabilitation Patients. Nutrients 2020, 12, 1923. [Google Scholar] [CrossRef]
- Sato, K.; Inoue, T.; Maeda, K.; Shimizu, A.; Ueshima, J.; Ishida, Y.; Ogawa, T.; Suenaga, M. Undernutrition at Admission Suppresses Post-Stroke Recovery of Trunk Function. J. Stroke Cerebrovasc. Dis. 2022, 31, 106354. [Google Scholar] [CrossRef]
- Foley, N.C.; Salter, K.L.; Robertson, J.; Teasell, R.W.; Woodbury, M.G. Which reported estimate of the prevalence of malnutrition after stroke is valid? Stroke 2009, 40, e66–e74. [Google Scholar] [CrossRef]
- Hafsteinsdottir, T.B.; Mosselman, M.; Schoneveld, C.; Riedstra, Y.D.; Kruitwagen, C.L. Malnutrition in hospitalised neurological patients approximately doubles in 10 days of hospitalisation. J. Clin. Nurs. 2010, 19, 639–648. [Google Scholar] [CrossRef]
- Nip, W.F.; Perry, L.; McLaren, S.; Mackenzie, A. Dietary intake, nutritional status and rehabilitation outcomes of stroke patients in hospital. J. Hum. Nutr. Diet. 2011, 24, 460–469. [Google Scholar] [CrossRef]
- Wong, H.J.; Harith, S.; Lua, P.L.; Ibrahim, K.A. Prevalence and Predictors of Malnutrition Risk among Post-Stroke Patients in Outpatient Setting: A Cross-Sectional Study. Malays. J. Med. Sci. 2020, 27, 72–84. [Google Scholar] [CrossRef] [PubMed]
- May, C.C.; Harris, E.A.; Hannawi, Y.; Smetana, K.S. Evaluation of energy intake compared with indirect calorimetry requirements in critically ill patients with acute brain injury. JPEN J. Parenter. Enteral. Nutr. 2022, 46, 1176–1182. [Google Scholar] [CrossRef] [PubMed]
- Huppertz, V.; Guida, S.; Holdoway, A.; Strilciuc, S.; Baijens, L.; Schols, J.; van Helvoort, A.; Lansink, M.; Muresanu, D.F. Impaired Nutritional Condition After Stroke From the Hyperacute to the Chronic Phase: A Systematic Review and Meta-Analysis. Front. Neurol. 2021, 12, 780080. [Google Scholar] [CrossRef] [PubMed]
- Perry, L. Eating and dietary intake in communication-impaired stroke survivors: A cohort study from acute-stage hospital admission to 6 months post-stroke. Clin. Nutr. 2004, 23, 1333–1343. [Google Scholar] [CrossRef]
- Foley, N.; Finestone, H.; Woodbury, M.G.; Teasell, R.; Greene Finestone, L. Energy and protein intakes of acute stroke patients. J. Nutr. Health Aging 2006, 10, 171–175. [Google Scholar]
- Shen, H.C.; Chen, H.F.; Peng, L.N.; Lin, M.H.; Chen, L.K.; Liang, C.K.; Lo, Y.K.; Hwang, S.J. Impact of nutritional status on long-term functional outcomes of post-acute stroke patients in Taiwan. Arch. Gerontol. Geriatr 2011, 53, e149–e152. [Google Scholar] [CrossRef]
- Bouziana, S.D.; Tziomalos, K. Malnutrition in patients with acute stroke. J. Nutr. Metab. 2011, 2011, 167898. [Google Scholar] [CrossRef]
- Gomes, F.; Emery, P.W.; Weekes, C.E. Risk of Malnutrition Is an Independent Predictor of Mortality, Length of Hospital Stay, and Hospitalization Costs in Stroke Patients. J. Stroke Cerebrovasc Dis. 2016, 25, 799–806. [Google Scholar] [CrossRef]
- Sremanakova, J.; Burden, S.; Kama, Y.; Gittins, M.; Lal, S.; Smith, C.J.; Hamdy, S. An Observational Cohort Study Investigating Risk of Malnutrition Using the Malnutrition Universal Screening Tool in Patients with Stroke. J. Stroke Cerebrovasc. Dis. 2019, 28, 104405. [Google Scholar] [CrossRef]
- Scrutinio, D.; Lanzillo, B.; Guida, P.; Passantino, A.; Spaccavento, S.; Battista, P. Association Between Malnutrition and Outcomes in Patients With Severe Ischemic Stroke Undergoing Rehabilitation. Arch. Phys. Med. Rehabil. 2020, 101, 852–860. [Google Scholar] [CrossRef]
- Cai, Z.M.; Wu, Y.Z.; Chen, H.M.; Feng, R.Q.; Liao, C.W.; Ye, S.L.; Liu, Z.P.; Zhang, M.M.; Zhu, B.L. Being at risk of malnutrition predicts poor outcomes at 3 months in acute ischemic stroke patients. Eur. J. Clin. Nutr. 2020, 74, 796–805. [Google Scholar] [CrossRef] [PubMed]
- Sato, Y.; Yoshimura, Y.; Abe, T. Nutrition in the First Week after Stroke Is Associated with Discharge to Home. Nutrients 2021, 13, 943. [Google Scholar] [CrossRef]
- Yuan, K.; Zhu, S.; Wang, H.; Chen, J.; Zhang, X.; Xu, P.; Xie, Y.; Zhu, X.; Zhu, W.; Sun, W.; et al. Association between malnutrition and long-term mortality in older adults with ischemic stroke. Clin. Nutr. 2021, 40, 2535–2542. [Google Scholar] [CrossRef]
- Qin, H.; Wang, A.; Zuo, Y.; Zhang, Y.; Yang, B.; Wei, N.; Zhang, J. Malnutrition could Predict 3-month Functional Prognosis in Mild Stroke Patients: Findings from a Nationwide Stroke Registry. Curr. Neurovasc. Res. 2021, 18, 489–496. [Google Scholar] [CrossRef]
- Powers, W.J.; Rabinstein, A.A.; Ackerson, T.; Adeoye, O.M.; Bambakidis, N.C.; Becker, K.; Biller, J.; Brown, M.; Demaerschalk, B.M.; Hoh, B.; et al. Guidelines for the Early Management of Patients With Acute Ischemic Stroke: 2019 Update to the 2018 Guidelines for the Early Management of Acute Ischemic Stroke: A Guideline for Healthcare Professionals From the American Heart Association/American Stroke Association. Stroke 2019, 50, e344–e418. [Google Scholar] [CrossRef]
- Anthony, P.S. Nutrition screening tools for hospitalized patients. Nutr. Clin. Pract. 2008, 23, 373–382. [Google Scholar] [CrossRef]
- van Bokhorst-de van der Schueren, M.A.; Guaitoli, P.R.; Jansma, E.P.; de Vet, H.C. Nutrition screening tools: Does one size fit all? A systematic review of screening tools for the hospital setting. Clin. Nutr. 2014, 33, 39–58. [Google Scholar] [CrossRef] [PubMed]
- Seron-Arbeloa, C.; Labarta-Monzon, L.; Puzo-Foncillas, J.; Mallor-Bonet, T.; Lafita-Lopez, A.; Bueno-Vidales, N.; Montoro-Huguet, M. Malnutrition Screening and Assessment. Nutrients 2022, 14, 2392. [Google Scholar] [CrossRef]
- Stratton, R.J.; King, C.L.; Stroud, M.A.; Jackson, A.A.; Elia, M. ‘Malnutrition Universal Screening Tool’ predicts mortality and length of hospital stay in acutely ill elderly. Br. J. Nutr. 2006, 95, 325–330. [Google Scholar] [CrossRef]
- Chong, C.W.; Hasnan, N.; Abdul Latif, L.; Abdul Majid, H. Nutritional Status of Post-Acute Stroke Patients during Rehabilitation Phase in Hospital. Sains Malays. 2019, 48, 129–135. [Google Scholar] [CrossRef]
- Bardutzky, J.; Georgiadis, D.; Kollmar, R.; Schwab, S. Energy expenditure in ischemic stroke patients treated with moderate hypothermia. Intensive Care Med. 2004, 30, 151–154. [Google Scholar] [CrossRef] [PubMed]
- Leone, A.; Pencharz, P.B. Resting energy expenditure in stroke patients who are dependent on tube feeding: A pilot study. Clin. Nutr. 2010, 29, 370–372. [Google Scholar] [CrossRef] [PubMed]
- Finestone, H.M.; Greene-Finestone, L.S.; Foley, N.C.; Woodbury, M.G. Measuring longitudinally the metabolic demands of stroke patients: Resting energy expenditure is not elevated. Stroke 2003, 34, 502–507. [Google Scholar] [CrossRef]
- Weekes, E.; Elia, M. Resting energy expenditure and body composition following cerebro-vascular accident. Clin. Nutr. 1992, 11, 18–22. [Google Scholar] [CrossRef]
- Frankenfield, D.C.; Ashcraft, C.M. Description and prediction of resting metabolic rate after stroke and traumatic brain injury. Nutrition 2012, 28, 906–911. [Google Scholar] [CrossRef]
- Kawakami, M.; Liu, M.; Wada, A.; Otsuka, T.; Nishimura, A. Resting Energy Expenditure in Patients with Stroke during the Subacute Phases—Relationships with Stroke Types, Location, Severity of Paresis, and Activities of Daily Living. Cerebrovasc. Dis. 2015, 39, 170–175. [Google Scholar] [CrossRef]
- Smetana, K.S.; Hannawi, Y.; May, C.C. Indirect Calorimetry Measurements Compared With Guideline Weight-Based Energy Calculations in Critically Ill Stroke Patients. JPEN J. Parenter. Enteral. Nutr. 2021, 45, 1484–1490. [Google Scholar] [CrossRef]
- Esper, D.H.; Coplin, W.M.; Carhuapoma, J.R. Energy expenditure in patients with nontraumatic intracranial hemorrhage. JPEN J. Parenter. Enteral. Nutr. 2006, 30, 71–75. [Google Scholar] [CrossRef]
- Koukiasa, P.; Bitzani, M.; Papaioannou, V.; Pnevmatikos, I. Resting Energy Expenditure in Critically Ill Patients With Spontaneous Intracranial Hemorrhage. JPEN J. Parenter. Enteral. Nutr. 2015, 39, 917–921. [Google Scholar] [CrossRef]
- Kasuya, H.; Kawashima, A.; Namiki, K.; Shimizu, T.; Takakura, K. Metabolic profiles of patients with subarachnoid hemorrhage treated by early surgery. Neurosurgery 1998, 42, 1268–1274; discussion 1274–1265. [Google Scholar] [CrossRef]
- Badjatia, N.; Fernandez, L.; Schlossberg, M.J.; Schmidt, J.M.; Claassen, J.; Lee, K.; Connolly, E.S.; Mayer, S.A.; Rosenbaum, M. Relationship between energy balance and complications after subarachnoid hemorrhage. JPEN J. Parenter. Enteral. Nutr. 2010, 34, 64–69. [Google Scholar] [CrossRef] [PubMed]
- Nagano, A.; Yamada, Y.; Miyake, H.; Domen, K.; Koyama, T. Increased Resting Energy Expenditure after Endovascular Coiling for Subarachnoid Hemorrhage. J. Stroke Cerebrovasc. Dis. 2016, 25, 813–818. [Google Scholar] [CrossRef] [PubMed]
- Sabbouh, T.; Torbey, M.T. Malnutrition in Stroke Patients: Risk Factors, Assessment, and Management. Neurocrit. Care 2018, 29, 374–384. [Google Scholar] [CrossRef]
- Shimauchi-Ohtaki, H.; Tosaka, M.; Ohtani, T.; Iijima, K.; Sasaguchi, N.; Kurihara, H.; Yoshimoto, Y. Systemic metabolism and energy consumption after microsurgical clipping and endovascular coiling for aneurysmal subarachnoid hemorrhage. Acta Neurochir. 2018, 160, 261–268. [Google Scholar] [CrossRef]
- Nagano, A.; Yamada, Y.; Miyake, H.; Domen, K.; Koyama, T. Comparisons of Predictive Equations for Resting Energy Expenditure in Patients with Cerebral Infarct during Acute Care. J. Stroke Cerebrovasc. Dis. 2015, 24, 1879–1885. [Google Scholar] [CrossRef]
- Picolo, M.F.; Lago, A.F.; Menegueti, M.G.; Nicolini, E.A.; Basile-Filho, A.; Nunes, A.A.; Martins-Filho, O.A.; Auxiliadora-Martins, M. Harris-Benedict Equation and Resting Energy Expenditure Estimates in Critically Ill Ventilator Patients. Am. J. Crit. Care 2016, 25, e21–e29. [Google Scholar] [CrossRef] [PubMed]
- Luy, S.C.; Dampil, O.A. Comparison of the Harris-Benedict Equation, Bioelectrical Impedance Analysis, and Indirect Calorimetry for Measurement of Basal Metabolic Rate among Adult Obese Filipino Patients with Prediabetes or Type 2 Diabetes Mellitus. J. ASEAN Fed. Endocr. Soc. 2018, 33, 152–159. [Google Scholar] [CrossRef]
- Chen, N.; Li, Y.; Fang, J.; Lu, Q.; He, L. Risk factors for malnutrition in stroke patients: A meta-analysis. Clin. Nutr. 2019, 38, 127–135. [Google Scholar] [CrossRef]
- Lieber, A.C.; Hong, E.; Putrino, D.; Nistal, D.A.; Pan, J.S.; Kellner, C.P. Nutrition, Energy Expenditure, Dysphagia, and Self-Efficacy in Stroke Rehabilitation: A Review of the Literature. Brain Sci. 2018, 8, 218. [Google Scholar] [CrossRef]
- Zielinska-Nowak, E.; Cichon, N.; Saluk-Bijak, J.; Bijak, M.; Miller, E. Nutritional Supplements and Neuroprotective Diets and Their Potential Clinical Significance in Post-Stroke Rehabilitation. Nutrients 2021, 13, 2704. [Google Scholar] [CrossRef]
- Aquilani, R.; Scocchi, M.; Boschi, F.; Viglio, S.; Iadarola, P.; Pastoris, O.; Verri, M. Effect of calorie-protein supplementation on the cognitive recovery of patients with subacute stroke. Nutr. Neurosci. 2008, 11, 235–240. [Google Scholar] [CrossRef]
- Aquilani, R.; Scocchi, M.; Iadarola, P.; Franciscone, P.; Verri, M.; Boschi, F.; Pasini, E.; Viglio, S. Protein supplementation may enhance the spontaneous recovery of neurological alterations in patients with ischaemic stroke. Clin. Rehabil. 2008, 22, 1042–1050. [Google Scholar] [CrossRef]
- Almeida, O.P.; Marsh, K.; Alfonso, H.; Flicker, L.; Davis, T.M.; Hankey, G.J. B-vitamins reduce the long-term risk of depression after stroke: The VITATOPS-DEP trial. Ann. Neurol. 2010, 68, 503–510. [Google Scholar] [CrossRef]
- Wang, J.; Shi, Y.; Zhang, L.; Zhang, F.; Hu, X.; Zhang, W.; Leak, R.K.; Gao, Y.; Chen, L.; Chen, J. Omega-3 polyunsaturated fatty acids enhance cerebral angiogenesis and provide long-term protection after stroke. Neurobiol. Dis. 2014, 68, 91–103. [Google Scholar] [CrossRef]
- Pan, W.H.; Lai, Y.H.; Yeh, W.T.; Chen, J.R.; Jeng, J.S.; Bai, C.H.; Lin, R.T.; Lee, T.H.; Chang, K.C.; Lin, H.J.; et al. Intake of potassium- and magnesium-enriched salt improves functional outcome after stroke: A randomized, multicenter, double-blind controlled trial. Am. J. Clin. Nutr. 2017, 106, 1267–1273. [Google Scholar] [CrossRef] [PubMed]
- Aquilani, R.; Boselli, M.; D’Antona, G.; Baiardi, P.; Boschi, F.; Viglio, S.; Iadarola, P.; Pasini, E.; Barbieri, A.; Dossena, M.; et al. Unaffected arm muscle hypercatabolism in dysphagic subacute stroke patients: The effects of essential amino acid supplementation. Biomed. Res. Int. 2014, 2014, 964365. [Google Scholar] [CrossRef]
- Yoshimura, Y.; Bise, T.; Shimazu, S.; Tanoue, M.; Tomioka, Y.; Araki, M.; Nishino, T.; Kuzuhara, A.; Takatsuki, F. Effects of a leucine-enriched amino acid supplement on muscle mass, muscle strength, and physical function in post-stroke patients with sarcopenia: A randomized controlled trial. Nutrition 2019, 58, 1–6. [Google Scholar] [CrossRef] [PubMed]
- Takeuchi, I.; Yoshimura, Y.; Shimazu, S.; Jeong, S.; Yamaga, M.; Koga, H. Effects of branched-chain amino acids and vitamin D supplementation on physical function, muscle mass and strength, and nutritional status in sarcopenic older adults undergoing hospital-based rehabilitation: A multicenter randomized controlled trial. Geriatr. Gerontol. Int. 2019, 19, 12–17. [Google Scholar] [CrossRef] [PubMed]
- Ramasamy, D.K.; Dutta, T.; Kannan, V.; Chandramouleeswaran, V. Amino acids in post-stroke rehabilitation. Nutr. Neurosci. 2021, 24, 426–431. [Google Scholar] [CrossRef] [PubMed]
- Cherubini, A.; Polidori, M.C.; Bregnocchi, M.; Pezzuto, S.; Cecchetti, R.; Ingegni, T.; di Iorio, A.; Senin, U.; Mecocci, P. Antioxidant profile and early outcome in stroke patients. Stroke 2000, 31, 2295–2300. [Google Scholar] [CrossRef]
- Gariballa, S.E.; Hutchin, T.P.; Sinclair, A.J. Antioxidant capacity after acute ischaemic stroke. QJM 2002, 95, 685–690. [Google Scholar] [CrossRef] [PubMed]
- Foroughi, M.; Akhavanzanjani, M.; Maghsoudi, Z.; Ghiasvand, R.; Khorvash, F.; Askari, G. Stroke and nutrition: A review of studies. Int. J. Prev. Med. 2013, 4, S165–S179. [Google Scholar] [PubMed]
- Ullegaddi, R.; Powers, H.J.; Gariballa, S.E. B-group vitamin supplementation mitigates oxidative damage after acute ischaemic stroke. Clin. Sci. 2004, 107, 477–484. [Google Scholar] [CrossRef] [PubMed]
- Ullegaddi, R.; Powers, H.J.; Gariballa, S.E. Antioxidant supplementation with or without B-group vitamins after acute ischemic stroke: A randomized controlled trial. JPEN J. Parenter. Enteral. Nutr. 2006, 30, 108–114. [Google Scholar] [CrossRef]
- Pilz, S.; Tomaschitz, A.; Drechsler, C.; Zittermann, A.; Dekker, J.M.; Marz, W. Vitamin D supplementation: A promising approach for the prevention and treatment of strokes. Curr. Drug Targets 2011, 12, 88–96. [Google Scholar] [CrossRef]
- Gupta, A.; Prabhakar, S.; Modi, M.; Bhadada, S.K.; Kalaivani, M.; Lal, V.; Khurana, D. Effect of Vitamin D and calcium supplementation on ischaemic stroke outcome: A randomised controlled open-label trial. Int. J. Clin. Pract. 2016, 70, 764–770. [Google Scholar] [CrossRef]
- Sari, A.; Durmus, B.; Karaman, C.A.; Ogut, E.; Aktas, I. A randomized, double-blind study to assess if vitamin D treatment affects the outcomes of rehabilitation and balance in hemiplegic patients. J. Phys. Ther. Sci. 2018, 30, 874–878. [Google Scholar] [CrossRef]
- Aquilani, R.; Baiardi, P.; Scocchi, M.; Iadarola, P.; Verri, M.; Sessarego, P.; Boschi, F.; Pasini, E.; Pastoris, O.; Viglio, S. Normalization of zinc intake enhances neurological retrieval of patients suffering from ischemic strokes. Nutr. Neurosci. 2009, 12, 219–225. [Google Scholar] [CrossRef]
- Mika Horie, L.; Gonzalez, M.C.; Raslan, M.; Torrinhas, R.; Rodrigues, N.L.; Verotti, C.C.; Cecconello, I.; Heymsfield, S.B.; Waitzberg, D.L. Resting energy expenditure in white and non-white severely obese women. Nutr. Hosp. 2009, 24, 676–681. [Google Scholar]
- Adzika Nsatimba, P.A.; Pathak, K.; Soares, M.J. Ethnic differences in resting metabolic rate, respiratory quotient and body temperature: A comparison of Africans and European Australians. Eur. J. Nutr. 2016, 55, 1831–1838. [Google Scholar] [CrossRef]
- Pretorius, A.; Piderit, M.; Becker, P.; Wenhold, F. Resting energy expenditure of a diverse group of South African men and women. J. Hum. Nutr. Diet. 2022, 35, 1164–1177. [Google Scholar] [CrossRef] [PubMed]
- van Asch, C.J.; Luitse, M.J.; Rinkel, G.J.; van der Tweel, I.; Algra, A.; Klijn, C.J. Incidence, case fatality, and functional outcome of intracerebral haemorrhage over time, according to age, sex, and ethnic origin: A systematic review and meta-analysis. Lancet Neurol. 2010, 9, 167–176. [Google Scholar] [CrossRef] [PubMed]
- He, J.; Zhu, Z.; Bundy, J.D.; Dorans, K.S.; Chen, J.; Hamm, L.L. Trends in Cardiovascular Risk Factors in US Adults by Race and Ethnicity and Socioeconomic Status, 1999–2018. JAMA 2021, 326, 1286–1298. [Google Scholar] [CrossRef] [PubMed]
- Tarko, L.; Costa, L.; Galloway, A.; Ho, Y.L.; Gagnon, D.; Lioutas, V.; Seshadri, S.; Cho, K.; Wilson, P.; Aparicio, H.J. Racial and Ethnic Differences in Short- and Long-term Mortality by Stroke Type. Neurology 2022. [Google Scholar] [CrossRef]
- Kant, A.K.; Graubard, B.I. Race-ethnic, family income, and education differentials in nutritional and lipid biomarkers in US children and adolescents: NHANES 2003–2006. Am. J. Clin. Nutr. 2012, 96, 601–612. [Google Scholar] [CrossRef]
- Duggan, C.P.; Kurpad, A.; Stanford, F.C.; Sunguya, B.; Wells, J.C. Race, ethnicity, and racism in the nutrition literature: An update for 2020. Am. J. Clin. Nutr. 2020, 112, 1409–1414. [Google Scholar] [CrossRef]


| Variables | Stroke n = 929 | Non-Stroke n = 1858 | p-Value |
|---|---|---|---|
| Age, years (mean ± SD) | 67.46 ± 13.79 | 66.63 ± 13.84 | 0.135 |
| Sex, male (%) | 466 (50.16) | 931 (50.10) | 0.123 |
| Body mass index | 27.73 ± 2.46 | 28.45 ± 5.52 | <0.001 |
| Calories (kcal) | 1701.71 ± 802.15 | 1860.41 ± 825.6 | <0.001 |
| Protein (g) | 65.39 ± 34.42 | 72.17 ± 36.65 | <0.001 |
| Carbohydrate (g) | 210.88 ± 101.93 | 229.57 ± 107.07 | <0.001 |
| Total fat (g) | 65.42 ± 39.15 | 70.54 ± 39.11 | 0.001 |
| Total SFA (g) | 21.66 ± 14.06 | 22.39 ± 13.49 | 0.183 |
| Total MFA (g) | 24.06 ± 15.35 | 25.82 ± 15.56 | 0.005 |
| Total PFA (g) | 13.73 ± 9.71 | 15.21 ± 10.3 | <0.001 |
| Cholesterol (g) | 260.62 ± 215.13 | 268.52 ± 216.51 | 0.363 |
| Vitamin E (mg) | 5.86 ± 4.34 | 6.55 ± 4.94 | <0.001 |
| Retinol (μg) | 414.73 ± 679.61 | 413.76 ± 750.08 | 0.974 |
| Vitamin A, RAE (μg) | 574.82 ± 728.45 | 622.73 ± 835.68 | 0.137 |
| Vitamin B1 (mg) | 1.34 ± 0.73 | 1.46 ± 0.84 | <0.001 |
| Vitamin B2 (mg) | 1.83 ± 0.94 | 1.98 ± 1.04 | <0.001 |
| Niacin (mg) | 19.09 ± 10.52 | 20.84 ± 11.85 | <0.001 |
| Vitamin B6 (mg) | 1.58 ± 0.96 | 1.76 ± 1.03 | <0.001 |
| Vitamin B12 (μg) | 4.49 ± 7.03 | 5.09 ± 8.49 | 0.061 |
| Vitamin C (mg) | 77.44 ± 83.51 | 91.15 ± 91.83 | <0.001 |
| Vitamin K (μg) | 84.37 ± 142.6 | 99.1 ± 176.51 | 0.027 |
| Calcium (mg) | 739.34 ± 478.52 | 766.16 ± 470.14 | 0.158 |
| Phosphorus (mg) | 1066.8 ± 528.15 | 1165.91 ± 548.79 | <0.001 |
| Magnesium (mg) | 234.9 ± 115.1 | 265.62 ± 136.01 | <0.001 |
| Iron (mg) | 13.01 ± 7.44 | 14.37 ± 8.39 | <0.001 |
| Zinc (mg) | 9.74 ± 6.34 | 10.9 ± 10.25 | 0.002 |
| Copper (mg) | 1.11 ± 1.2 | 1.26 ± 1.4 | 0.004 |
| Sodium (mg) | 2788 ± 1535 | 2883 ± 1482 | 0.116 |
| Potassium (mg) | 2286 ± 1086 | 2555 ± 1195 | <0.001 |
| Selenium (μg) | 86.62 ± 49.08 | 95.33 ± 54.41 | <0.001 |
| Caffeine (mg) | 148.15 ± 194.25 | 150.44 ± 186.83 | 0.763 |
| Theobromine (mg) | 35.09 ± 75.5 | 30.16 ± 66.79 | 0.079 |
| Moisture (g) | 2155 ± 1299 | 2168 ±1197 | 0.785 |
| Death | 266 (28.63) | 407 (21.90) | <0.001 |
| Follow-up, months | 54.40 ± 33.26 | 82.24 ± 30.89 | <0.001 |
| Stroke (n = 929) | Non–Stroke (n = 1858) | Total (n = 2787) | |
|---|---|---|---|
| Calories (kcal) | |||
| Q1-L | 262–1146 | 164–1297 | 164–1249 |
| IQR | 1146–2058 | 1297–2297 | 1249–2237 |
| Q3-H | 2058–7301 | 2297–6798 | 2237–7301 |
| Protein (g) | |||
| Q1-L | 0.63–42.48 | 7.51–48.02 | 0.63–46.32 |
| IQR | 42.48–79.54 | 48.02–89.10 | 46.32–86.67 |
| Q3-H | 79.54–308.16 | 89.10–399.74 | 86.67–399.74 |
| Total fat (g) | |||
| Q1-L | 0.00–38.9 | 2.47–42.81 | 0.00–41.36 |
| IQR | 38.9–82.04 | 42.81–90.26 | 41.36–87.36 |
| Q3-H | 82.04–406.09 | 90.26–322.20 | 87.36–406.09 |
| Total SFA (g) | |||
| Q1-L | 0.00–12.14 | 0.41–12.80 | 0.00–12.64 |
| IQR | 12.14–27.54 | 12.80–28.72 | 12.64–28.47 |
| Q3-H | 27.54–117.70 | 28.72–105.76 | 28.47–117.70 |
| Total MFA (g) | |||
| Q1-L | 0.00–13.87 | 0.45–14.90 | 0.00–14.47 |
| IQR | 13.87–30.62 | 14.90–33.18 | 14.47–32.32 |
| Q3-H | 30.62–161.31 | 33.18–153.77 | 32.32–161.31 |
| Total PFA (g) | |||
| Q1-L | 0.00–7.31 | 0.77–7.89 | 0.00–7.72 |
| IQR | 7.31–17.70 | 7.89–19.48 | 7.72–18.86 |
| Q3-H | 17.70–110.97 | 19.48–96.90 | 18.86–110.97 |
| Vitamin E (mg) | |||
| Q1-L | 0.00–3.00 | 0.23–3.43 | 0.00–3.26 |
| IQR | 3.00–7.37 | 3.43–8.39 | 3.26–8.10 |
| Q3-H | 7.37–38.96 | 8.39–55.76 | 8.10–55.76 |
| Phosphorus (mg) | |||
| Q1-L | 0–704 | 77–797 | 0–758 |
| IQR | 704–1352 | 797–1442 | 758–1416 |
| Q3-H | 1352–4636 | 1442–4523 | 1416–4636 |
| Magnesium (mg) | |||
| Q1-L | 15–150 | 19–173 | 15–166 |
| IQR | 150–294 | 173–330 | 166–317 |
| Q3-H | 294–773 | 330–1451 | 317–1451 |
| Sodium (mg) | |||
| Q1-L | 41–1786 | 122–1851 | 41–1820 |
| IQR | 1786–3391 | 1851–3665 | 1820–3565 |
| Q3-H | 3391–12861 | 3665–11862 | 3565–12861 |
| Selenium (μg) | |||
| Q1-L | 0.00–54.20 | 4.8–60.4 | 0.00–58.10 |
| IQR | 54.20–109.00 | 60.4–116.9 | 58.10–114.50 |
| Q3-H | 109.00–422.10 | 116.9–651.7 | 114.50–651.70 |
| Caffeine (mg) | |||
| Q1-L | 0–10 | 0–10 | 0–10 |
| IQR | 10–208 | 10–213 | 10–213 |
| Q3-H | 208–2389 | 213–1971 | 213–2389 |
| Stroke (n = 929) | Non-Stroke (n = 1858) | Adjusted HR (95% CI) | |
|---|---|---|---|
| Mortality (%) | 266 (28.6) a | 407 (21.1) | 2.208 (1.887–2.583) |
| Mortality with nutritional consumption (%) | |||
| Calories (kcal) | |||
| Q1-L | 80 (34.5) | 133 (28.7) | 2.075 (1.564–2.753) |
| IQR | 129 (27.7) | 203 (21.9) | 2.135 (1.706–2.672) |
| Q3-H | 57 (24.6) | 71 (15.3) | 2.711 (1.905–3.857) |
| Protein (g) | |||
| Q1-L | 80 (34.5) | 122 (26.3) | 2.316 (1.736–3.089) |
| IQR | 132 (28.4) | 207 (22.3) | 2.156 (1.727–2.692) |
| Q3-H | 54 (23.3) | 78 (16.8) | 2.292 (1.614–3.256) |
| Total fat (g) | |||
| Q1-L | 76 (32.5) | 121 (26.1) | 2.172 (1.617–2.917) |
| IQR | 141 (30.5) | 208 (22.4) | 2.398 (1.930–2.981) |
| Q3-H | 49 (21.0) | 78 (16.8) | 1.968 (1.372–2.822) |
| Total SFA (g) | |||
| Q1-L | 66 (28.4) | 120 (25.9) | 1.909 (1.405–2.595) |
| IQR | 146 (31.7) | 216 (23.3) | 2.299 (1.858–2.854) |
| Q3-H | 54 (22.9) | 71 (15.3) | 2.479 (1.732–3.548) |
| Total MFA (g) | |||
| Q1-L | 74 (32.3) | 123 (26.5) | 2.181 (1.620–2.936) |
| IQR | 141 (30.1) | 205 (22.1) | 2.357 (1.896–2.930) |
| Q3-H | 51 (22.0) | 79 (17.0) | 2.049 (1.436–2.924) |
| Total PFA (g) | |||
| Q1-L | 75 (32.3) | 114 (24.6) | 2.161 (1.604–2.912) |
| IQR | 133 (28.6) | 216 (23.3) | 2.204 (1.769–2.746) |
| Q3-H | 58 (25.0) | 77 (16.6) | 2.381 (1.688–3.359) |
| Vitamin E (mg) | |||
| Q1-L | 67 (28.6) | 119 (25.6) | 1.923 (1.415–2.613) |
| IQR | 147 (31.7) | 221 (23.8) | 2.279 (1.844–2.817) |
| Q3-H | 52 (22.4) | 67 (14.4) | 2.561 (1.776–3.694) |
| Phosphorus (mg) | |||
| Q1-L | 82 (35.2) | 120 (25.8) | 2.439 (1.825–3.258) |
| IQR | 127 (27.4) | 207 (22.3) | 2.031 (1.624–2.540) |
| Q3-H | 57 (24.6) | 80 (17.2) | 2.436 (1.727–3.437) |
| Magnesium (mg) | |||
| Q1-L | 76 (32.6) | 125 (26.9) | 1.934 (1–447–2.585) |
| IQR | 126 (27.2) | 218 (23.5) | 2.036 (1.628–2.545) |
| Q3-H | 64 (27.6) | 64 (13.8) | 3.347 (2.357–4.754) |
| Sodium (mg) | |||
| Q1-L | 80 (34.5) | 110 (23.7) | 2.348 (1.752–3.148) |
| IQR | 121 (26.0) | 233 (25.1) | 1.850 (1.480–2.313) |
| Q3-H | 65 (28.0) | 64 (13.8) | 3.240 (2.285–4.593) |
| Selenium (μg) | |||
| Q1-L | 80 (34.5) | 125 (26.9) | 2.128 (1.599–2.831) |
| IQR | 126 (27.1) | 199 (21.4) | 2.174 (1.732–2.728) |
| Q3-H | 60 (25.9) | 83 (17.9) | 2.455 (1.754–3.437) |
| Caffeine (mg) | |||
| Q1-L | 81 (34.9) | 114 (24.3) | 2.492 (1.864–3.333) |
| IQR | 128 (27.5) | 212 (23.2) | 1.951 (1.562–2.435) |
| Q3-H | 57 (24.6) | 81 (17.1) | 2.537 (1.795–3.584) |
| Moisture (g) | |||
| Q1-L | 99 (42.5) | 145 (31.3) | 2.059 (1.591–2.666) |
| IQR | 125 (26.9) | 203 (21.9) | 2.053 (1.637–2.575) |
| Q3-H | 42 (18.1) | 59 (12.7) | 2.930 (1.949–4.405) |
| Stroke | Log Rank | Adjusted HR (95% CI) | ||
|---|---|---|---|---|
| (n = 929) | p-Value | Q1-L to IQR | IQR to Q3-H | Q1-L to Q3-H |
| Calories | 0.043 | 0.744 * (0.559–0.990) | 1.062 (0.771–1.464) | 0.866 (0.719–1.043) |
| Protein | 0.026 | 0.681 ** (0.511–0.907) | 1.081 (0.778–1.501) | 0.816 * (0.673–0.991) |
| Total fat | 0.002 | 0.940 (0.711–1.244) | 0.713 * (0.512–0.993) | 0.837 (0.694–1.010) |
| Total SFA | 0.073 | 1.101 (0.822–1.475) | 0.807 (0.588–1.109) | 0.926 (0.767–1.118) |
| Total MFA | 0.008 | 0.887 (0.668–1.177) | 0.774 (0.558–1.074) | 0.841 (0.697–1.016) |
| Total PFA | 0.214 | 0.832 (0.625–1.107) | 0.881 (0.646–1.202) | 0.863 (0.742–1.029) |
| Vitamin E | 0.101 | 0.992 (0.740–1.328) | 0.780 (0.568–1.071) | 0.877 (0.729–1.056) |
| Phosphorus | 0.036 | 0.714 * (0.537–0.949) | 1.113 (0.810–1.529) | 0.851 (0.711–1.019) |
| Magnesium | 0.767 | 0.773 (0.579–1.033) | 1.104 (0.813–1.500) | 0.870 (0.729–1.037) |
| Sodium | 0.177 | 0.787 (0.593–1.045) | 1.142 (0.840–1.554) | 0.995 (0.837–1.181) |
| Selenium | 0.143 | 0.703 * (0.527–0.937) | 1.164 (0.850–1.593) | 0.866 (0.721–1.040) |
| Caffeine | 0.009 | 0.740 * (0.560–0.978) | 1.013 (0.736–1.392) | 0.848 (0.713–1.009) |
| Moisture | 0.004 | 0.783 (0.597–1.027) | 1.203 (0.838–1.726) | 0.942 (0.775–1.145) |
| Stroke Q3-H (n = 232) | Non-Stroke Q1-L (n = 464) | Adjusted HR (95% CI) | |||
|---|---|---|---|---|---|
| Dead (%) | Follow-Up | Dead (%) | Follow-Up | ||
| Calories | 57 (24.6) | 56.1 ± 35.3 | 133 (28.7) | 82.0 ± 32.5 | 0.622 ** (0.445–0.869) |
| Protein | 54 (23.3) | 55.9 ± 35.3 | 121 (26.3) | 83.3 ± 32.0 | 0.491 ** (0.345–0.698) |
| Total fat | 49 (21.0) | 60.2 ± 34.7 | 121 (26.1) | 81.3 ± 32.2 | 0.739 (0.522–1.046) |
| Total SFA | 54 (22.9) | 56.5 ± 33.7 | 120 (25.8) | 83.7 ± 31.9 | 0.643 ** (0.459–0.902) |
| Total MFA | 51 (22.0) | 59.9 ± 34.1 | 123 (26.5) | 81.8 ± 32.3 | 0.672 * (0.476–0.949) |
| Total PFA | 58 (25.0) | 57.6 ± 34.8 | 114 (24.6) | 84.6 ± 32.9 | 0.620 ** (0.448–0.858) |
| Vitamin E | 52 (22.4) | 54.2 ± 34.3 | 119 (25.6) | 84.7 ± 32.5 | 0.658 * (0.471–0.918) |
| Phosphorus | 57 (24.6) | 54.9 ± 34.9 | 120 (25.8) | 83.6 ± 32.6 | 0.563 ** (0.403–0.787) |
| Magnesium | 64 (27.6) | 54.4 ± 34.0 | 125 (26.9) | 85.0 ± 32.8 | 0.576 ** (0.419–0.791) |
| Sodium | 65 (28.0) | 56.3 ± 35.2 | 110 (23.7) | 84.1 ± 32.4 | 0.476 ** (0.345–0.658) |
| Selenium | 60 (25.9) | 54.3 ± 35.0 | 125 (26.9) | 82.4 ± 32.5 | 0.533 ** (0.382–0.743) |
| Caffeine | 57 (24.6) | 56.4 ± 32.0 | 114 (24.3) | 83.3 ± 32.8 | 0.568 ** (0.409–0.791) |
| Moisture | 42 (18.1) | 46.9 ± 27.5 | 145 (31.3) | 89.6 ± 33.7 | 0.397 (0.273–0.576) |
Disclaimer/Publisher’s Note: The statements, opinions and data contained in all publications are solely those of the individual author(s) and contributor(s) and not of MDPI and/or the editor(s). MDPI and/or the editor(s) disclaim responsibility for any injury to people or property resulting from any ideas, methods, instructions or products referred to in the content. |
© 2023 by the authors. Licensee MDPI, Basel, Switzerland. This article is an open access article distributed under the terms and conditions of the Creative Commons Attribution (CC BY) license (https://creativecommons.org/licenses/by/4.0/).
Share and Cite
Lu, H.-Y.; Ho, U.-C.; Kuo, L.-T. Impact of Nutritional Status on Outcomes of Stroke Survivors: A Post Hoc Analysis of the NHANES. Nutrients 2023, 15, 294. https://doi.org/10.3390/nu15020294
Lu H-Y, Ho U-C, Kuo L-T. Impact of Nutritional Status on Outcomes of Stroke Survivors: A Post Hoc Analysis of the NHANES. Nutrients. 2023; 15(2):294. https://doi.org/10.3390/nu15020294
Chicago/Turabian StyleLu, Hsueh-Yi, Ue-Cheung Ho, and Lu-Ting Kuo. 2023. "Impact of Nutritional Status on Outcomes of Stroke Survivors: A Post Hoc Analysis of the NHANES" Nutrients 15, no. 2: 294. https://doi.org/10.3390/nu15020294
APA StyleLu, H.-Y., Ho, U.-C., & Kuo, L.-T. (2023). Impact of Nutritional Status on Outcomes of Stroke Survivors: A Post Hoc Analysis of the NHANES. Nutrients, 15(2), 294. https://doi.org/10.3390/nu15020294