
Ultra-Processed Food as Mediator of the Association between Birthweight and Childhood Body Weight Outcomes: A Retrospective Cohort Study

Abstract
:1. Introduction
2. Materials and Methods
2.1. Study Design and Participants
2.2. Socioeconomic and Anthropometric Measures
2.3. Ultra-Processed Food Groups
2.4. Study Covariates
2.5. Statistical Analysis
3. Results
3.1. Participant Characteristics
3.2. UPF Consumption and Daily Nutrient Profiles
3.3. Associations of Birth Weight and Childhood BMI Measurements
3.4. Associations of UPF Consumption and Childhood BMI Measurements
3.5. Birthweight and BMI Outcomes by Quartiles of UPF Consumption
4. Discussion
5. Conclusions
Supplementary Materials
Author Contributions
Funding
Institutional Review Board Statement
Informed Consent Statement
Data Availability Statement
Acknowledgments
Conflicts of Interest
References
- Gungor, N.K. Overweight and obesity in children and adolescents. JCRPE 2014, 6, 129–143. [Google Scholar] [CrossRef] [PubMed]
- Evensen, E.; Wilsgaard, T.; Furberg, A.S.; Skeie, G. Tracking of overweight and obesity from early childhood to adolescence in a population-based cohort—The Tromsø Study, Fit Futures. BMC Pediatr. 2016, 16, 64. [Google Scholar] [CrossRef] [PubMed]
- Han, J.C.; Lawlor, D.A.; Kimm, S.Y. Childhood obesity. Lancet 2010, 375, 1737–1748. [Google Scholar] [CrossRef] [PubMed]
- Pan, X.-F.; Wang, L.; Pan, A. Epidemiology and determinants of obesity in China. Lancet Diabetes Endocrinol. 2021, 9, 373–392. [Google Scholar] [CrossRef]
- World Health Organization. Taking Action on Childhood Obesity; World Health Organization: Geneva, Switzerland, 2018. [Google Scholar]
- Cecchini, M.; Sassi, F.; Lauer, J.A.; Lee, Y.Y.; Guajardo-Barron, V.; Chisholm, D. Tackling of unhealthy diets, physical inactivity, and obesity: Health effects and cost-effectiveness. Lancet 2010, 376, 1775–1784. [Google Scholar] [CrossRef]
- Mozaffarian, D. Dietary and policy priorities to reduce the global crises of obesity and diabetes. Nat. Food 2020, 1, 38–50. [Google Scholar] [CrossRef]
- Monteiro, C.A.; Cannon, G.; Levy, R.B.; Moubarac, J.-C.; Louzada, M.L.C.; Rauber, F.; Khandpur, N.; Cediel, G.; Neri, D.; Martinez-Steele, E.; et al. Ultra-processed foods: What they are and how to identify them. Public Health Nutr. 2019, 22, 936–941. [Google Scholar] [CrossRef]
- Monteiro, C.A.; Cannon, G.; Moubarac, J.C.; Levy, R.B.; Louzada, M.L.C.; Jaime, P.C. The UN Decade of Nutrition, the NOVA food classification and the trouble with ultra-processing. Public Health Nutr. 2018, 21, 5–17. [Google Scholar] [CrossRef]
- Luiten, C.M.; Steenhuis, I.H.; Eyles, H.; Ni Mhurchu, C.; Waterlander, W.E. Ultra-processed foods have the worst nutrient profile, yet they are the most available packaged products in a sample of New Zealand supermarkets—CORRIGENDUM. Public Health Nutr. 2016, 19, 539. [Google Scholar] [CrossRef]
- Moubarac, J.C.; Martins, A.P.; Claro, R.M.; Levy, R.B.; Cannon, G.; Monteiro, C.A. Consumption of ultra-processed foods and likely impact on human health. Evidence from Canada. Public Health Nutr. 2013, 16, 2240–2248. [Google Scholar] [CrossRef]
- Meyer, K.A.; Taillie, L.S. Intake of Ultraprocessed Foods Among US Youths: Health Concerns and Opportunities for Research and Policy. JAMA 2021, 326, 485–487. [Google Scholar] [CrossRef] [PubMed]
- Wang, L.; Martínez Steele, E.; Du, M.; Pomeranz, J.L.; O’Connor, L.E.; Herrick, K.A.; Luo, H.; Zhang, X.; Mozaffarian, D.; Zhang, F.F. Trends in Consumption of Ultraprocessed Foods Among US Youths Aged 2–19 Years, 1999–2018. JAMA 2021, 326, 519–530. [Google Scholar] [CrossRef] [PubMed]
- Onita, B.M.; Azeredo, C.M.; Jaime, P.C.; Levy, R.B.; Rauber, F. Eating context and its association with ultra-processed food consumption by British children. Appetite 2021, 157, 105007. [Google Scholar] [CrossRef] [PubMed]
- An, M.; Liu, X.; Guo, H.; Zhou, Q. The Associations between Caregivers’ Emotional and Instrumental Feeding, Children’s Emotional Eating, and Children’s Consumption of Ultra-Processed Foods in China. Int. J. Environ. Res. Public Health 2022, 19, 4439. [Google Scholar] [CrossRef]
- Zhang, S.; Gan, S.; Zhang, Q.; Liu, L.; Meng, G.; Yao, Z.; Wu, H.; Gu, Y.; Wang, Y.; Zhang, T.; et al. Ultra-processed food consumption and the risk of non-alcoholic fatty liver disease in the Tianjin Chronic Low-grade Systemic Inflammation and Health Cohort Study. Int. J. Epidemiol. 2021, 51, 237–249. [Google Scholar] [CrossRef]
- Fonseca, M.J.; Severo, M.; Correia, S.; Santos, A.C. Effect of birth weight and weight change during the first 96 h of life on childhood body composition—Path analysis. Int. J. Obes. 2015, 39, 579–585. [Google Scholar] [CrossRef]
- Mitchell, E.A.; Stewart, A.W.; Braithwaite, I.; Hancox, R.J.; Murphy, R.; Wall, C.; Beasley, R.; ISAAC Phase Three Study Group. Birth weight and subsequent body mass index in children: An international cross-sectional study. Pediatr. Obes. 2017, 12, 280–285. [Google Scholar] [CrossRef]
- Qiao, Y.; Ma, J.; Wang, Y.; Li, W.; Katzmarzyk, P.T.; Chaput, J.P.; Fogelholm, M.; Johnson, W.D.; Kuriyan, R.; Kurpad, A.; et al. Birth weight and childhood obesity: A 12-country study. Int. J. Obes. Suppl. 2015, 5, S74–S79. [Google Scholar] [CrossRef]
- Kapral, N.; Miller, S.E.; Scharf, R.J.; Gurka, M.J.; DeBoer, M.D. Associations between birthweight and overweight and obesity in school-age children. Pediatr. Obes. 2018, 13, 333–341. [Google Scholar] [CrossRef]
- Rugholm, S.; Baker, J.L.; Olsen, L.W.; Schack-Nielsen, L.; Bua, J.; Sørensen, T.I. Stability of the association between birth weight and childhood overweight during the development of the obesity epidemic. Obes. Res. 2005, 13, 2187–2194. [Google Scholar] [CrossRef]
- Suchomlinov, A.; Tutkuviene, J. The relationship between birth weight, adiposity rebound and overweight at the age of 17 years (results of the Lithuanian longitudinal growth study, 1990–2008). Anthropol. Anz. 2014, 71, 329–346. [Google Scholar] [CrossRef] [PubMed]
- Reilly, J.J.; Armstrong, J.; Dorosty, A.R.; Emmett, P.M.; Ness, A.; Rogers, I.; Steer, C.; Sherriff, A. Early life risk factors for obesity in childhood: Cohort study. BMJ 2005, 330, 1357. [Google Scholar] [CrossRef] [PubMed]
- Brophy, S.; Cooksey, R.; Gravenor, M.B.; Mistry, R.; Thomas, N.; Lyons, R.A.; Williams, R. Risk factors for childhood obesity at age 5: Analysis of the millennium cohort study. BMC Public Health 2009, 9, 467. [Google Scholar] [CrossRef] [PubMed]
- Heppe, D.H.M.; Kiefte-de Jong, J.C.; Durmuş, B.; Moll, H.A.; Raat, H.; Hofman, A.; Jaddoe, V.W.V. Parental, fetal, and infant risk factors for preschool overweight: The Generation R Study. Pediatr. Res. 2013, 73, 120–127. [Google Scholar] [CrossRef] [PubMed]
- Janjua, N.Z.; Mahmood, B.; Islam, M.A.; Goldenberg, R.L. Maternal and Early Childhood Risk Factors for Overweight and Obesity among Low-Income Predominantly Black Children at Age Five Years: A Prospective Cohort Study. J. Obes. 2012, 2012, 457173. [Google Scholar] [CrossRef] [PubMed]
- Johnsson, I.W.; Haglund, B.; Ahlsson, F.; Gustafsson, J. A high birth weight is associated with increased risk of type 2 diabetes and obesity. Pediatr. Obes. 2015, 10, 77–83. [Google Scholar] [CrossRef]
- Frye, C.; Heinrich, J. Trends and predictors of overweight and obesity in East German children. Int. J. Obes. Relat. Metab. Disord. 2003, 27, 963–969. [Google Scholar] [CrossRef]
- Hirschler, V.; Bugna, J.; Roque, M.; Gilligan, T.; Gonzalez, C. Does Low Birth Weight Predict Obesity/Overweight and Metabolic Syndrome in Elementary School Children? Arch. Med. Res. 2008, 39, 796–802. [Google Scholar] [CrossRef]
- Yu, Z.B.; Han, S.P.; Zhu, G.Z.; Zhu, C.; Wang, X.J.; Cao, X.G.; Guo, X.R. Birth weight and subsequent risk of obesity: A systematic review and meta-analysis. Obes. Rev. Off. J. Int. Assoc. Study Obes. 2011, 12, 525–542. [Google Scholar] [CrossRef]
- Schellong, K.; Schulz, S.; Harder, T.; Plagemann, A. Birth weight and long-term overweight risk: Systematic review and a meta-analysis including 643,902 persons from 66 studies and 26 countries globally. PLoS ONE 2012, 7, e47776. [Google Scholar] [CrossRef]
- Oldroyd, J.; Renzaho, A.; Skouteris, H. Low and high birth weight as risk factors for obesity among 4 to 5-year-old Australian children: Does gender matter? Eur. J. Pediatr. 2011, 170, 899–906. [Google Scholar] [CrossRef] [PubMed]
- Chen, C.; Jin, Z.; Yang, Y.; Jiang, F.; Huang, H.; Liu, S.; Jin, X. Association of low birth weight with thinness and severe obesity in children aged 3–12 years: A large-scale population-based cross-sectional study in Shanghai, China. BMJ Open 2019, 9, e028738. [Google Scholar] [CrossRef] [PubMed]
- Costa, C.S.; Del-Ponte, B.; Assunção, M.C.F.; Santos, I.S. Consumption of ultra-processed foods and body fat during childhood and adolescence: A systematic review. Public Health Nutr. 2018, 21, 148–159. [Google Scholar] [CrossRef] [PubMed]
- Askari, M.; Heshmati, J.; Shahinfar, H.; Tripathi, N.; Daneshzad, E. Ultra-processed food and the risk of overweight and obesity: A systematic review and meta-analysis of observational studies. Int. J. Obes. 2020, 44, 2080–2091. [Google Scholar] [CrossRef] [PubMed]
- Cai, M.; Loy, S.L.; Tan, K.H.; Godfrey, K.M.; Gluckman, P.D.; Chong, Y.S.; Shek, L.P.; Cheung, Y.B.; Lek, N.; Lee, Y.S.; et al. Association of Elective and Emergency Cesarean Delivery with Early Childhood Overweight at 12 Months of Age. JAMA Netw. Open 2018, 1, e185025. [Google Scholar] [CrossRef]
- Wada, K.; Tamakoshi, K.; Tsunekawa, T.; Otsuka, R.; Zhang, H.; Murata, C.; Nagasawa, N.; Matsushita, K.; Sugiura, K.; Yatsuya, H.; et al. Validity of self-reported height and weight in a Japanese workplace population. Int. J. Obes. 2005, 29, 1093–1099. [Google Scholar] [CrossRef]
- Cole, T.J.; Bellizzi, M.C.; Flegal, K.M.; Dietz, W.H. Establishing a standard definition for child overweight and obesity worldwide: International survey. BMJ 2000, 320, 1240–1243. [Google Scholar] [CrossRef]
- Li, H.; Ji, C.Y.; Zong, X.N.; Zhang, Y.Q. Body mass index growth curves for Chinese children and adolescents aged 0 to 18 years. Zhonghua Er Ke Za Zhi 2009, 47, 493–498. [Google Scholar]
- Group of China Obesity Task Force. Body mass index reference norm for screening overweight and obesity in Chinese children and adolescents. Zhonghua Liu Xing Bing Xue Za Zhi 2004, 25, 97–102. [Google Scholar]
- Ji, C.-Y.; Working Group on Obesity in China. Report on childhood obesity in China (1)—Body mass index reference for screening overweight and obesity in Chinese school-age children. Biomed. Environ. Sci. 2005, 18, 390–400. [Google Scholar]
- Jones, J.M. Food processing: Criteria for dietary guidance and public health? Proc. Nutr. Soc. 2019, 78, 4–18. [Google Scholar] [CrossRef] [PubMed]
- Baker, P.; Machado, P.; Santos, T.; Sievert, K.; Backholer, K.; Hadjikakou, M.; Russell, C.; Huse, O.; Bell, C.; Scrinis, G.; et al. Ultra-processed foods and the nutrition transition: Global, regional and national trends, food systems transformations and political economy drivers. Obes. Rev. 2020, 21, e13126. [Google Scholar] [CrossRef] [PubMed]
- Adams, J.; Hofman, K.; Moubarac, J.C.; Thow, A.M. Public health response to ultra-processed food and drinks. BMJ 2020, 369, m2391. [Google Scholar] [CrossRef] [PubMed]
- Rauber, F.; Chang, K.; Vamos, E.P.; da Costa Louzada, M.L.; Monteiro, C.A.; Millett, C.; Levy, R.B. Ultra-processed food consumption and risk of obesity: A prospective cohort study of UK Biobank. Eur. J. Nutr. 2021, 60, 2169–2180. [Google Scholar] [CrossRef]
- Beslay, M.; Srour, B.; Méjean, C.; Allès, B.; Fiolet, T.; Debras, C.; Chazelas, E.; Deschasaux, M.; Wendeu-Foyet, M.G.; Hercberg, S.; et al. Ultra-processed food intake in association with BMI change and risk of overweight and obesity: A prospective analysis of the French NutriNet-Santé cohort. PLoS Med. 2020, 17, e1003256. [Google Scholar] [CrossRef]
- Rauber, F.; Da Costa Louzada, M.L.; Steele, E.M.; Millett, C.; Monteiro, C.A.; Levy, R.B. Ultra-Processed Food Consumption and Chronic Non-Communicable Diseases-Related Dietary Nutrient Profile in the UK (2008–2014). Nutrients 2018, 10, 587. [Google Scholar] [CrossRef]
- Adams, J.; White, M. Characterisation of UK diets according to degree of food processing and associations with socio-demographics and obesity: Cross-sectional analysis of UK National Diet and Nutrition Survey (2008–12). Int. J. Behav. Nutr. Phys. Act. 2015, 12, 160. [Google Scholar] [CrossRef]
- Costa, C.S.; Rauber, F.; Leffa, P.S.; Sangalli, C.N.; Campagnolo, P.D.B.; Vitolo, M.R. Ultra-processed food consumption and its effects on anthropometric and glucose profile: A longitudinal study during childhood. Nutr. Metab. Cardiovasc. Dis. 2019, 29, 177–184. [Google Scholar] [CrossRef]
- Vedovato, G.M.; Vilela, S.; Severo, M.; Rodrigues, S.; Lopes, C.; Oliveira, A. Ultra-processed food consumption, appetitive traits and BMI in children: A prospective study. Br. J. Nutr. 2021, 125, 1427–1436. [Google Scholar] [CrossRef]
- Hui, L.L.; Schooling, C.M.; Leung, S.S.L.; Mak, K.H.; Ho, L.M.; Lam, T.H.; Leung, G.M. Birth Weight, Infant Growth, and Childhood Body Mass Index: Hong Kong’s Children of 1997 Birth Cohort. Arch. Pediatr. Adolesc. Med. 2008, 162, 212–218. [Google Scholar] [CrossRef]
- Casey, P.H.; Bradley, R.H.; Whiteside-Mansell, L.; Barrett, K.; Gossett, J.M.; Simpson, P.M. Evolution of obesity in a low birth weight cohort. J. Perinatol. 2012, 32, 91–96. [Google Scholar] [CrossRef] [PubMed]
- Parsons, T.J.; Power, C.; Logan, S.; Summerbell, C.D. Childhood predictors of adult obesity: A systematic review. Int. J. Obes. Relat. Metab. Disord. 1999, 23 (Suppl. 8), S1–S107. [Google Scholar]
- Kirk, S.; Brehm, B.; Saelens, B.E.; Woo, J.G.; Kissel, E.; D’Alessio, D.; Bolling, C.; Daniels, S.R. Role of Carbohydrate Modification in Weight Management among Obese Children: A Randomized Clinical Trial. J. Pediatr. 2012, 161, 320–327.E1. [Google Scholar] [CrossRef] [PubMed]
- Parsons, T.J.; Power, C.; Manor, O. Fetal and early life growth and body mass index from birth to early adulthood in 1958 British cohort: Longitudinal study. BMJ 2001, 323, 1331–1335. [Google Scholar] [CrossRef] [PubMed]
- Nagel, G.; Zoller, D.; Ruf, T.; Rohrmann, S.; Linseisen, J. Long-term reproducibility of a food-frequency questionnaire and dietary changes in the European Prospective Investigation into Cancer and Nutrition (EPIC)-Heidelberg cohort. Br. J. Nutr. 2007, 98, 194–200. [Google Scholar] [CrossRef]
- Steinemann, N.; Grize, L.; Ziesemer, K.; Kauf, P.; Probst-Hensch, N.; Brombach, C. Relative validation of a food frequency questionnaire to estimate food intake in an adult population. Food Nutr. Res. 2017, 61, 1305193. [Google Scholar] [CrossRef]


| Percentage of Energy Intake from UPF | ||||||
|---|---|---|---|---|---|---|
| Characteristics | Overall (n = 1370) | Q1 (n = 374) | Q2 (n = 369) | Q3 (n = 308) | Q4 (n = 317) | p Value e |
| Mean (SD) [range], % a | 27.7 (12.3) [0.0–73.8] | 12.5 (4.7) [0.0–19.2] | 24.6 (3.0) [19.3–29.3] | 33.1 (2.2) [19.3–36.7] | 43.7 (0.4) [36.8–73.8] | 0.000 |
| Total energy intake, kcal | 2804.6 (35.3) | 2891.5 (64.2) | 2915.7 (71.1) | 2732.9 (75.9) | 2634.1 (70.8) | 0.000 |
| Age, y | 10.7 (2.6) | 10.2 (2.7) | 10.6 (2.7) | 10.9 (2.4) | 11.1 (0.1) | 0.001 |
| Sex | 374 | 369 | 308 | 317 | 0.038 | |
| Male | 727 (53.1) | 177 (47.3) | 197 (53.4) | 179 (58.1) | 174 (54.5) | |
| Female | 643 (46.9) | 197 (52.7) | 172 (46.6) | 129 (41.9) | 145 (45.5) | |
| Weight, kg | 39.4 (14.6) | 36.6 (14.6) | 38.2 (14.3) | 41.2 (14.3) | 42.6 (14.5) | 0.000 |
| Height, cm | 145.7 (17.2) | 142.5 (18.3) | 144.9 (16.9) | 147.1 (16.8) | 149.3 (15.6) | 0.000 |
| BMI | 18.0 (3.7) | 17.3 (3.5) | 17.7 (3.7) | 18.5 (3.7) | 18.7 (3.8) | 0.000 |
| BMI z-score | 0.2 (1.4) | 0.0 (1.2) | 0.1 (1.6) | 0.4 (1.3) | 0.4 (1.3) | 0.000 |
| BMI status | 347 | 334 | 277 | 278 | 0.006 | |
| Underweight | 112 (9.1) | 40 (11.5) | 29 (8.7) | 27 (9.7) | 16 (5.8) | |
| Normal | 882 (71.4) | 250 (72.0) | 247 (74.0) | 181 (197.7) | 204 (73.4) | |
| Overweight | 134 (10.8) | 40 (11.5) | 33 (9.9) | 36 (30.0) | 25 (9.0) | |
| Obese | 108 (8.7) | 17 (4.9) | 25 (7.5) | 33 (24.2) | 33 (11.9) | |
| Birthweight b | 0.062 | |||||
| LBW | 32 (2.3) | 11 (2.9) | 11 (3.0) | 5 (1.6) | 5 (1.6) | |
| NBW | 1045 (76.3) | 291 (77.8) | 294 (79.7) | 229 (74.4) | 231 (72.4) | |
| HBW | 293 (21.4) | 72 (19.3) | 64 (17.3) | 74 (24.0) | 83 (26.0) | |
| Delivery mode | 367 | 353 | 293 | 306 | 0.025 | |
| Vaginal | 546 (41.4) | 174 (47.4) | 146 (41.4) | 106 (36.2) | 120 (39.2) | |
| Caesarean | 773 (58.6) | 193 (52.6) | 207 (58.6) | 187 (63.8) | 186 (60.8) | |
| Gestational age c | 366 | 351 | 292 | 302 | 0.939 | |
| Pre and early term | 60 (4.6) | 17 (4.6) | 14 (4.0) | 12 (4.1) | 17 (5.6) | |
| Full term | 1103 (84.1) | 308 (84.2) | 300 (85.5) | 247 (84.6) | 248 (82.1) | |
| Late or post term | 148 (11.3) | 41 (11.2) | 37 (10.5) | 33 (11.3) | 37 (12.3) | |
| Duration of Breastfeeding | 335 | 324 | 277 | 283 | 0.053 | |
| Never | 197 (16.2) | 44 (13.1) | 54 (16.7) | 50 (18.1) | 49 (17.3) | |
| <6 months | 144 (11.8) | 29 (8.7) | 45 (13.9) | 28 (10.1) | 42 (14.8) | |
| ≥6 months | 878 (72.0) | 262 (78.2) | 225 (69.4) | 199 (71.8) | 192 (67.8) | |
| Physical activity | 219 | 271 | 274 | 287 | 0.025 | |
| <30 min | 651 (61.9) | 126 (57.5) | 189 (69.7) | 159 (58.0) | 177 (61.7) | |
| 30–60 min | 273 (26.0) | 68 (31.1) | 57 (21.0) | 71 (25.9) | 77 (26.8) | |
| ≥60 min | 127 (12.1) | 25 (11.4) | 25 (9.2) | 44 (16.1) | 33 (11.5) | |
| Maternal BMI status | 225 | 275 | 283 | 297 | 0.576 | |
| Underweight | 66 (6.1) | 13 (5.8) | 21 (7.6) | 16 (5.7) | 16 (5.4) | |
| Normal | 698 (64.6) | 133 (59.1) | 179 (65.1) | 187 (66.1) | 199 (67.0) | |
| Overweight | 259 (24.0) | 66 (29.3) | 64 (23.3) | 63 (22.3) | 66 (22.2) | |
| Obese | 57 (5.3) | 13 (5.8) | 11 (14.5) | 17 (6.0) | 16 (5.4) | |
| Maternal education | 363 | 362 | 291 | 296 | 0.024 | |
| <High school | 488 (37.2) | 135 (37.2) | 118 (32.6) | 122 (41.9) | 113 (38.2) | |
| High school or equivalent | 333 (25.4) | 75 (20.7) | 102 (28.2) | 79 (27.1) | 77 (26.0) | |
| College graduate and above | 491 (37.4) | 153 (42.1) | 142 (39.2) | 90 (30.9) | 106 (35.8) | |
| Family income d | 351 | 339 | 275 | 282 | 0.013 | |
| Low | 386 (31.0) | 108 (30.8) | 91 (26.8) | 97 (35.3) | 90 (31.9) | |
| Middle | 402 (32.2) | 93 (26.5) | 118 (34.8) | 95 (34.5) | 96 (34.0) | |
| High | 459 (36.8) | 150 (42.7) | 130 (38.3) | 83 (30.2) | 96 (34.0) | |
| Nutrient Profiles | Percentage of Energy Intake from UPF a | |||||
|---|---|---|---|---|---|---|
| Overall Mean (SD) | Q1 Mean (SD) | Q2 Mean (SD) | Q3 Mean (SD) | Q4 Mean (SD) | p Value b | |
| Total energy intake (kcal) | 2804.6 (35.3) | 2891.5 (64.2) | 2915.7 (71.1) | 2732.9 (75.9) | 2634.1 (70.8) | <0.001 |
| Total protein, % of energy | 15.9 (3.2) | 14.7 (0.2) | 15.7 (0.1) | 16.4 (0.2) | 16.4 (0.2) | <0.001 |
| Total fat, % of energy | 26.6 (7.2) | 22.5 (0.4) | 25.0 (0.3) | 28.0 (0.3) | 30.0 (0.3) | <0.001 |
| Total carbohydrate, % of energy | 53.1 (9.2) | 57.4 (0.6) | 54.4 (0.4) | 51.2 (0.4) | 50.1 (0.4) | <0.001 |
| Unprocessed foods, % of energy | 63.3 (0.4) | 81.6 (0.4) | 66.1 (0.4) | 55.6 (0.4) | 45.9 (0.4) | <0.001 |
| Grains | 19.8 (0.4) | 33.3 (0.9) | 22.4 (0.6) | 12.8 (0.5) | 7.8 (0.4) | <0.001 |
| Meat, Poultry, Fish and Eggs | 16.5 (0.2) | 19.6 (0.6) | 16.6 (0.5) | 15.5 (0.4) | 13.8 (0.4) | <0.001 |
| Milk and plain yogurt | 1.4 (0.1) | 2.2 (0.1) | 1.4 (0.1) | 0.9 (0.1) | 0.8 (0.1) | <0.001 |
| Fruits | 6.7 (0.1) | 8.5 (0.3) | 6.9 (0.2) | 6.0 (0.2) | 5.1 (0.2) | <0.001 |
| Vegetables | 6.9 (0.1) | 7.5 (0.4) | 6.7 (0.3) | 6.9 (0.2) | 6.3 (0.2) | 0.016 |
| Mushroom and Alga | 0.3 (0.0) | 0.3 (0.0) | 0.2 (0.0) | 0.3 (0.0) | 0.3 (0.0) | <0.001 |
| Nuts, Seeds and Legumes | 4.4 (0.1) | 3.2 (0.2) | 4.5 (0.2) | 5.4 (0.2) | 4.9 (0.2) | <0.001 |
| Others | 10.3 (0.2) | 9.6 (0.4) | 10.5 (0.3) | 11.5 (0.3) | 9.7 (0.3) | <0.001 |
| BMI | BMI z-Score | Risk of Overweight or Obesity | ||||||
|---|---|---|---|---|---|---|---|---|
| β Coefficient (95% CI) | p-Value b | β Coefficient (95% CI) | p-Value b | OR (95% CI) | p-Value b | |||
| Birthweight | ||||||||
| unadjusted model | NBW | Ref. | -- | Ref. | -- | Ref. | -- | |
| LBW | 1.06 (−0.24 to 2.36) | 0.109 | 0.48 (−0.01 to 0.97) | 0.055 | 1.77 (0.78 to 4.05) | 0.175 | ||
| HBW | 1.52 (1.02 to 2.01) | <0.001 | 0.41 (0.22 to 0.60) | <0.001 | 1.90 (1.38 to 2.62) | <0.001 | ||
| p-value b | <0.001 | <0.001 | <0.001 | |||||
| adjusted model | NBW | Ref. | -- | Ref. | -- | Ref. | -- | |
| LBW | 1.02 (−0.84 to 2.89) | 0.283 | 0.40 (−0.27 to 1.07) | 0.246 | 0.98 (0.22 to 4.25) | 0.973 | ||
| HBW | 0.99 (0.39 to 1.58) | 0.001 | 0.36 (0.15 to 0.58) | 0.001 | 1.22 (0.79 to 1.88) | 0.382 | ||
| p-value b | 0.003 | 0.003 | 0.679 | |||||
| UPF Consumption a | ||||||||
| unadjusted model | Q1 | Ref. | Ref. | Ref. | ||||
| Q2 | 0.41 (−0.13 to 0.94) | 0.134 | 0.04 (−0.16 to 0.24) | 0.699 | 0.91 (0.66 to 1.25) | 0.569 | ||
| Q3 | 1.07 (0.52 to 1.63) | <0.001 | 0.31 (0.10 to 0.52) | 0.003 | 1.30 (0.94 to 1.79) | 0.115 | ||
| Q4 | 1.37 (0.83 to 1.92) | <0.001 | 0.35 (0.15 to 0.55) | 0.001 | 0.95 (0.69 to 1.32) | 0.758 | ||
| p-value for trend b | <0.001 | <0.001 | 0.164 | |||||
| adjusted model | Q1 | Ref. | -- | Ref. | -- | Ref. | -- | |
| Q2 | 0.07 (−0.65 to 0.78) | 0.859 | 0.01 (−0.25 to 0.26) | 0.961 | 1.01 (0.57 to 1.80) | 0.976 | ||
| Q3 | 0.15 (−0.56 to 0.86) | 0.675 | 0.09 (−0.16 to 0.35) | 0.481 | 1.27 (0.73 to 2.22) | 0.395 | ||
| Q4 | 0.29 (−0.42 to 1.00) | 0.421 | 0.11 (−0.14 to 0.37) | 0.386 | 1.03 (0.58 to 1.82) | 0.927 | ||
| p-value for trend b | 0.861 | 0.746 | 0.763 | |||||
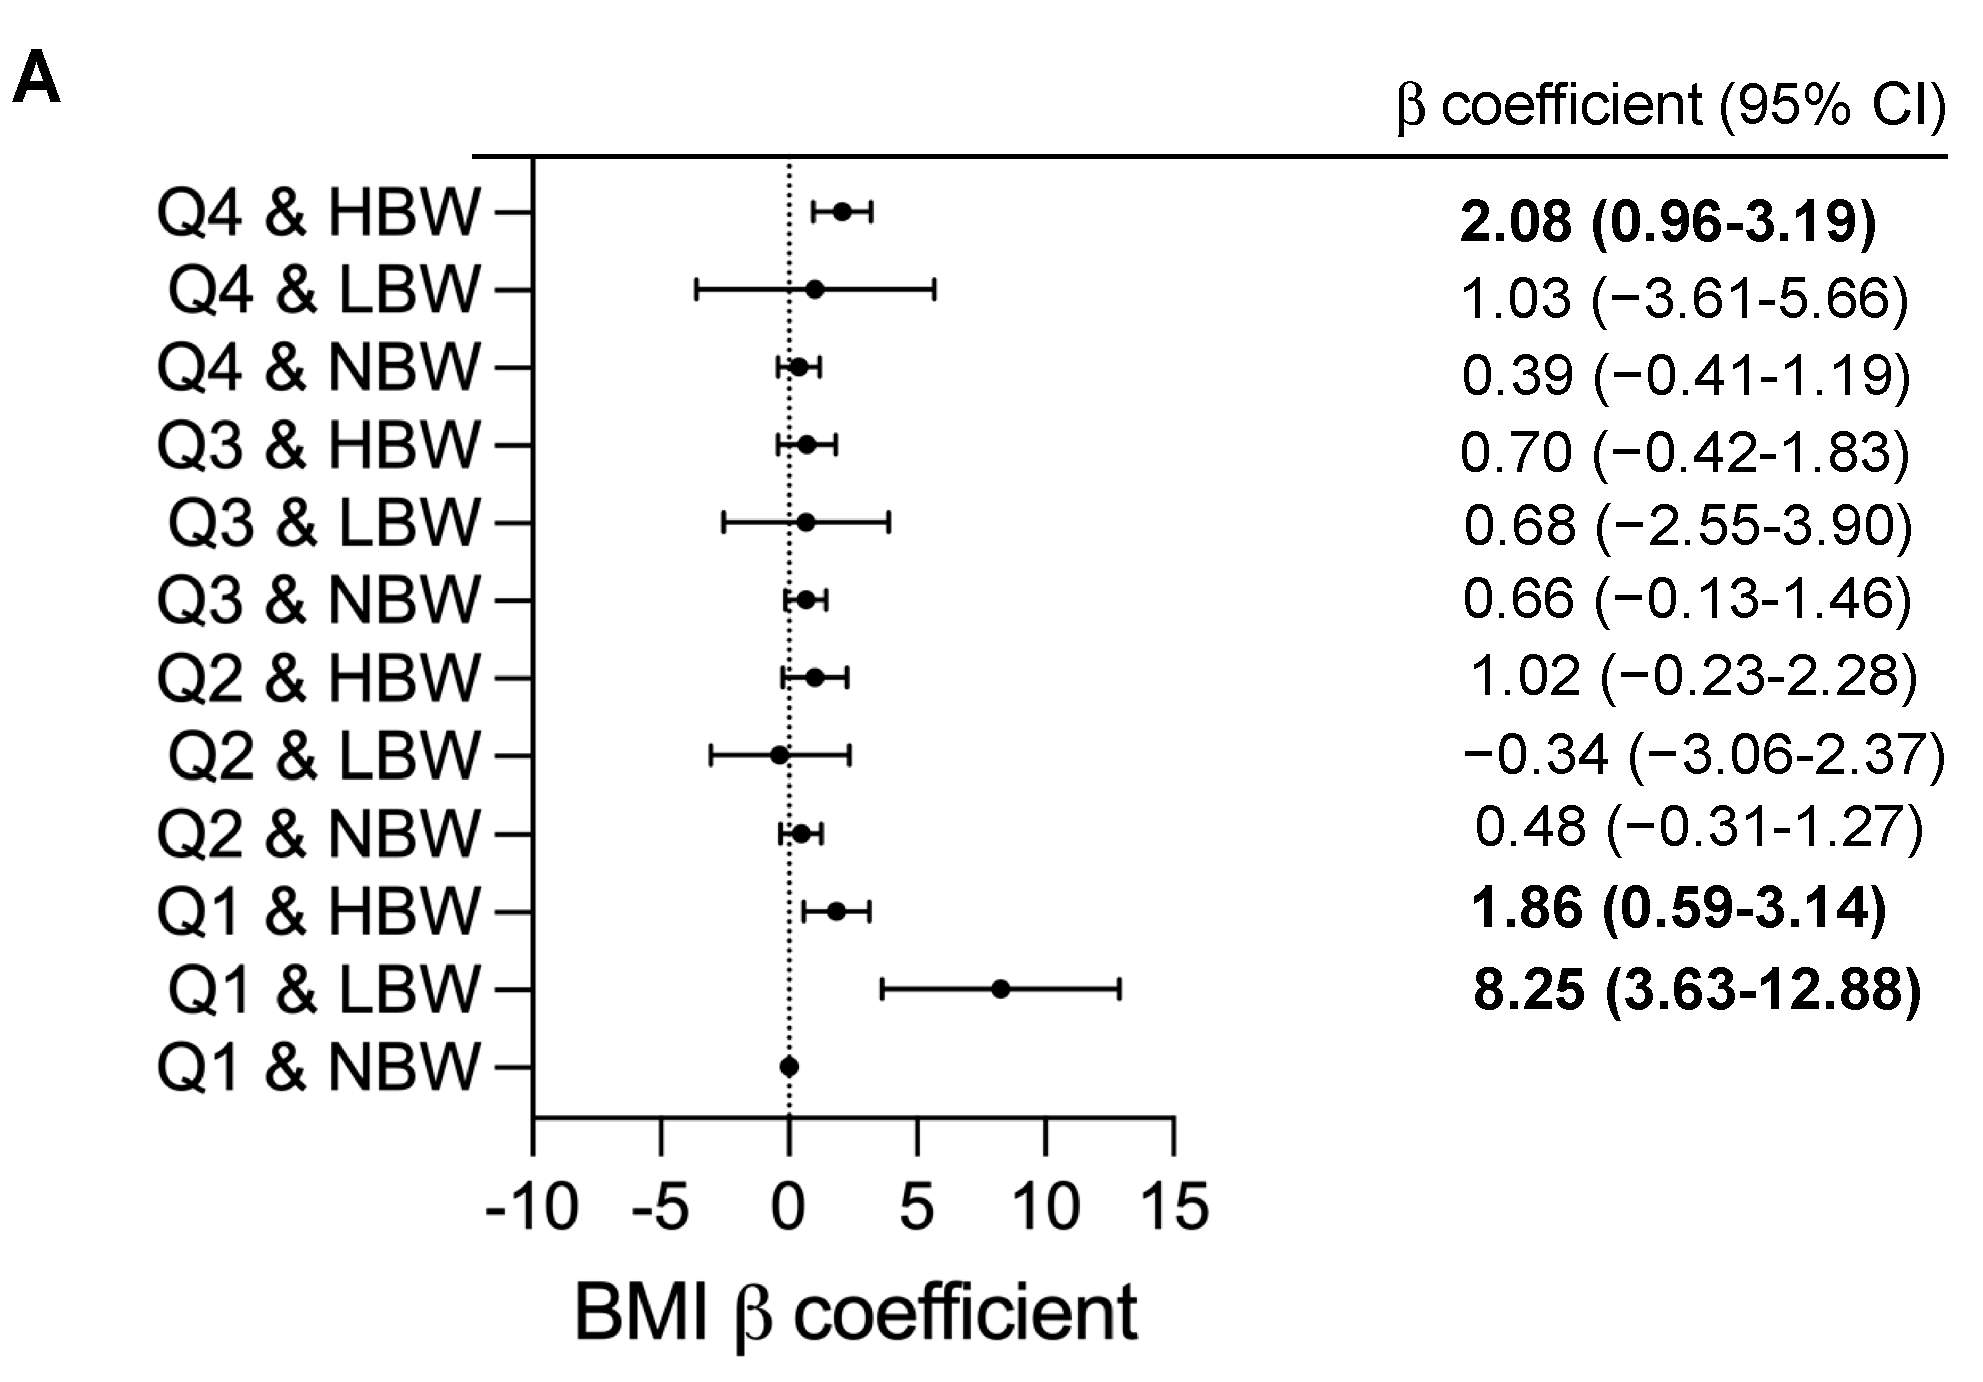
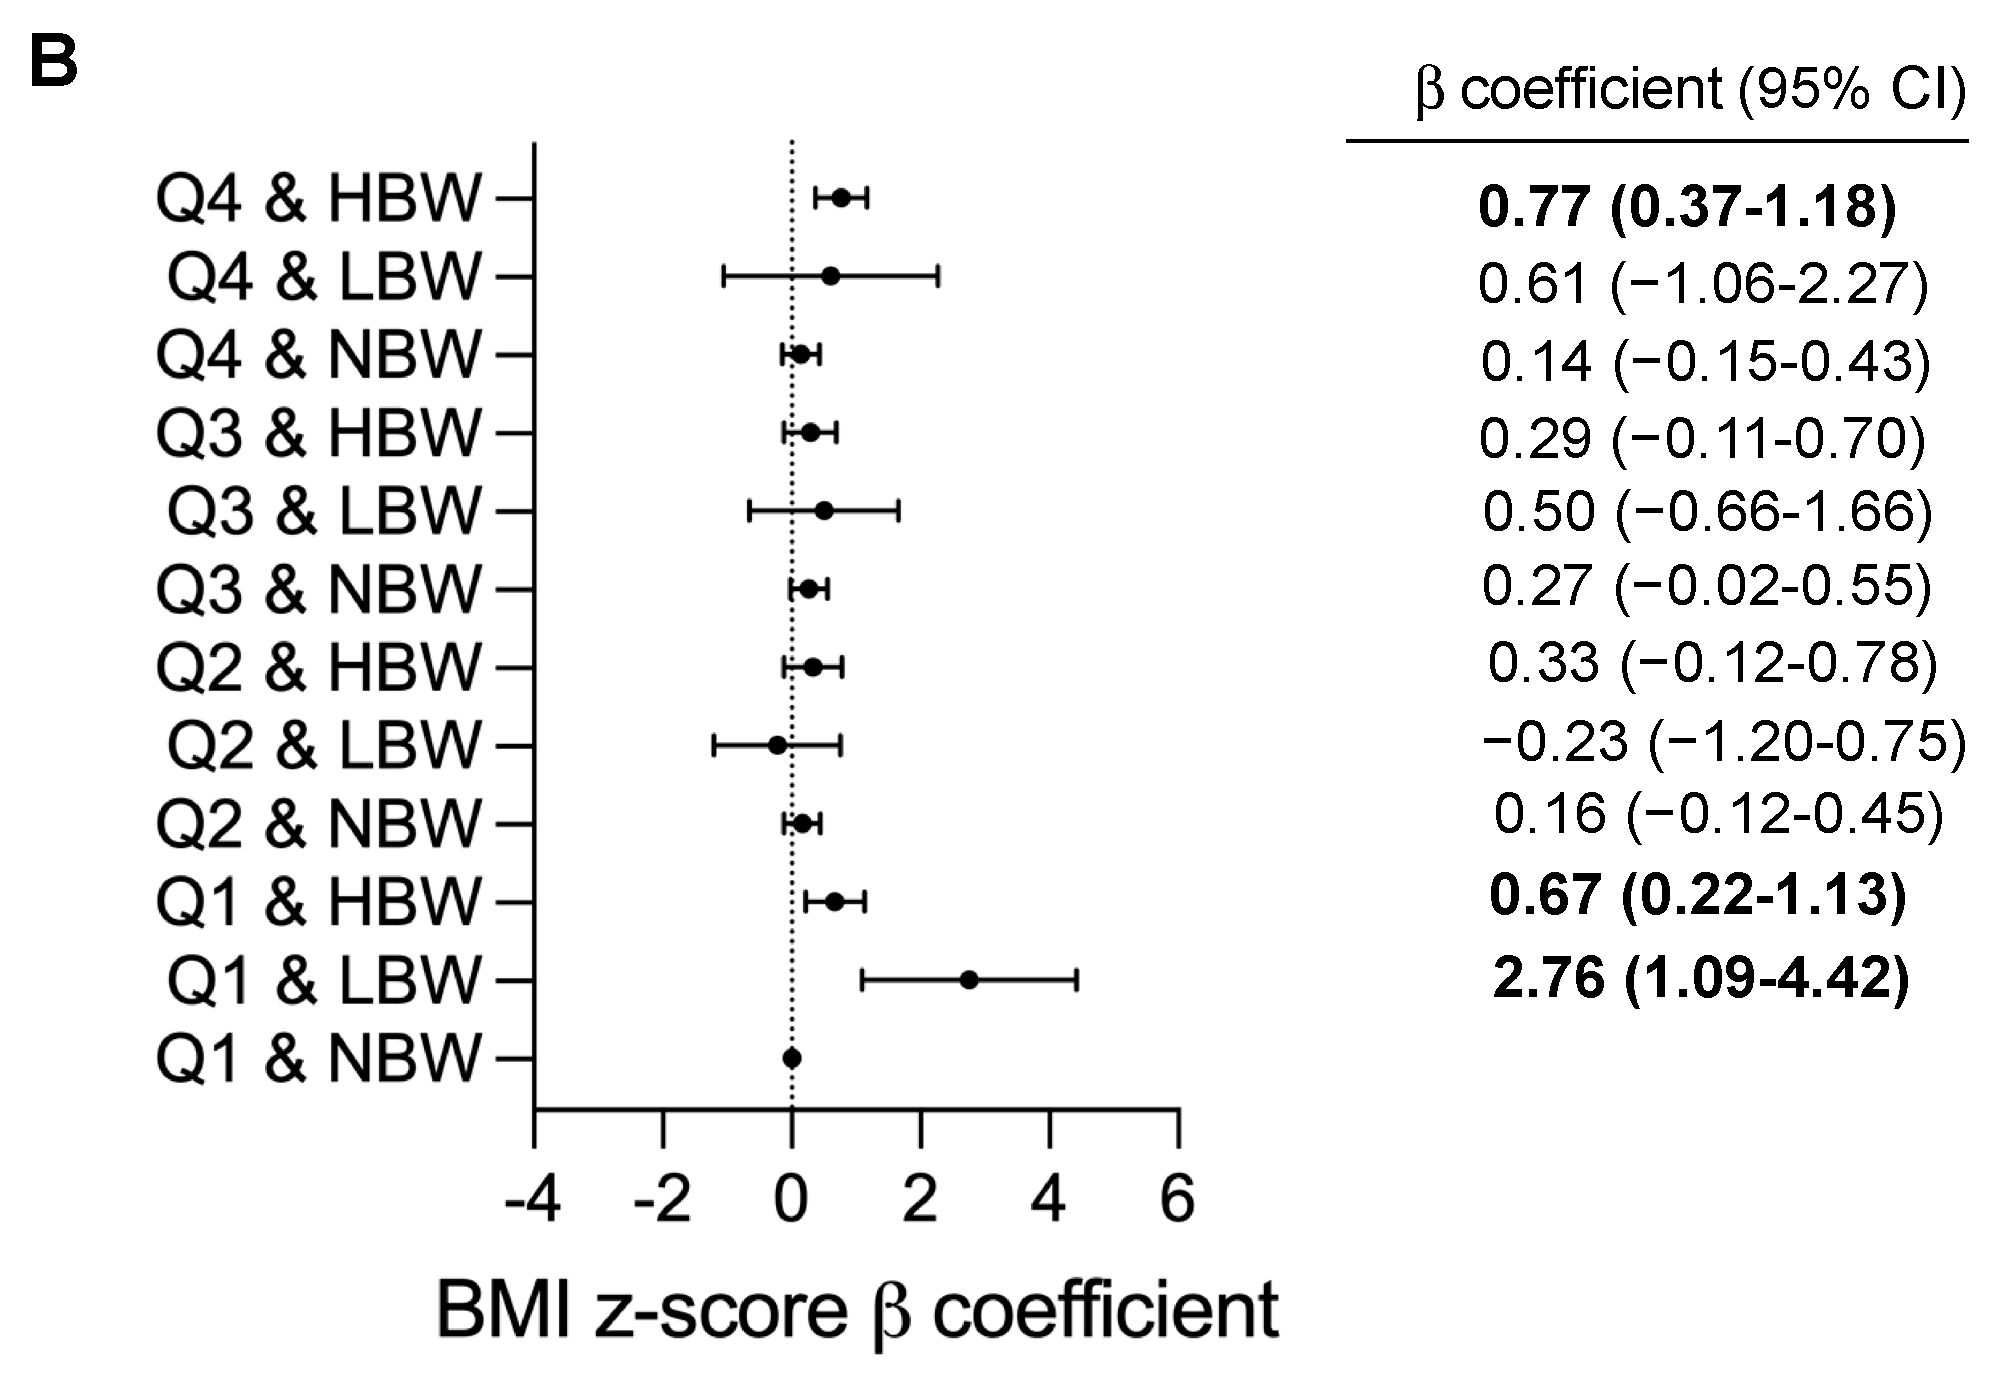
| Birthweight | UPF Consumption a | |||||||||||
|---|---|---|---|---|---|---|---|---|---|---|---|---|
| Overall | Q1 | Q2 | Q3 | Q4 | p for Interaction b | |||||||
| β Coefficient (95% CI) | p-Value b | β Coefficient (95% CI) | p-Value b | β Coefficient (95% CI) | p-Value b | β Coefficient (95% CI) | p-Value b | β Coefficient (95% CI) | p-Value b | |||
| BMI | 0.006 | |||||||||||
| NBW | Ref. | -- | Ref. | -- | Ref. | -- | Ref. | -- | Ref. | -- | ||
| HBW | 1.86 (0.59 to 3.14) | 0.004 | 1.80 (0.59 to 3.00) | 0.004 | 0.59 (−0.74 to 1.93) | 0.385 | 0.20 (−0.85 to 1.25) | 0.146 | 1.65 (0.50 to 2.79) | 0.005 | ||
| LBW | 8.25 (3.63 to 12.88) | 0.000 | 6.30 (1.75 to 10.85) | 0.007 | −0.63 (−3.56 to 2.30) | 0.673 | 1.86 (−2.28 to 6.00) | 0.378 | 1.94 (−2.78 to 6.66) | 0.421 | ||
| p value b | 0.001 | 0.001 | 0.607 | 0.658 | 0.015 | |||||||
| BMI z-score | 0.009 | |||||||||||
| NBW | Ref. | -- | Ref. | -- | Ref. | -- | Ref. | -- | Ref. | -- | ||
| HBW | 0.67 (0.22 to 1.13) | 0.004 | 0.71 (0.29 to 1.13) | 0.001 | 0.21 (−0.25 to 0.68) | 0.370 | 0.07 (−0.33 to 0.47) | 0.726 | 0.63 (0.21 to 1.04) | 0.003 | ||
| LBW | 2.76 (1.09 to 4.42) | 0.001 | 2.30 (0.72 to 2.89) | 0.004 | −0.30 (−1.32 to 0.73) | 0.569 | 0.77 (−0.79 to 2.34) | 0.332 | 0.81 (−0.92 to 2.53) | 0.358 | ||
| p value b | 0.000 | 0.000 | 0.544 | 0.610 | 0.010 | |||||||
| Risk of overweight or obesity | OR (95% CI) | OR (95% CI) | OR (95% CI) | OR (95% CI) | OR (95% CI) | 0.369 | ||||||
| NBW | Ref. | -- | Ref. | -- | Ref. | -- | Ref. | -- | Ref. | -- | ||
| HBW | 2.38 (0.91 to 6.21) | 0.076 | 2.01 (0.69 to 5.85) | 0.200 | 0.95 (0.32 to 2.79) | 0.926 | 0.72 (0.30 to 1.69) | 0.445 | 2.01 (0.81 to 4.96) | 0.132 | ||
| LBW | 4.91 (0.26 to 92.78) | 0.288 | 3.35 (0.09 to 122.06) | 0.510 | 1.08 (0.08 to 14.77) | 0.955 | 0.64 (0.02 to 18.84) | 0.794 | NA | NA | ||
| p value b | 0.619 | 0.383 | 0.994 | 0.735 | 0.321 | |||||||
Disclaimer/Publisher’s Note: The statements, opinions and data contained in all publications are solely those of the individual author(s) and contributor(s) and not of MDPI and/or the editor(s). MDPI and/or the editor(s) disclaim responsibility for any injury to people or property resulting from any ideas, methods, instructions or products referred to in the content. |
© 2023 by the authors. Licensee MDPI, Basel, Switzerland. This article is an open access article distributed under the terms and conditions of the Creative Commons Attribution (CC BY) license (https://creativecommons.org/licenses/by/4.0/).
Share and Cite
Hou, M.; Qiu, C. Ultra-Processed Food as Mediator of the Association between Birthweight and Childhood Body Weight Outcomes: A Retrospective Cohort Study. Nutrients 2023, 15, 4178. https://doi.org/10.3390/nu15194178
Hou M, Qiu C. Ultra-Processed Food as Mediator of the Association between Birthweight and Childhood Body Weight Outcomes: A Retrospective Cohort Study. Nutrients. 2023; 15(19):4178. https://doi.org/10.3390/nu15194178
Chicago/Turabian StyleHou, Min, and Chao Qiu. 2023. "Ultra-Processed Food as Mediator of the Association between Birthweight and Childhood Body Weight Outcomes: A Retrospective Cohort Study" Nutrients 15, no. 19: 4178. https://doi.org/10.3390/nu15194178
APA StyleHou, M., & Qiu, C. (2023). Ultra-Processed Food as Mediator of the Association between Birthweight and Childhood Body Weight Outcomes: A Retrospective Cohort Study. Nutrients, 15(19), 4178. https://doi.org/10.3390/nu15194178