
Microbiota-Dependent Upregulation of Bitter Taste Receptor Subtypes in the Mouse Large Intestine in High-Fat Diet-Induced Obesity

 , , ,
, , ,  ,
,  and
and 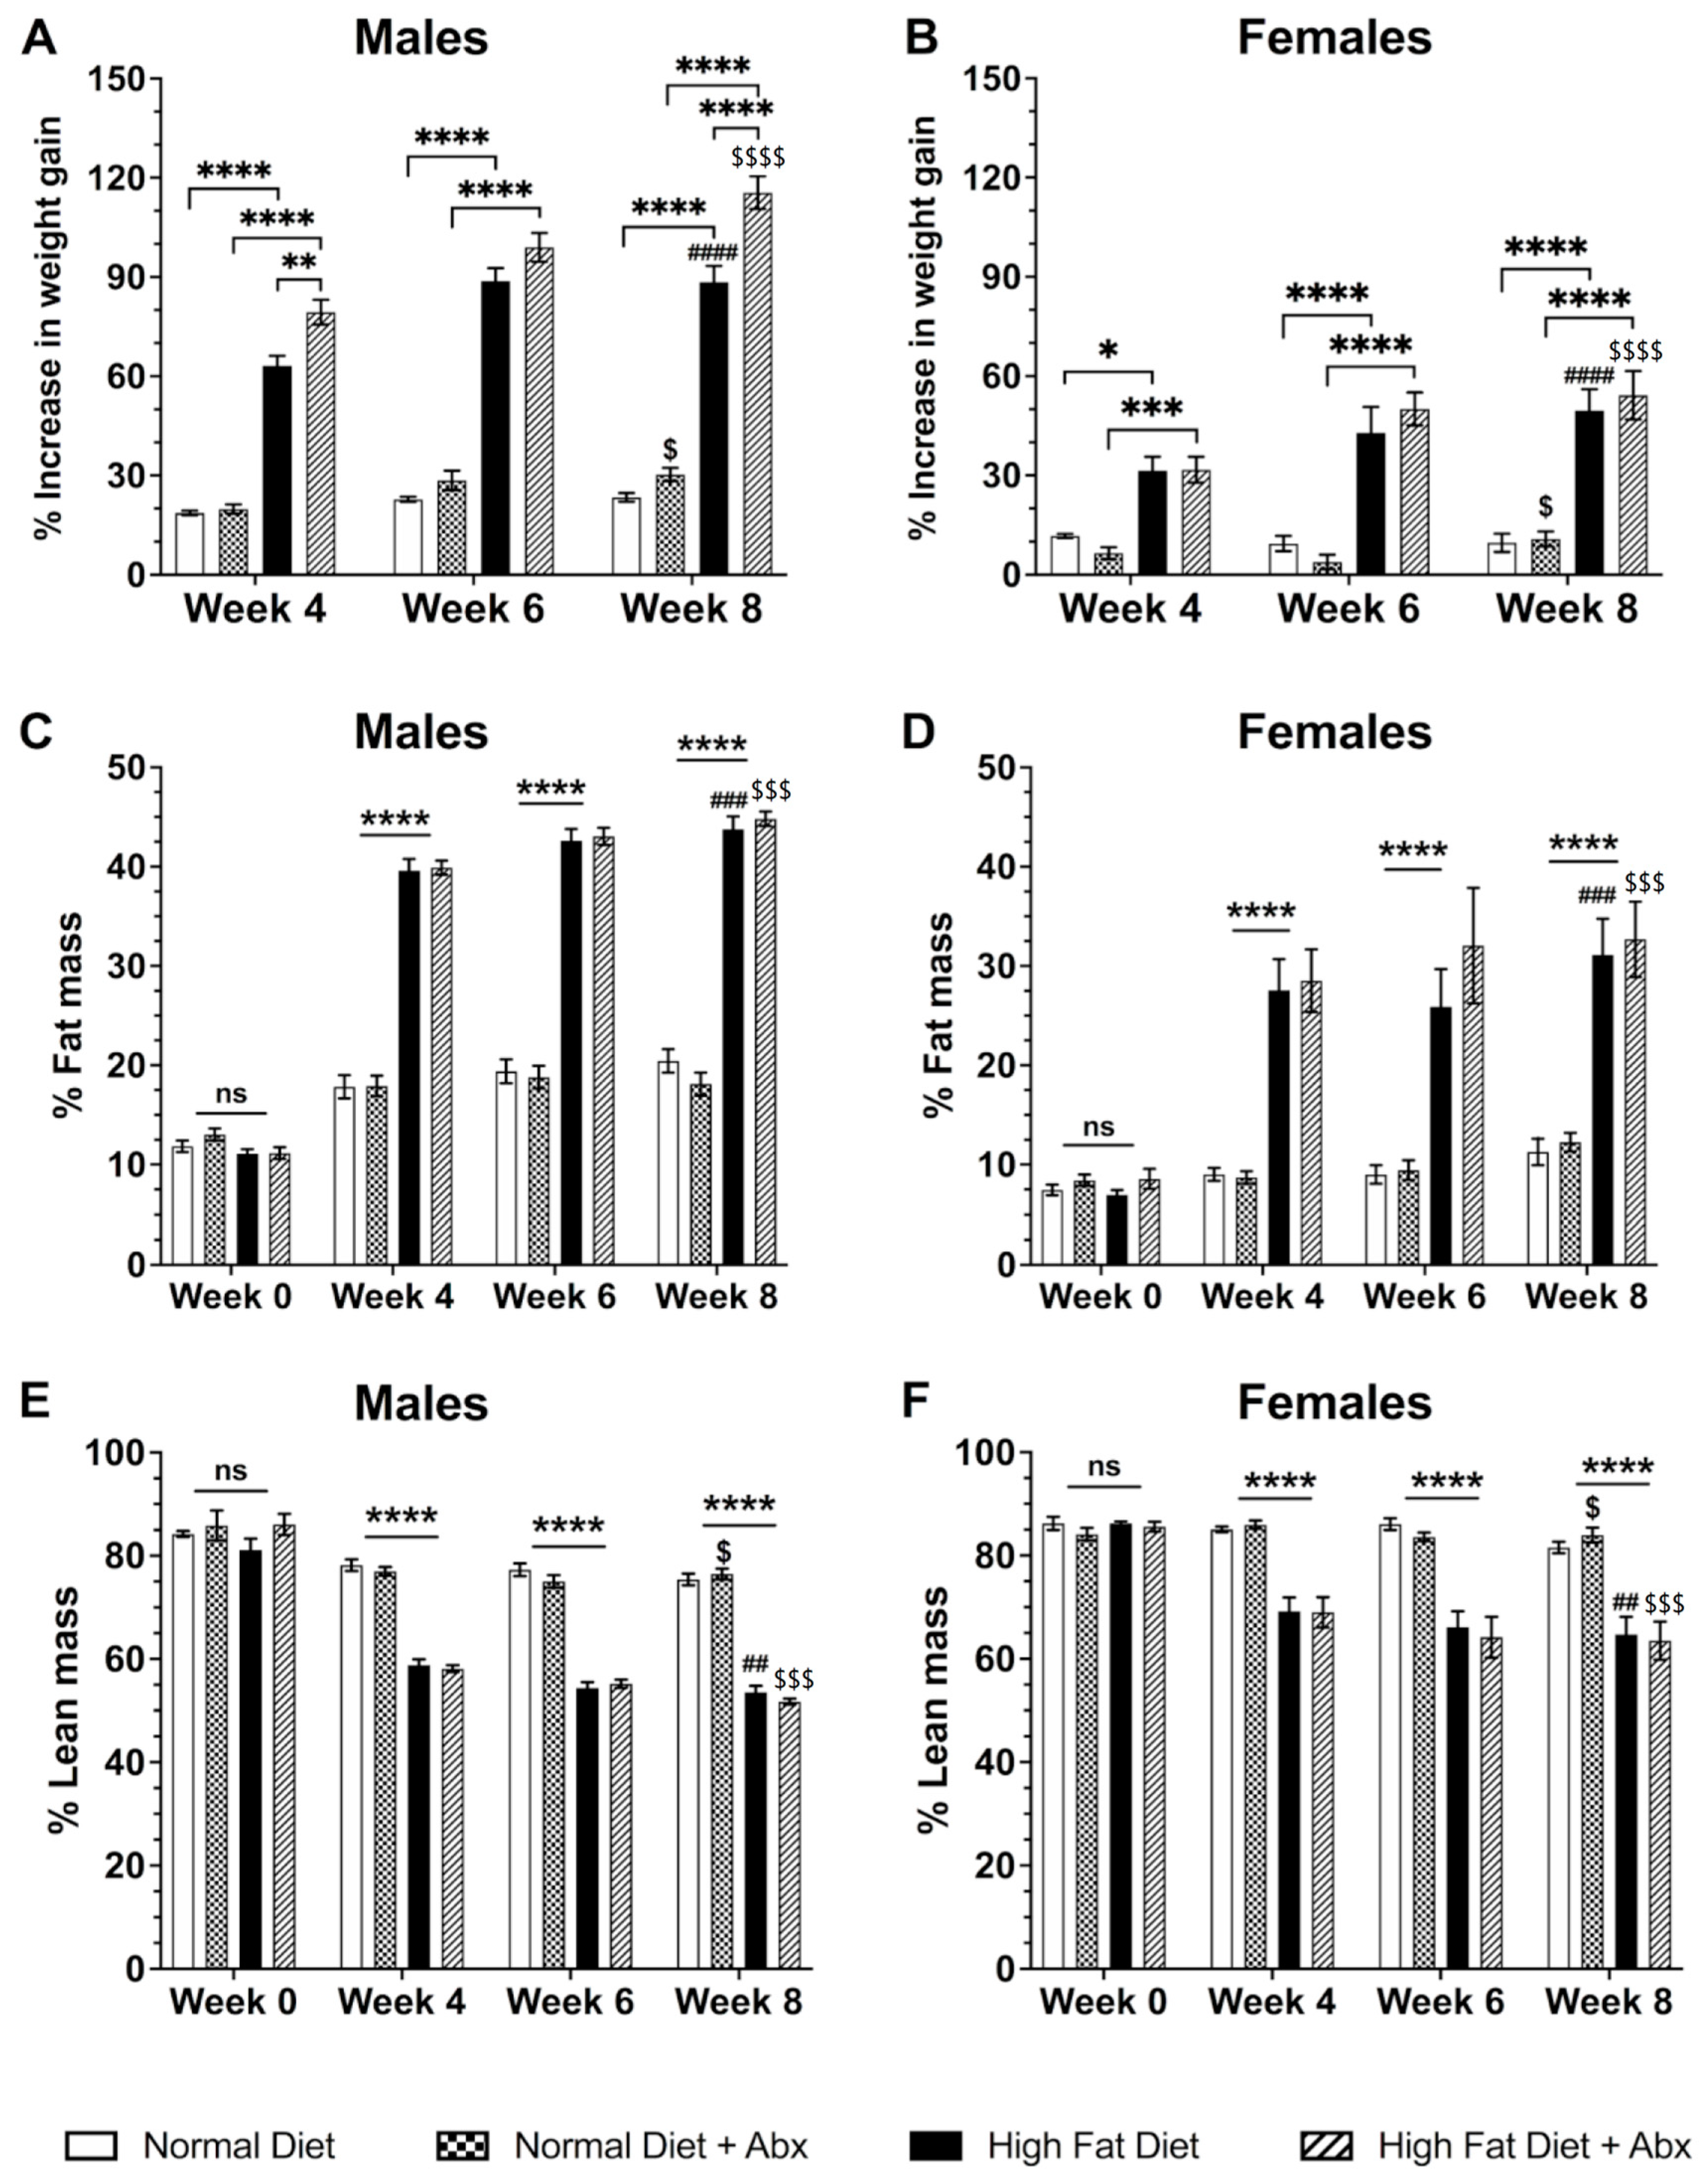
Abstract
:1. Introduction
2. Materials and Methods
3. Results
3.1. High-Fat Diet (HFD) Significantly Increases Body Weight and Fat Mass in Male and Female Mice
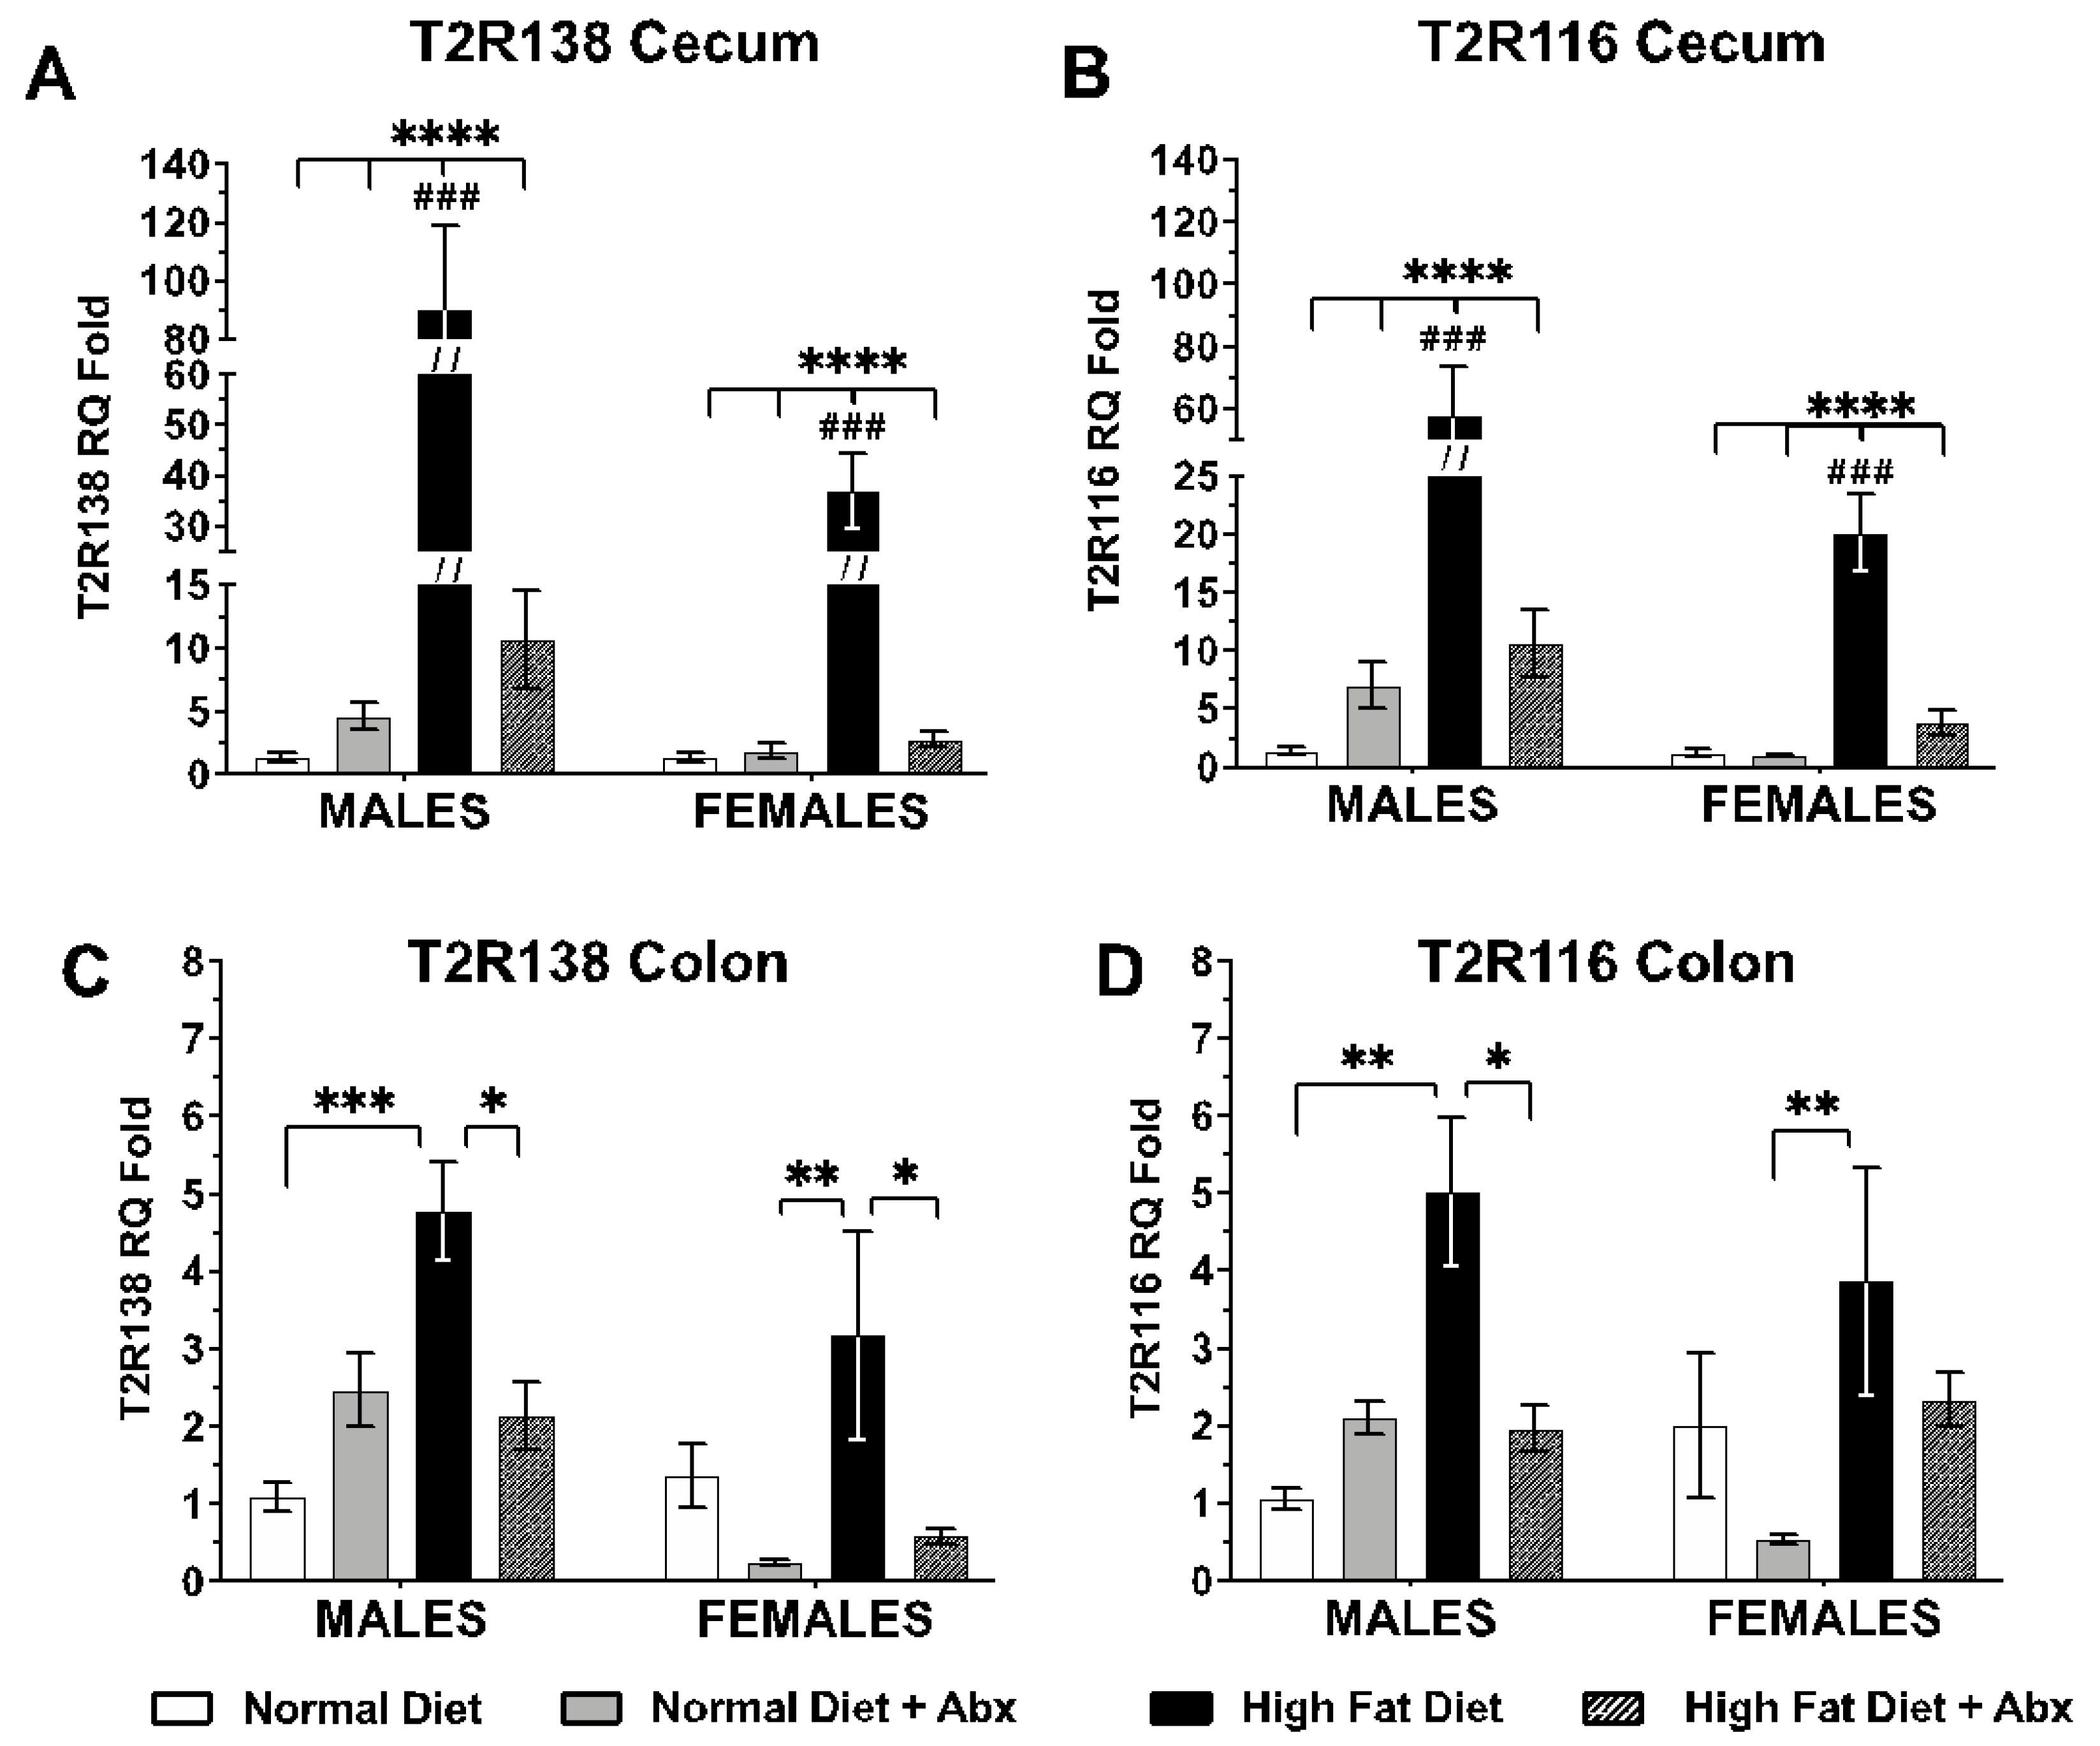
3.2. Tas2R138 and Tas2R116 mRNA Expression in the Mouse Large Intestine
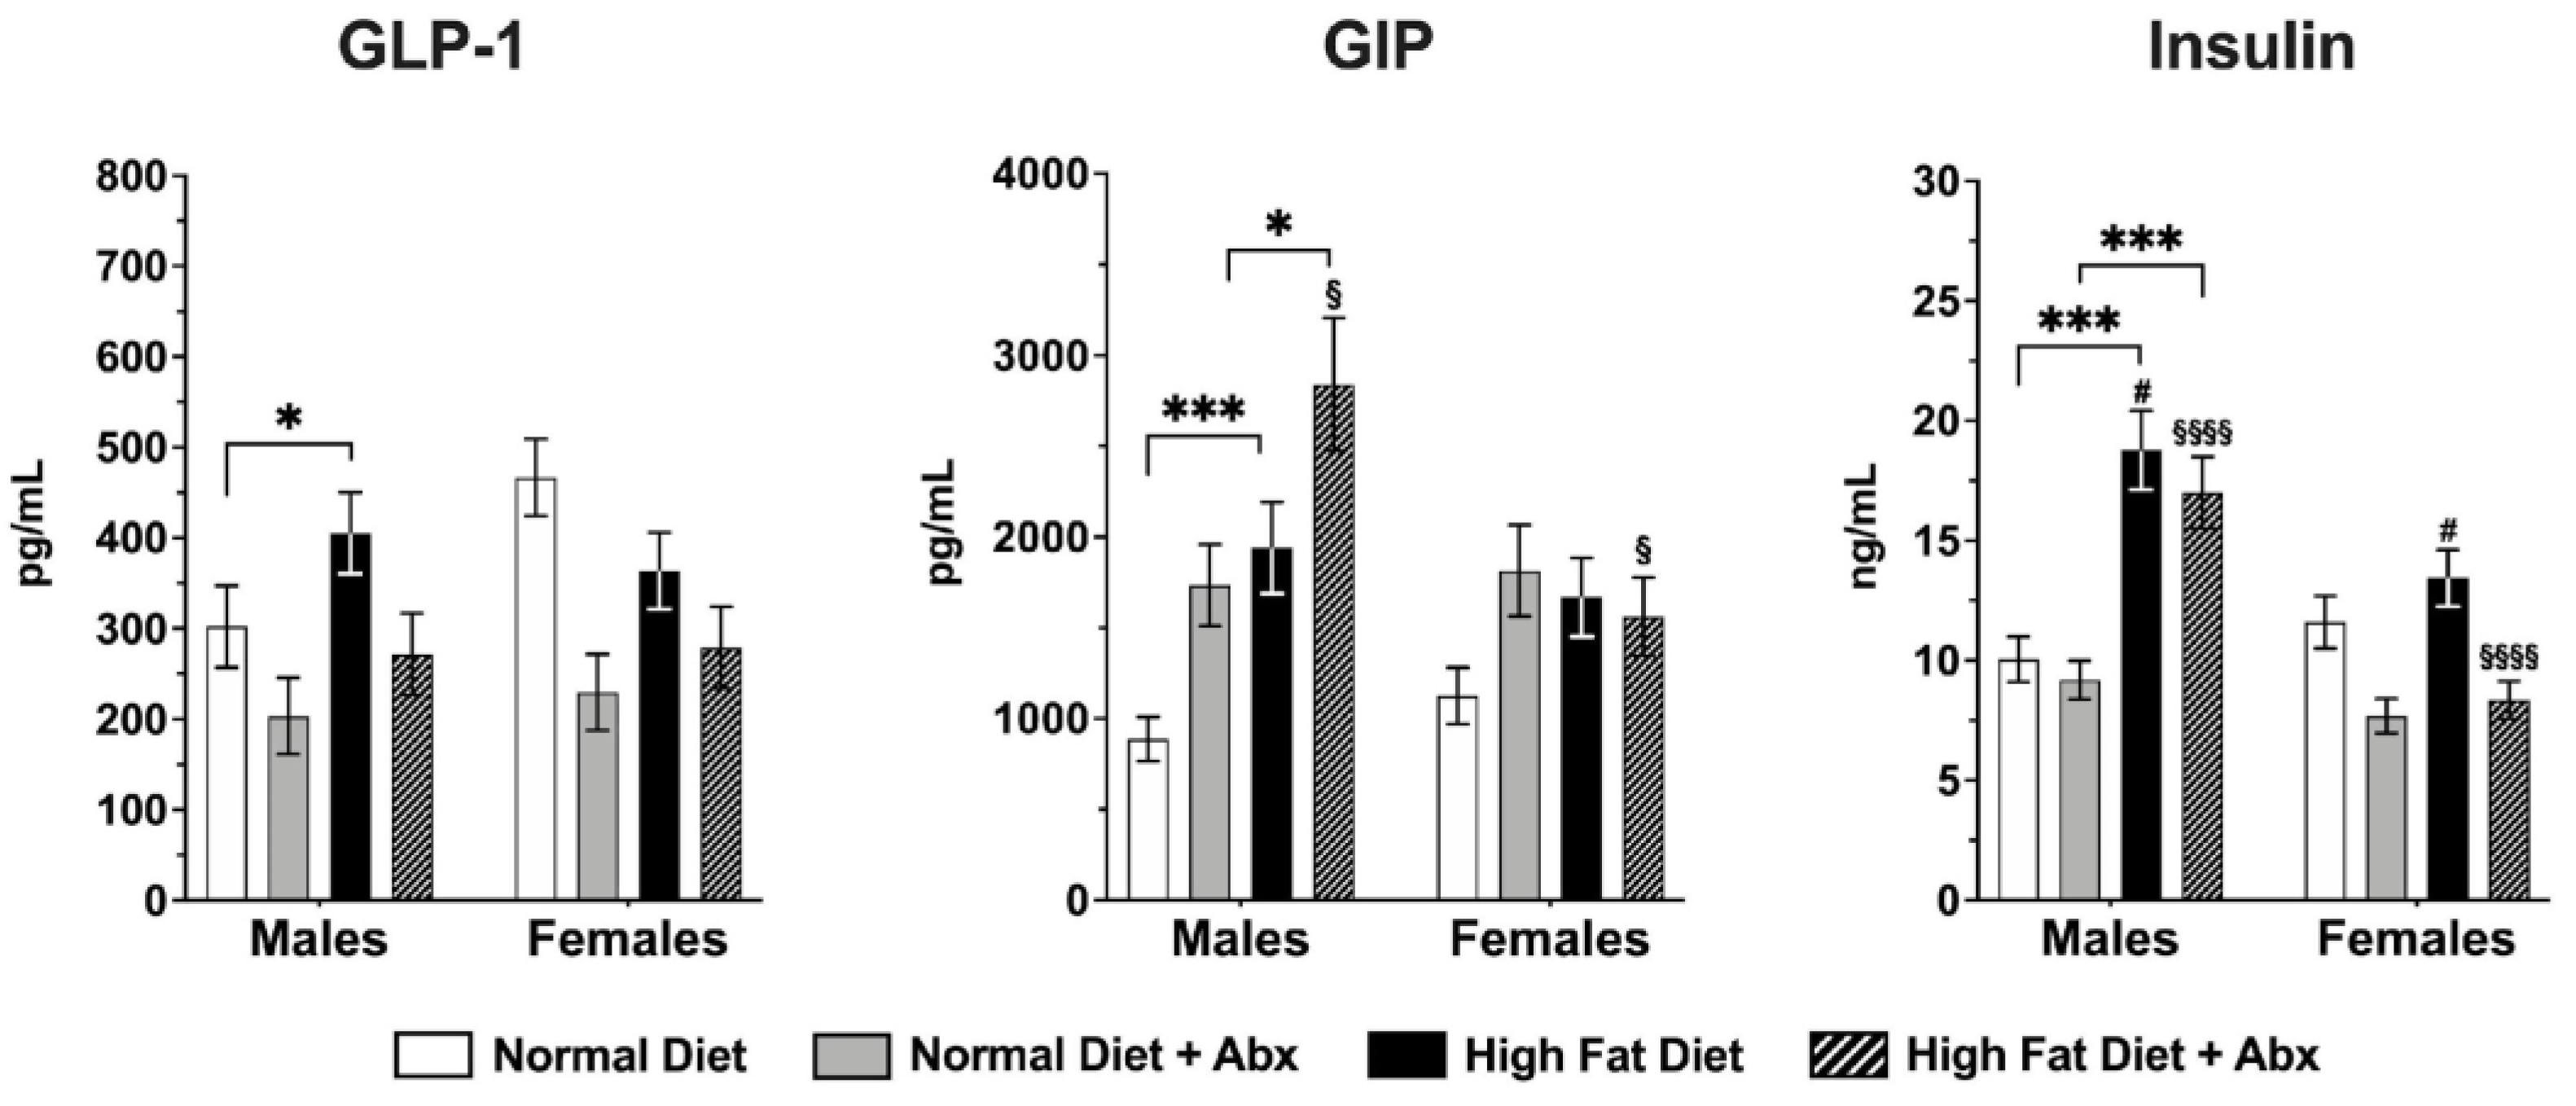
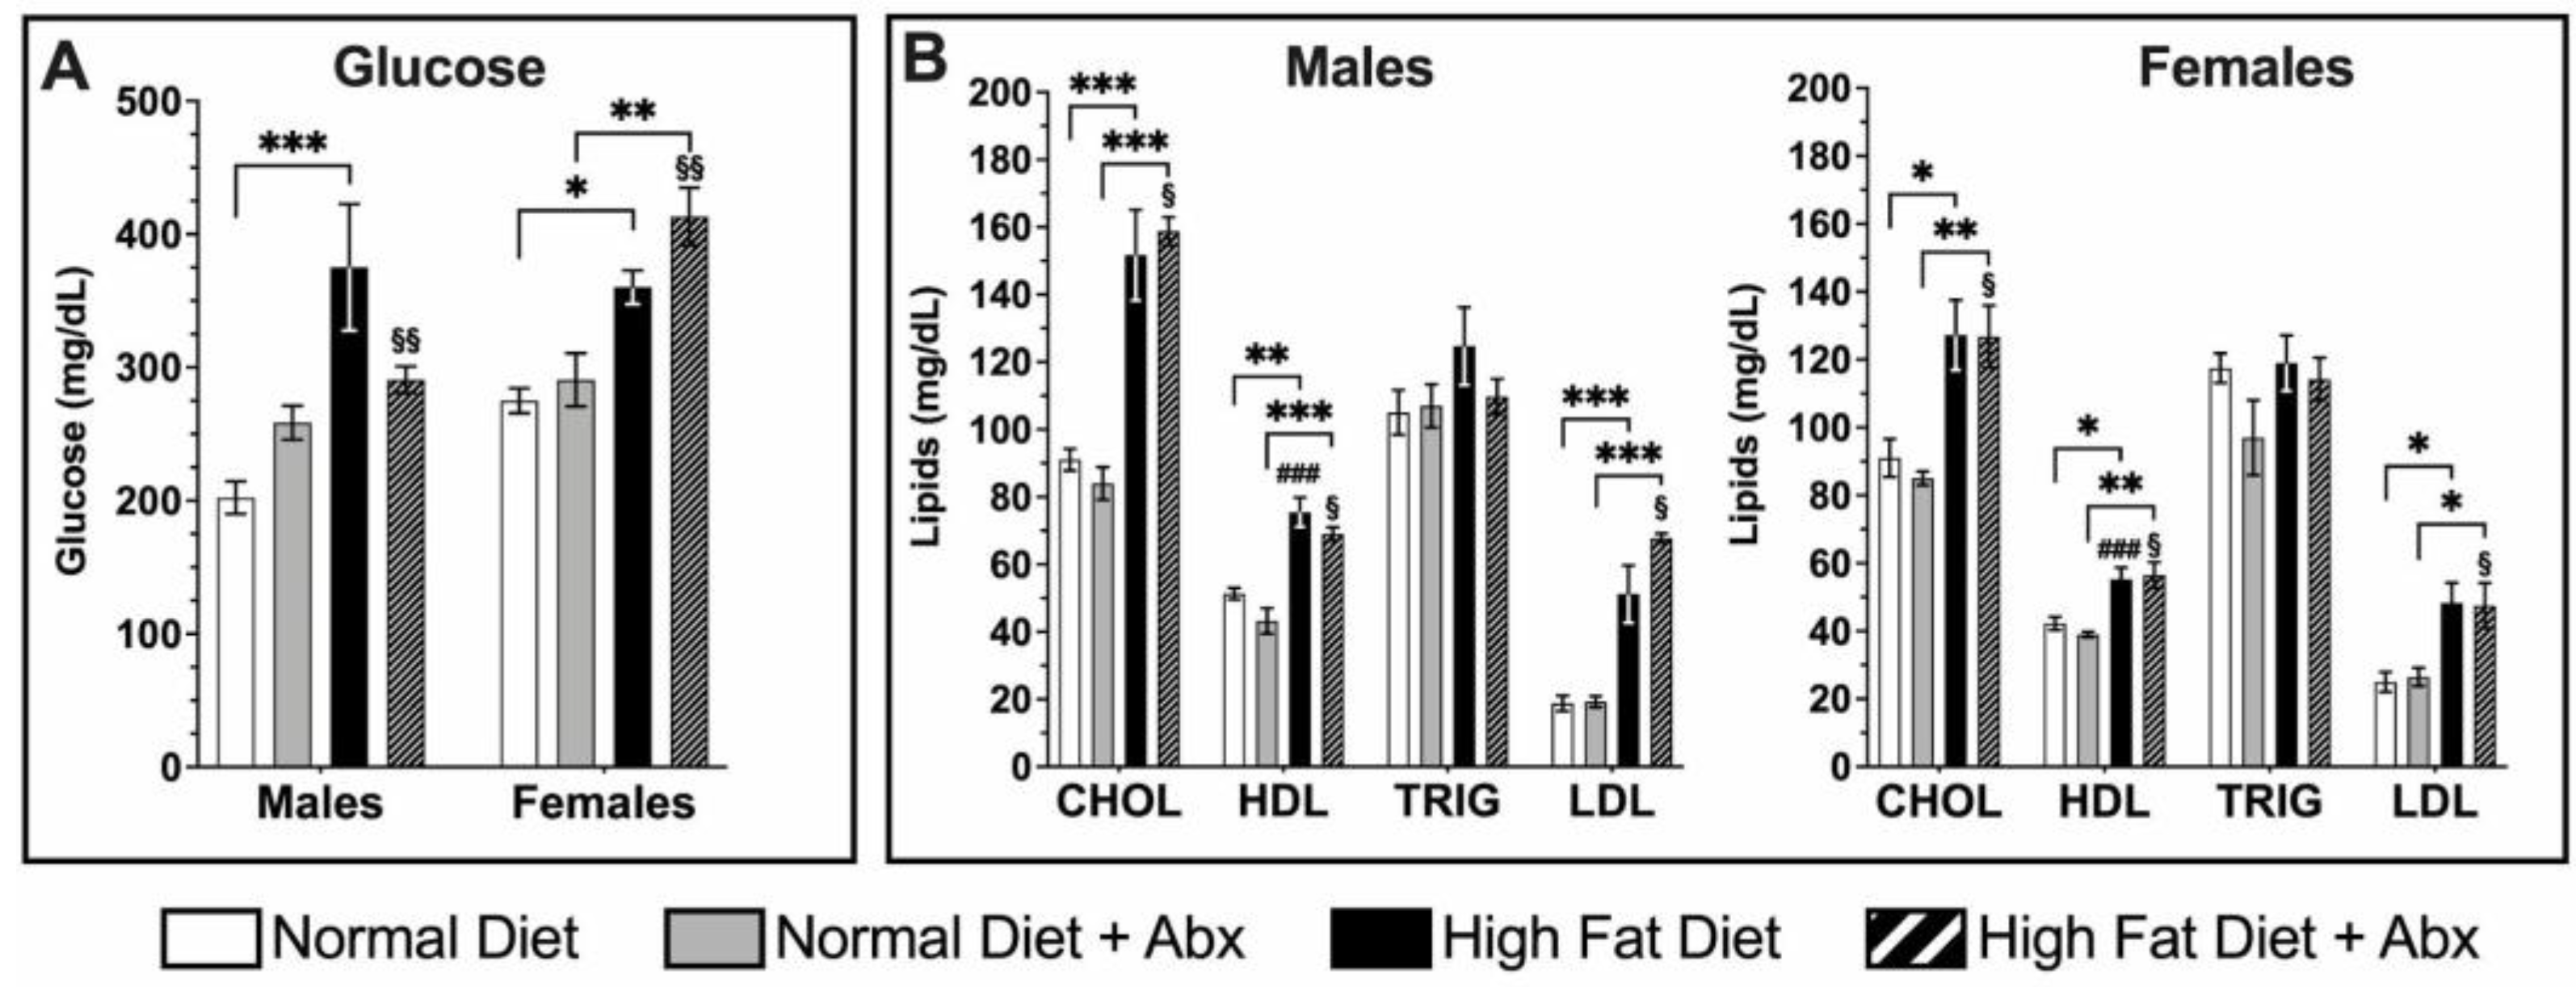
3.3. Metabolic Panel
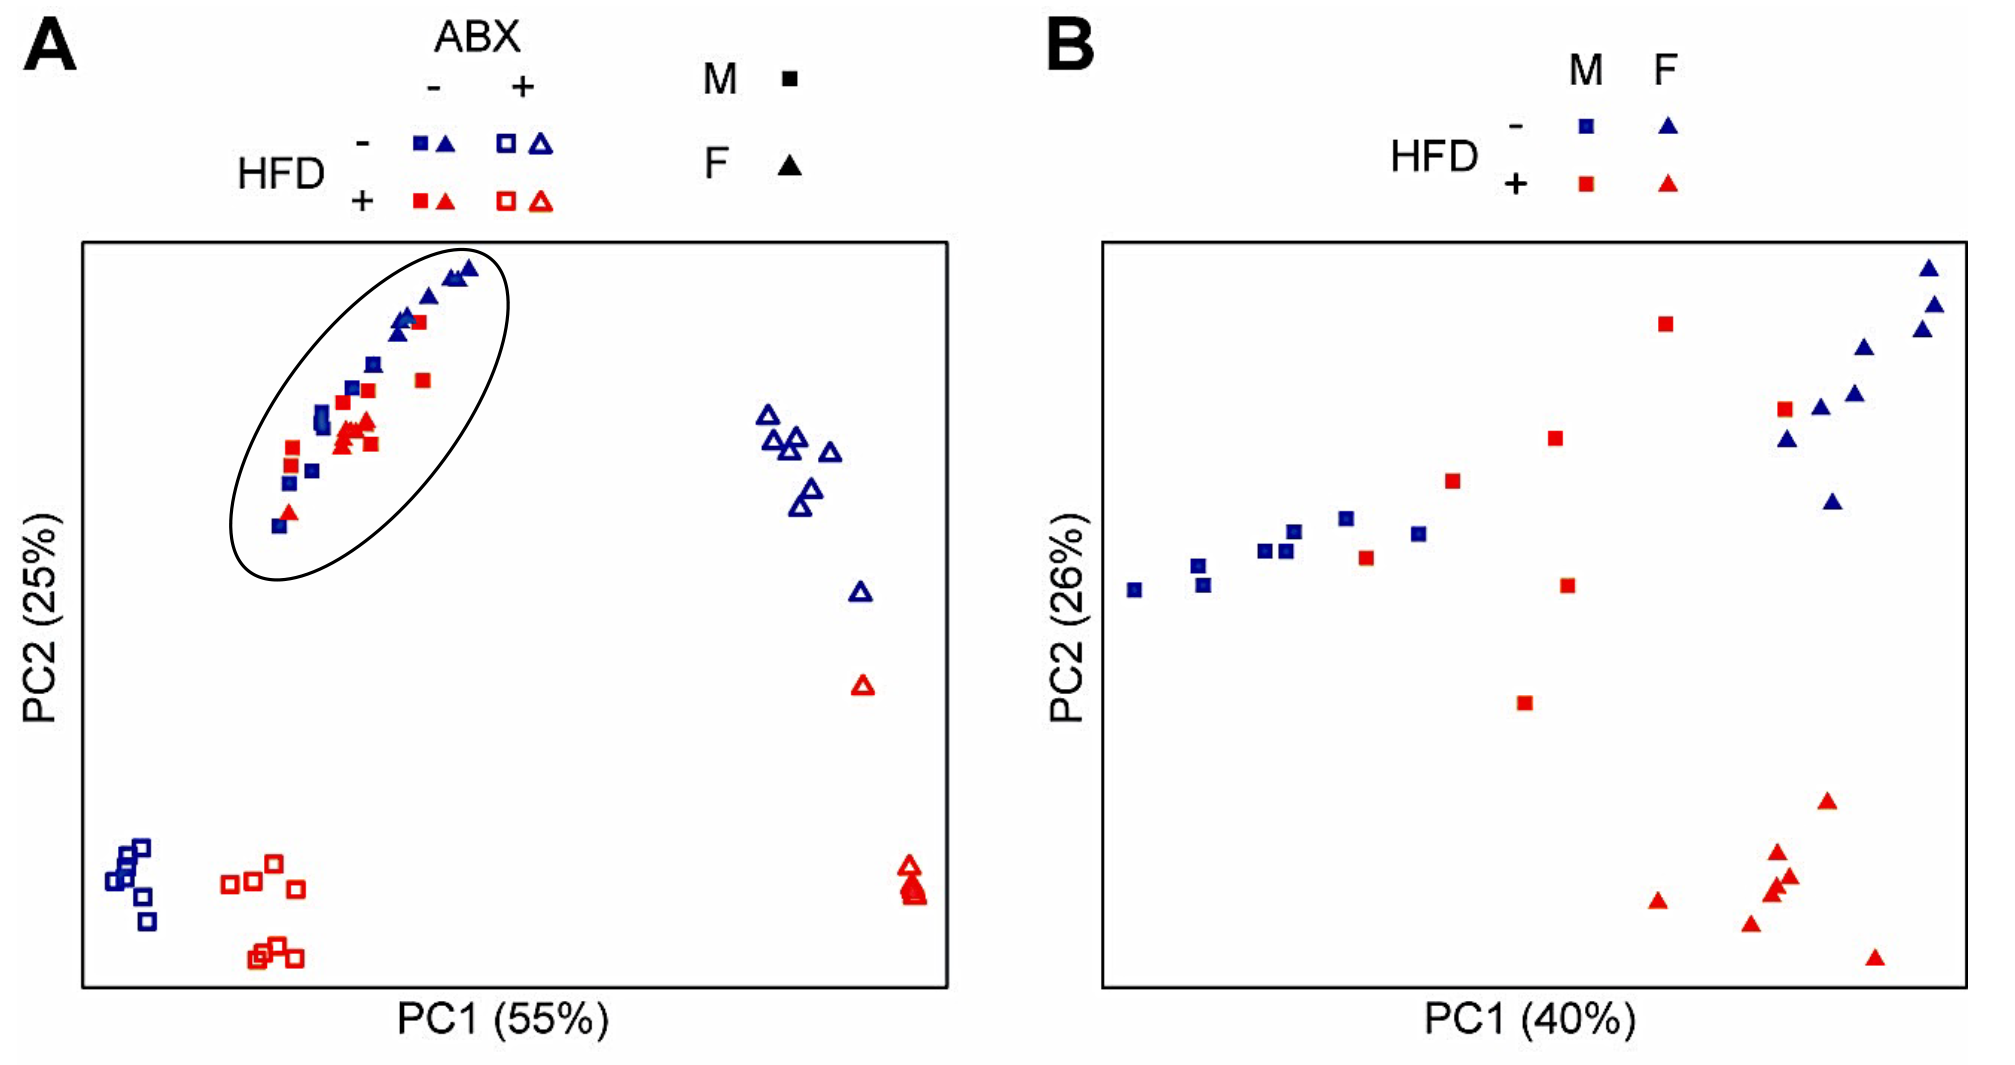
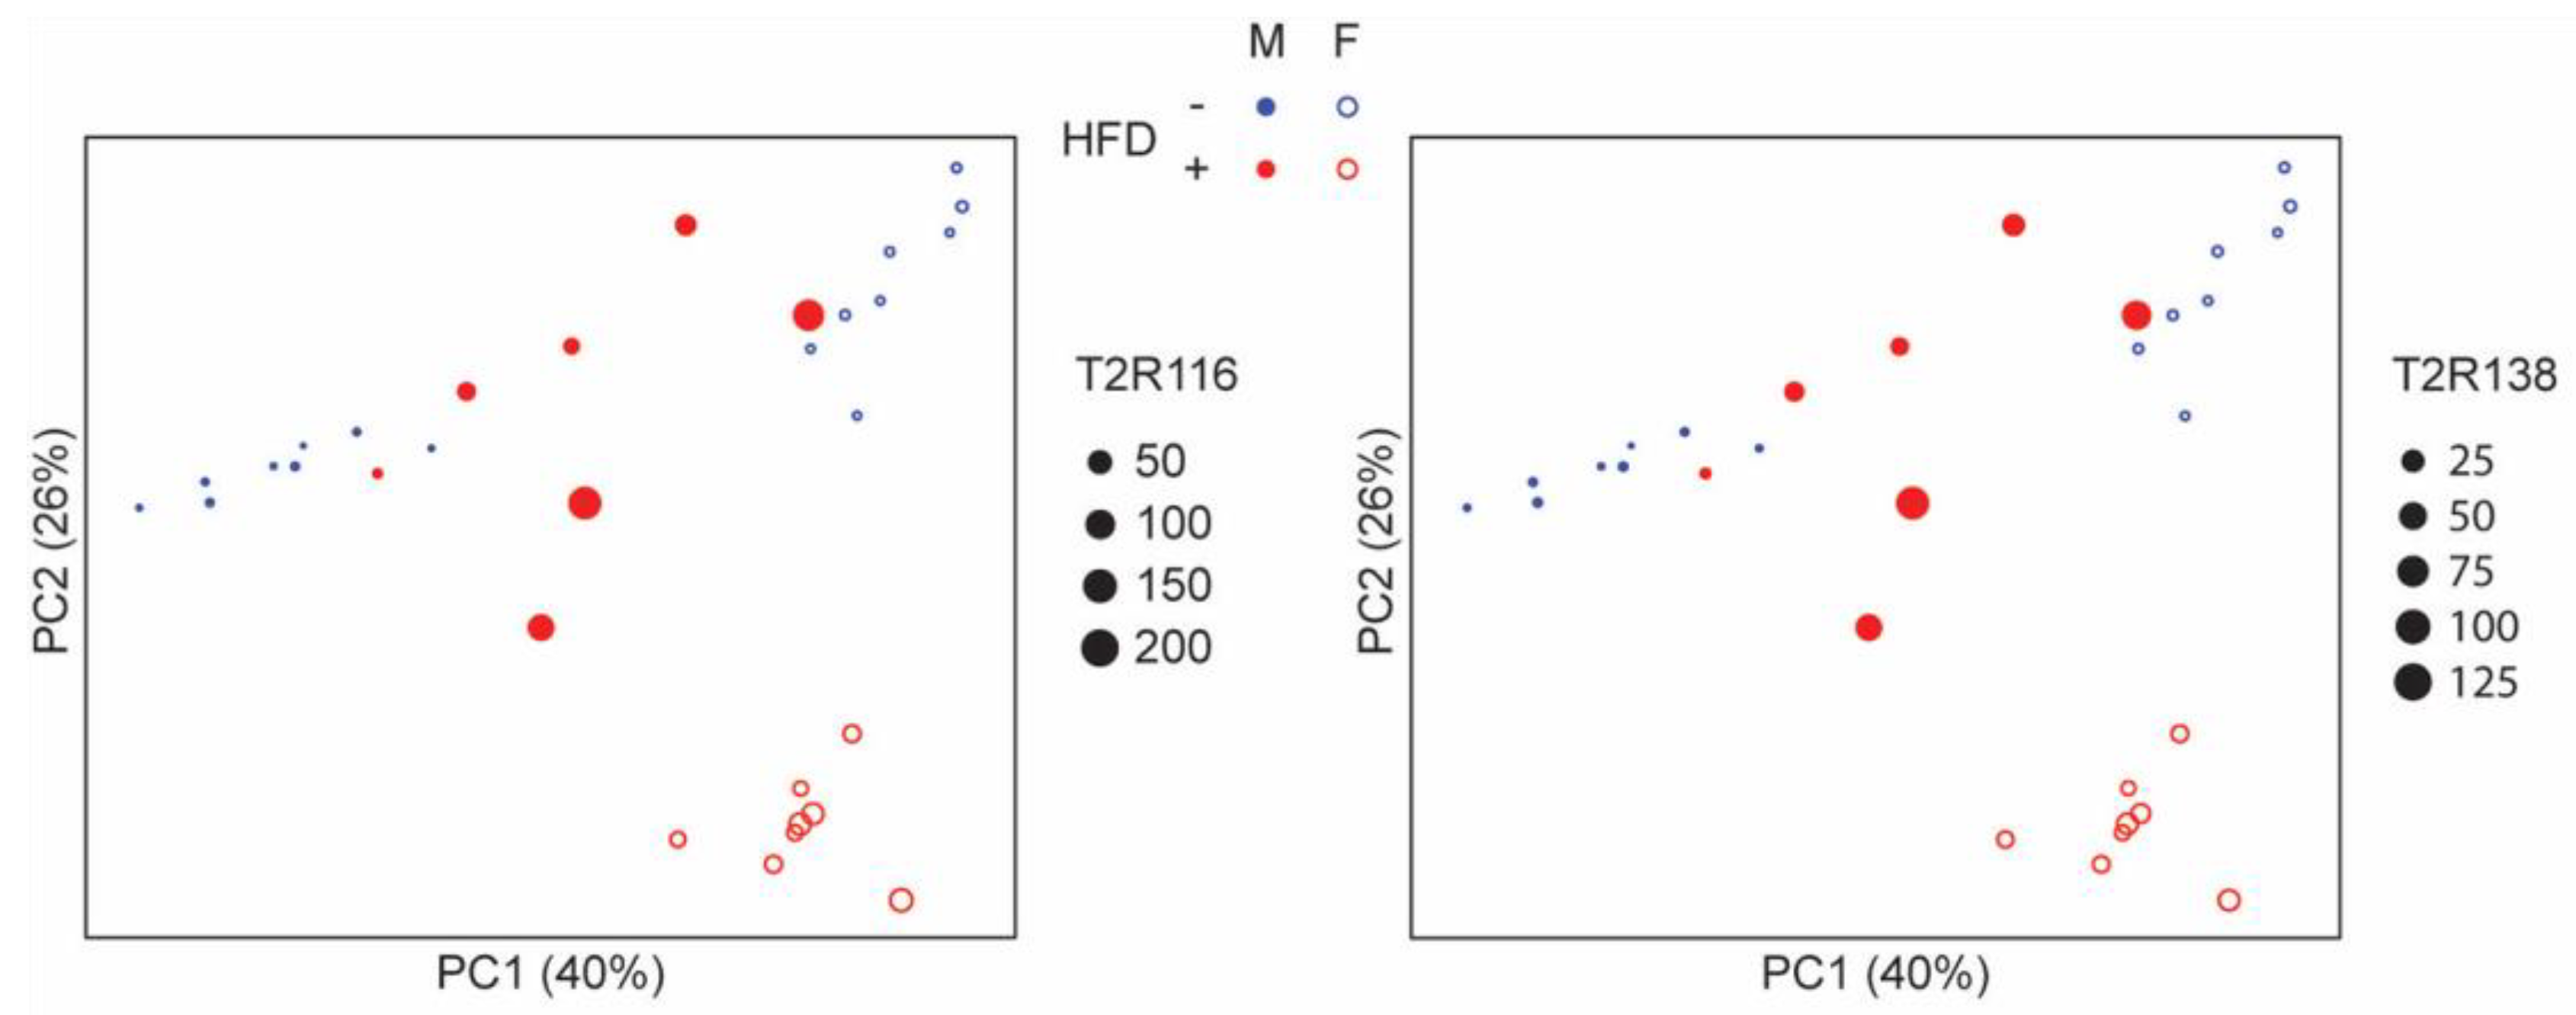
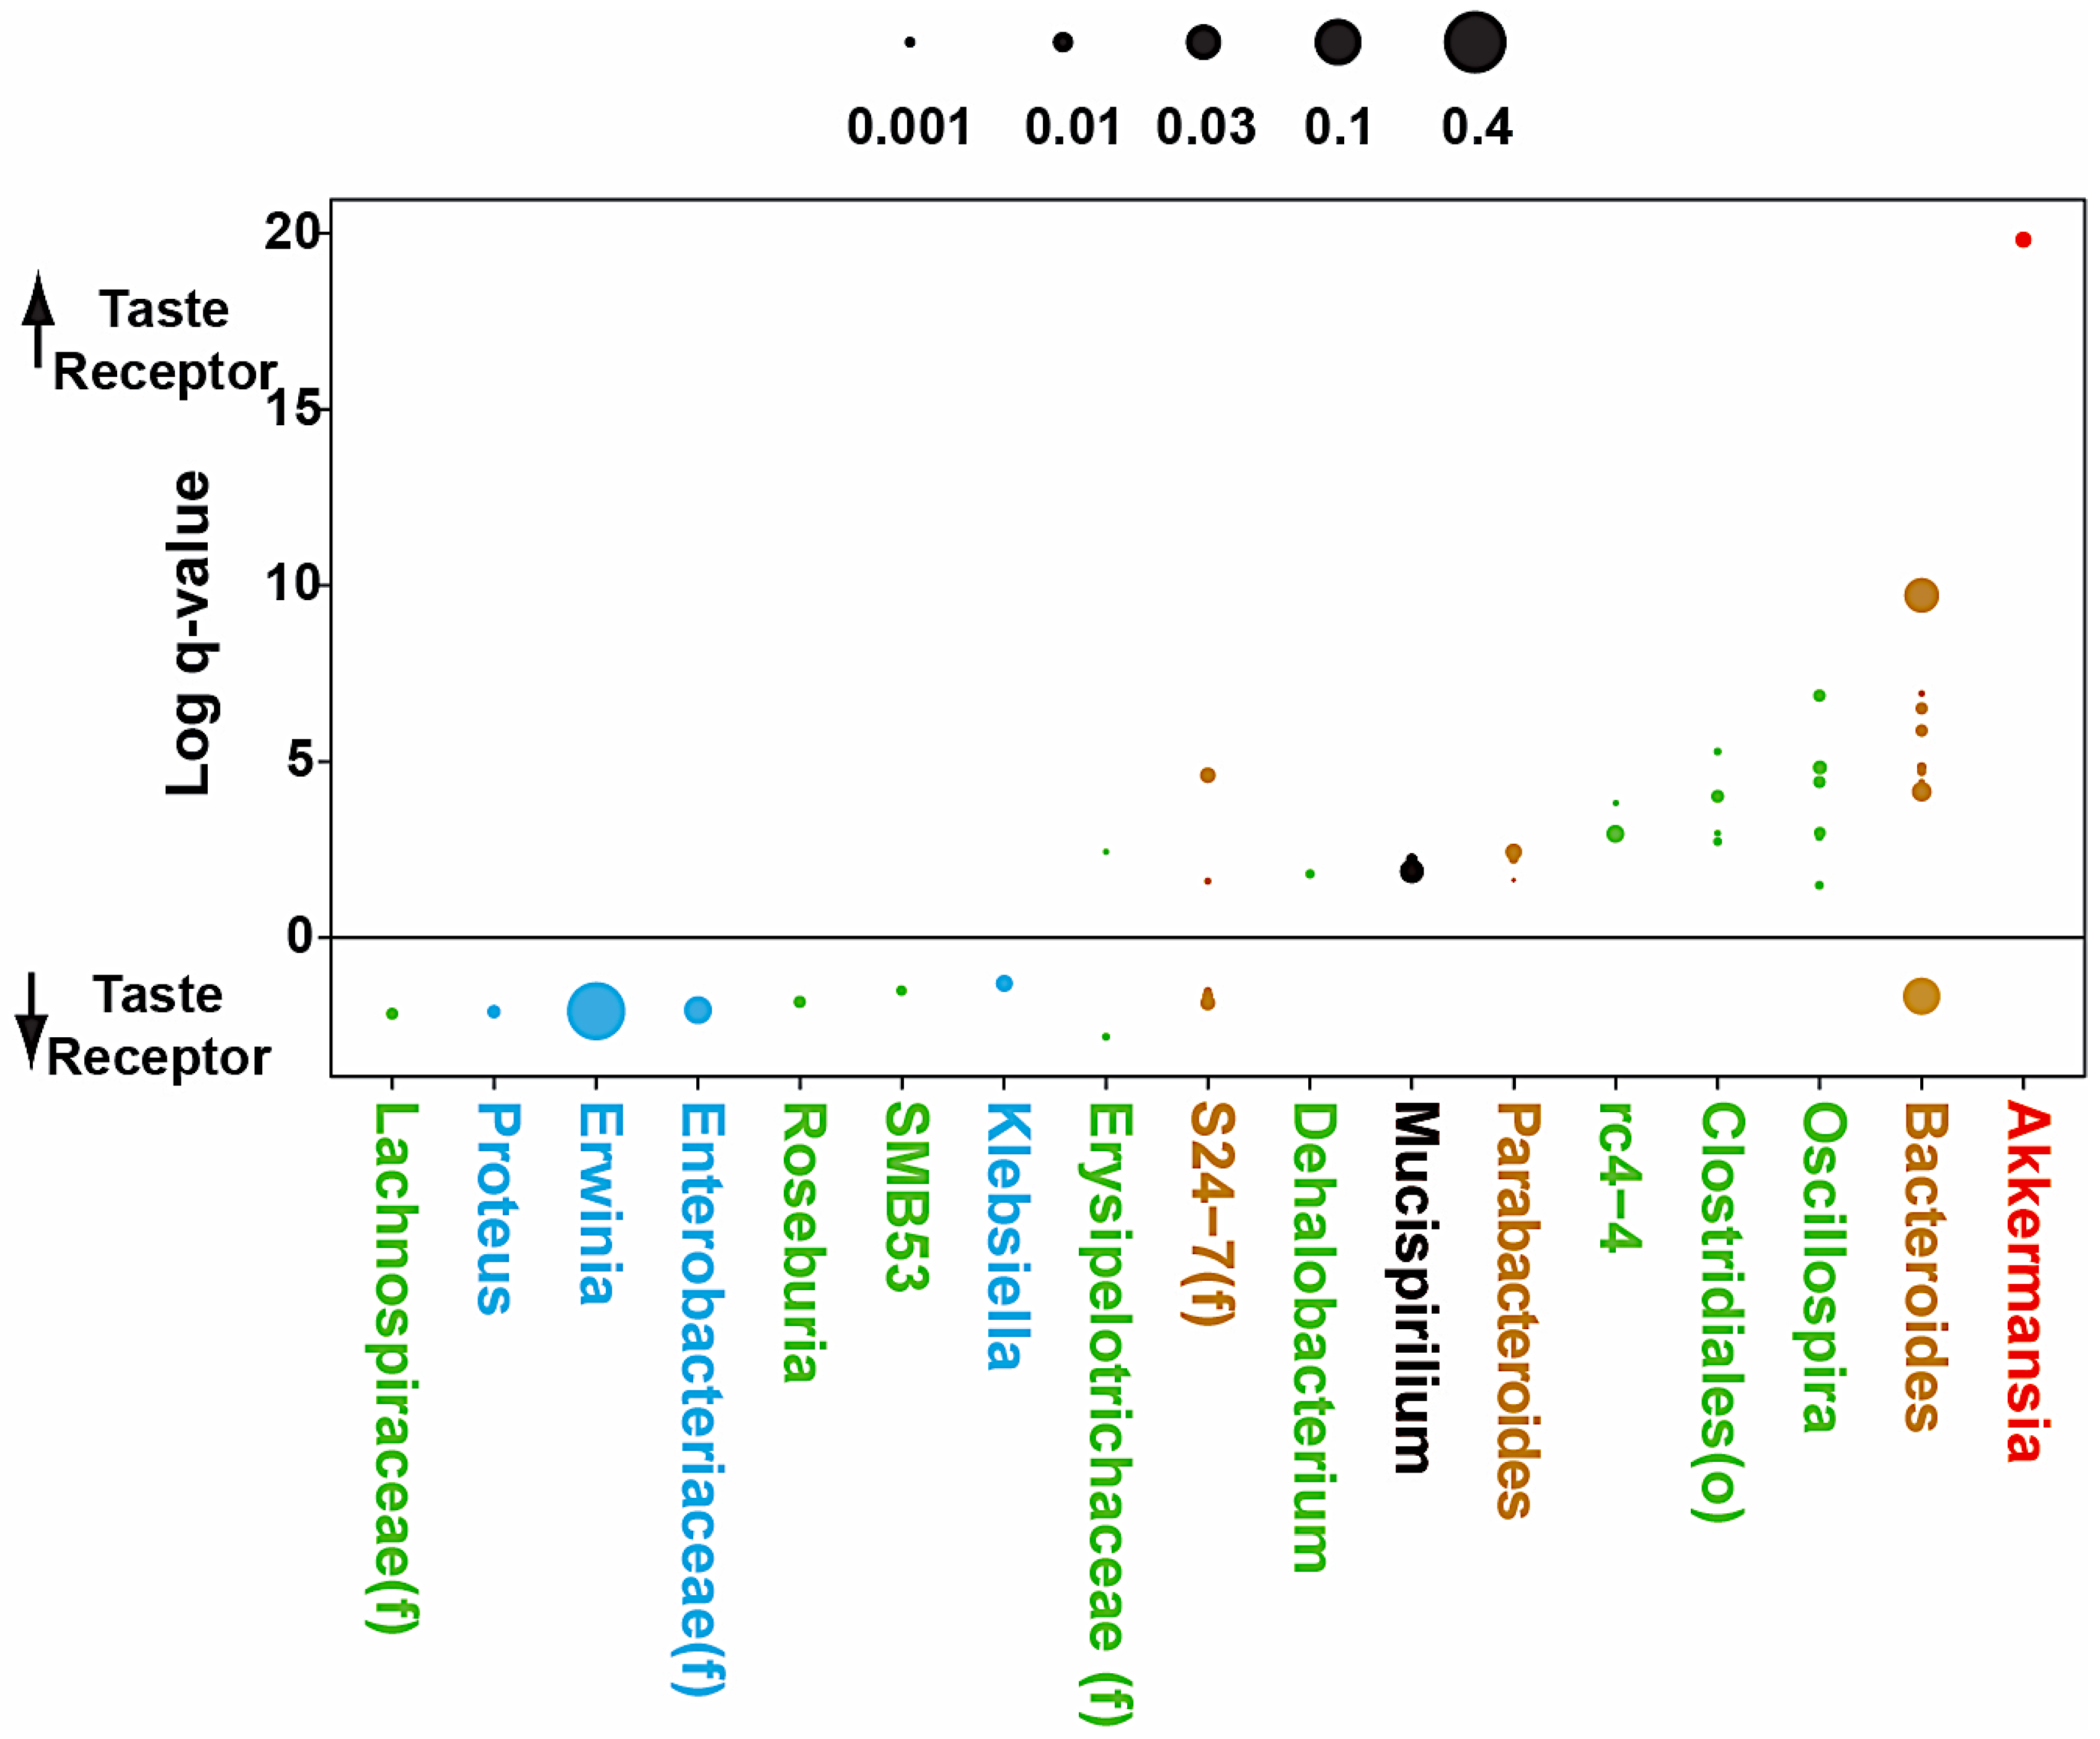
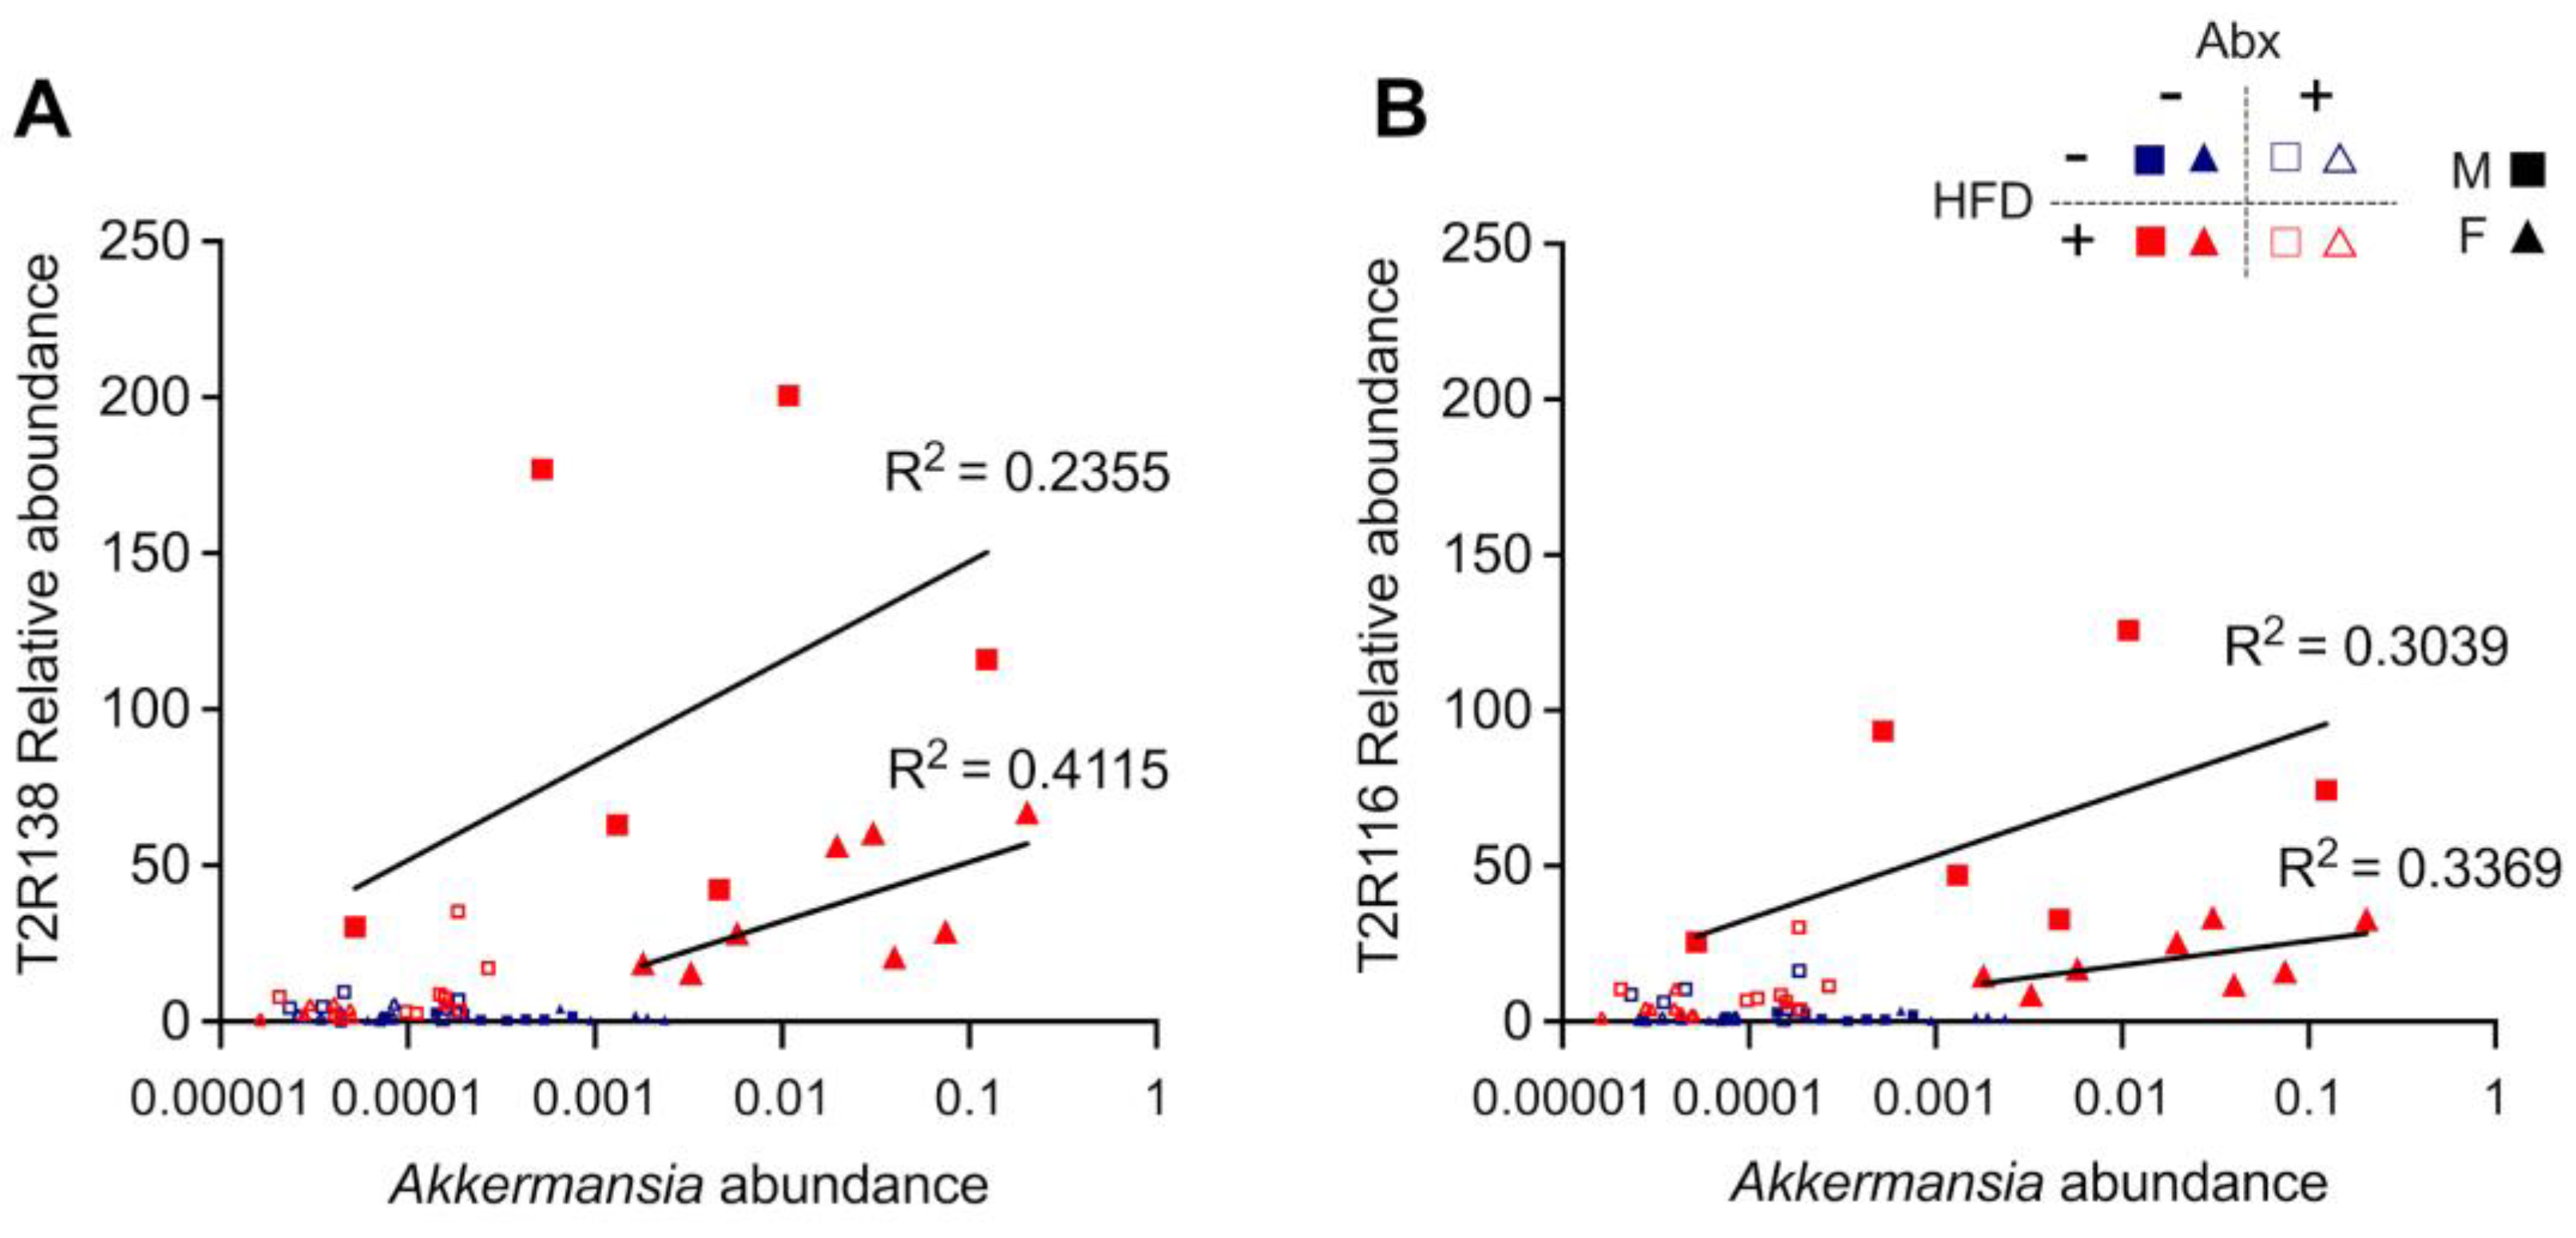
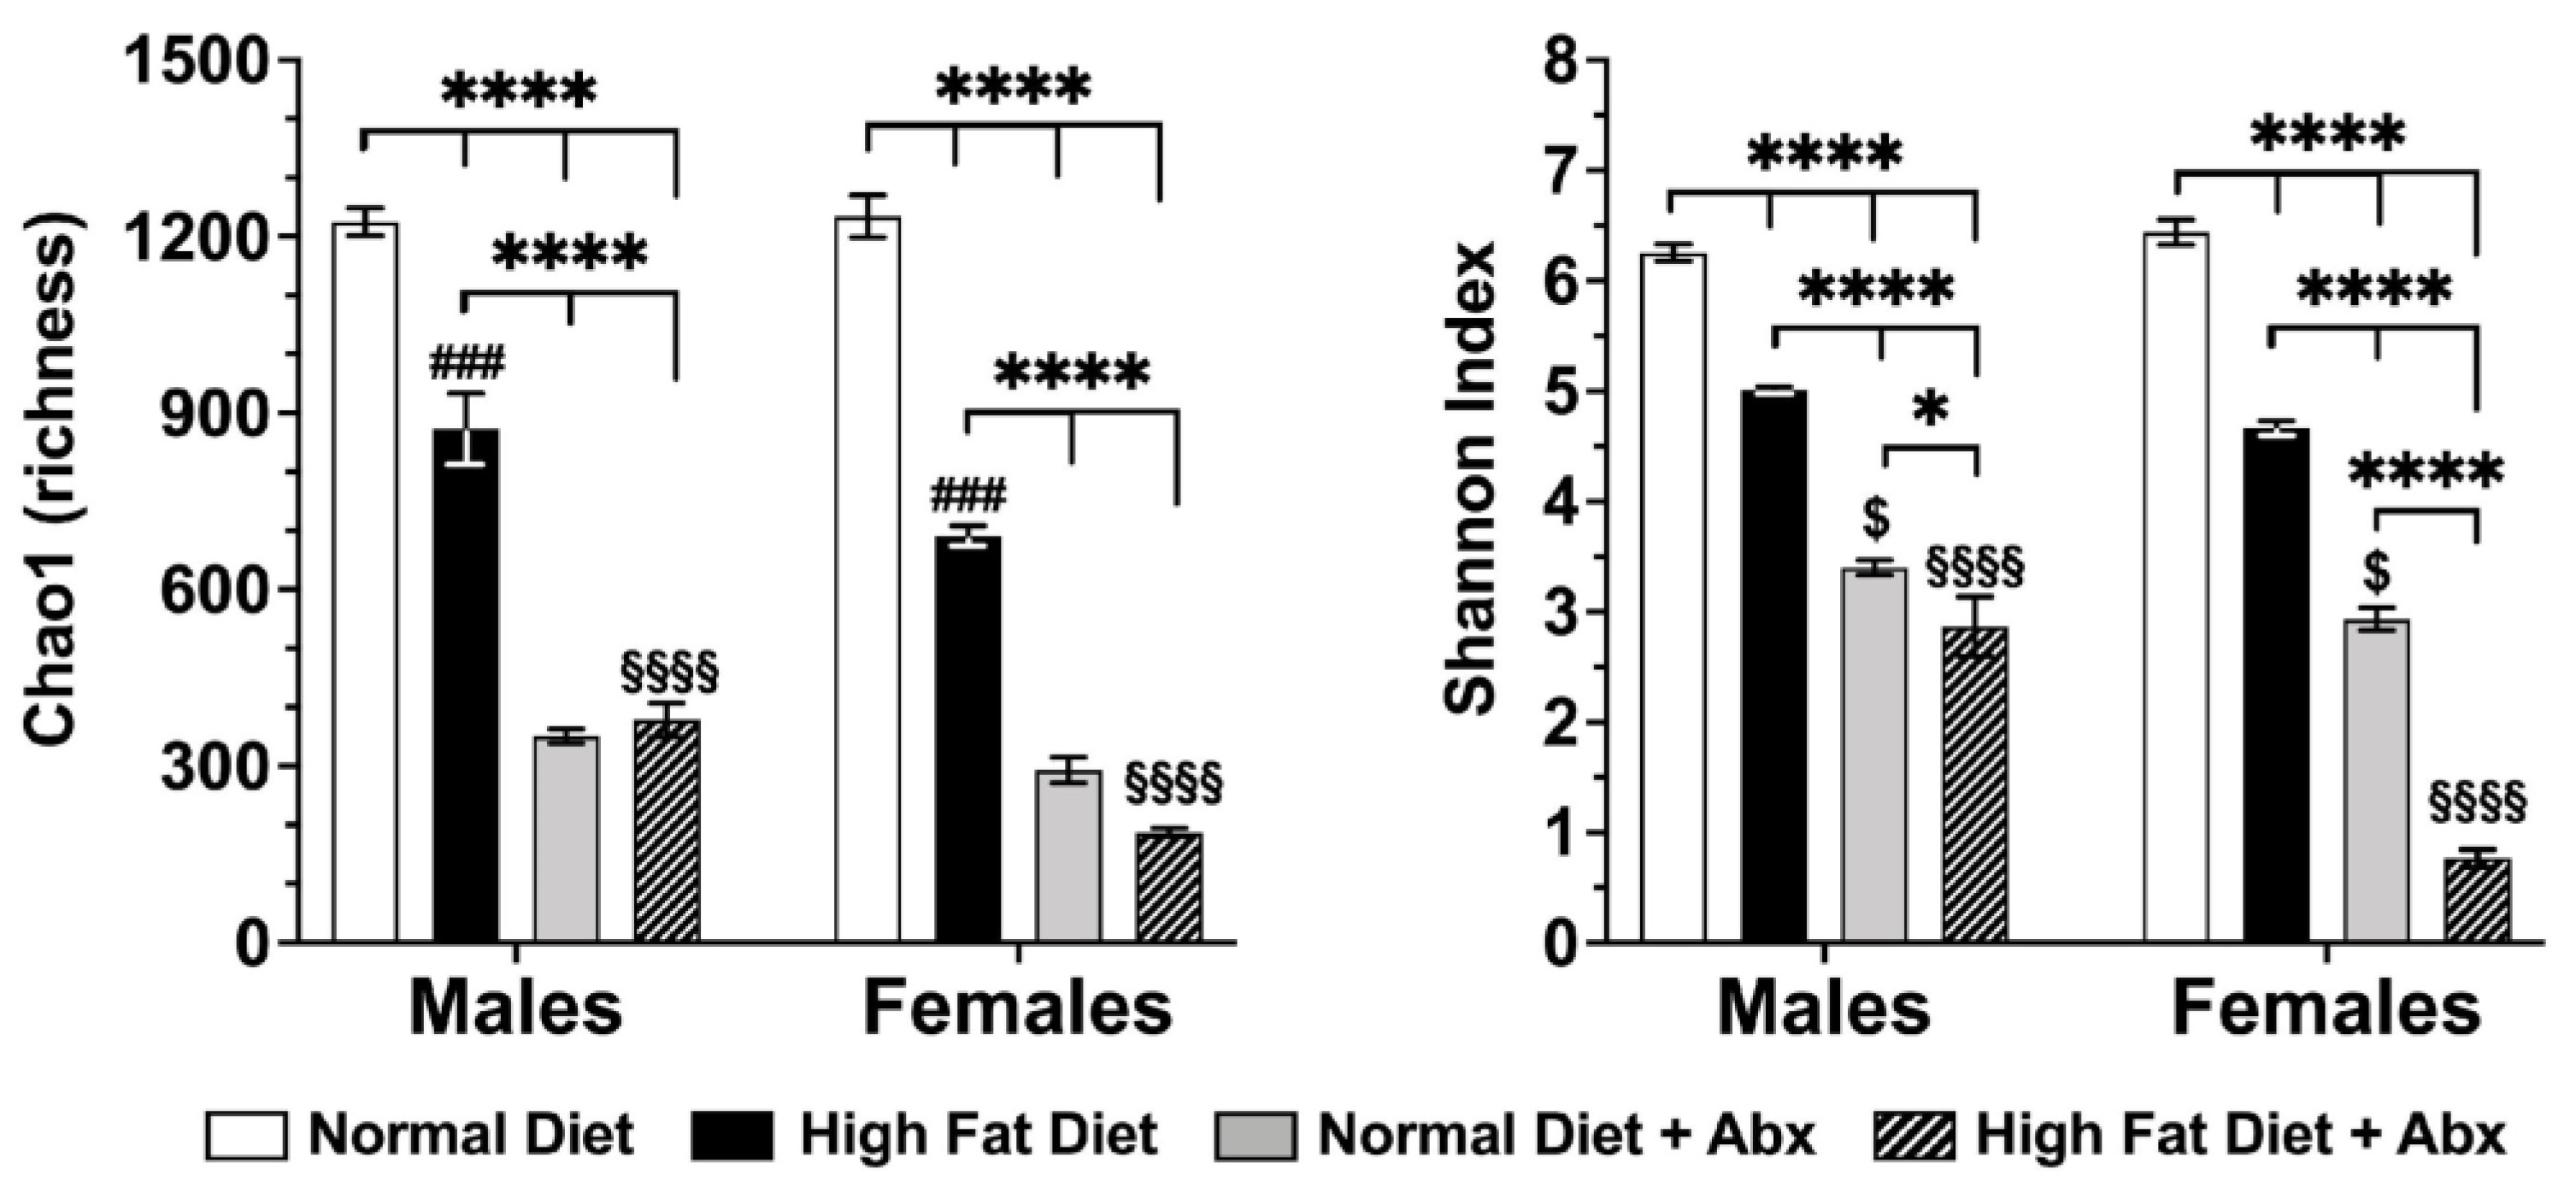
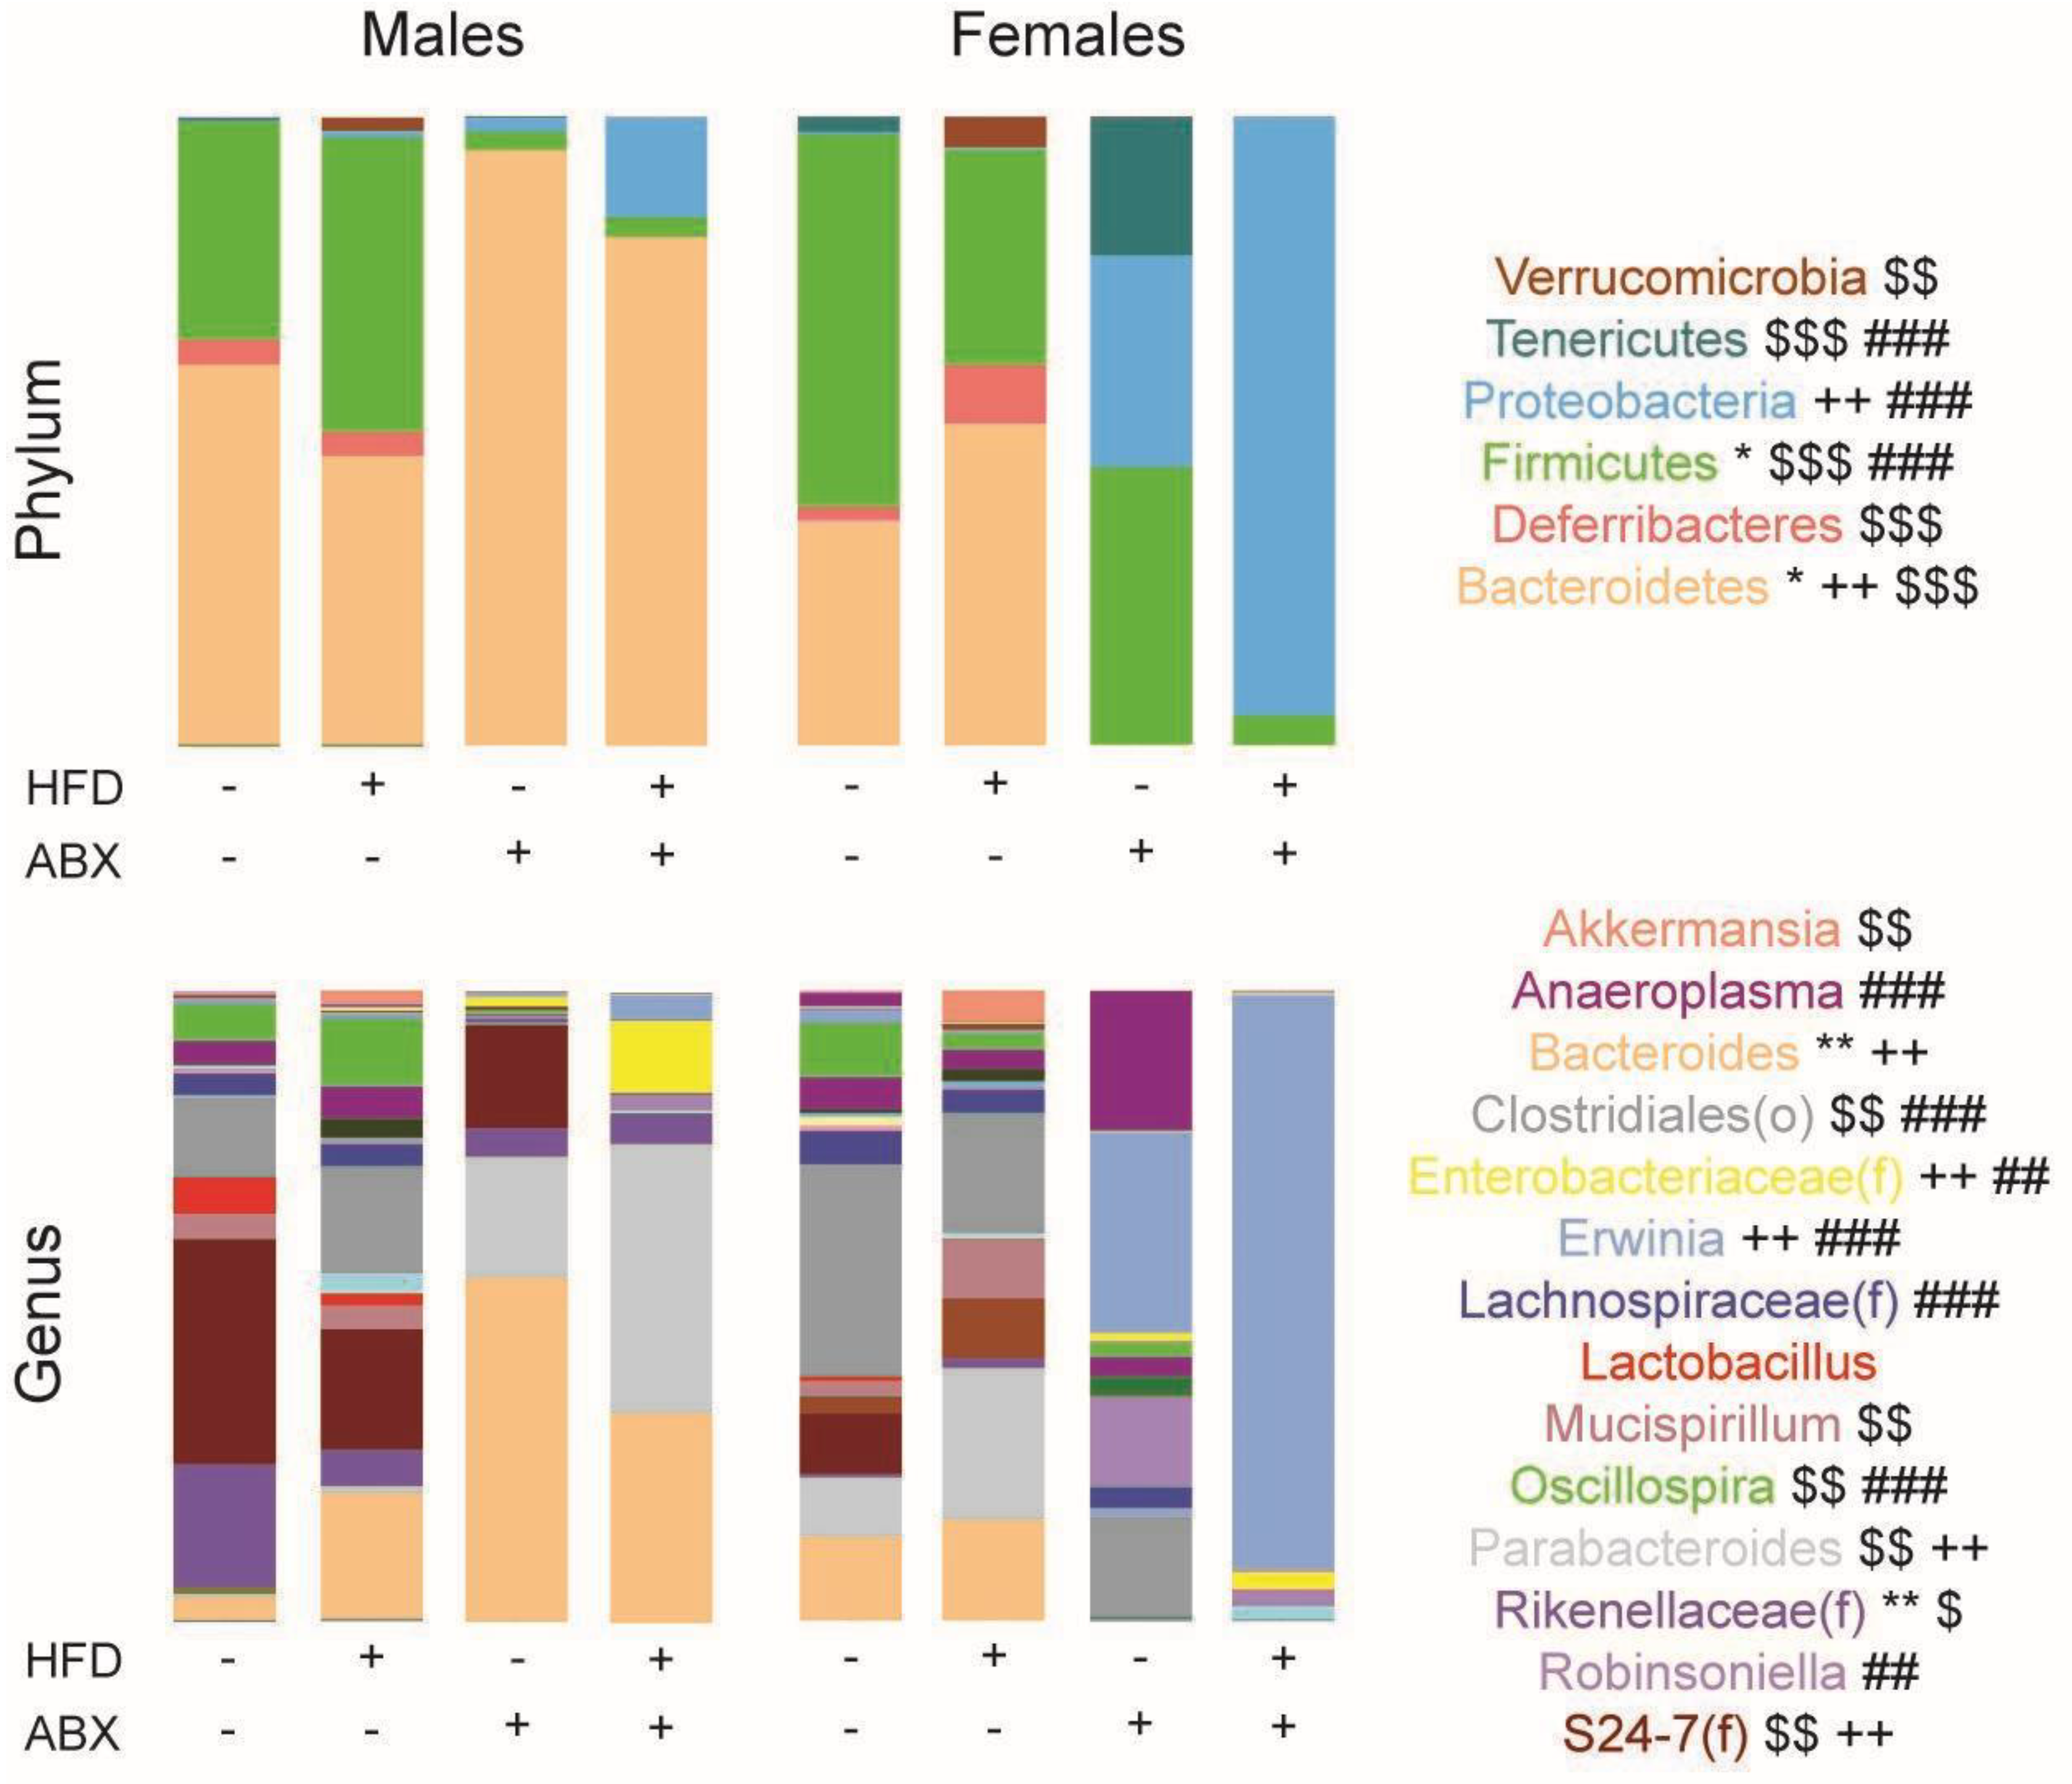
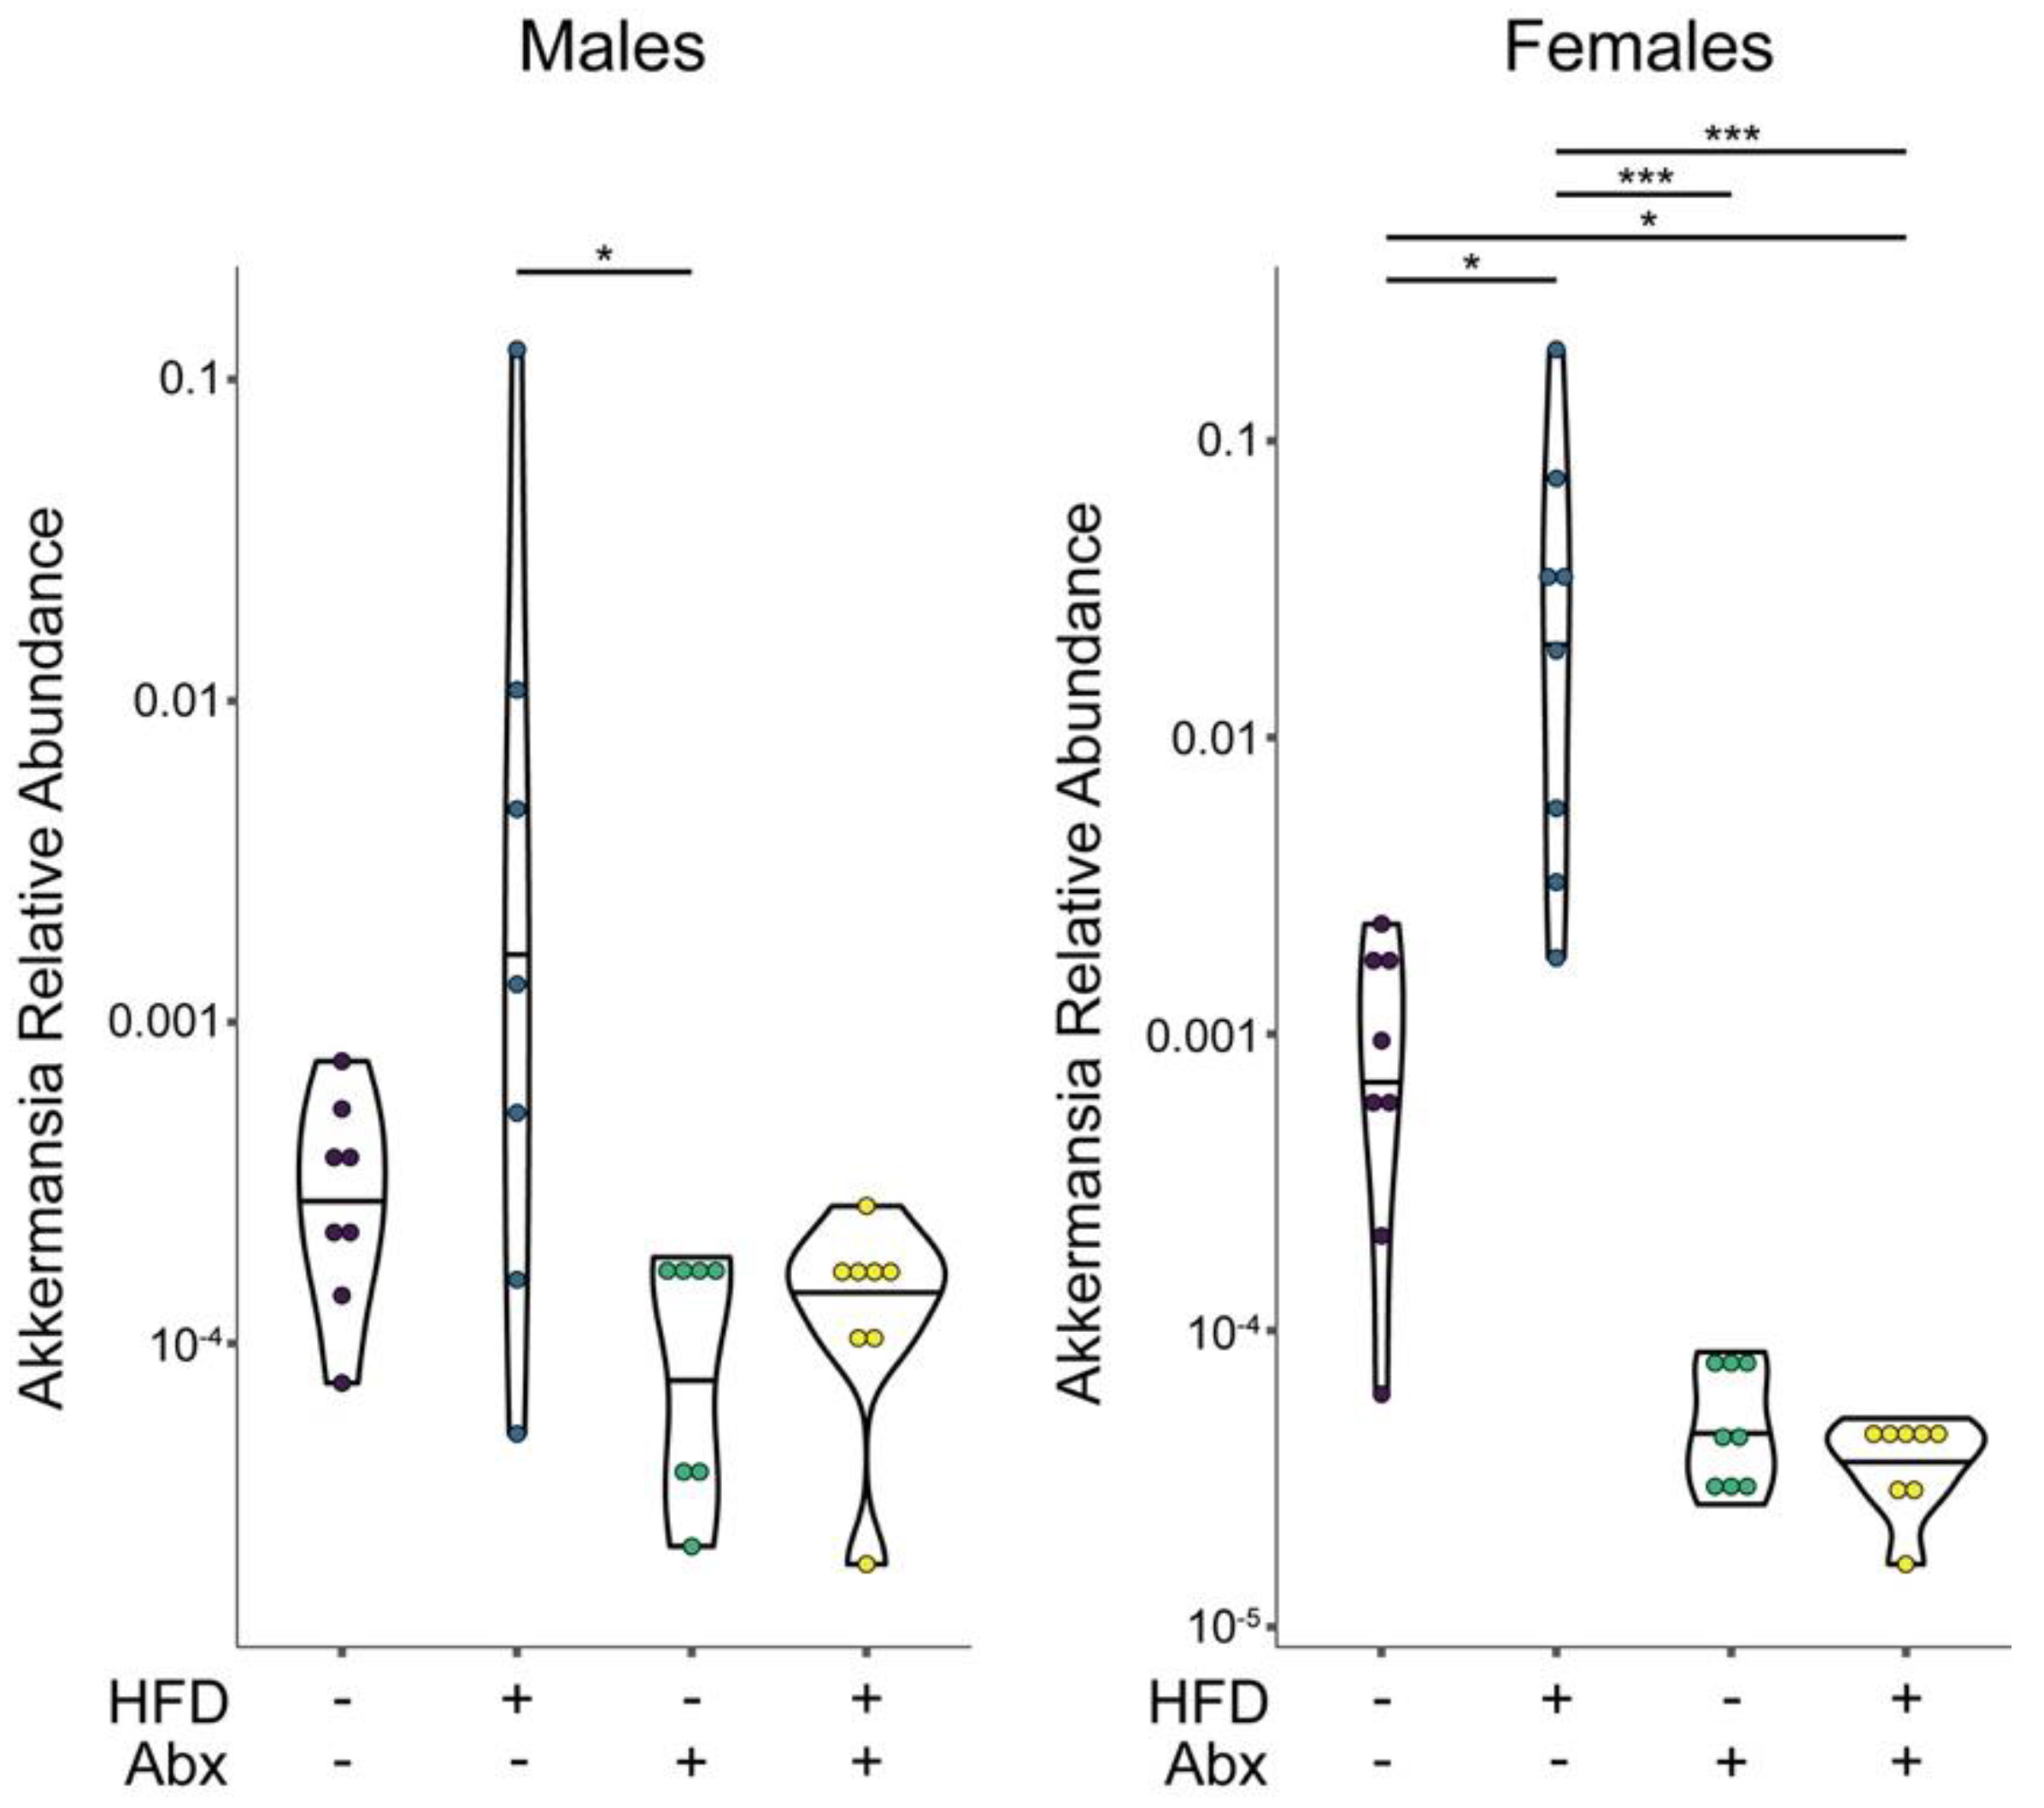
3.4. Microbial Analyses
4. Discussion
5. Conclusions
Supplementary Materials
Author Contributions
Funding
Institutional Review Board Statement
Data Availability Statement
Conflicts of Interest
References
- Chaudhari, N.; Roper, S.D. The cell biology of taste. J. Cell Biol. 2010, 190, 285–296. [Google Scholar] [CrossRef] [PubMed]
- Yarmolinsky, D.A.; Zuker, C.S.; Ryba, N.J. Common sense about taste: From mammals to insects. Cell 2009, 139, 234–244. [Google Scholar] [CrossRef] [PubMed]
- Roper, S.D. Taste buds as peripheral chemosensory processors. Semin. Cell Dev. Biol. 2013, 24, 71–79. [Google Scholar] [CrossRef] [PubMed]
- Roper, S.D.; Chaudhari, N. Taste buds: Cells, signals and synapses. Nat. Rev. Neurosci. 2017, 18, 485–497. [Google Scholar] [CrossRef]
- Chandrashekar, J.; Mueller, K.L.; Hoon, M.A.; Adler, E.; Feng, L.; Guo, W.; Zuker, C.S.; Ryba, N.J. T2Rs function as bitter taste receptors. Cell 2000, 100, 703–711. [Google Scholar] [CrossRef]
- Scott, K. The sweet and the bitter of mammalian taste. Curr. Opin. Neurobiol. 2004, 14, 423–427. [Google Scholar] [CrossRef]
- Rozengurt, N.; Wu, S.; Chen, M.C.; Huang, C.; Sternini, C.; Rozengurt, E. Co-localization of the α-subunit of gustducin with PYY and GLP-1 in L cells of human colon. Am. J. Physiol. Gastrointest. Liver Physiol. 2006, 291, G792–G802. [Google Scholar] [CrossRef]
- Wu, S.V.; Chen, M.C.; Rozengurt, E. Genomic organization, expression, and function of bitter taste receptors (T2R) in mouse and rat. Physiol. Genom. 2005, 22, 139–149. [Google Scholar] [CrossRef]
- Lossow, K.; Hubner, S.; Roudnitzky, N.; Slack, J.P.; Pollastro, F.; Behrens, M.; Meyerhof, W. Comprehensive Analysis of Mouse Bitter Taste Receptors Reveals Different Molecular Receptive Ranges for Orthologous Receptors in Mice and Humans. J. Biol. Chem. 2016, 291, 15358–15377. [Google Scholar] [CrossRef]
- Meyerhof, W.; Batram, C.; Kuhn, C.; Brockhoff, A.; Chudoba, E.; Bufe, B.; Appendino, G.; Behrens, M. The molecular receptive ranges of human TAS2R bitter taste receptors. Chem. Senses 2010, 35, 157–170. [Google Scholar] [CrossRef]
- Avau, B.; Depoortere, I. The bitter truth about bitter taste receptors: Beyond sensing bitter in the oral cavity. Acta Physiol. 2016, 216, 407–420. [Google Scholar] [CrossRef]
- Behrens, M.; Meyerhof, W. Gustatory and extragustatory functions of mammalian taste receptors. Physiol. Behav. 2011, 105, 4–13. [Google Scholar] [CrossRef] [PubMed]
- Depoortere, I. Taste receptors of the gut: Emerging roles in health and disease. Gut 2014, 63, 179–190. [Google Scholar] [CrossRef] [PubMed]
- Finger, T.E.; Kinnamon, S.C. Taste isn’t just for taste buds anymore. F1000 Biol. Rep. 2011, 3, 20. [Google Scholar] [CrossRef]
- Janssen, S.; Depoortere, I. Nutrient sensing in the gut: New roads to therapeutics? Trends Endocrinol. Metab. 2013, 24, 92–100. [Google Scholar] [CrossRef] [PubMed]
- Lu, P.; Zhang, C.H.; Lifshitz, L.M.; ZhuGe, R. Extraoral bitter taste receptors in health and disease. J. Gen. Physiol. 2017, 149, 181–197. [Google Scholar] [CrossRef]
- Furness, J.B.; Rivera, L.R.; Cho, H.J.; Bravo, D.M.; Callaghan, B. The gut as a sensory organ. Nat. Rev. Gastroenterol. Hepatol. 2013, 10, 729–740. [Google Scholar] [CrossRef]
- Bakar, R.; Reimann, F.; Gribble, F. The intestine as an endocrine organ and the role of gut hormones in metabolic regulation. Nat. Rev. Gastroenterol. Hepoatol. 2023. [Google Scholar] [CrossRef] [PubMed]
- Latorre, R.; Sternini, C.; De Giorgio, R.; Greenwood-Van Meerveld, B. Enteroendocrine cells: A review of their role in brain-gut communication. Neurogastroenterol. Motil. 2016, 28, 620–630. [Google Scholar] [CrossRef] [PubMed]
- Sternini, C.; Anselmi, L.; Rozengurt, E. Enteroendocrine cells: A site of ‘taste’ in gastrointestinal chemosensing. Curr. Opin. Endocrinol. Diabetes Obes. 2008, 15, 73–78. [Google Scholar] [CrossRef]
- Kaji, I.; Karaki, S.; Fukami, Y.; Terasaki, M.; Kuwahara, A. Secretory effects of a luminal bitter tastant and expressions of bitter taste receptors, T2Rs, in the human and rat large intestine. Am. J. Physiol. Gastrointest. Liver Physiol. 2009, 296, G971–G981. [Google Scholar] [CrossRef]
- Gu, F.; Liu, X.; Liang, J.; Chen, J.; Chen, F.; Li, F. Bitter taste receptor mTas2r105 is expressed in small intestinal villus and crypts. Biochem. Biophys. Res. Commun. 2015, 463, 934–941. [Google Scholar] [CrossRef]
- Kok, B.P.; Galmozzi, A.; Littlejohn, N.K.; Albert, V.; Godio, C.; Kim, W.; Kim, S.M.; Bland, J.S.; Grayson, N.; Fang, M.; et al. Intestinal bitter taste receptor activation alters hormone secretion and imparts metabolic benefits. Mol. Metab. 2018, 16, 76–87. [Google Scholar] [CrossRef] [PubMed]
- Latorre, R.; Huynh, J.; Mazzoni, M.; Gupta, A.; Bonora, E.; Clavenzani, P.; Chang, L.; Mayer, E.A.; De Giorgio, R.; Sternini, C. Expression of the Bitter Taste Receptor, T2R38, in Enteroendocrine Cells of the Colonic Mucosa of Overweight/Obese vs. Lean Subjects. PLoS ONE 2016, 11, e0147468. [Google Scholar] [CrossRef] [PubMed]
- Liszt, K.I.; Wang, Q.; Farhadipour, M.; Segers, A.; Thijs, T.; Nys, L.; Deleus, E.; Van der Schueren, B.; Gerner, C.; Neuditschko, B.; et al. Human intestinal bitter taste receptors regulate innate immune responses and metabolic regulators in obesity. J. Clin. Investig. 2022, 132, e144828. [Google Scholar] [CrossRef] [PubMed]
- Luo, X.C.; Chen, Z.H.; Xue, J.B.; Zhao, D.X.; Lu, C.; Li, Y.H.; Li, S.M.; Du, Y.W.; Liu, Q.; Wang, P.; et al. Infection by the parasitic helminth Trichinella spiralis activates a Tas2r-mediated signaling pathway in intestinal tuft cells. Proc. Natl. Acad. Sci. USA 2019, 116, 5564–5569. [Google Scholar] [CrossRef] [PubMed]
- Prandi, S.; Bromke, M.; Hubner, S.; Voigt, A.; Boehm, U.; Meyerhof, W.; Behrens, M. A subset of mouse colonic goblet cells expresses the bitter taste receptor Tas2r131. PLoS ONE 2013, 8, e82820. [Google Scholar] [CrossRef] [PubMed]
- Prandi, S.; Voigt, A.; Meyerhof, W.; Behrens, M. Expression profiling of Tas2r genes reveals a complex pattern along the mouse GI tract and the presence of Tas2r131 in a subset of intestinal Paneth cells. Cell Mol. Life Sci. 2018, 75, 49–65. [Google Scholar] [CrossRef]
- Vegezzi, G.; Anselmi, L.; Huynh, J.; Barocelli, E.; Rozengurt, E.; Raybould, H.; Sternini, C. Diet-induced regulation of bitter taste receptor subtypes in the mouse gastrointestinal tract. PLoS ONE 2014, 9, e107732. [Google Scholar] [CrossRef]
- Hao, S.; Sternini, C.; Raybould, H.E. Role of CCK1 and Y2 receptors in activation of hindbrain neurons induced by intragastric administration of bitter taste receptor ligands. Am. J. Physiol. Regul. Integr. Comp. Physiol. 2008, 294, R33–R38. [Google Scholar] [CrossRef]
- Avau, B.; Rotondo, A.; Thijs, T.; Andrews, C.N.; Janssen, P.; Tack, J.; Depoortere, I. Targeting extra-oral bitter taste receptors modulates gastrointestinal motility with effects on satiation. Sci. Rep. 2015, 5, 15985. [Google Scholar] [CrossRef]
- Hao, S.; Dulake, M.; Espero, E.; Sternini, C.; Raybould, H.E.; Rinaman, L. Central Fos expression and conditioned flavor avoidance in rats following intragastric administration of bitter taste receptor ligands. Am. J. Physiol. Regul. Integr. Comp. Physiol. 2009, 296, R528–R536. [Google Scholar] [CrossRef]
- Xie, C.; Wang, X.; Young, R.L.; Horowitz, M.; Rayner, C.K.; Wu, T. Role of Intestinal Bitter Sensing in Enteroendocrine Hormone Secretion and Metabolic Control. Front. Endocrinol. 2018, 9, 576. [Google Scholar] [CrossRef] [PubMed]
- Agusti, A.; Garcia-Pardo, M.P.; Lopez-Almela, I.; Campillo, I.; Maes, M.; Romani-Perez, M.; Sanz, Y. Interplay Between the Gut-Brain Axis, Obesity and Cognitive Function. Front. Neurosci. 2018, 12, 155. [Google Scholar] [CrossRef] [PubMed]
- Frazier, T.H.; DiBaise, J.K.; McClain, C.J. Gut microbiota, intestinal permeability, obesity-induced inflammation, and liver injury. JPEN J. Parenter. Enteral. Nutr. 2011, 35, 14S–20S. [Google Scholar] [CrossRef] [PubMed]
- Mulders, R.J.; de Git, K.C.G.; Schele, E.; Dickson, S.L.; Sanz, Y.; Adan, R.A.H. Microbiota in obesity: Interactions with enteroendocrine, immune and central nervous systems. Obes. Rev. 2018, 19, 435–451. [Google Scholar] [CrossRef] [PubMed]
- Lee, R.J.; Chen, B.; Redding, K.M.; Margolskee, R.F.; Cohen, N.A. Mouse nasal epithelial innate immune responses to Pseudomonas aeruginosa quorum-sensing molecules require taste signaling components. Innate Immun. 2013, 20, 606–617. [Google Scholar] [CrossRef]
- Lee, R.J.; Xiong, G.; Kofonow, J.M.; Chen, B.; Lysenko, A.; Jiang, P.; Abraham, V.; Doghramji, L.; Adappa, N.D.; Palmer, J.N.; et al. T2R38 taste receptor polymorphisms underlie susceptibility to upper respiratory infection. J. Clin. Investig. 2012, 122, 4145–4159. [Google Scholar] [CrossRef]
- Verbeurgt, C.; Veithen, A.; Carlot, S.; Tarabichi, M.; Dumont, J.E.; Hassid, S.; Chatelain, P. The human bitter taste receptor T2R38 is broadly tuned for bacterial compounds. PLoS ONE 2017, 12, e0181302. [Google Scholar] [CrossRef]
- Raman, M.; Ahmed, I.; Gillevet, P.M.; Probert, C.S.; Ratcliffe, N.M.; Smith, S.; Greenwood, R.; Sikaroodi, M.; Lam, V.; Crotty, P.; et al. Fecal microbiome and volatile organic compound metabolome in obese humans with nonalcoholic fatty liver disease. Clin. Gastroenterol. Hepatol. 2013, 11, 868–875.e3. [Google Scholar] [CrossRef]
- Cani, P.D.; Delzenne, N.M.; Amar, J.; Burcelin, R. Role of gut microflora in the development of obesity and insulin resistance following high-fat diet feeding. Pathol. Biol. 2008, 56, 305–309. [Google Scholar] [CrossRef] [PubMed]
- Murphy, E.F.; Cotter, P.D.; Hogan, A.; O’Sullivan, O.; Joyce, A.; Fouhy, F.; Clarke, S.F.; Marques, T.M.; O’Toole, P.W.; Stanton, C.; et al. Divergent metabolic outcomes arising from targeted manipulation of the gut microbiota in diet-induced obesity. Gut 2012, 62, 220–226. [Google Scholar] [CrossRef] [PubMed]
- Turnbaugh, P.J.; Ley, R.E.; Mahowald, M.A.; Magrini, V.; Mardis, E.R.; Gordon, J.I. An obesity-associated gut microbiome with increased capacity for energy harvest. Nature 2006, 444, 1027–1031. [Google Scholar] [CrossRef] [PubMed]
- Dethlefsen, L.; Huse, S.; Sogin, M.L.; Relman, D.A. The pervasive effects of an antibiotic on the human gut microbiota, as revealed by deep 16S rRNA sequencing. PLoS Biol. 2008, 6, e280. [Google Scholar] [CrossRef] [PubMed]
- Dethlefsen, L.; Relman, D.A. Incomplete recovery and individualized responses of the human distal gut microbiota to repeated antibiotic perturbation. Proc. Natl. Acad. Sci. USA 2011, 108 (Suppl. S1), 4554–4561. [Google Scholar] [CrossRef]
- Kim, S.; Covington, A.; Pamer, E.G. The intestinal microbiota: Antibiotics, colonization resistance, and enteric pathogens. Immunol. Rev. 2017, 279, 90–105. [Google Scholar] [CrossRef]
- Cani, P.D.; Bibiloni, R.; Knauf, C.; Waget, A.; Neyrinck, A.M.; Delzenne, N.M.; Burcelin, R. Changes in gut microbiota control metabolic endotoxemia-induced inflammation in high-fat diet-induced obesity and diabetes in mice. Diabetes 2008, 57, 1470–1481. [Google Scholar] [CrossRef]
- Ding, S.; Chi, M.M.; Scull, B.P.; Rigby, R.; Schwerbrock, N.M.; Magness, S.; Jobin, C.; Lund, P.K. High-fat diet: Bacteria interactions promote intestinal inflammation which precedes and correlates with obesity and insulin resistance in mouse. PLoS ONE 2010, 5, e12191. [Google Scholar] [CrossRef]
- Tong, M.; Jacobs, J.P.; McHardy, I.H.; Braun, J. Sampling of intestinal microbiota and targeted amplification of bacterial 16S rRNA genes for microbial ecologic analysis. Curr. Protoc. Immunol. 2014, 107, 7.41.1–7.41.11. [Google Scholar] [CrossRef]
- Caporaso, J.G.; Kuczynski, J.; Stombaugh, J.; Bittinger, K.; Bushman, F.D.; Costello, E.K.; Fierer, N.; Pena, A.G.; Goodrich, J.K.; Gordon, J.I.; et al. QIIME allows analysis of high-throughput community sequencing data. Nat. Methods 2010, 7, 335–336. [Google Scholar] [CrossRef]
- Anderson, M.J. A new method for non-parametric multivariate analysis of variance. Austral Ecol. 2001, 26, 32–46. [Google Scholar]
- Love, M.I.; Huber, W.; Anders, S. Moderated estimation of fold change and dispersion for RNA-seq data with DESeq2. Genome Biol. 2014, 15, 550. [Google Scholar] [CrossRef] [PubMed]
- Storey, J.D.; Tibshirani, R. Statistical significance for genomewide studies. Proc. Natl. Acad. Sci. USA 2003, 100, 9440–9445. [Google Scholar] [CrossRef] [PubMed]
- Santos-Marcos, J.A.; Rangel-Zuniga, O.A.; Jimenez-Lucena, R.; Quintana-Navarro, G.M.; Garcia-Carpintero, S.; Malagon, M.M.; Landa, B.B.; Tena-Sempere, M.; Perez-Martinez, P.; Lopez-Miranda, J.; et al. Influence of gender and menopausal status on gut microbiota. Maturitas 2018, 116, 43–53. [Google Scholar] [CrossRef]
- Ding, Y.; Song, Z.; Li, H.; Chang, L.; Pan, T.; Gu, X.; He, X.; Fan, Z. Honokiol Ameliorates High-Fat-Diet-Induced Obesity of Different Sexes of Mice by Modulating the Composition of the Gut Microbiota. Front. Immunol. 2019, 10, 2800. [Google Scholar] [CrossRef]
- Org, E.; Mehrabian, M.; Parks, B.W.; Shipkova, P.; Liu, X.; Drake, T.A.; Lusis, A.J. Sex differences and hormonal effects on gut microbiota composition in mice. Gut Microbes 2016, 7, 313–322. [Google Scholar] [CrossRef]
- Shi, Y.; Wei, L.; Xing, L.; Wu, S.; Yue, F.; Xia, K.; Zhang, D. Sex Difference is a Determinant of Gut Microbes and Their Metabolites SCFAs/MCFAs in High Fat Diet Fed Rats. Curr. Microbiol. 2022, 79, 347. [Google Scholar] [CrossRef]
- Farhadipour, M.; Depoortere, I. The Function of Gastrointestinal Hormones in Obesity-Implications for the Regulation of Energy Intake. Nutrients 2021, 13, 1839. [Google Scholar] [CrossRef]
- Ley, R.E.; Backhed, F.; Turnbaugh, P.; Lozupone, C.A.; Knight, R.D.; Gordon, J.I. Obesity alters gut microbial ecology. Proc. Natl. Acad. Sci. USA 2005, 102, 11070–11075. [Google Scholar] [CrossRef]
- Maynard, C.L.; Elson, C.O.; Hatton, R.D.; Weaver, C.T. Reciprocal interactions of the intestinal microbiota and immune system. Nature 2012, 489, 231–241. [Google Scholar] [CrossRef]
- Backhed, F.; Manchester, J.K.; Semenkovich, C.F.; Gordon, J.I. Mechanisms underlying the resistance to diet-induced obesity in germ-free mice. Proc. Natl. Acad. Sci. USA 2007, 104, 979–984. [Google Scholar] [CrossRef] [PubMed]
- Ley, R.E.; Peterson, D.A.; Gordon, J.I. Ecological and evolutionary forces shaping microbial diversity in the human intestine. Cell 2006, 124, 837–848. [Google Scholar] [CrossRef] [PubMed]
- Turnbaugh, P.J.; Backhed, F.; Fulton, L.; Gordon, J.I. Diet-induced obesity is linked to marked but reversible alterations in the mouse distal gut microbiome. Cell Host Microbe 2008, 3, 213–223. [Google Scholar] [CrossRef] [PubMed]
- Rodrigues, V.F.; Elias-Oliveira, J.; Pereira, I.S.; Pereira, J.A.; Barbosa, S.C.; Machado, M.S.G.; Carlos, D. Akkermansia muciniphila and Gut Immune System: A Good Friendship That Attenuates Inflammatory Bowel Disease, Obesity, and Diabetes. Front. Immunol. 2022, 13, 934695. [Google Scholar] [CrossRef] [PubMed]
- Kendall, M.M.; Sperandio, V. Quorum sensing by enteric pathogens. Curr. Opin. Gastroenterol. 2007, 23, 10–15. [Google Scholar] [CrossRef]
- Rubio-Gomez, J.M.; Santiago, C.M.; Udaondo, Z.; Garitaonaindia, M.T.; Krell, T.; Ramos, J.L.; Daddaoua, A. Full Transcriptomic Response of Pseudomonas aeruginosa to an Inulin-Derived Fructooligosaccharide. Front. Microbiol. 2020, 11, 202. [Google Scholar] [CrossRef]
- Bhattarai, Y.; Williams, B.B.; Battaglioli, E.J.; Whitaker, W.R.; Till, L.; Grover, M.; Linden, D.R.; Akiba, Y.; Kandimalla, K.K.; Zachos, N.C.; et al. Gut Microbiota-Produced Tryptamine Activates an Epithelial G-Protein-Coupled Receptor to Increase Colonic Secretion. Cell Host Microbe 2018, 23, 775–785.e5. [Google Scholar] [CrossRef]
- Madsen, M.S.A.; Holm, J.B.; Palleja, A.; Wismann, P.; Fabricius, K.; Rigbolt, K.; Mikkelsen, M.; Sommer, M.; Jelsing, J.; Nielsen, H.B.; et al. Metabolic and gut microbiome changes following GLP-1 or dual GLP-1/GLP-2 receptor agonist treatment in diet-induced obese mice. Sci. Rep. 2019, 9, 15582. [Google Scholar] [CrossRef]
- Cani, P.D.; Possemiers, S.; Van de Wiele, T.; Guiot, Y.; Everard, A.; Rottier, O.; Geurts, L.; Naslain, D.; Neyrinck, A.; Lambert, D.M.; et al. Changes in gut microbiota control inflammation in obese mice through a mechanism involving GLP-2-driven improvement of gut permeability. Gut 2009, 58, 1091–1103. [Google Scholar] [CrossRef]
- Lee, S.-J.; Depoortere, I.; Hatt, H. Therapeutic potential of ectopic olfactory and taste receptors. Nat. Rev. 2019, 18, 116–138. [Google Scholar] [CrossRef]
- Wang, Q.; Liszt, K.I.; Depoortere, I. Extra-oral bitter taste receptors: New targets against obesity? Peptides 2020, 127, 170284. [Google Scholar] [CrossRef] [PubMed]


Disclaimer/Publisher’s Note: The statements, opinions and data contained in all publications are solely those of the individual author(s) and contributor(s) and not of MDPI and/or the editor(s). MDPI and/or the editor(s) disclaim responsibility for any injury to people or property resulting from any ideas, methods, instructions or products referred to in the content. |
© 2023 by the authors. Licensee MDPI, Basel, Switzerland. This article is an open access article distributed under the terms and conditions of the Creative Commons Attribution (CC BY) license (https://creativecommons.org/licenses/by/4.0/).
Share and Cite
Caremoli, F.; Huynh, J.; Lagishetty, V.; Markovic, D.; Braun, J.; Dong, T.S.; Jacobs, J.P.; Sternini, C. Microbiota-Dependent Upregulation of Bitter Taste Receptor Subtypes in the Mouse Large Intestine in High-Fat Diet-Induced Obesity. Nutrients 2023, 15, 4145. https://doi.org/10.3390/nu15194145
Caremoli F, Huynh J, Lagishetty V, Markovic D, Braun J, Dong TS, Jacobs JP, Sternini C. Microbiota-Dependent Upregulation of Bitter Taste Receptor Subtypes in the Mouse Large Intestine in High-Fat Diet-Induced Obesity. Nutrients. 2023; 15(19):4145. https://doi.org/10.3390/nu15194145
Chicago/Turabian StyleCaremoli, Filippo, Jennifer Huynh, Venu Lagishetty, Daniela Markovic, Jonathan Braun, Tien S. Dong, Jonathan P. Jacobs, and Catia Sternini. 2023. "Microbiota-Dependent Upregulation of Bitter Taste Receptor Subtypes in the Mouse Large Intestine in High-Fat Diet-Induced Obesity" Nutrients 15, no. 19: 4145. https://doi.org/10.3390/nu15194145
APA StyleCaremoli, F., Huynh, J., Lagishetty, V., Markovic, D., Braun, J., Dong, T. S., Jacobs, J. P., & Sternini, C. (2023). Microbiota-Dependent Upregulation of Bitter Taste Receptor Subtypes in the Mouse Large Intestine in High-Fat Diet-Induced Obesity. Nutrients, 15(19), 4145. https://doi.org/10.3390/nu15194145