
Meta-Analysis of European Clinical Trials Characterizing the Healthy-Adult Serum 25-hydroxyvitamin D Response to Vitamin D Supplementation
 ,
, 
Abstract
:1. Introduction
2. Materials and Methods
2.1. Search Strategy
2.2. Inclusion and Exclusion Criteria
2.3. Data Extraction and Quality Assessment
2.4. Statistical Analysis
3. Results
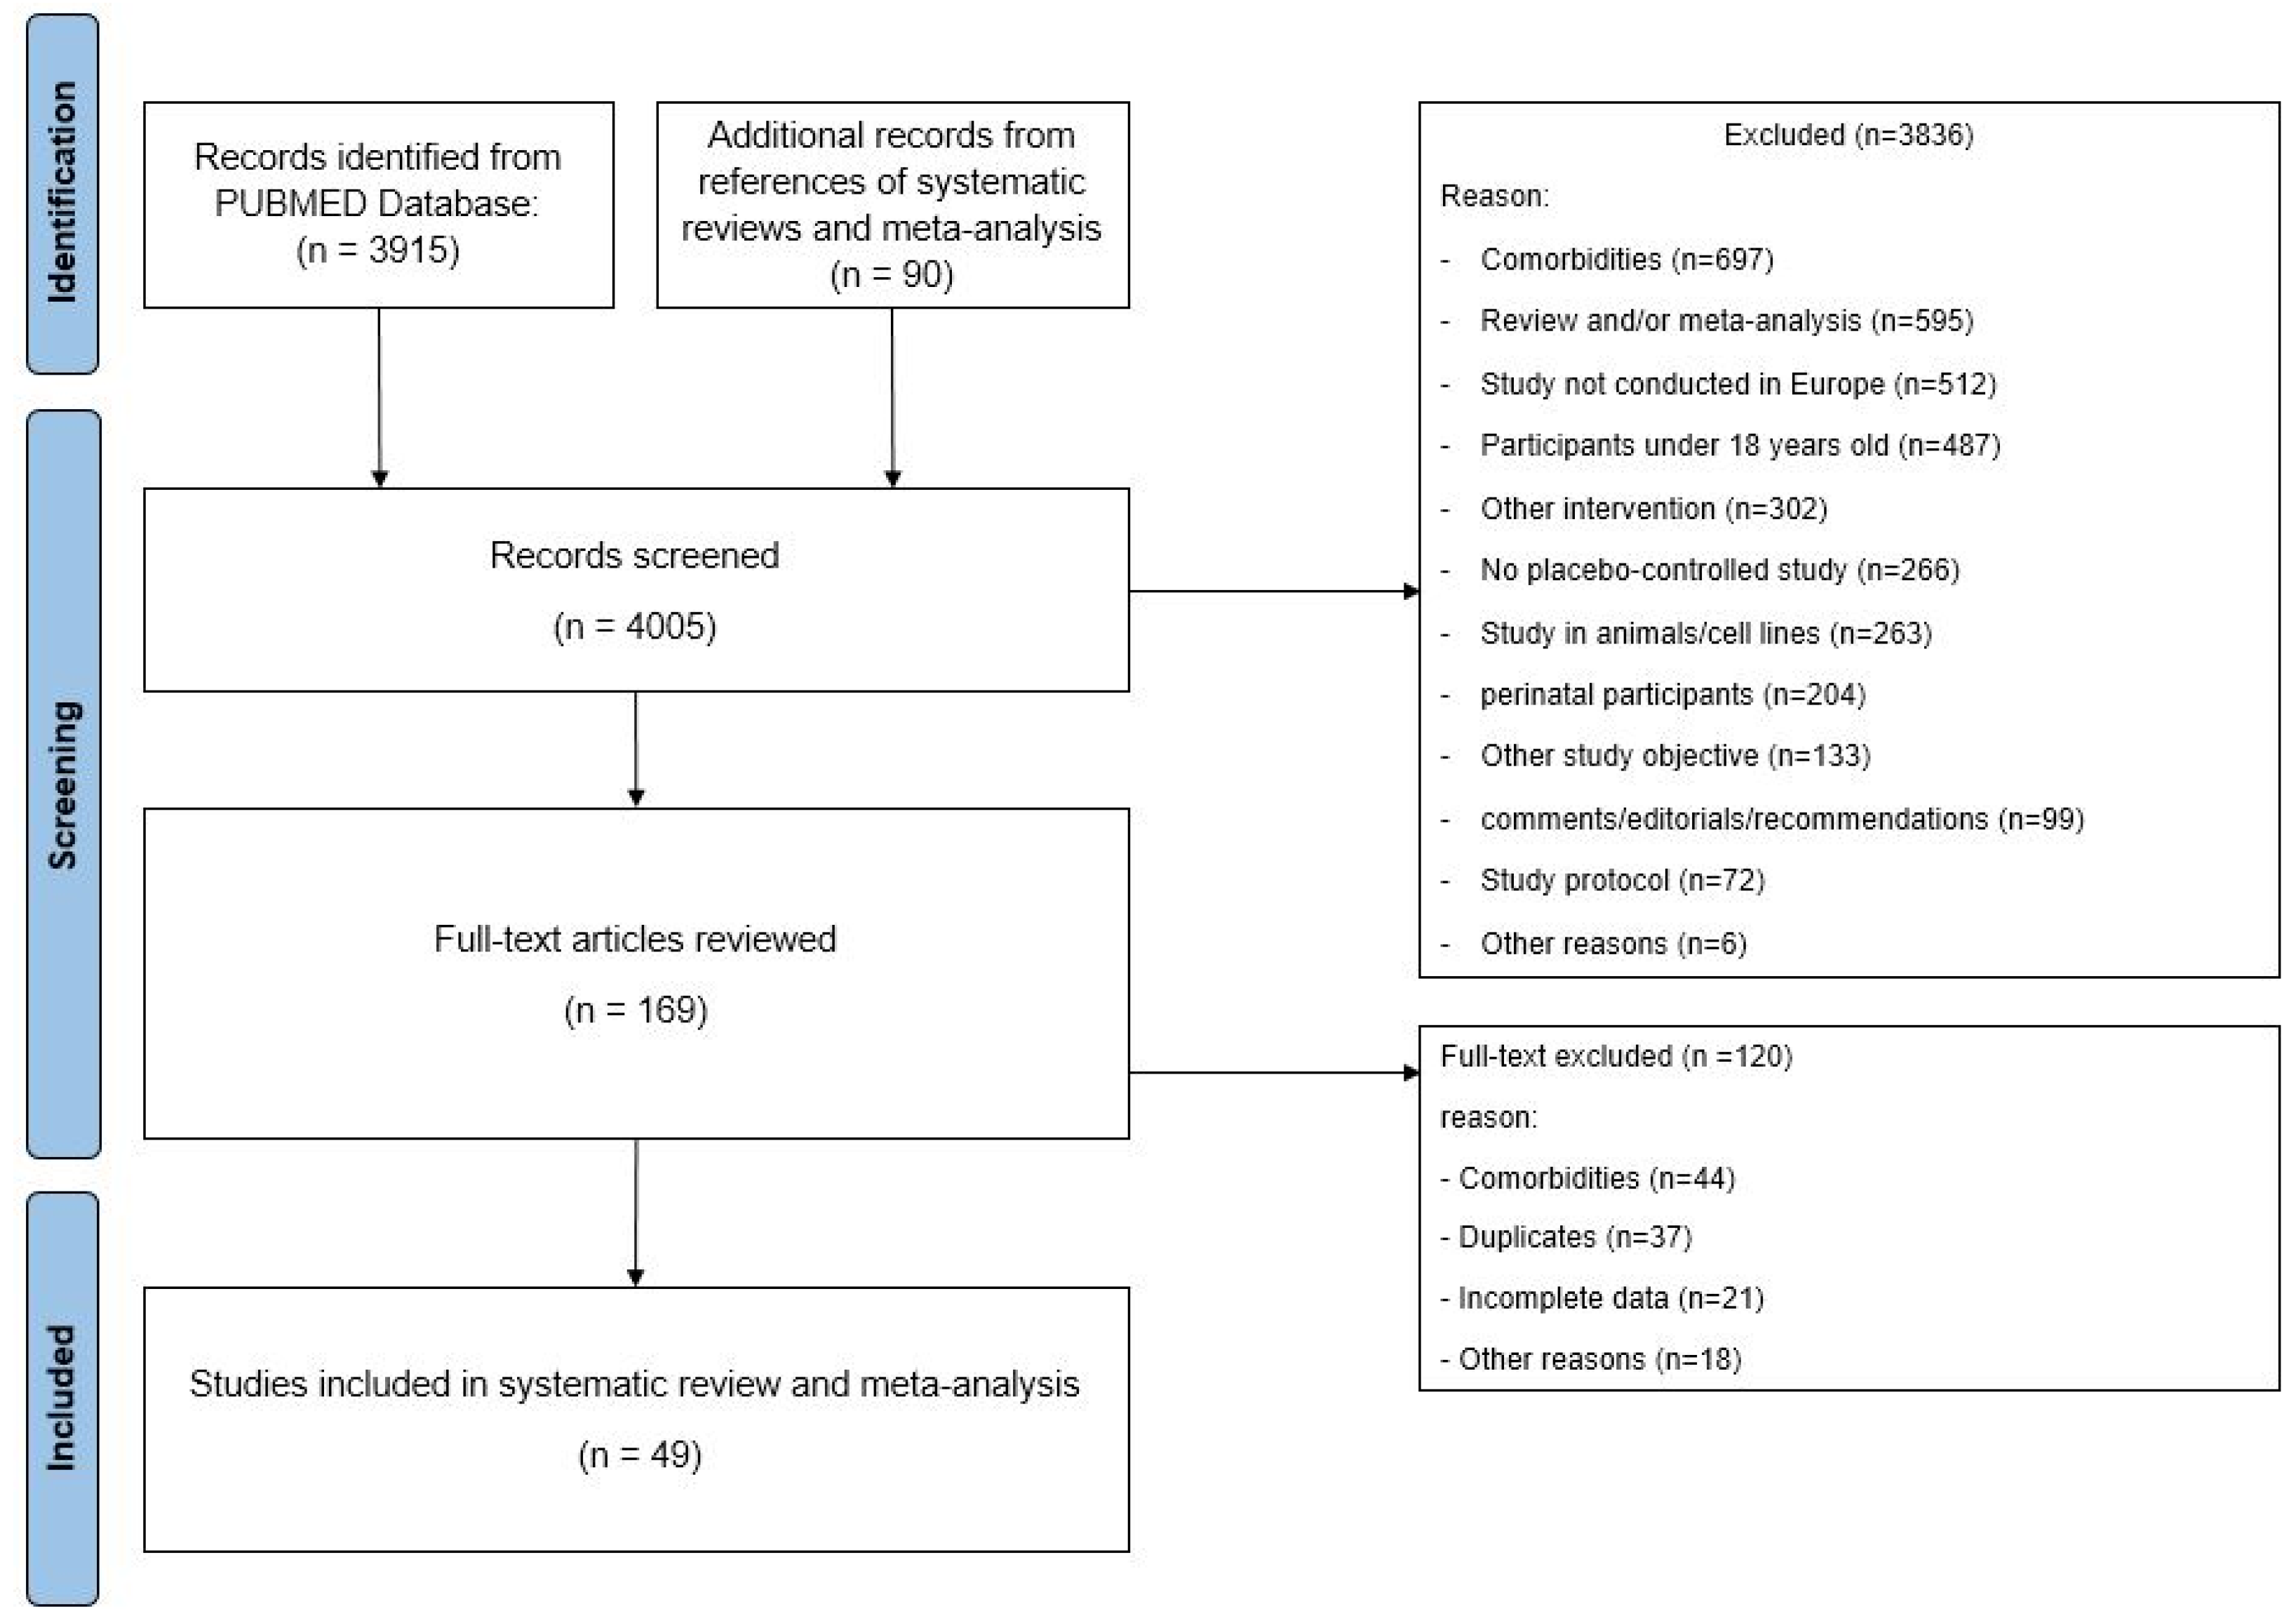
3.1. Literature Search and Quality Assessment
3.2. Study Characteristics
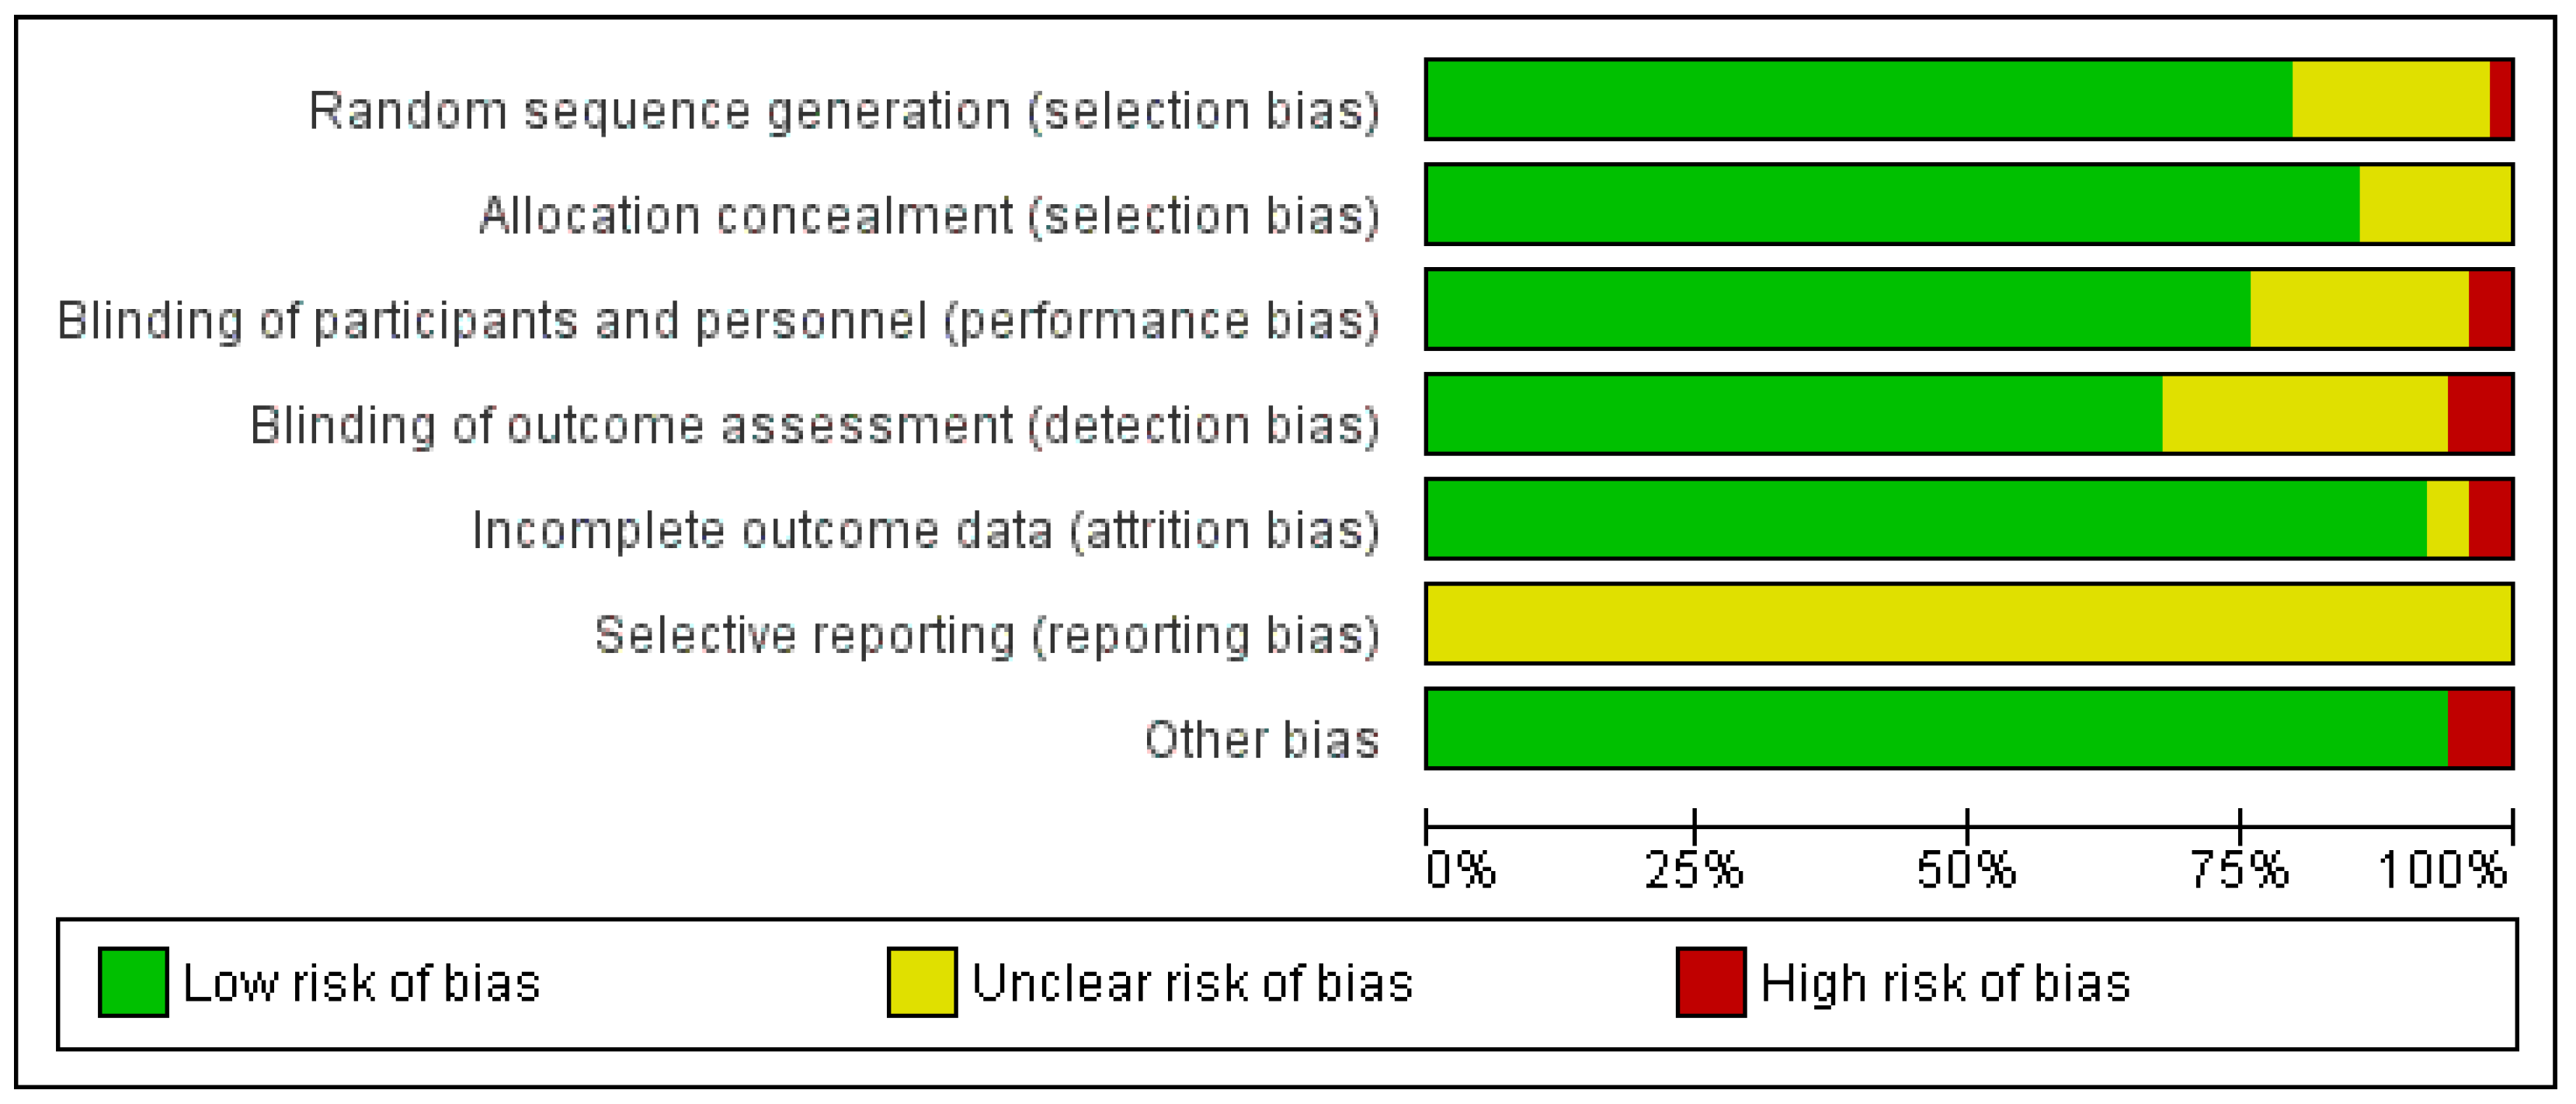
3.3. Risk-of-Bias and Quality Assessments
3.4. Meta-Analysis
3.4.1. Characteristics of the Overall Population
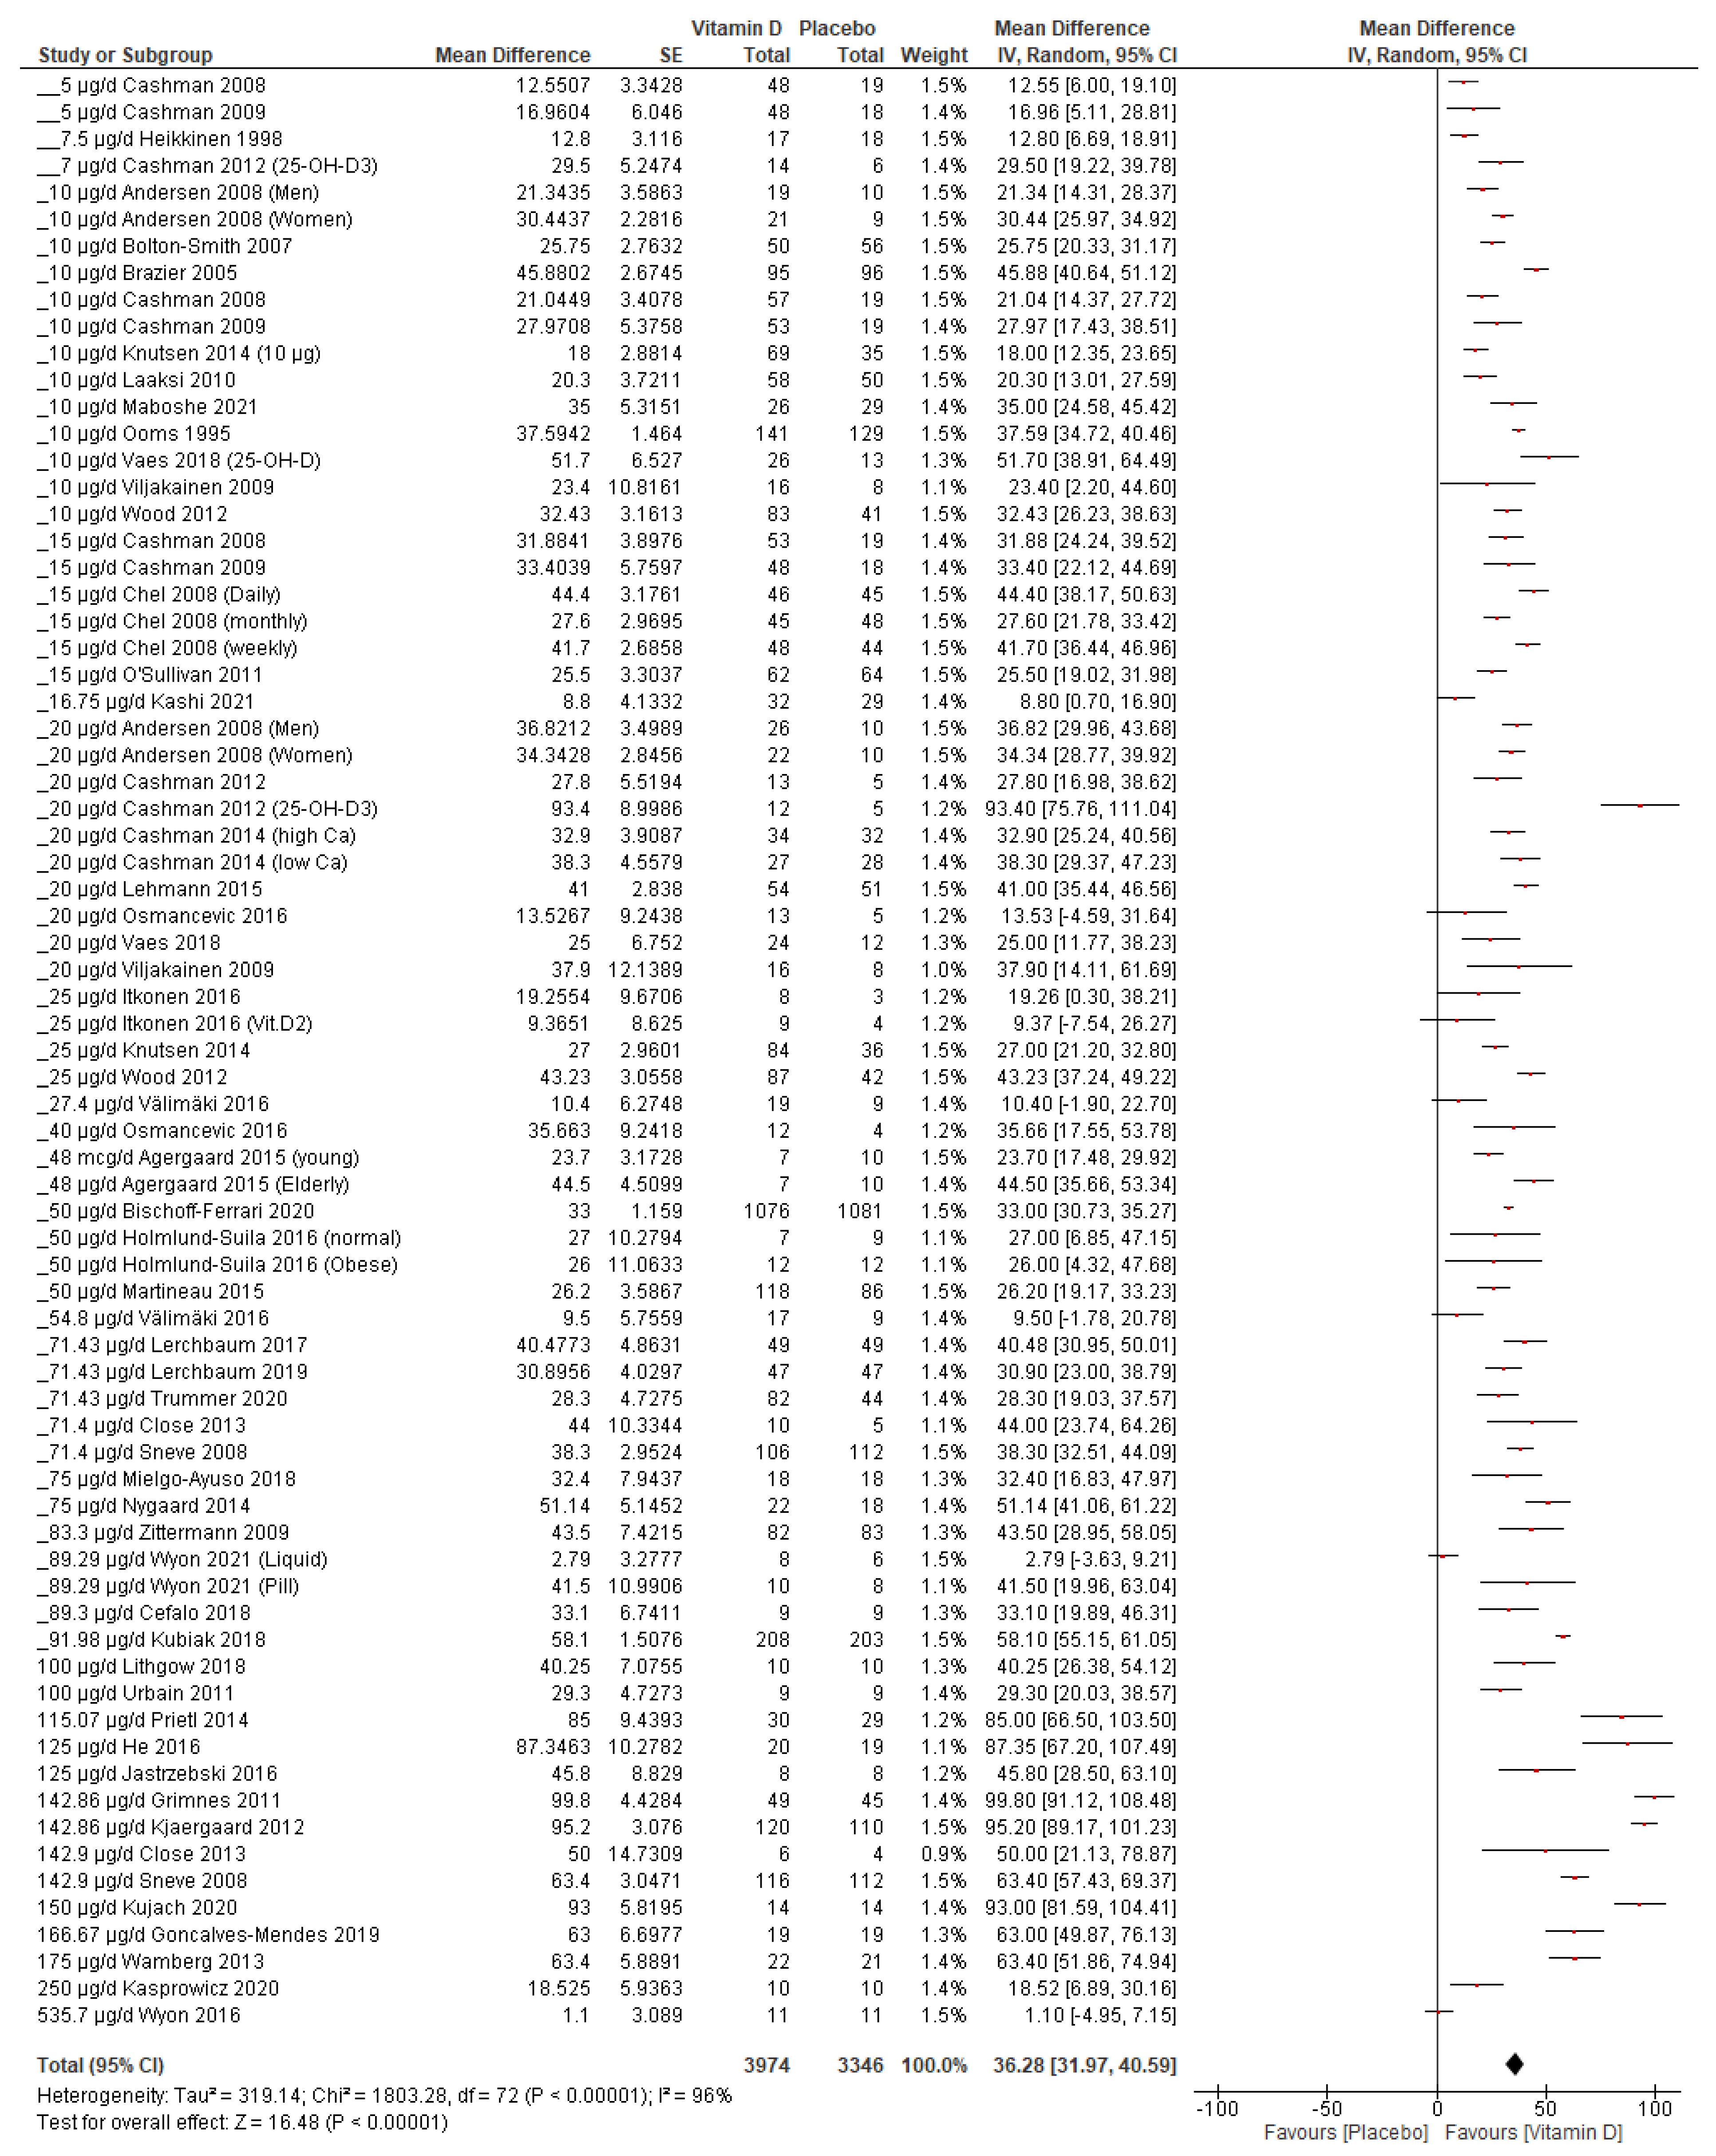
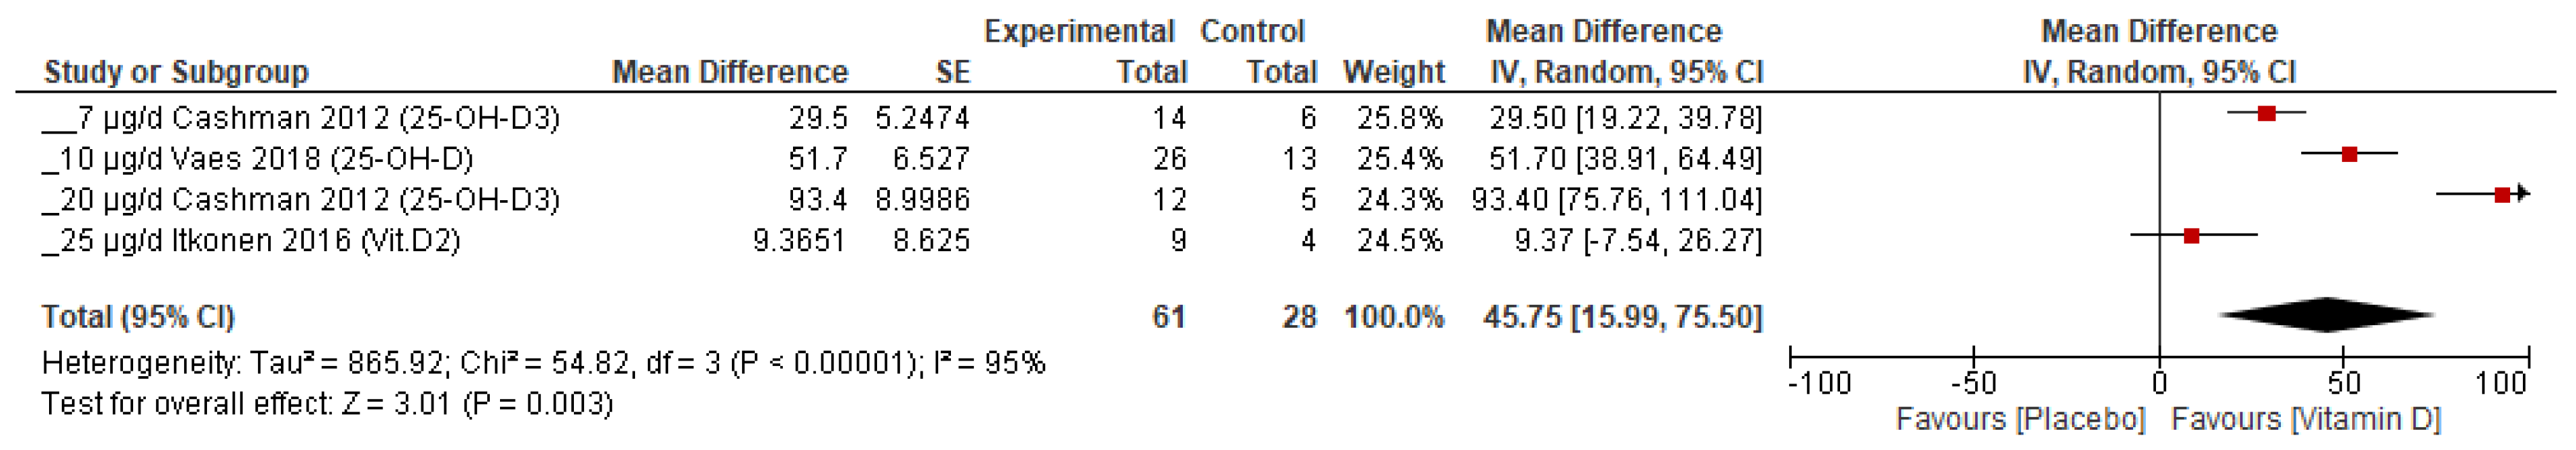
3.4.2. Vitamin D Supplementation Increases Serum 25(OH)D Concentration
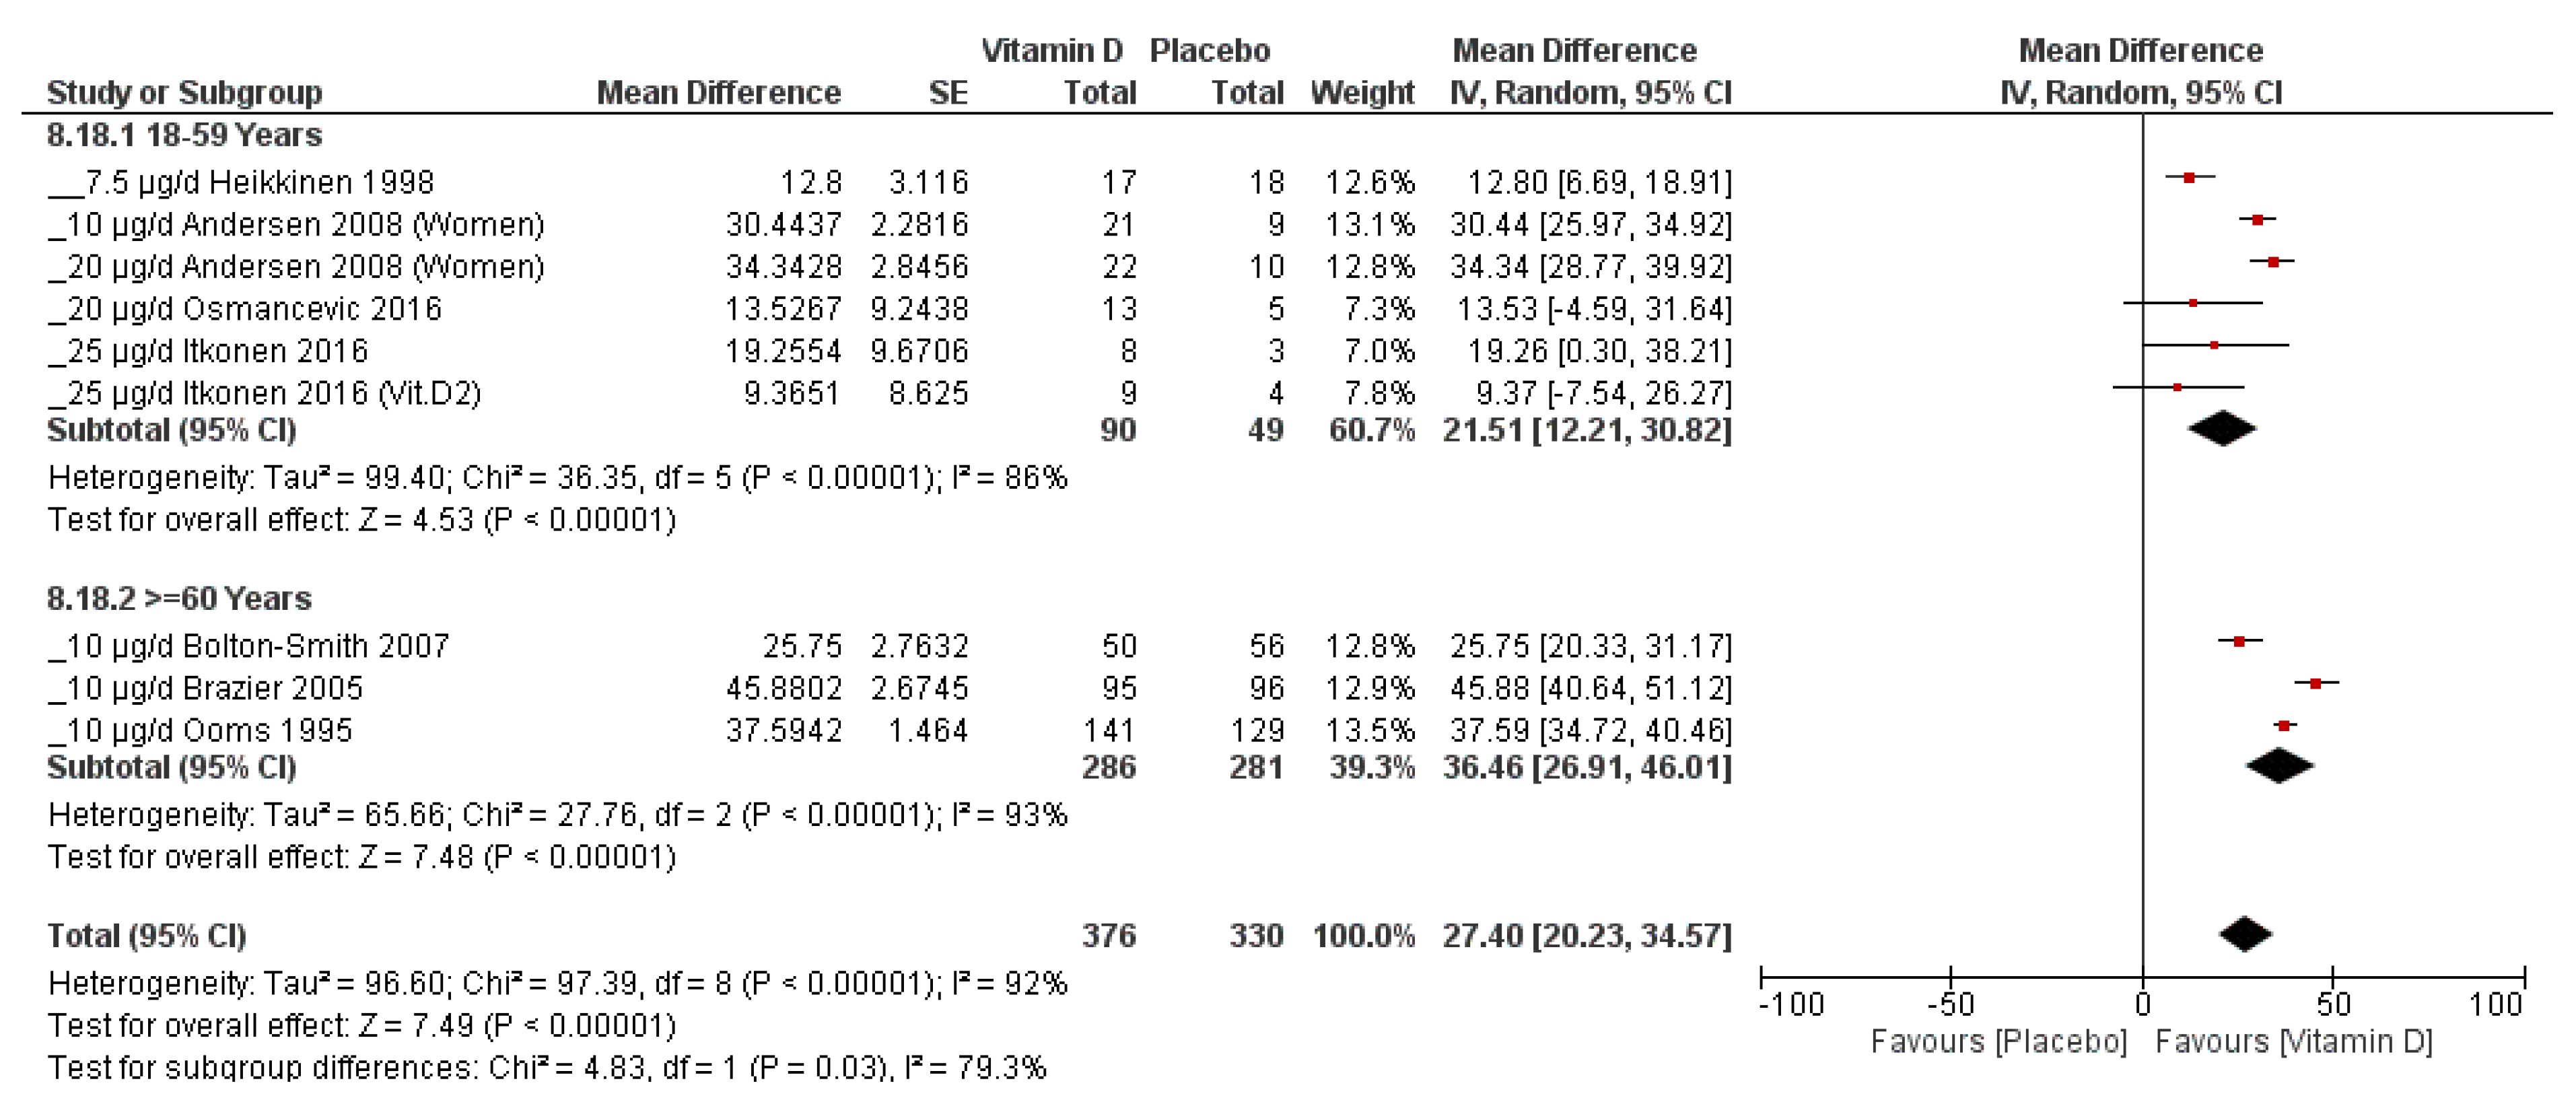
3.4.3. Subgroup Analysis
- 1.
- Vitamin D variants
- 2.
- Vitamin D supplementation dose
- 3.
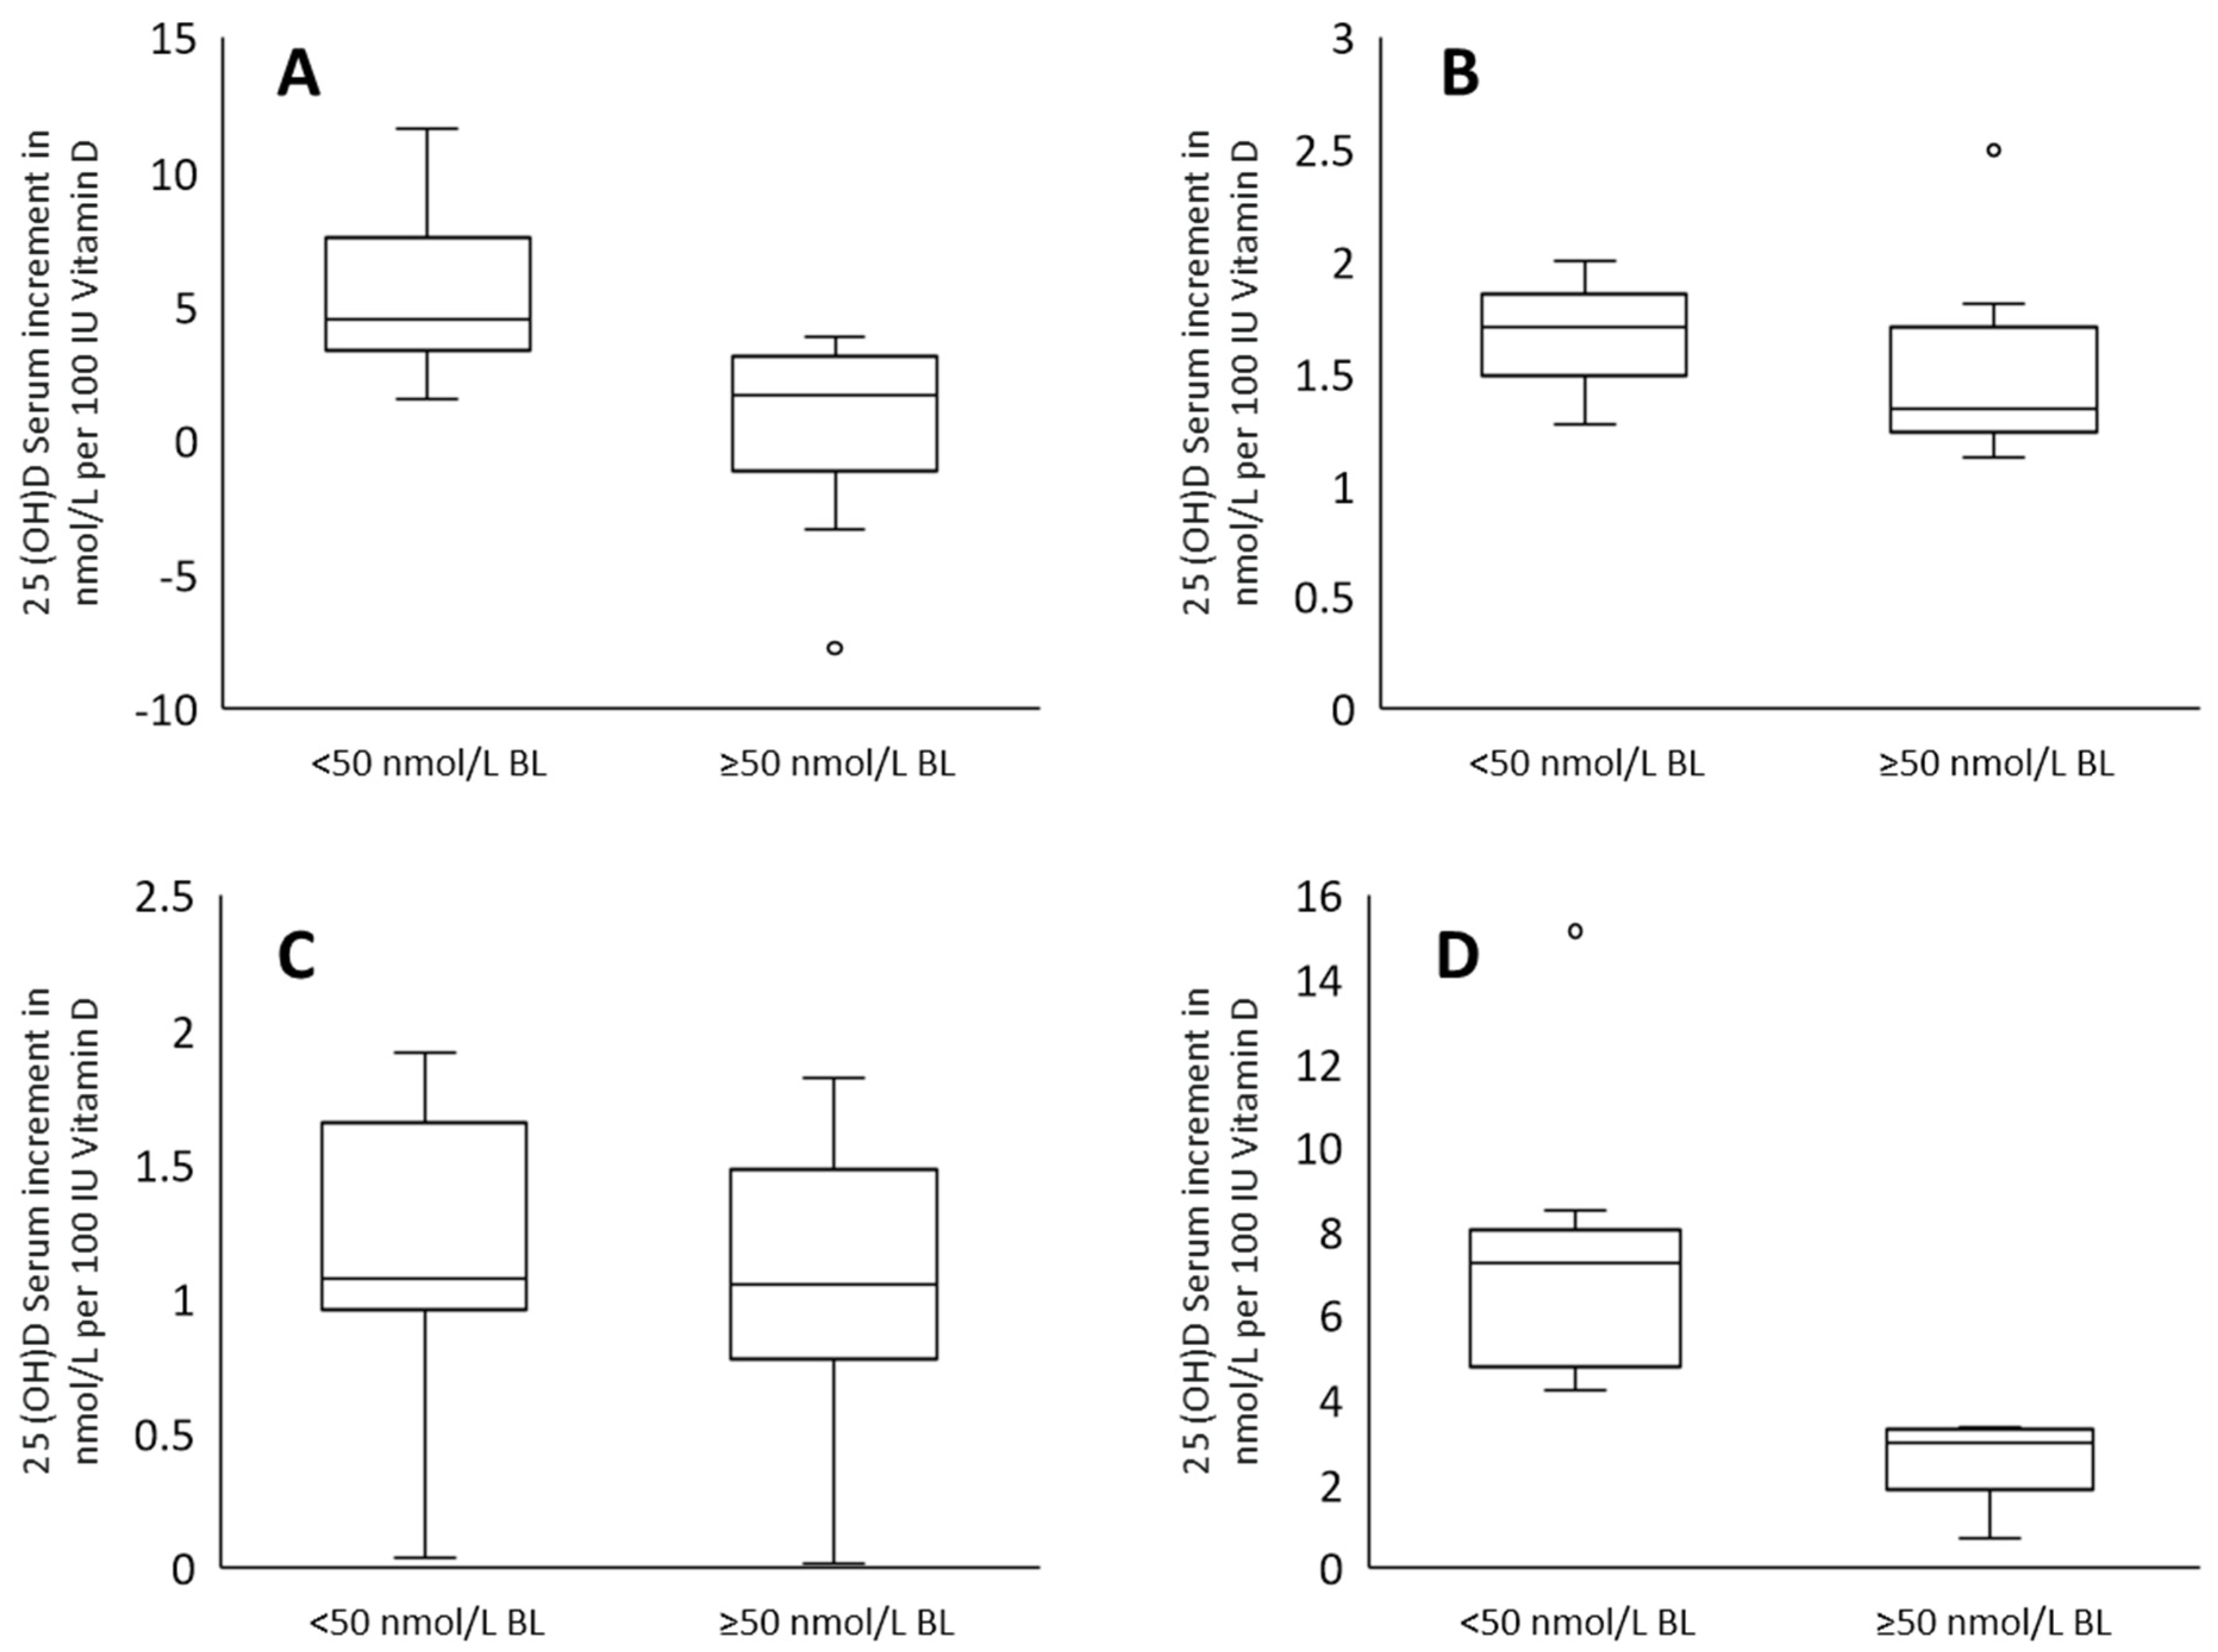
- Baseline
- 4.
- Age
- 5.
- Ethnicity
- 6.
- Additional calcium supplementation
- 7.
- Gender
3.4.4. Sensitivity Analysis
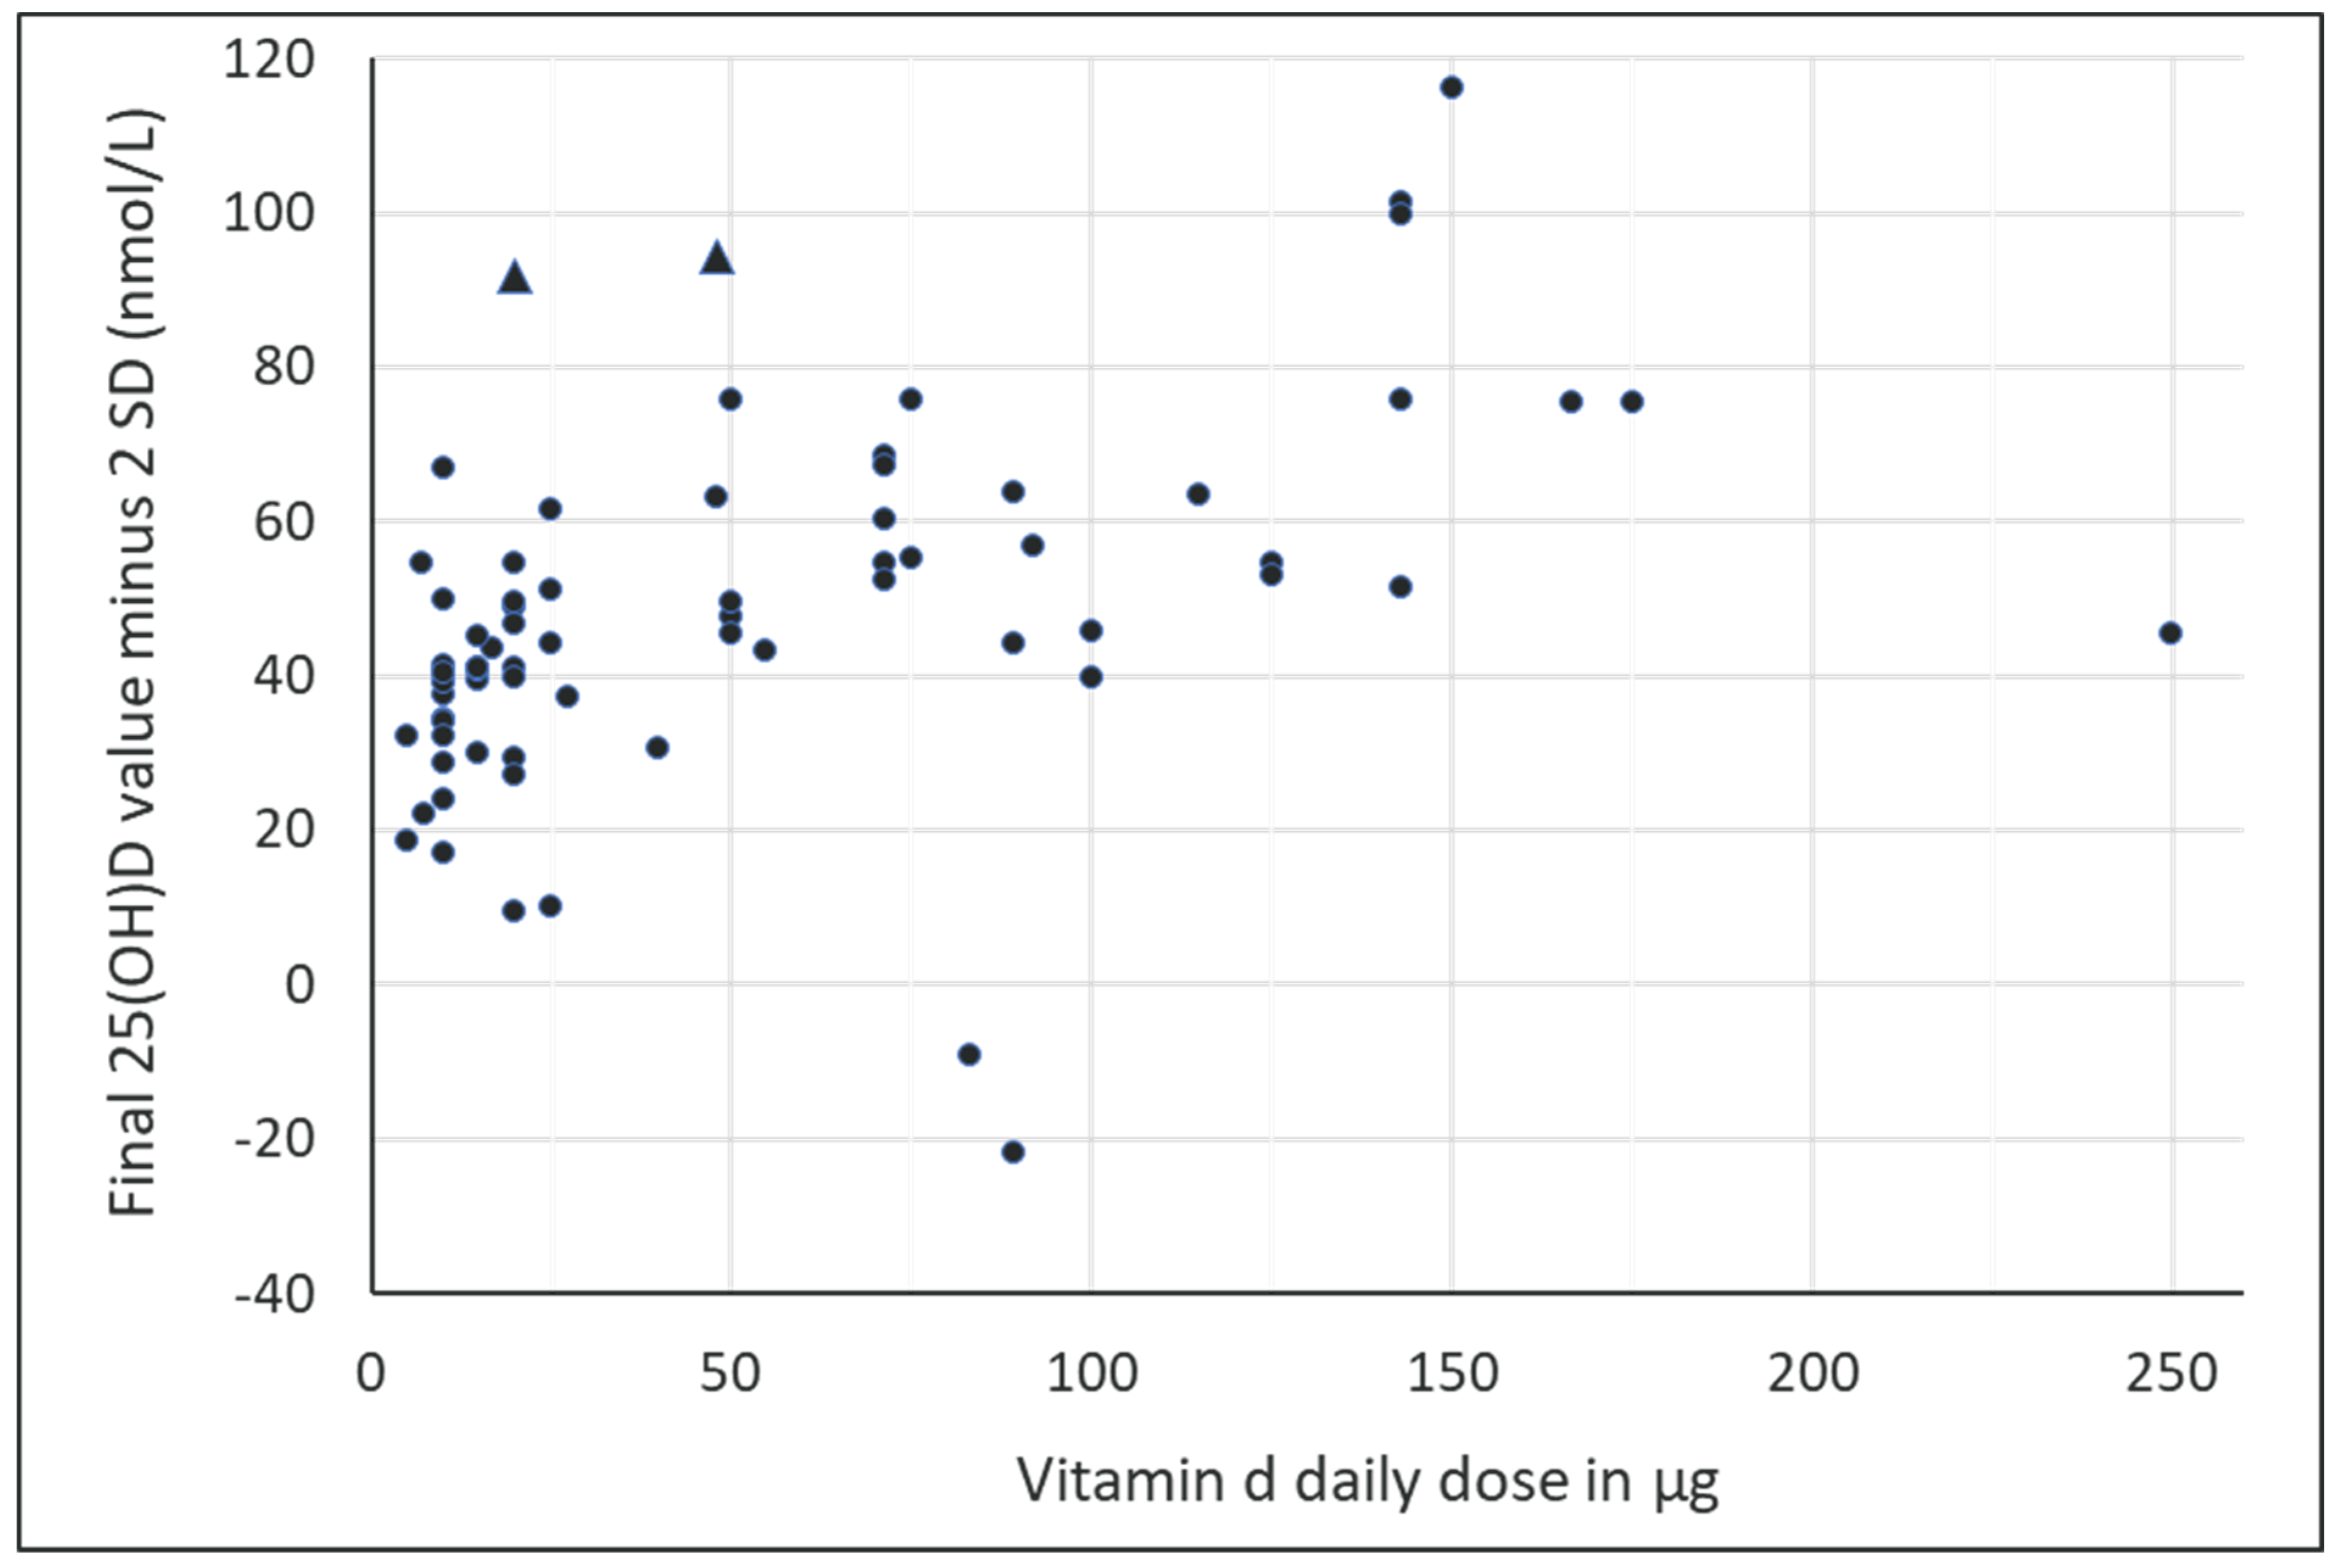
3.4.5. Estimation of the Vitamin D Supplementation Dose to Achieve the Desired Serum 25(OH)D Concentration
4. Discussion
4.1. Influencing Factors on the Serum 25(OH)D Increment
4.2. Estimation of Vitamin D Supplementation Dosage
4.3. Vitamin D Intoxication
4.4. Strengths and Limitations
5. Conclusions
Supplementary Materials
Author Contributions
Funding
Data Availability Statement
Conflicts of Interest
References
- Holick, M.F. The vitamin D deficiency pandemic: Approaches for diagnosis, treatment and prevention. Rev. Endocr. Metab. Disord. 2017, 18, 153–165. [Google Scholar] [CrossRef] [PubMed]
- DeLuca, H.F. Overview of general physiologic features and functions of vitamin D. Am. J. Clin. Nutr. 2004, 80, 1689S–1696S. [Google Scholar] [CrossRef] [PubMed]
- Lips, P. Vitamin D physiology. Prog. Biophys. Mol. Biol. 2006, 92, 4–8. [Google Scholar] [CrossRef] [PubMed]
- Reichrath, J. Sonne—Die Dosis macht’s! Hautkrebs Vermeiden Vitam.-D-Mangel Vorbeug. 2021. [Google Scholar]
- Mithal, A.; Wahl, D.A.; Bonjour, J.P.; Burckhardt, P.; Dawson-Hughes, B.; Eisman, J.A.; El-Hajj Fuleihan, G.; Josse, R.G.; Lips, P.; Morales-Torres, J.; et al. Global vitamin D status and determinants of hypovitaminosis D. Osteoporos. Int. 2009, 20, 1807–1820. [Google Scholar] [CrossRef]
- Spiro, A.; Buttriss, J.L. Vitamin D: An overview of vitamin D status and intake in Europe. Nutr. Bull. 2014, 39, 322–350. [Google Scholar] [CrossRef]
- Cashman, K.D.; Dowling, K.G.; Skrabakova, Z.; Gonzalez-Gross, M.; Valtuena, J.; De Henauw, S.; Moreno, L.; Damsgaard, C.T.; Michaelsen, K.F.; Molgaard, C.; et al. Vitamin D deficiency in Europe: Pandemic? Am. J. Clin. Nutr. 2016, 103, 1033–1044. [Google Scholar] [CrossRef] [PubMed]
- Lips, P. Vitamin D deficiency and secondary hyperparathyroidism in the elderly: Consequences for bone loss and fractures and therapeutic implications. Endocr. Rev. 2001, 22, 477–501. [Google Scholar] [CrossRef]
- McKenna, M.J. Differences in vitamin D status between countries in young adults and the elderly. Am. J. Med. 1992, 93, 69–77. [Google Scholar] [CrossRef]
- Holick, M.F. Vitamin D Is Not as Toxic as Was Once Thought: A Historical and an Up-to-Date Perspective. Mayo Clin. Proc. 2015, 90, 561–564. [Google Scholar] [CrossRef]
- Page, M.J.; McKenzie, J.E.; Bossuyt, P.M.; Boutron, I.; Hoffmann, T.C.; Mulrow, C.D.; Shamseer, L.; Tetzlaff, J.M.; Akl, E.A.; Brennan, S.E.; et al. The PRISMA 2020 statement: An updated guideline for reporting systematic reviews. BMJ 2021, 372, n71. [Google Scholar] [CrossRef] [PubMed]
- Ouzzani, M.; Hammady, H.; Fedorowicz, Z.; Elmagarmid, A. Rayyan-a web and mobile app for systematic reviews. Syst. Rev. 2016, 5, 210. [Google Scholar] [CrossRef] [PubMed]
- Cashman, K.D.; Kiely, M.E.; Andersen, R.; Grønborg, I.M.; Madsen, K.H.; Nissen, J.; Tetens, I.; Tripkovic, L.; Lanham-New, S.A.; Toxqui, L.; et al. Individual participant data (IPD)-level meta-analysis of randomised controlled trials with vitamin D-fortified foods to estimate Dietary Reference Values for vitamin D. Eur. J. Nutr. 2021, 60, 939–959. [Google Scholar] [CrossRef]
- Luo, D.; Wan, X.; Liu, J.; Tong, T. Optimally estimating the sample mean from the sample size, median, mid-range, and/or mid-quartile range. Stat. Methods Med. Res. 2018, 27, 1785–1805. [Google Scholar] [CrossRef] [PubMed]
- Shi, J.; Luo, D.; Wan, X.; Liu, Y.; Liu, J.; Bian, Z.; Tong, T. Detecting the skewness of data from the sample size and the five-number summary. arXiv 2020, arXiv:2010.05749. [Google Scholar]
- Higgins, J.P.T.; Thomas, J.; Chandler, J.; Cumpston, M.; Li, T.; Page, M.J.; Welch, V.A. (Eds.) Cochrane Handbook for Systematic Reviews of Interventions Version 6.2 (Updated February 2021); Cochrane: London, UK, 2021; Available online: Training.cochrane.org/handbook (accessed on 19 January 2022).
- Cochrane. The Cochrane Collaboration Review Manager (RevMan) Computer Program] Version 5.4.1, 5.4; Cochrane: London, UK, 2020. [Google Scholar]
- OCEBM Levels of Evidence Working Group. The Oxford Levels of Evidence 2. Available online: https://www.cebm.ox.ac.uk/resources/levels-of-evidence/ocebm-levels-of-evidence (accessed on 2 February 2022).
- Lips, P.; Cashman, K.D.; Lamberg-Allardt, C.; Bischoff-Ferrari, H.A.; Obermayer-Pietsch, B.; Bianchi, M.L.; Stepan, J.; El-Hajj Fuleihan, G.; Bouillon, R. Current vitamin D status in European and Middle East countries and strategies to prevent vitamin D deficiency: A position statement of the European Calcified Tissue Society. Eur. J. Endocrinol. 2019, 180, P23–P54. [Google Scholar] [CrossRef]
- DerSimonian, R.; Laird, N. Meta-analysis in clinical trials. Control. Clin. Trials 1986, 7, 177–188. [Google Scholar] [CrossRef]
- Higgins, J.P.; Thompson, S.G.; Deeks, J.J.; Altman, D.G. Measuring inconsistency in meta-analyses. BMJ 2003, 327, 557–560. [Google Scholar] [CrossRef]
- JASP Team. JASP (Version 0.16.1) [Computer Software] 0.16.1. 2022. Available online: https://jasp-stats.org/ (accessed on 2 January 2022).
- Mo, M.; Wang, S.; Chen, Z.; Muyiduli, X.; Wang, S.; Shen, Y.; Shao, B.; Li, M.; Chen, D.; Chen, Z.; et al. A systematic review and meta-analysis of the response of serum 25-hydroxyvitamin D concentration to vitamin D supplementation from RCTs from around the globe. Eur. J. Clin. Nutr. 2019, 73, 816–834. [Google Scholar] [CrossRef]
- Soper, D.S. Standard Normal Distribution Z-Score Calculator. 2022. Available online: https://www.danielsoper.com/statcalc/ (accessed on 2 January 2022).
- Abramowitz, M.; Stegun, I.A. Handbook of Mathematical Functions with Formulas, Graphs, and Mathematical Tables, 9th ed.; Dover: New York, NY, USA, 1964. [Google Scholar]
- Agergaard, J.; Trostrup, J.; Uth, J.; Iversen, J.V.; Boesen, A.; Andersen, J.L.; Schjerling, P.; Langberg, H. Does vitamin-D intake during resistance training improve the skeletal muscle hypertrophic and strength response in young and elderly men?—A randomized controlled trial. Nutr. Metab. 2015, 12, 32. [Google Scholar] [CrossRef]
- Andersen, R.; Molgaard, C.; Skovgaard, L.T.; Brot, C.; Cashman, K.D.; Jakobsen, J.; Lamberg-Allardt, C.; Ovesen, L. Effect of vitamin D supplementation on bone and vitamin D status among Pakistani immigrants in Denmark: A randomised double-blinded placebo-controlled intervention study. Br. J. Nutr. 2008, 100, 197–207. [Google Scholar] [CrossRef]
- Bischoff-Ferrari, H.A.; Vellas, B.; Rizzoli, R.; Kressig, R.W.; da Silva, J.A.P.; Blauth, M.; Felson, D.T.; McCloskey, E.V.; Watzl, B.; Hofbauer, L.C.; et al. Effect of Vitamin D Supplementation, Omega-3 Fatty Acid Supplementation, or a Strength-Training Exercise Program on Clinical Outcomes in Older Adults: The DO-HEALTH Randomized Clinical Trial. JAMA 2020, 324, 1855–1868. [Google Scholar] [CrossRef]
- Bolton-Smith, C.; McMurdo, M.E.; Paterson, C.R.; Mole, P.A.; Harvey, J.M.; Fenton, S.T.; Prynne, C.J.; Mishra, G.D.; Shearer, M.J. Two-year randomized controlled trial of vitamin K1 (phylloquinone) and vitamin D3 plus calcium on the bone health of older women. J. Bone Miner. Res. 2007, 22, 509–519. [Google Scholar] [CrossRef]
- Brazier, M.; Grados, F.; Kamel, S.; Mathieu, M.; Morel, A.; Maamer, M.; Sebert, J.L.; Fardellone, P. Clinical and laboratory safety of one year’s use of a combination calcium + vitamin D tablet in ambulatory elderly women with vitamin D insufficiency: Results of a multicenter, randomized, double-blind, placebo-controlled study. Clin. Ther. 2005, 27, 1885–1893. [Google Scholar] [CrossRef]
- Cashman, K.D.; Hill, T.R.; Lucey, A.J.; Taylor, N.; Seamans, K.M.; Muldowney, S.; Fitzgerald, A.P.; Flynn, A.; Barnes, M.S.; Horigan, G.; et al. Estimation of the dietary requirement for vitamin D in healthy adults. Am. J. Clin. Nutr. 2008, 88, 1535–1542. [Google Scholar] [CrossRef]
- Cashman, K.D.; Wallace, J.M.; Horigan, G.; Hill, T.R.; Barnes, M.S.; Lucey, A.J.; Bonham, M.P.; Taylor, N.; Duffy, E.M.; Seamans, K.; et al. Estimation of the dietary requirement for vitamin D in free-living adults >=64 y of age. Am. J. Clin. Nutr. 2009, 89, 1366–1374. [Google Scholar] [CrossRef]
- Cashman, K.D.; Seamans, K.M.; Lucey, A.J.; Stöcklin, E.; Weber, P.; Kiely, M.; Hill, T.R. Relative effectiveness of oral 25-hydroxyvitamin D3 and vitamin D3 in raising wintertime serum 25-hydroxyvitamin D in older adults. Am. J. Clin. Nutr. 2012, 95, 1350–1356. [Google Scholar] [CrossRef] [PubMed]
- Cashman, K.D.; Hayes, A.; O’Donovan, S.M.; Zhang, J.Y.; Kinsella, M.; Galvin, K.; Kiely, M.; Seamans, K.M. Dietary calcium does not interact with vitamin D₃ in terms of determining the response and catabolism of serum 25-hydroxyvitamin D during winter in older adults. Am. J. Clin. Nutr. 2014, 99, 1414–1423. [Google Scholar] [CrossRef] [PubMed]
- Cefalo, C.M.A.; Conte, C.; Sorice, G.P.; Moffa, S.; Sun, V.A.; Cinti, F.; Salomone, E.; Muscogiuri, G.; Brocchi, A.A.G.; Pontecorvi, A.; et al. Effect of Vitamin D Supplementation on Obesity-Induced Insulin Resistance: A Double-Blind, Randomized, Placebo-Controlled Trial. Obesity 2018, 26, 651–657. [Google Scholar] [CrossRef] [PubMed]
- Chel, V.; Wijnhoven, H.A.; Smit, J.H.; Ooms, M.; Lips, P. Efficacy of different doses and time intervals of oral vitamin D supplementation with or without calcium in elderly nursing home residents. Osteoporos. Int. 2008, 19, 663–671. [Google Scholar] [CrossRef] [PubMed]
- Close, G.L.; Leckey, J.; Patterson, M.; Bradley, W.; Owens, D.J.; Fraser, W.D.; Morton, J.P. The effects of vitamin D(3) supplementation on serum total 25[OH]D concentration and physical performance: A randomised dose-response study. Br. J. Sports Med. 2013, 47, 692–696. [Google Scholar] [CrossRef] [PubMed]
- Goncalves-Mendes, N.; Talvas, J.; Duale, C.; Guttmann, A.; Corbin, V.; Marceau, G.; Sapin, V.; Brachet, P.; Evrard, B.; Laurichesse, H.; et al. Impact of Vitamin D Supplementation on Influenza Vaccine Response and Immune Functions in Deficient Elderly Persons: A Randomized Placebo-Controlled Trial. Front. Immunol. 2019, 10, 65. [Google Scholar] [CrossRef] [PubMed]
- Grimnes, G.; Figenschau, Y.; Almås, B.; Jorde, R. Vitamin D, insulin secretion, sensitivity, and lipids: Results from a case-control study and a randomized controlled trial using hyperglycemic clamp technique. Diabetes 2011, 60, 2748–2757. [Google Scholar] [CrossRef] [PubMed]
- He, C.S.; Fraser, W.D.; Tang, J.; Brown, K.; Renwick, S.; Rudland-Thomas, J.; Teah, J.; Tanqueray, E.; Gleeson, M. The effect of 14 weeks of vitamin D3 supplementation on antimicrobial peptides and proteins in athletes. J. Sports Sci. 2016, 34, 67–74. [Google Scholar] [CrossRef]
- Heikkinen, A.; Parviainen, M.T.; Tuppurainen, M.T.; Niskanen, L.; Komulainen, M.H.; Saarikoski, S. Effects of postmenopausal hormone replacement therapy with and without vitamin D3 on circulating levels of 25-hydroxyvitamin D and 1,25-dihydroxyvitamin D. Calcif. Tissue Int. 1998, 62, 26–30. [Google Scholar] [CrossRef]
- Holmlund-Suila, E.; Pekkinen, M.; Ivaska, K.K.; Andersson, S.; Makitie, O.; Viljakainen, H. Obese young adults exhibit lower total and lower free serum 25-hydroxycholecalciferol in a randomized vitamin D intervention. Clin. Endocrinol. 2016, 85, 378–385. [Google Scholar] [CrossRef]
- Itkonen, S.T.; Skaffari, E.; Saaristo, P.; Saarnio, E.M.; Erkkola, M.; Jakobsen, J.; Cashman, K.D.; Lamberg-Allardt, C. Effects of vitamin D2-fortified bread v. supplementation with vitamin D2 or D3 on serum 25-hydroxyvitamin D metabolites: An 8-week randomised-controlled trial in young adult Finnish women. Br. J. Nutr. 2016, 115, 1232–1239. [Google Scholar] [CrossRef]
- Jastrzebski, Z.; Kortas, J.; Kaczor, K.; Antosiewicz, J. Vitamin D Supplementation Causes a Decrease in Blood Cholesterol in Professional Rowers. J. Nutr. Sci. Vitaminol. 2016, 62, 88–92. [Google Scholar] [CrossRef]
- Kashi, D.S.; Oliver, S.J.; Wentz, L.M.; Roberts, R.; Carswell, A.T.; Tang, J.C.Y.; Jackson, S.; Izard, R.M.; Allan, D.; Rhodes, L.E.; et al. Vitamin D and the hepatitis B vaccine response: A prospective cohort study and a randomized, placebo-controlled oral vitamin D3 and simulated sunlight supplementation trial in healthy adults. Eur. J. Nutr. 2021, 60, 475–491. [Google Scholar] [CrossRef]
- Kasprowicz, K.; Ratkowski, W.; Wołyniec, W.; Kaczmarczyk, M.; Witek, K.; Żmijewski, P.; Renke, M.; Jastrzębski, Z.; Rosemann, T.; Nikolaidis, P.T.; et al. The Effect of Vitamin D(3) Supplementation on Hepcidin, Iron, and IL-6 Responses after a 100 km Ultra-Marathon. Int. J. Environ. Res. Public Health 2020, 17, 2962. [Google Scholar] [CrossRef]
- Kjaergaard, M.; Waterloo, K.; Wang, C.E.; Almas, B.; Figenschau, Y.; Hutchinson, M.S.; Svartberg, J.; Jorde, R. Effect of vitamin D supplement on depression scores in people with low levels of serum 25-hydroxyvitamin D: Nested case-control study and randomised clinical trial. Br. J. Psychiatry 2012, 201, 360–368. [Google Scholar] [CrossRef] [PubMed]
- Knutsen, K.V.; Madar, A.A.; Lagerløv, P.; Brekke, M.; Raastad, T.; Stene, L.C.; Meyer, H.E. Does vitamin D improve muscle strength in adults? A randomized, double-blind, placebo-controlled trial among ethnic minorities in Norway. J. Clin. Endocrinol. Metab. 2014, 99, 194–202. [Google Scholar] [CrossRef] [PubMed]
- Kubiak, J.; Thorsby, P.M.; Kamycheva, E.; Jorde, R. Vitamin D supplementation does not improve CVD risk factors in vitamin D-insufficient subjects. Endocr. Connect. 2018, 7, 840–849. [Google Scholar] [CrossRef] [PubMed]
- Kujach, S.; Lyzwinski, D.; Chroboczek, M.; Bialowas, D.; Antosiewicz, J.; Laskowski, R. The Effect of Vitamin D(3) Supplementation on Physical Capacity among Active College-Aged Males. Nutrients 2020, 12, 1936. [Google Scholar] [CrossRef]
- Laaksi, I.; Ruohola, J.P.; Mattila, V.; Auvinen, A.; Ylikomi, T.; Pihlajamäki, H. Vitamin D supplementation for the prevention of acute respiratory tract infection: A randomized, double-blinded trial among young Finnish men. J. Infect. Dis. 2010, 202, 809–814. [Google Scholar] [CrossRef]
- Lehmann, U.; Riedel, A.; Hirche, F.; Brandsch, C.; Girndt, M.; Ulrich, C.; Seibert, E.; Henning, C.; Glomb, M.A.; Dierkes, J.; et al. Vitamin D3 supplementation: Response and predictors of vitamin D3 metabolites—A randomized controlled trial. Clin. Nutr. 2016, 35, 351–358. [Google Scholar] [CrossRef]
- Lerchbaum, E.; Pilz, S.; Trummer, C.; Schwetz, V.; Pachernegg, O.; Heijboer, A.C.; Obermayer-Pietsch, B. Vitamin D and Testosterone in Healthy Men: A Randomized Controlled Trial. J. Clin. Endocrinol. Metab. 2017, 102, 4292–4302. [Google Scholar] [CrossRef]
- Lerchbaum, E.; Trummer, C.; Theiler-Schwetz, V.; Kollmann, M.; Wolfler, M.; Heijboer, A.C.; Pilz, S.; Obermayer-Pietsch, B. Effects of vitamin D supplementation on androgens in men with low testosterone levels: A randomized controlled trial. Eur. J. Nutr. 2019, 58, 3135–3146. [Google Scholar] [CrossRef]
- Lithgow, H.M.; Florida-James, G.; Leggate, M. The combined effect of high-intensity intermittent training and vitamin D supplementation on glycemic control in overweight and obese adults. Physiol. Rep. 2018, 6, e13684. [Google Scholar] [CrossRef]
- Maboshe, W.; Macdonald, H.M.; Wassall, H.; Fraser, W.D.; Tang, J.C.Y.; Fielding, S.; Barker, R.N.; Vickers, M.A.; Ormerod, A.; Thies, F. Low-Dose Vitamin D3 Supplementation Does Not Affect Natural Regulatory T Cell Population but Attenuates Seasonal Changes in T Cell-Produced IFN-gamma: Results From the D-SIRe2 Randomized Controlled Trial. Front. Immunol. 2021, 12, 623087. [Google Scholar] [CrossRef]
- Martineau, A.R.; Hanifa, Y.; Witt, K.D.; Barnes, N.C.; Hooper, R.L.; Patel, M.; Stevens, N.; Enayat, Z.; Balayah, Z.; Syed, A.; et al. Double-blind randomised controlled trial of vitamin D3 supplementation for the prevention of acute respiratory infection in older adults and their carers (ViDiFlu). Thorax 2015, 70, 953–960. [Google Scholar] [CrossRef] [PubMed]
- Mielgo-Ayuso, J.; Calleja-Gonzalez, J.; Urdampilleta, A.; Leon-Guereno, P.; Cordova, A.; Caballero-Garcia, A.; Fernandez-Lazaro, D. Effects of Vitamin D Supplementation on Haematological Values and Muscle Recovery in Elite Male Traditional Rowers. Nutrients 2018, 10, 1968. [Google Scholar] [CrossRef] [PubMed]
- Nygaard, B.; Frandsen, N.E.; Brandi, L.; Rasmussen, K.; Oestergaard, O.V.; Oedum, L.; Hoeck, H.C.; Hansen, D. Effects of high doses of cholecalciferol in normal subjects: A randomized double-blinded, placebo-controlled trial. PLoS ONE 2014, 9, e102965. [Google Scholar] [CrossRef]
- Ooms, M.E.; Roos, J.C.; Bezemer, P.D.; van der Vijgh, W.J.; Bouter, L.M.; Lips, P. Prevention of bone loss by vitamin D supplementation in elderly women: A randomized double-blind trial. J. Clin. Endocrinol. Metab. 1995, 80, 1052–1058. [Google Scholar] [CrossRef]
- Osmancevic, A.; Demeke, T.; Gillstedt, M.; Angesjo, E.; Sinclair, H.; Abd El-Gawad, G.; Landin-Wilhelmsen, K. Vitamin D treatment in Somali women living in Sweden—Two randomized, placebo-controlled studies. Clin. Endocrinol. 2016, 85, 535–543. [Google Scholar] [CrossRef]
- O’Sullivan, A.; Gibney, M.J.; Connor, A.O.; Mion, B.; Kaluskar, S.; Cashman, K.D.; Flynn, A.; Shanahan, F.; Brennan, L. Biochemical and metabolomic phenotyping in the identification of a vitamin D responsive metabotype for markers of the metabolic syndrome. Mol. Nutr. Food Res. 2011, 55, 679–690. [Google Scholar] [CrossRef]
- Prietl, B.; Treiber, G.; Mader, J.K.; Hoeller, E.; Wolf, M.; Pilz, S.; Graninger, W.B.; Obermayer-Pietsch, B.M.; Pieber, T.R. High-dose cholecalciferol supplementation significantly increases peripheral CD4⁺ Tregs in healthy adults without negatively affecting the frequency of other immune cells. Eur. J. Nutr. 2014, 53, 751–759. [Google Scholar] [CrossRef]
- Sneve, M.; Figenschau, Y.; Jorde, R. Supplementation with cholecalciferol does not result in weight reduction in overweight and obese subjects. Eur. J. Endocrinol. 2008, 159, 675–684. [Google Scholar] [CrossRef]
- Trummer, C.; Theiler-Schwetz, V.; Kollmann, M.; Wolfler, M.; Munzker, J.; Pilz, S.; Pieber, T.R.; Heijboer, A.C.; Obermayer-Pietsch, B.; Lerchbaum, E. Effects of vitamin D supplementation on metabolic and endocrine parameters in healthy premenopausal women: A randomized controlled trial. Clin. Nutr. 2020, 39, 718–726. [Google Scholar] [CrossRef]
- Urbain, P.; Singler, F.; Ihorst, G.; Biesalski, H.K.; Bertz, H. Bioavailability of vitamin D₂ from UV-B-irradiated button mushrooms in healthy adults deficient in serum 25-hydroxyvitamin D: A randomized controlled trial. Eur. J. Clin. Nutr. 2011, 65, 965–971. [Google Scholar] [CrossRef]
- Vaes, A.M.M.; Tieland, M.; Toussaint, N.; Nilwik, R.; Verdijk, L.B.; van Loon, L.J.C.; de Groot, L. Cholecalciferol or 25-Hydroxycholecalciferol Supplementation Does Not Affect Muscle Strength and Physical Performance in Prefrail and Frail Older Adults. J. Nutr. 2018, 148, 712–720. [Google Scholar] [CrossRef] [PubMed]
- Välimäki, V.V.; Löyttyniemi, E.; Pekkarinen, T.; Välimäki, M.J. How well are the optimal serum 25OHD concentrations reached in high-dose intermittent vitamin D therapy? A placebo-controlled study on comparison between 100000 IU and 200000 IU of oral D3 every 3 months in elderly women. Clin. Endocrinol. 2016, 84, 837–844. [Google Scholar] [CrossRef] [PubMed]
- Viljakainen, H.T.; Vaisanen, M.; Kemi, V.; Rikkonen, T.; Kroger, H.; Laitinen, E.K.; Rita, H.; Lamberg-Allardt, C. Wintertime vitamin D supplementation inhibits seasonal variation of calcitropic hormones and maintains bone turnover in healthy men. J. Bone Miner. Res. 2009, 24, 346–352. [Google Scholar] [CrossRef] [PubMed]
- Wamberg, L.; Kampmann, U.; Stodkilde-Jorgensen, H.; Rejnmark, L.; Pedersen, S.B.; Richelsen, B. Effects of vitamin D supplementation on body fat accumulation, inflammation, and metabolic risk factors in obese adults with low vitamin D levels—results from a randomized trial. Eur. J. Intern. Med. 2013, 24, 644–649. [Google Scholar] [CrossRef]
- Wood, A.D.; Secombes, K.R.; Thies, F.; Aucott, L.; Black, A.J.; Mavroeidi, A.; Simpson, W.G.; Fraser, W.D.; Reid, D.M.; Macdonald, H.M. Vitamin D3 supplementation has no effect on conventional cardiovascular risk factors: A parallel-group, double-blind, placebo-controlled RCT. J. Clin. Endocrinol. Metab. 2012, 97, 3557–3568. [Google Scholar] [CrossRef]
- Wyon, M.A.; Wolman, R.; Nevill, A.M.; Cloak, R.; Metsios, G.S.; Gould, D.; Ingham, A.; Koutedakis, Y. Acute Effects of Vitamin D3 Supplementation on Muscle Strength in Judoka Athletes: A Randomized Placebo-Controlled, Double-Blind Trial. Clin. J. Sport Med. 2016, 26, 279–284. [Google Scholar] [CrossRef]
- Wyon, M.A.; Wolman, R.; Martin, C.; Galloway, S. The efficacy of different vitamin D supplementation delivery methods on serum 25(OH)D: A randomised double-blind placebo trial. Clin. Nutr. 2021, 40, 388–393. [Google Scholar] [CrossRef]
- Zittermann, A.; Frisch, S.; Berthold, H.K.; Gotting, C.; Kuhn, J.; Kleesiek, K.; Stehle, P.; Koertke, H.; Koerfer, R. Vitamin D supplementation enhances the beneficial effects of weight loss on cardiovascular disease risk markers. Am. J. Clin. Nutr. 2009, 89, 1321–1327. [Google Scholar] [CrossRef]
- Higgins, J.P.; Altman, D.G.; Gotzsche, P.C.; Juni, P.; Moher, D.; Oxman, A.D.; Savovic, J.; Schulz, K.F.; Weeks, L.; Sterne, J.A.; et al. The Cochrane Collaboration’s tool for assessing risk of bias in randomised trials. BMJ 2011, 343, d5928. [Google Scholar] [CrossRef]
- Schleicher, R.L.; Sternberg, M.R.; Looker, A.C.; Yetley, E.A.; Lacher, D.A.; Sempos, C.T.; Taylor, C.L.; Durazo-Arvizu, R.A.; Maw, K.L.; Chaudhary-Webb, M.; et al. National Estimates of Serum Total 25-Hydroxyvitamin D and Metabolite Concentrations Measured by Liquid Chromatography-Tandem Mass Spectrometry in the US Population during 2007–2010. J. Nutr. 2016, 146, 1051–1061. [Google Scholar] [CrossRef]
- Sarafin, K.; Durazo-Arvizu, R.; Tian, L.; Phinney, K.W.; Tai, S.; Camara, J.E.; Merkel, J.; Green, E.; Sempos, C.T.; Brooks, S.P. Standardizing 25-hydroxyvitamin D values from the Canadian Health Measures Survey. Am. J. Clin. Nutr. 2015, 102, 1044–1050. [Google Scholar] [CrossRef] [PubMed]
- van Schoor, N.M.; Lips, P. Worldwide vitamin D status. Best Pract. Res. Clin. Endocrinol. Metab. 2011, 25, 671–680. [Google Scholar] [CrossRef] [PubMed]
- Frost, P. The Problem of Vitamin D Scarcity: Cultural and Genetic Solutions by Indigenous Arctic and Tropical Peoples. Nutrients 2022, 14, 4071. [Google Scholar] [CrossRef]
- Holick, M.F.; Binkley, N.C.; Bischoff-Ferrari, H.A.; Gordon, C.M.; Hanley, D.A.; Heaney, R.P.; Murad, M.H.; Weaver, C.M.; Endocrine, S. Evaluation, treatment, and prevention of vitamin D deficiency: An Endocrine Society clinical practice guideline. J. Clin. Endocrinol. Metab. 2011, 96, 1911–1930. [Google Scholar] [CrossRef] [PubMed]
- Allen, L.; de Benoist, B.; Dary, O.; Hurrell, R. Guidelines on Food Fortification with Micronutrients. Available online: http://apps.who.int/iris/bitstream/10665/43412/1/9241594012_eng.pdf (accessed on 26 July 2022).
- Cashman, K.D. Vitamin D Deficiency: Defining, Prevalence, Causes, and Strategies of Addressing. Calcif. Tissue Int. 2020, 106, 14–29. [Google Scholar] [CrossRef] [PubMed]
- Aloia, J.F.; Patel, M.; Dimaano, R.; Li-Ng, M.; Talwar, S.A.; Mikhail, M.; Pollack, S.; Yeh, J.K. Vitamin D intake to attain a desired serum 25-hydroxyvitamin D concentration. Am. J. Clin. Nutr. 2008, 87, 1952–1958. [Google Scholar] [CrossRef]
- Institute of Medicine Committee on Strategies to Reduce Sodium Intake. The National Academies Collection: Reports funded by National Institutes of Health. In Dietary Reference Intakes for Calcium and Vitamin D; Ross, A.C., Taylor, C.L., Yaktine, A.L., Del Valle, H.B., Eds.; National Academies Press: Washington, DC, USA, 2011. [Google Scholar]
- Heaney, R.P.; Davies, K.M.; Chen, T.C.; Holick, M.F.; Barger-Lux, M.J. Human serum 25-hydroxycholecalciferol response to extended oral dosing with cholecalciferol. Am. J. Clin. Nutr. 2003, 77, 204–210. [Google Scholar] [CrossRef]
- McKenna, M.J.; Murray, B.F. Vitamin D dose response is underestimated by Endocrine Society’s Clinical Practice Guideline. Endocr. Connect. 2013, 2, 87–95. [Google Scholar] [CrossRef]
- Whiting, S.J.; Bonjour, J.P.; Payen, F.D.; Rousseau, B. Moderate amounts of vitamin D3 in supplements are effective in raising serum 25-hydroxyvitamin D from low baseline levels in adults: A systematic review. Nutrients 2015, 7, 2311–2323. [Google Scholar] [CrossRef]
- Barger-Lux, M.J.; Heaney, R.P.; Dowell, S.; Chen, T.C.; Holick, M.F. Vitamin D and its major metabolites: Serum levels after graded oral dosing in healthy men. Osteoporos. Int. 1998, 8, 222–230. [Google Scholar] [CrossRef]
- Lips, P.; de Jongh, R.T. Vitamin D deficiency in immigrants. Bone Rep. 2018, 9, 37–41. [Google Scholar] [CrossRef]
- van der Wielen, R.P.; Lowik, M.R.; van den Berg, H.; de Groot, L.C.; Haller, J.; Moreiras, O.; van Staveren, W.A. Serum vitamin D concentrations among elderly people in Europe. Lancet 1995, 346, 207–210. [Google Scholar] [CrossRef]
- Prentice, A. Vitamin D deficiency: A global perspective. Nutr. Rev. 2008, 66, S153–S164. [Google Scholar] [CrossRef]
- Cashman, K.D.; Ritz, C.; Kiely, M.; Odin, C. Improved Dietary Guidelines for Vitamin D: Application of Individual Participant Data (IPD)-Level Meta-Regression Analyses. Nutrients 2017, 9, 469. [Google Scholar] [CrossRef]
- Pilz, S.; Marz, W.; Cashman, K.D.; Kiely, M.E.; Whiting, S.J.; Holick, M.F.; Grant, W.B.; Pludowski, P.; Hiligsmann, M.; Trummer, C.; et al. Rationale and Plan for Vitamin D Food Fortification: A Review and Guidance Paper. Front. Endocrinol. 2018, 9, 373. [Google Scholar] [CrossRef] [PubMed]
- Holick, M.F. Vitamin D deficiency. N. Engl. J. Med. 2007, 357, 266–281. [Google Scholar] [CrossRef] [PubMed]
- Marcinowska-Suchowierska, E.; Kupisz-Urbanska, M.; Lukaszkiewicz, J.; Pludowski, P.; Jones, G. Vitamin D Toxicity-A Clinical Perspective. Front. Endocrinol. 2018, 9, 550. [Google Scholar] [CrossRef]
- Ozarda, Y.; Sikaris, K.; Streichert, T.; Macri, J.; IFCC Committee on Reference intervals and Decision Limits. Distinguishing reference intervals and clinical decision limits—A review by the IFCC Committee on Reference Intervals and Decision Limits. Crit. Rev. Clin. Lab. Sci. 2018, 55, 420–431. [Google Scholar] [CrossRef]
- Amrein, K.; Scherkl, M.; Hoffmann, M.; Neuwersch-Sommeregger, S.; Köstenberger, M.; Tmava Berisha, A.; Martucci, G.; Pilz, S.; Malle, O. Vitamin D deficiency 2.0: An update on the current status worldwide. Eur. J. Clin. Nutr. 2020, 74, 1498–1513. [Google Scholar] [CrossRef]
- EFSA Panel on Dietetic Products, N.a.A.N. Scientific opinion on the tolerable upper intake level of vitamin D. EFSA J. 2012, 10, 2813. [Google Scholar] [CrossRef]
- Vieth, R. Vitamin D supplementation, 25-hydroxyvitamin D concentrations, and safety. Am. J. Clin. Nutr. 1999, 69, 842–856. [Google Scholar] [CrossRef] [PubMed]
- Vieth, R. Critique of the considerations for establishing the tolerable upper intake level for vitamin D: Critical need for revision upwards. J. Nutr. 2006, 136, 1117–1122. [Google Scholar] [CrossRef] [PubMed]


| First Author and Year | Type of Vitamin D | Average Dose μg/Day | Blinding | Country | Degrees North Latitude | Age Category | Duration of Intervention | Season | ITT (N) | Oxford Level of Evidence |
|---|---|---|---|---|---|---|---|---|---|---|
| Agergaard 2015 [26] | D3 | 48 | Double-blind | Denmark | ≥55° N to 70° N | 18–59 and ≥60 | 16 Weeks | Nov–Apr | 34 | 2 |
| Andersen 2008 [27] | D3 | 10/20 | Double-blind | Denmark | ≥55° N to 70° N | 18–59 | 52 Weeks | Jan–Nov | 173 | 3 |
| Bischoff-Ferrari 2020 [28] | D3 | 50 | Double-blind | Switzerland, France, Portugal, Germany, Austria | ≥46° N to <55° N | ≥60 | 156 Weeks | n.a. | 2157 | 2 |
| Bolton-Smith 2007 [29] | D3 | 10 | Double-blind | Great Britain | ≥55° N to 70° N | ≥60 | 104 Weeks | n.a. | 123 | 2 |
| Brazier 2005 [30] | D3 | 10 | Double-blind | France | 36° N to <46° N | ≥60 | 52 Weeks | n.a. | 192 | 3 |
| Cashman 2008 [31] | D3 | 5/10/15 | Double-blind | Ireland/Great Britain | ≥46° N to <55° N | 18–59 | 22 Weeks | Oct–Apr | 245 | 2 |
| Cashman 2009 [32] | D3 | 5/10/15 | Double-blind | Ireland | ≥55° N to 70° N | ≥60 | 22 Weeks | Oct–Mar | 216 | 2 |
| Cashman 2012 [33] | 25(OH)D3/D3 | 7/20/20 | Double-blind | Ireland | ≥46° N to <55° N | 18–59 | 10 Weeks | Jan–Apr | 58 | 2 |
| Cashman 2014 [34] | D3 | 20 | Double-blind | Ireland | ≥46° N to <55° N | 18–59 | 15 Weeks | Nov–Mar | 125 | 2 |
| Cefalo 2018 [35] | D3 | 89.3 | Double-blind | Italy | 36° N to <46° N | 18–59 | 13 Weeks | n.a. | 18 | 3 |
| Chel 2008 [36] | D3 | 15 | Open | Netherlands | ≥46° N to <55° N | ≥60 | 17 Weeks | n.a. | 338 | 3 |
| Close 2013 [37] | D3 | 71.4/142.9 | Double-blind | Great Britain | ≥46° N to <55° N | 18–59 | 12 Weeks | Jan–Apr | 30 | 3 |
| Goncalves-Mendes 2019 [38] | D3 | 166.67 | Double-blind | France | ≥46° N to <55° N | ≥60 | 13 Months | Jun–Oct | 40 | 3 |
| Grimnes 2011 [39] | D3 | 142.86 | Double-blind | Norway | ≥55° N to 70° N | 18–59 | 26 Weeks | n.a. | 104 | 2 |
| He 2016 [40] | D3 | 125 | Double-blind | Great Britain | ≥46° N to <55° N | 18–59 | 14 Weeks | n.a. | 39 | 3 |
| Heikkinen 1998 [41] | D3 | 7.5 | Open | Norway | ≥55° N to 70° N | 18–59 | 52 Weeks | n.a. | 35 | 3 |
| Holmlund-Suila 2016 [42] | D3 | 50 | Double-blind | Finland | ≥55° N to 70° N | 18–59 | 12 Weeks | Nov–May | 42 | 3 |
| Itkonen 2016 [43] | D2/D3 | 25/25 | Double-blind | Finland | ≥55° N to 70° N | 18–59 | 8 Weeks | Feb–Apr | 31 | 3 |
| Jastrzebski 2016 [44] | D3 | 125 | Double-blind | Poland | ≥46° N to <55° N | 18–59 | 4 Weeks | Mar–Apr | 16 | 3 |
| Kashi 2021 [45] | D3 | 16.75 | Double-blind | Great Britain | ≥55° N to 70° N | 18–59 | 12 Weeks | n.a. | 61 | 3 |
| Kasprowicz 2020 [46] | D3 | 250 | Double-blind | Poland | ≥46° N to <55° N | 18–59 | 2 Weeks | Autumn | 20 | 3 |
| Kjaergaard 2012 [47] | D3 | 142.86 | Double-blind | Norway | ≥55° N to 70° N | 18–59 | 26 Weeks | n.a. | 230 | 2 |
| Knutsen 2014 [48] | D3 | 10/25 | Double-blind | Norway | ≥55° N to 70° N | 18–59 | 16 Weeks | Jan–Jun | 251 | 2 |
| Kubiak 2018 [49] | D3 | 91.98 | Double-blind | Norway | ≥55° N to 70° N | 18–59 | 17 Weeks | n.a. | 411 | 2 |
| Kujach 2020 * [50] | D3 | 150 | Single-blinded | Polen | ≥46° N to <55° N | 18–59 | 8 Weeks | Jan–Mar | 28 | 3 |
| Laaksi 2010 [51] | D3 | 10 | Double-blind | Finland | ≥55° N to 70° N | 18–59 | 26 Weeks | Oct–Mar | 164 | 3 |
| Lehmann 2015 [52] | D3 | 20 | Double-blind | Germany | ≥46° N to <55° N | 18–59 | 12 Weeks | Jan–Apr | 106 | 2 |
| Lerchbaum 2017 [53] | D3 | 71.43 | Double-blind | Austria | ≥46° N to <55° N | 18–59 | 12 Weeks | n.a. | 100 | 2 |
| Lerchbaum 2019 [54] | D3 | 71.43 | Double-blind | Austria | ≥46° N to <55° N | 18–59 | 12 Weeks | n.a. | 100 | 2 |
| Lithgow 2018 [55] | D3 | 100 | Double-blind | Great Britain | ≥55° N to 70° N | 18–59 | 6 Weeks | Oct–Jun | 20 | 2 |
| Maboshe 2021 [56] | D3 | 10 | Double-blind | Great Britain | ≥55° N to 70° N | 18–59 | 43 Weeks | Mar–Jan | 59 | 2 |
| Martineau 2015 [57] | D3 | 50 | Double-blind | Great Britain | ≥46° N to <55° N | ≥60 | 52 Weeks | n.a. | 240 | 2 |
| Mielgo-Ayuso 2018 [58] | D3 | 75 | Double-blind | Spain | 36° N to <46° N | 18–59 | 8 Weeks | Apr–Jun | 36 | 2 |
| Nygaard 2014 [59] | D3 | 75 | Double-blind | Denmark | ≥55° N to 70° N | 18–59 | 16 Weeks | Dez–Apr | 50 | 2 |
| Ooms 1995 [60] | D3 | 10 | Double-blind | Netherlands | ≥46° N to <55° N | ≥60 | 52 Weeks | n.a. | 348 | 3 |
| Osmancevic 2016 [61] | D3 | 20/40 | Double-blind | Sweden | ≥55° N to 70° N | 18–59 | 12 Weeks | n.a. | 114 | 3 |
| O’Sullivan 2011 [62] | D3 | 15 | Double-blind | Ireland | ≥46° N to <55° N | 18–59 | 4 Weeks | n.a. | 126 | 2 |
| Prietl 2014 [63] | D3 | 115.07 | Double-blind | Austria | ≥46° N to <55° N | 18–59 | 13 Weeks | n.a. | 60 | 2 |
| Sneve 2008 [64] | D3 | 71.4/142.9 | Double-blind | Norway | ≥55° N to 70° N | 18–59 | 52 Weeks | n.a. | 445 | 3 |
| Trummer 2020 [65] | D3 | 71.43 | Double-blind | Austria | ≥46° N to <55° N | 18–59 | 24 Weeks | n.a. | 150 | 2 |
| Urbain 2011 [66] | D3 | 100 | Single-blinded | Germany | ≥46° N to <55° N | 18–59 | 5 Weeks | Jan–Mar | 18 | 3 |
| Vaes 2018 [67] | 25(OH)D3/D3 | 10/20 | Double-blind | Netherlands | ≥46° N to <55° N | ≥60 | 26 Weeks | Dez–Dez | 78 | 2 |
| Välimäki 2016 [68] | D3 | 27.4/54.8 | Open | Finland | ≥55° N to 70° N | ≥60 | 52 Weeks | Mar–Mar | 60 | 3 |
| Viljakainen 2009 [69] | D3 | 10/20 | Double-blind | Finland | ≥55° N to 70° N | 18–59 | 26 Weeks | Nov–Apr | 48 | 3 |
| Wamberg 2013 [70] | D3 | 175 | Double-blind | Denmark | ≥55° N to 70° N | 18–59 | 26 Weeks | n.a. | 52 | 3 |
| Wood 2012 [71] | D3 | 10/25 | Double-blind | Great Britain | ≥55° N to 70° N | ≥60 | 52 Weeks | Jan–Jan | 305 | 2 |
| Wyon 2016 [72] | D3 | 535.7 | Double-blind | Great Britain | ≥46° N to <55° N | 18–59 | 1 Week | Jan | 22 | 2 |
| Wyon 2021 [73] | D3 | 89.29 | Double-blind | Great Britain | ≥46° N to <55° N | 18–59 | 4 Weeks | Mar | 40 | 2 |
| Zittermann 2009 [74] | D3 | 83.3 | Double-blind | Germany | ≥46° N to <55° N | 18–59 | 52 Weeks | n.a. | 200 | 2 |
| Baseline Characteristics of Subjects from Overall Study Population (49 Studies with 73 Study Arms) | ||
|---|---|---|
| Vitamin D | Placebo | |
| Participants, N | 3974 | 3346 |
| Mean age (range) in years | 59.2 (20–84) | 59.6 (20–84) |
| Percentage women vs. men | 61 vs. 39% | |
| Mean duration of intervention (range) in days Unweighted mean duration of intervention (range) in days | 452.4 (7–1095) 183.9 (7–1095) | |
| Mean baseline 25(OH)D (range) in nmol/L | 47.04 (10–79) | 47.4 (13–80) |
| Mean daily dose (range) in μg | 51.8 (5–536) | 51.8 (5–536) |
| Age in Years | Dose Category | Baseline 25(OH)D Category | Study Arms, N | Dose, μg/Day * | Vitamin D Group, N | Baseline 25(OH)D, nmol/L * | Weighted Mean Difference in nmol/L (95% CI) | Serum Increment in nmol/L per 2.5 μg/Day Vit.D. ƚ | p-Value of Serum Increment |
|---|---|---|---|---|---|---|---|---|---|
| 18–59 | <38 μg/day (A) | 25 | 15.23 | 810 | 43.79 | 27.53 (22.99, 32.07) | 3.31 | A vs. B p = 0.037 | |
| ≥38–<75 μg/day (B) | 9 | 63.21 | 332 | 50.75 | 32.44 (27.29, 37.58) | 1.49 | B vs. C p = 0.039 | ||
| ≥75 μg/day (C) | 20 | 142.90 | 782 | 43.57 | 51.63 (37.53, 65.74) | 0.91 | A vs. C p = 0.001 | ||
| <50 nmol/L | 31 | 75.86 | 1035 | 33.05 | 39.00 (29.84, 48.17) | 1.35 | p = 0.035 | ||
| ≥50 nmol/L | 23 | 60.65 | 889 | 61.05 | 34.69 (27.70, 41.68) | 1.07 | |||
| ≥60 | <38 μg/day | 14 | 13.94 | 813 | 37.90 | 33.92 (29.18, 38.67) | 5.68 | p = 0.018 | |
| ≥38–<75 μg/day | 4 | 50.54 | 1218 | 57.54 | 29.00 (19.21, 38.79) | 1.63 | |||
| ≥75 μg/day | 1 | 166.67 | 19 | 51.75 | - | 0.89 | |||
| <50 nmol/L | 10 | 17.84 | 713 | 29.50 | 37.66 (33.12, 42.20) | 5.77 | p < 0.001 | ||
| ≥50 nmol/L | 9 | 41.54 | 1337 | 59.27 | 29.41 (21.88, 36.94) | 1.35 |
| Age in Years | Dose Category | Subgroup | Study Arms, N | Dose, μg/Day * | Vitamin D Group, N | Baseline 25(OH)D, nmol/L * | Weighted Mean Difference in nmol/L (95% CI) | Serum Increment in nmol/L per 2.5 μg/Day Vit.D. ƚ |
|---|---|---|---|---|---|---|---|---|
| 18–59 | All doses | Women | 10 | 38.75 | 202 | 33.31 | 22.36 (13.65, 31.08) | 1.41 |
| ≥60 | All doses | Women | 3 | 10.00 | 286 | 35.77 | 36.46 (26.91, 46.01) | 8.42 |
| 18–59 | <38 μg/day | Women | 6 | 16.50 | 90 | 29.84 | 21.51 (12.21, 30.82) | 3.09 |
| ≥60 | <38 μg/day | Women | 3 | 10 | 286 | 35.77 | 36.46 (26.91, 46.01) | 8.42 |
| Age in Years | Dose Category | Subgroup | Study Arms, N | Dose, μg/Day * | Vitamin D Group, N | Baseline 25(OH)D, nmol/L * | Weighted Mean Difference in nmol/L (95% CI) | Serum Increment in nmol/L per 2.5 μg/Day Vit.D. ƚ |
|---|---|---|---|---|---|---|---|---|
| 18–59 | All doses | Ethnic minorities <50 nmol/L baseline | 8 | 17.43 | 266 | 20.11 | 27.62 (22.35, 32.89) | 3.65 |
| Northern population <50 nmol/L baseline | 11 | 78.26 | 520 | 37.60 | 46.94 (28.74, 65.14) | 1.69 | ||
| <38 μg/day | Ethnic minorities <50 nmol/L baseline | 7 | 16.05 | 254 | 19.90 | 27.11 (21.60, 32.61) | 4.01 | |
| Northern population <50 nmol/L baseline | 3 | 11.38 | 75 | 32.42 | 18.36 (4.86, 31.86) | 5.73 |
| Age in Years | Dose Category | Subgroup | Study Arms, N | Dose, μg/Day * | Vitamin D Group, N | Baseline 25(OH)D, nmol/L * | Weighted Mean Difference in nmol/L (95% CI) | Serum Increment in nmol/L per 2.5 μg/Day Vit.D. ƚ |
|---|---|---|---|---|---|---|---|---|
| 18–59 | <38 µg/day | Men | 6 | 14.27 | 167 | 43.37 | 23.61 (14.06, 33.15) | 3.44 |
| Women | 6 | 16.37 | 90 | 29.42 | 21.51 (12.21, 30.82) | 3.14 | ||
| ≥38–<75 µg/day | Men | 4 | 63.34 | 113 | 50.30 | 32.78 (23.95, 41.61) | 1.53 | |
| Women | 2 | 61.66 | 94 | 45.83 | 29.83 (21.58, 38.08) | 1.36 | ||
| ≥75 µg/day | Men | 7 | 204.10 | 87 | 53.55 | 46.55 (15.54, 77.55) | 0.53 | |
| Women | 2 | 89.29 | 18 | 32.78 | 20.72 (−17.11, 58.56) | 0.58 |
| Subgroup (Study Arms, N) | Vitamin D Recommendation in μg/Day (IU/Day) for 95% of the Population to Reach/Maintain 50 nmol/L a | Vitamin D Recommendation in μg/Day (IU/Day) for 95% of the Population to Reach/Maintain 75 nmol/L b |
|---|---|---|
| Overall (n = 73) | 24.90 (995.94) | 57.26 (2290.48) |
| 18–59 year (n = 54) | 35.91 (1436.25) | 64.39 (2575.69) |
| ≥60 year (n = 19) | 15.49 (619.77) | 27.63 (1105.11) |
Disclaimer/Publisher’s Note: The statements, opinions and data contained in all publications are solely those of the individual author(s) and contributor(s) and not of MDPI and/or the editor(s). MDPI and/or the editor(s) disclaim responsibility for any injury to people or property resulting from any ideas, methods, instructions or products referred to in the content. |
© 2023 by the authors. Licensee MDPI, Basel, Switzerland. This article is an open access article distributed under the terms and conditions of the Creative Commons Attribution (CC BY) license (https://creativecommons.org/licenses/by/4.0/).
Share and Cite
Rupprecht, M.; Wagenpfeil, S.; Schöpe, J.; Vieth, R.; Vogt, T.; Reichrath, J. Meta-Analysis of European Clinical Trials Characterizing the Healthy-Adult Serum 25-hydroxyvitamin D Response to Vitamin D Supplementation. Nutrients 2023, 15, 3986. https://doi.org/10.3390/nu15183986
Rupprecht M, Wagenpfeil S, Schöpe J, Vieth R, Vogt T, Reichrath J. Meta-Analysis of European Clinical Trials Characterizing the Healthy-Adult Serum 25-hydroxyvitamin D Response to Vitamin D Supplementation. Nutrients. 2023; 15(18):3986. https://doi.org/10.3390/nu15183986
Chicago/Turabian StyleRupprecht, Manuel, Stefan Wagenpfeil, Jakob Schöpe, Reinhold Vieth, Thomas Vogt, and Jörg Reichrath. 2023. "Meta-Analysis of European Clinical Trials Characterizing the Healthy-Adult Serum 25-hydroxyvitamin D Response to Vitamin D Supplementation" Nutrients 15, no. 18: 3986. https://doi.org/10.3390/nu15183986
APA StyleRupprecht, M., Wagenpfeil, S., Schöpe, J., Vieth, R., Vogt, T., & Reichrath, J. (2023). Meta-Analysis of European Clinical Trials Characterizing the Healthy-Adult Serum 25-hydroxyvitamin D Response to Vitamin D Supplementation. Nutrients, 15(18), 3986. https://doi.org/10.3390/nu15183986