A High-Phosphorus Diet Moderately Alters the Lipidome and Transcriptome in the Skeletal Muscle of Adult Mice
Abstract
1. Introduction
2. Materials and Methods
2.1. Animals and Diets
2.2. Sample Collection
2.3. Determination of the Apparent Total Tract Digestibility of Nutrients and Energy
2.4. Determination of the Plasma Concentrations of Calcium and Inorganic Phosphate
2.5. Determination of the Concentrations of the Major Lipid Classes and Individual Phospholipid Species by Means of Lipidomics
2.6. Extratction of Total RNA
2.7. Microarray and Bioinformatic Analysis
2.8. qPCR Analysis to Validate Microarray Data and Assess mRNA Abundance
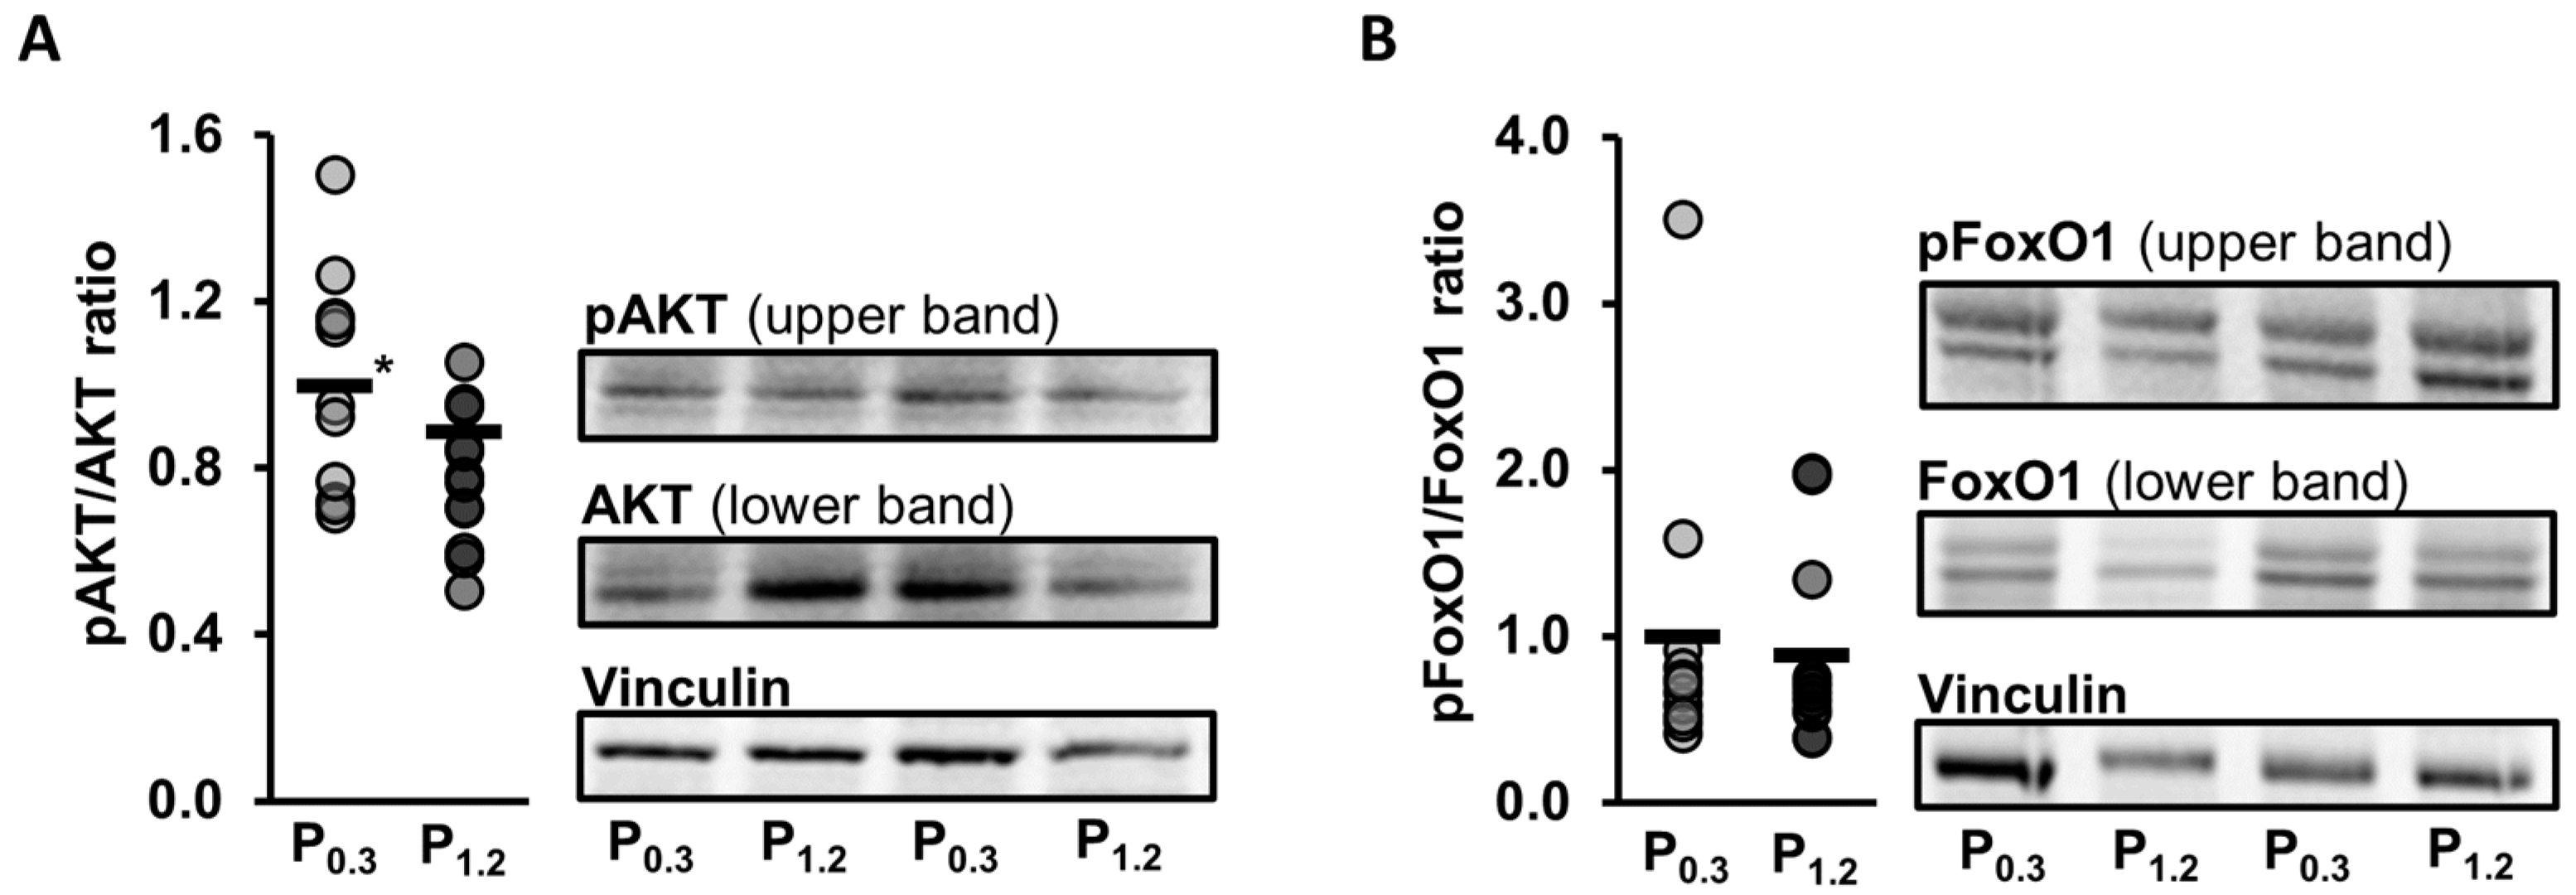
2.9. Western Blot Analysis
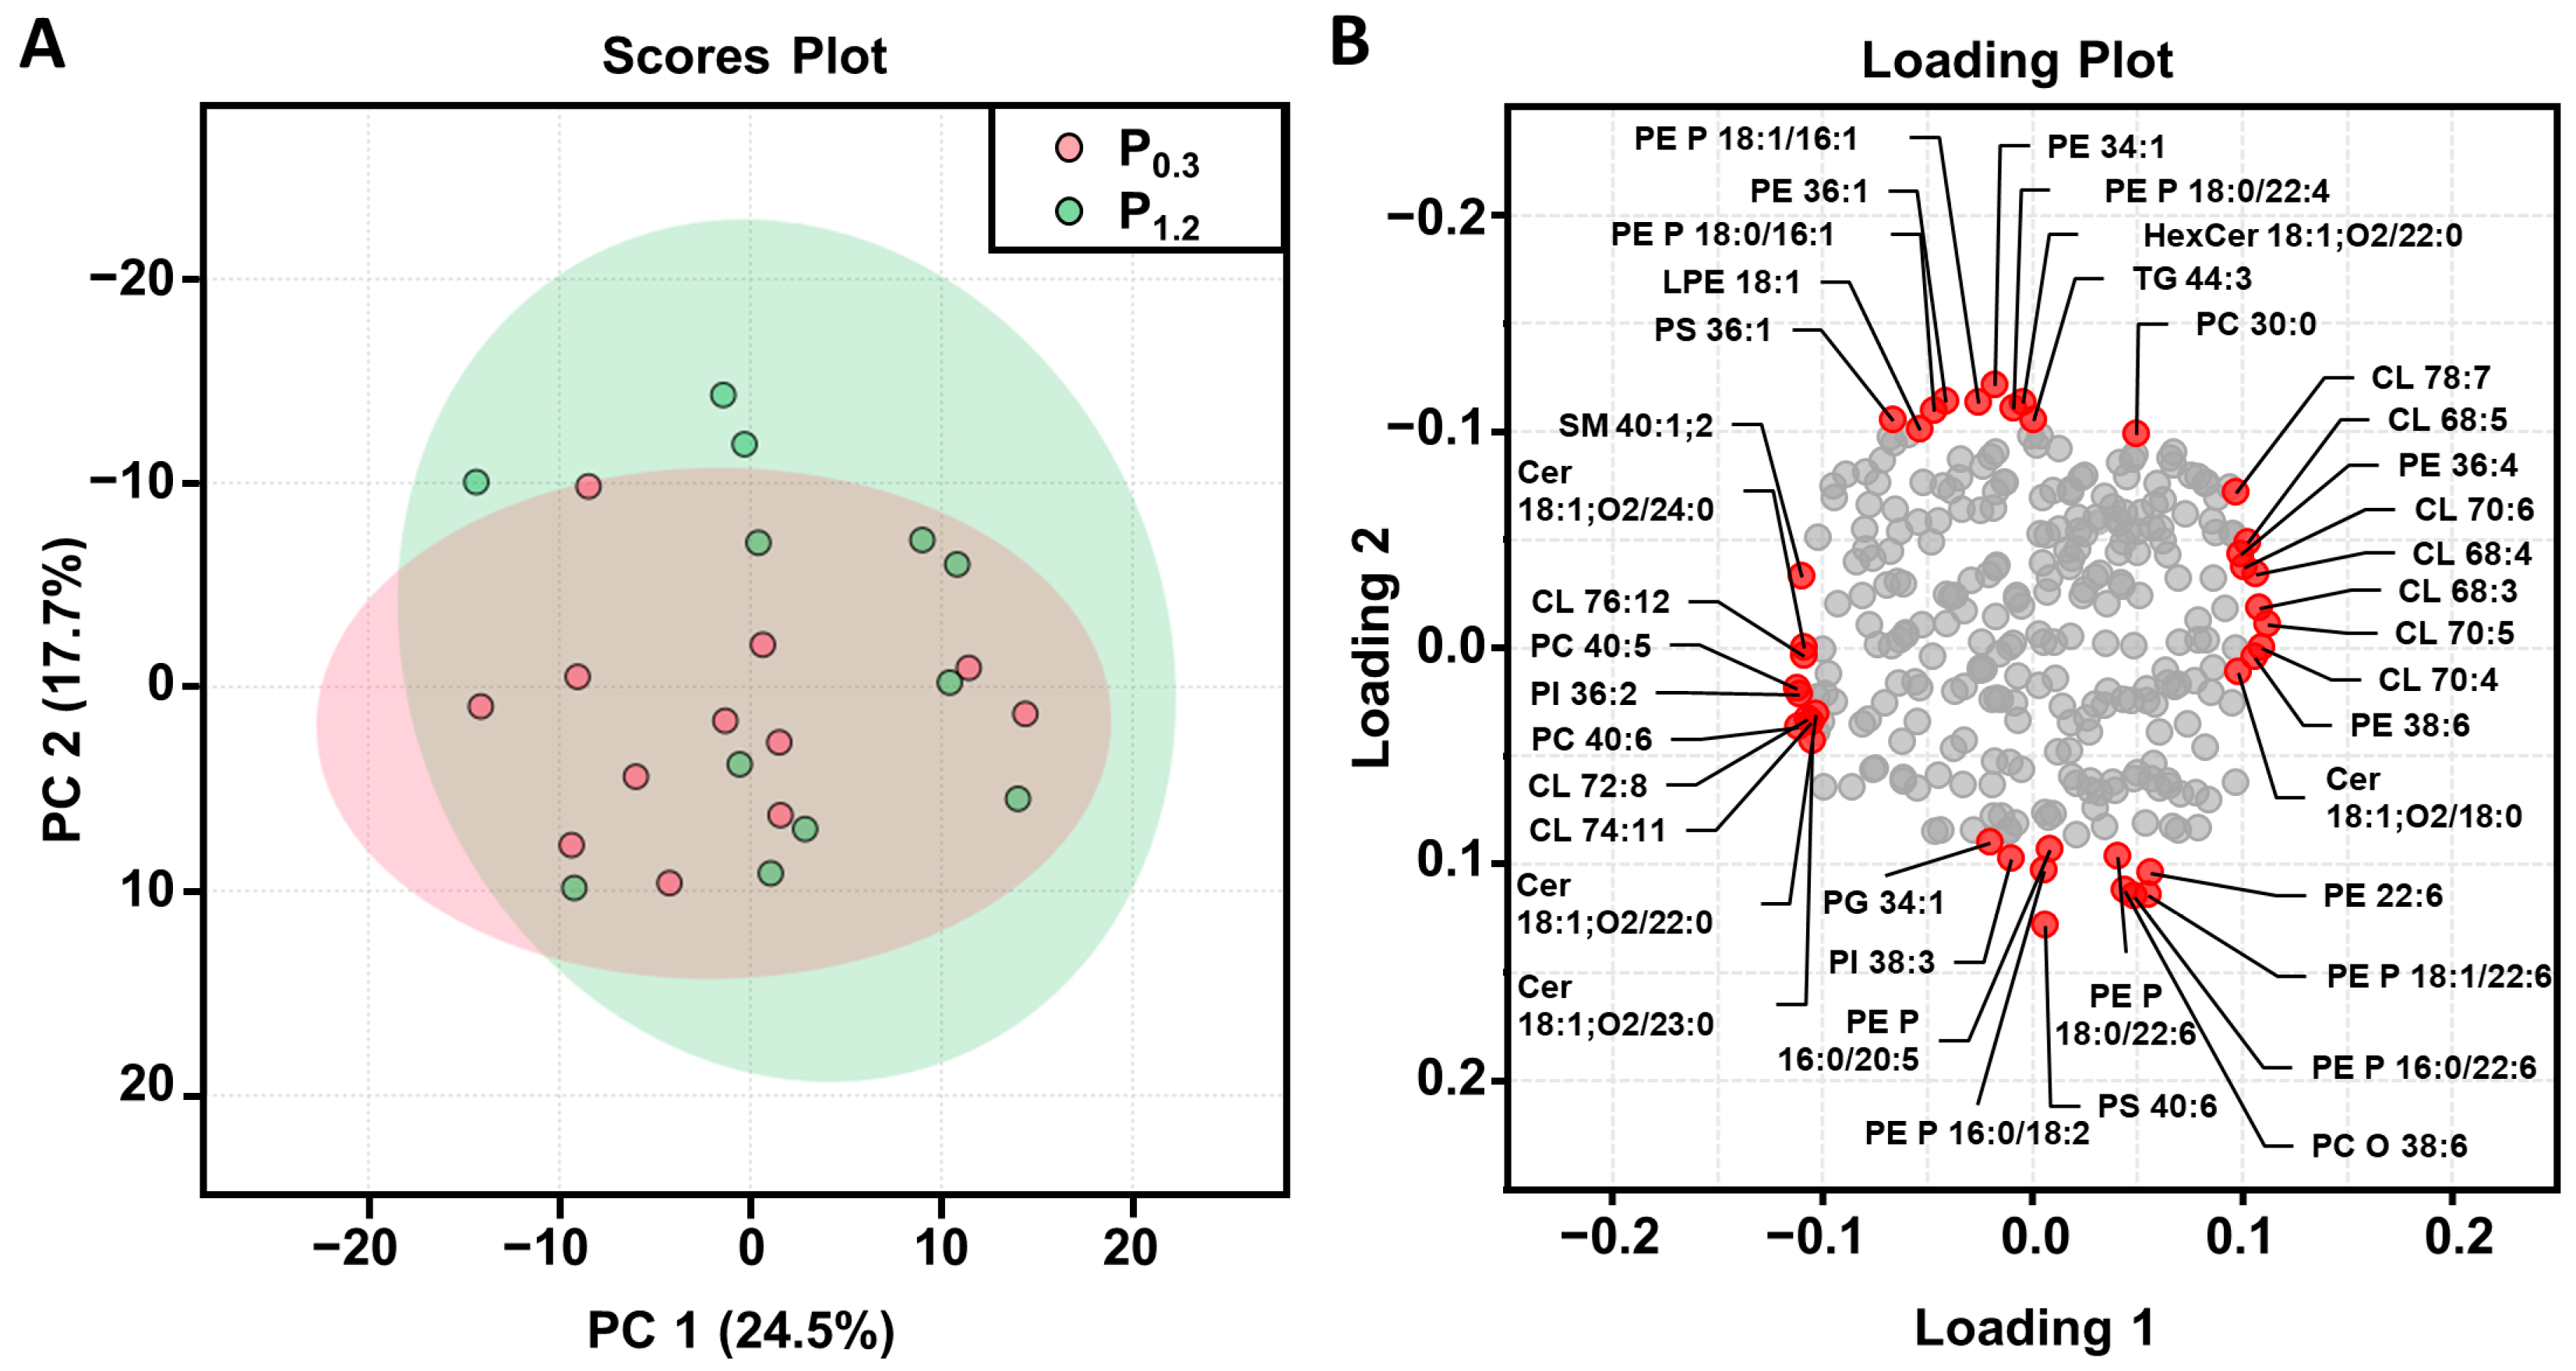
2.10. Principal Component Analysis of the Lipidome Data
2.11. Statistical Analysis
3. Results
3.1. Growth Performance and Organ Weights
3.2. Apparent Total Tract Digestibility of Phosphorus, Calcium, Crude Ash, Crude Lipids, and Gross Energy
3.3. Plasma Concentrations of Calcium and Inorganic Phosphate
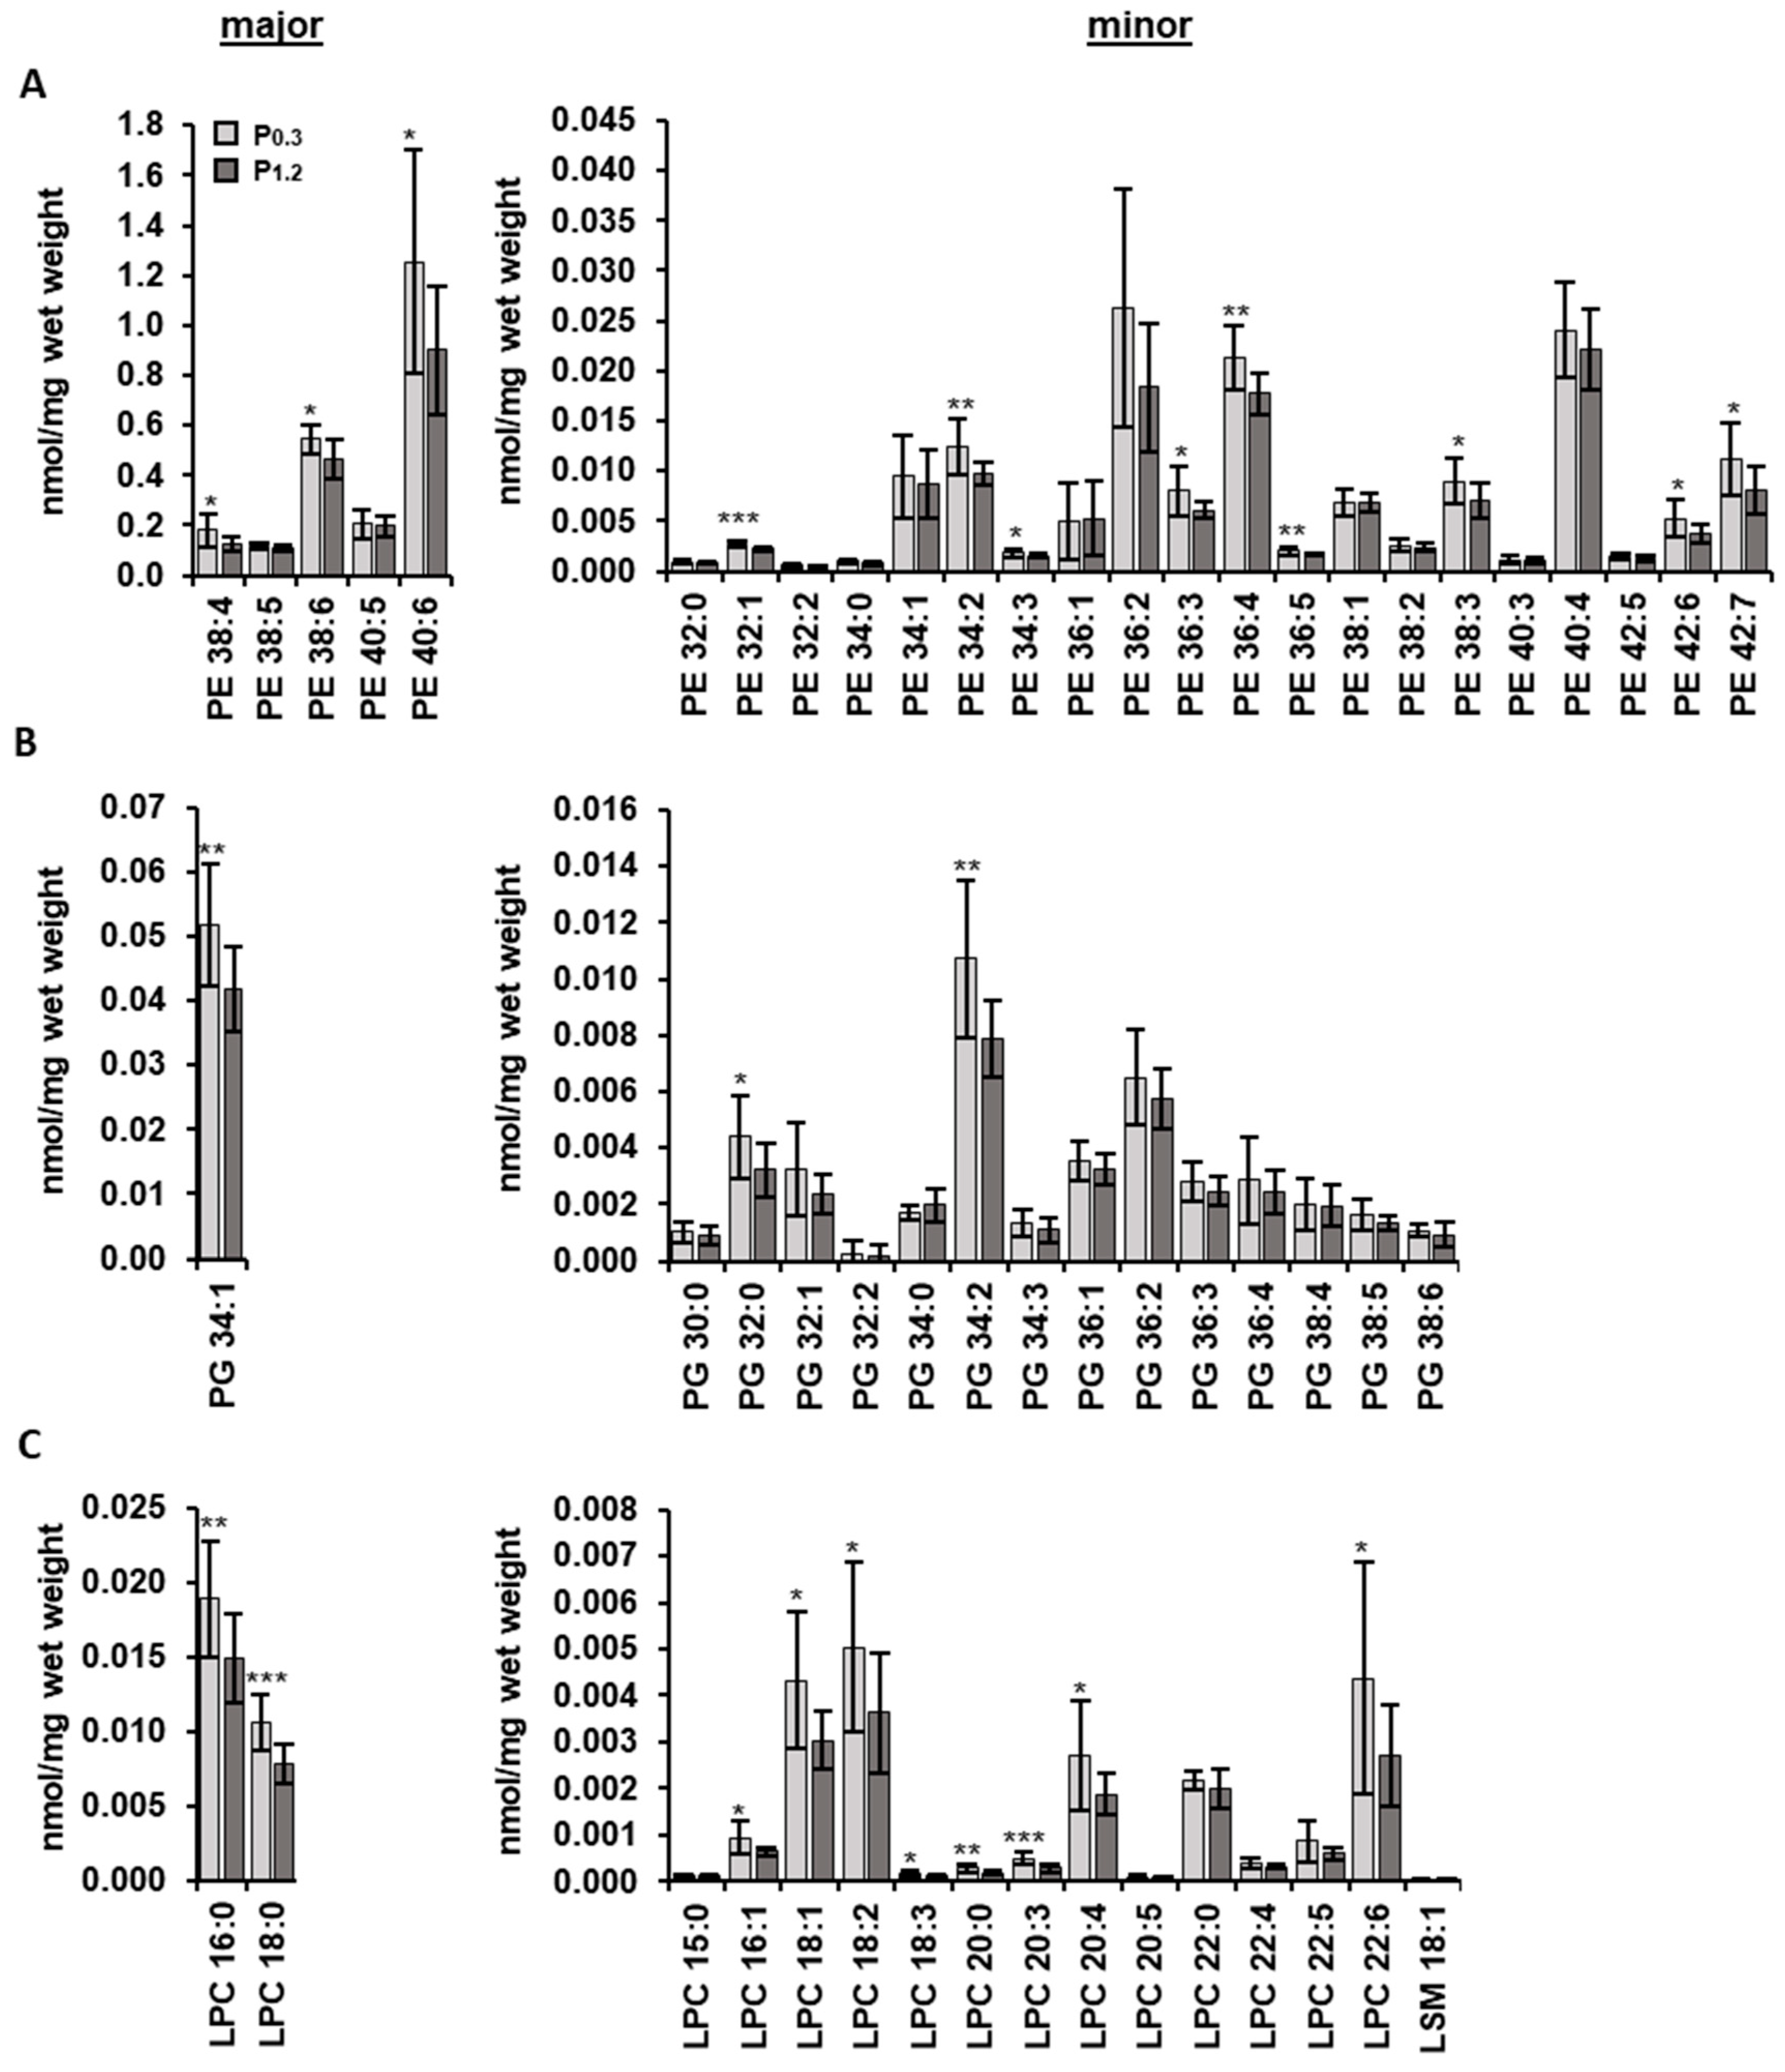
3.4. Effect of a High-Phosphorus Diet on the Muscle Lipidome
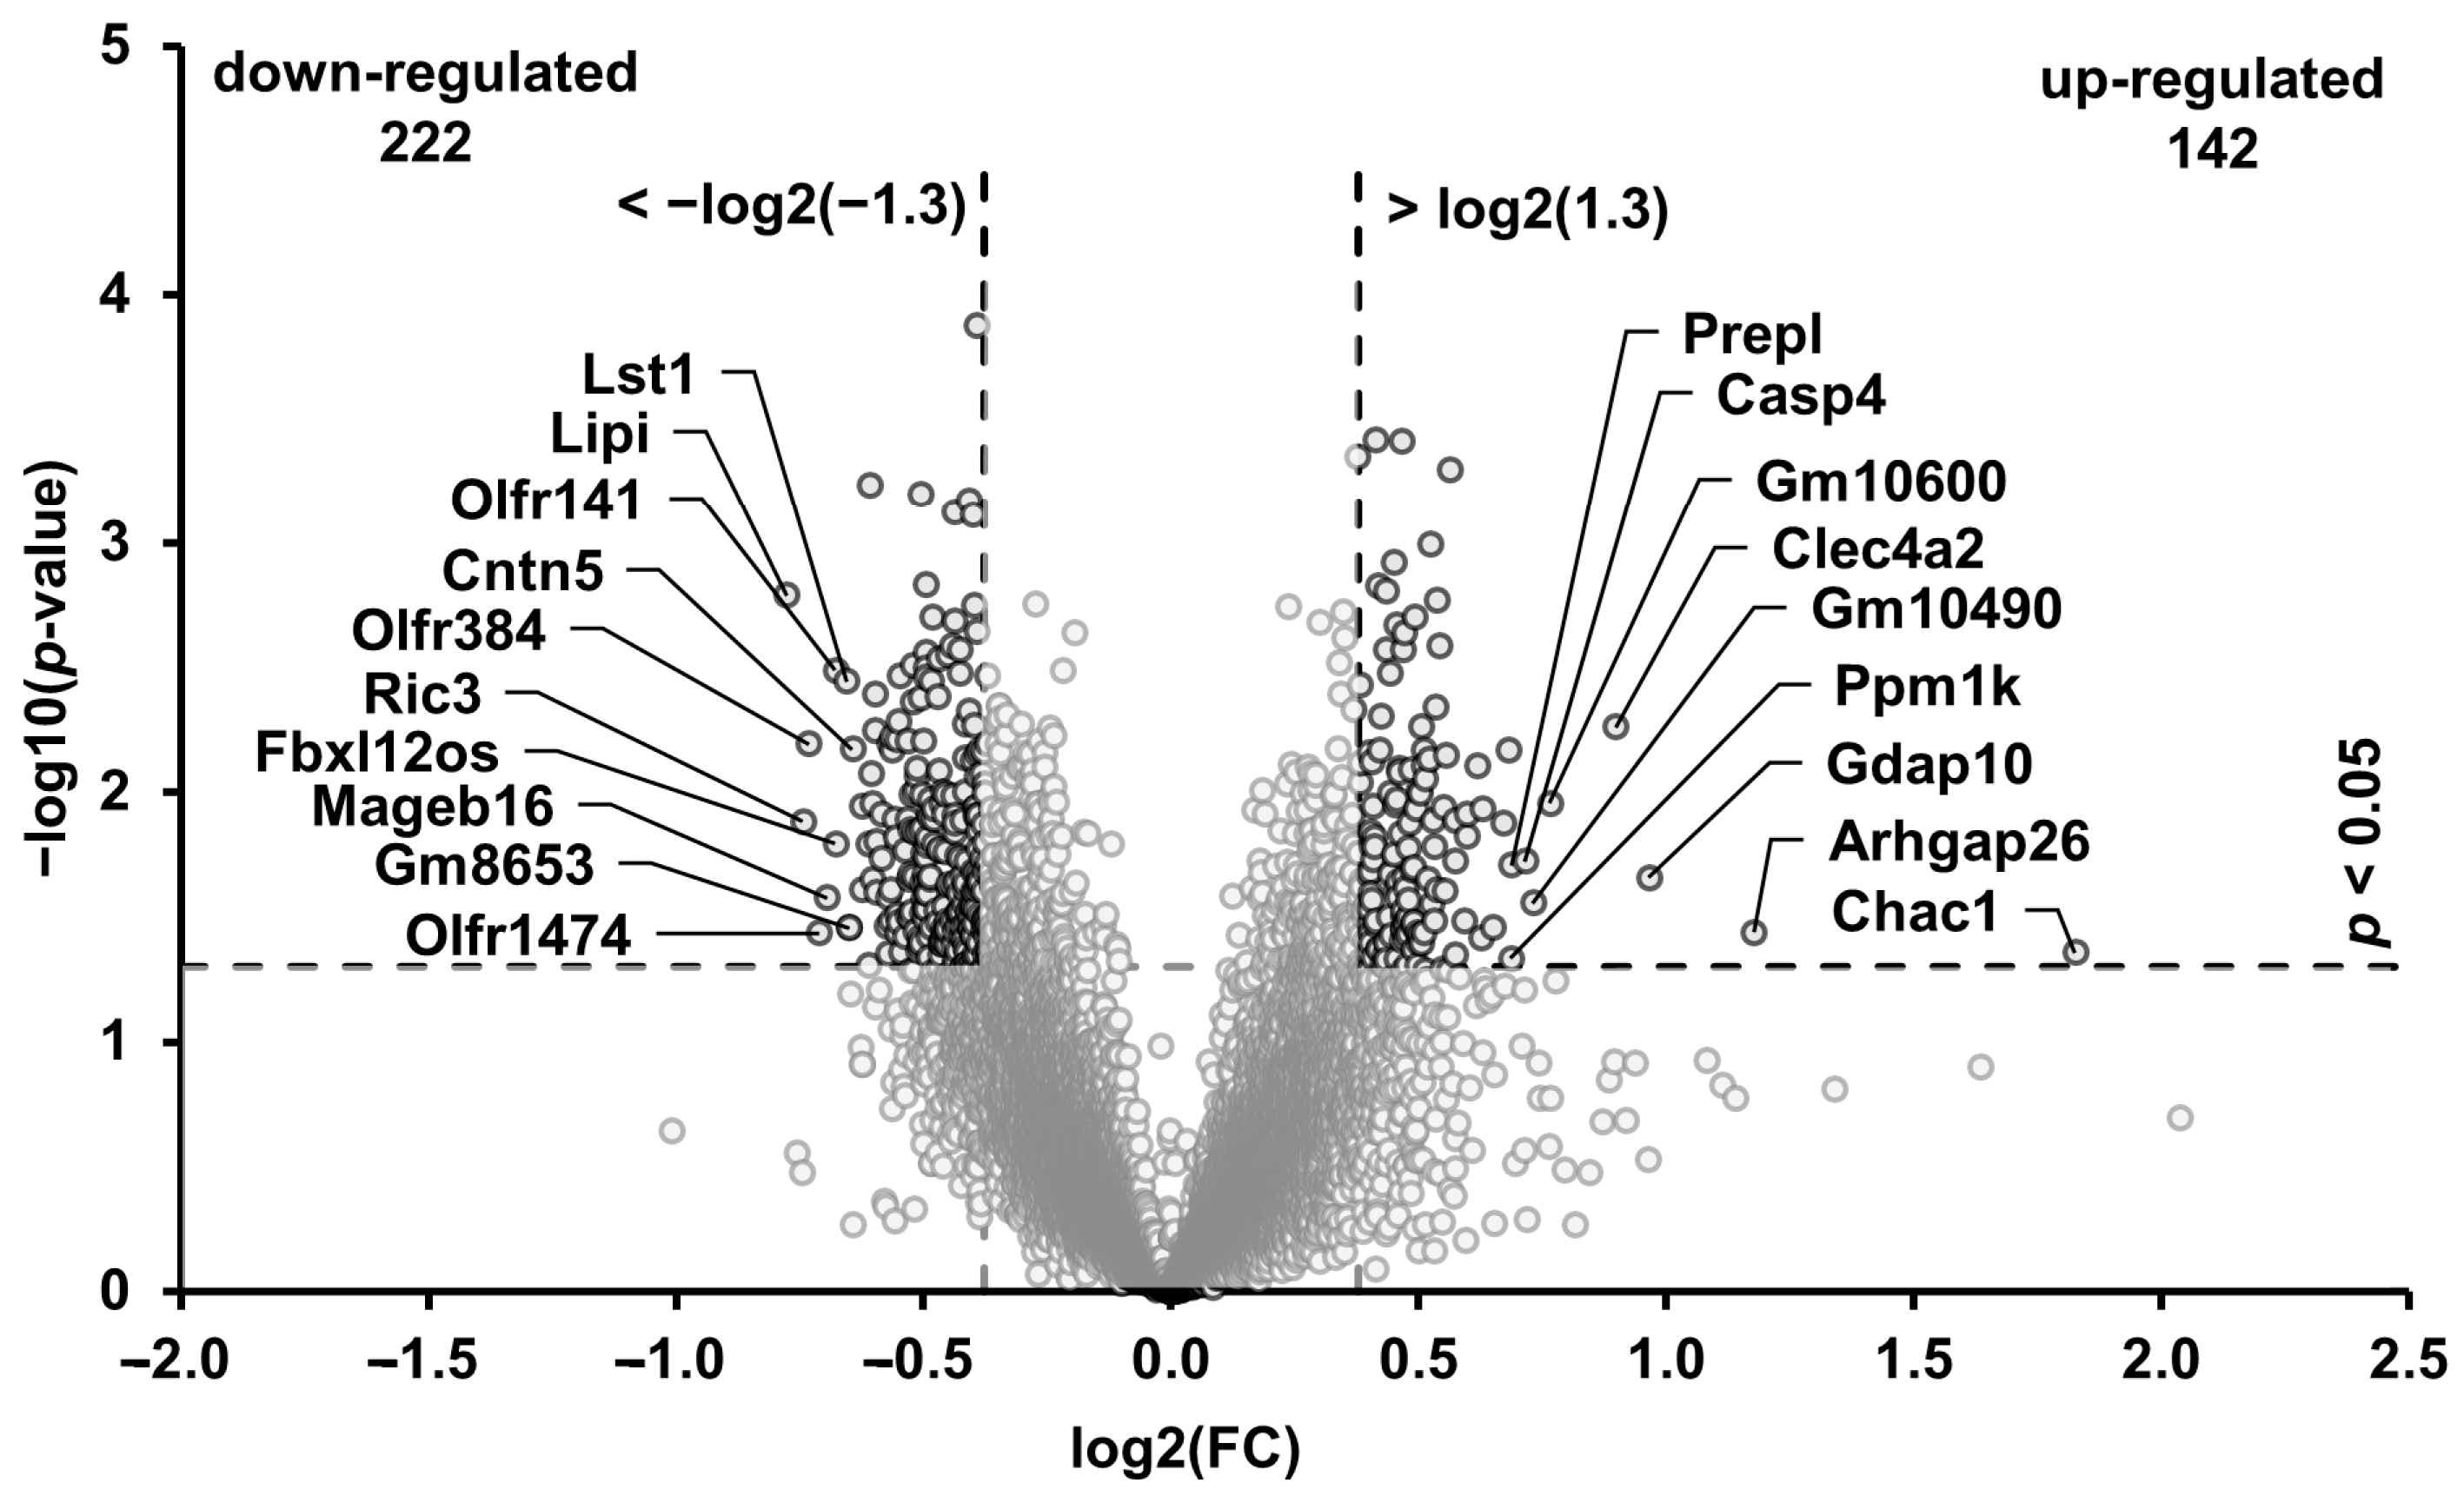
3.5. Transcripts in the Muscle Regulated through the High-Phosphorus Diet
3.6. Technical Validation of the Microarray Data
3.7. Biological Processes and Pathways Affected by the High-Phosphorus Diet
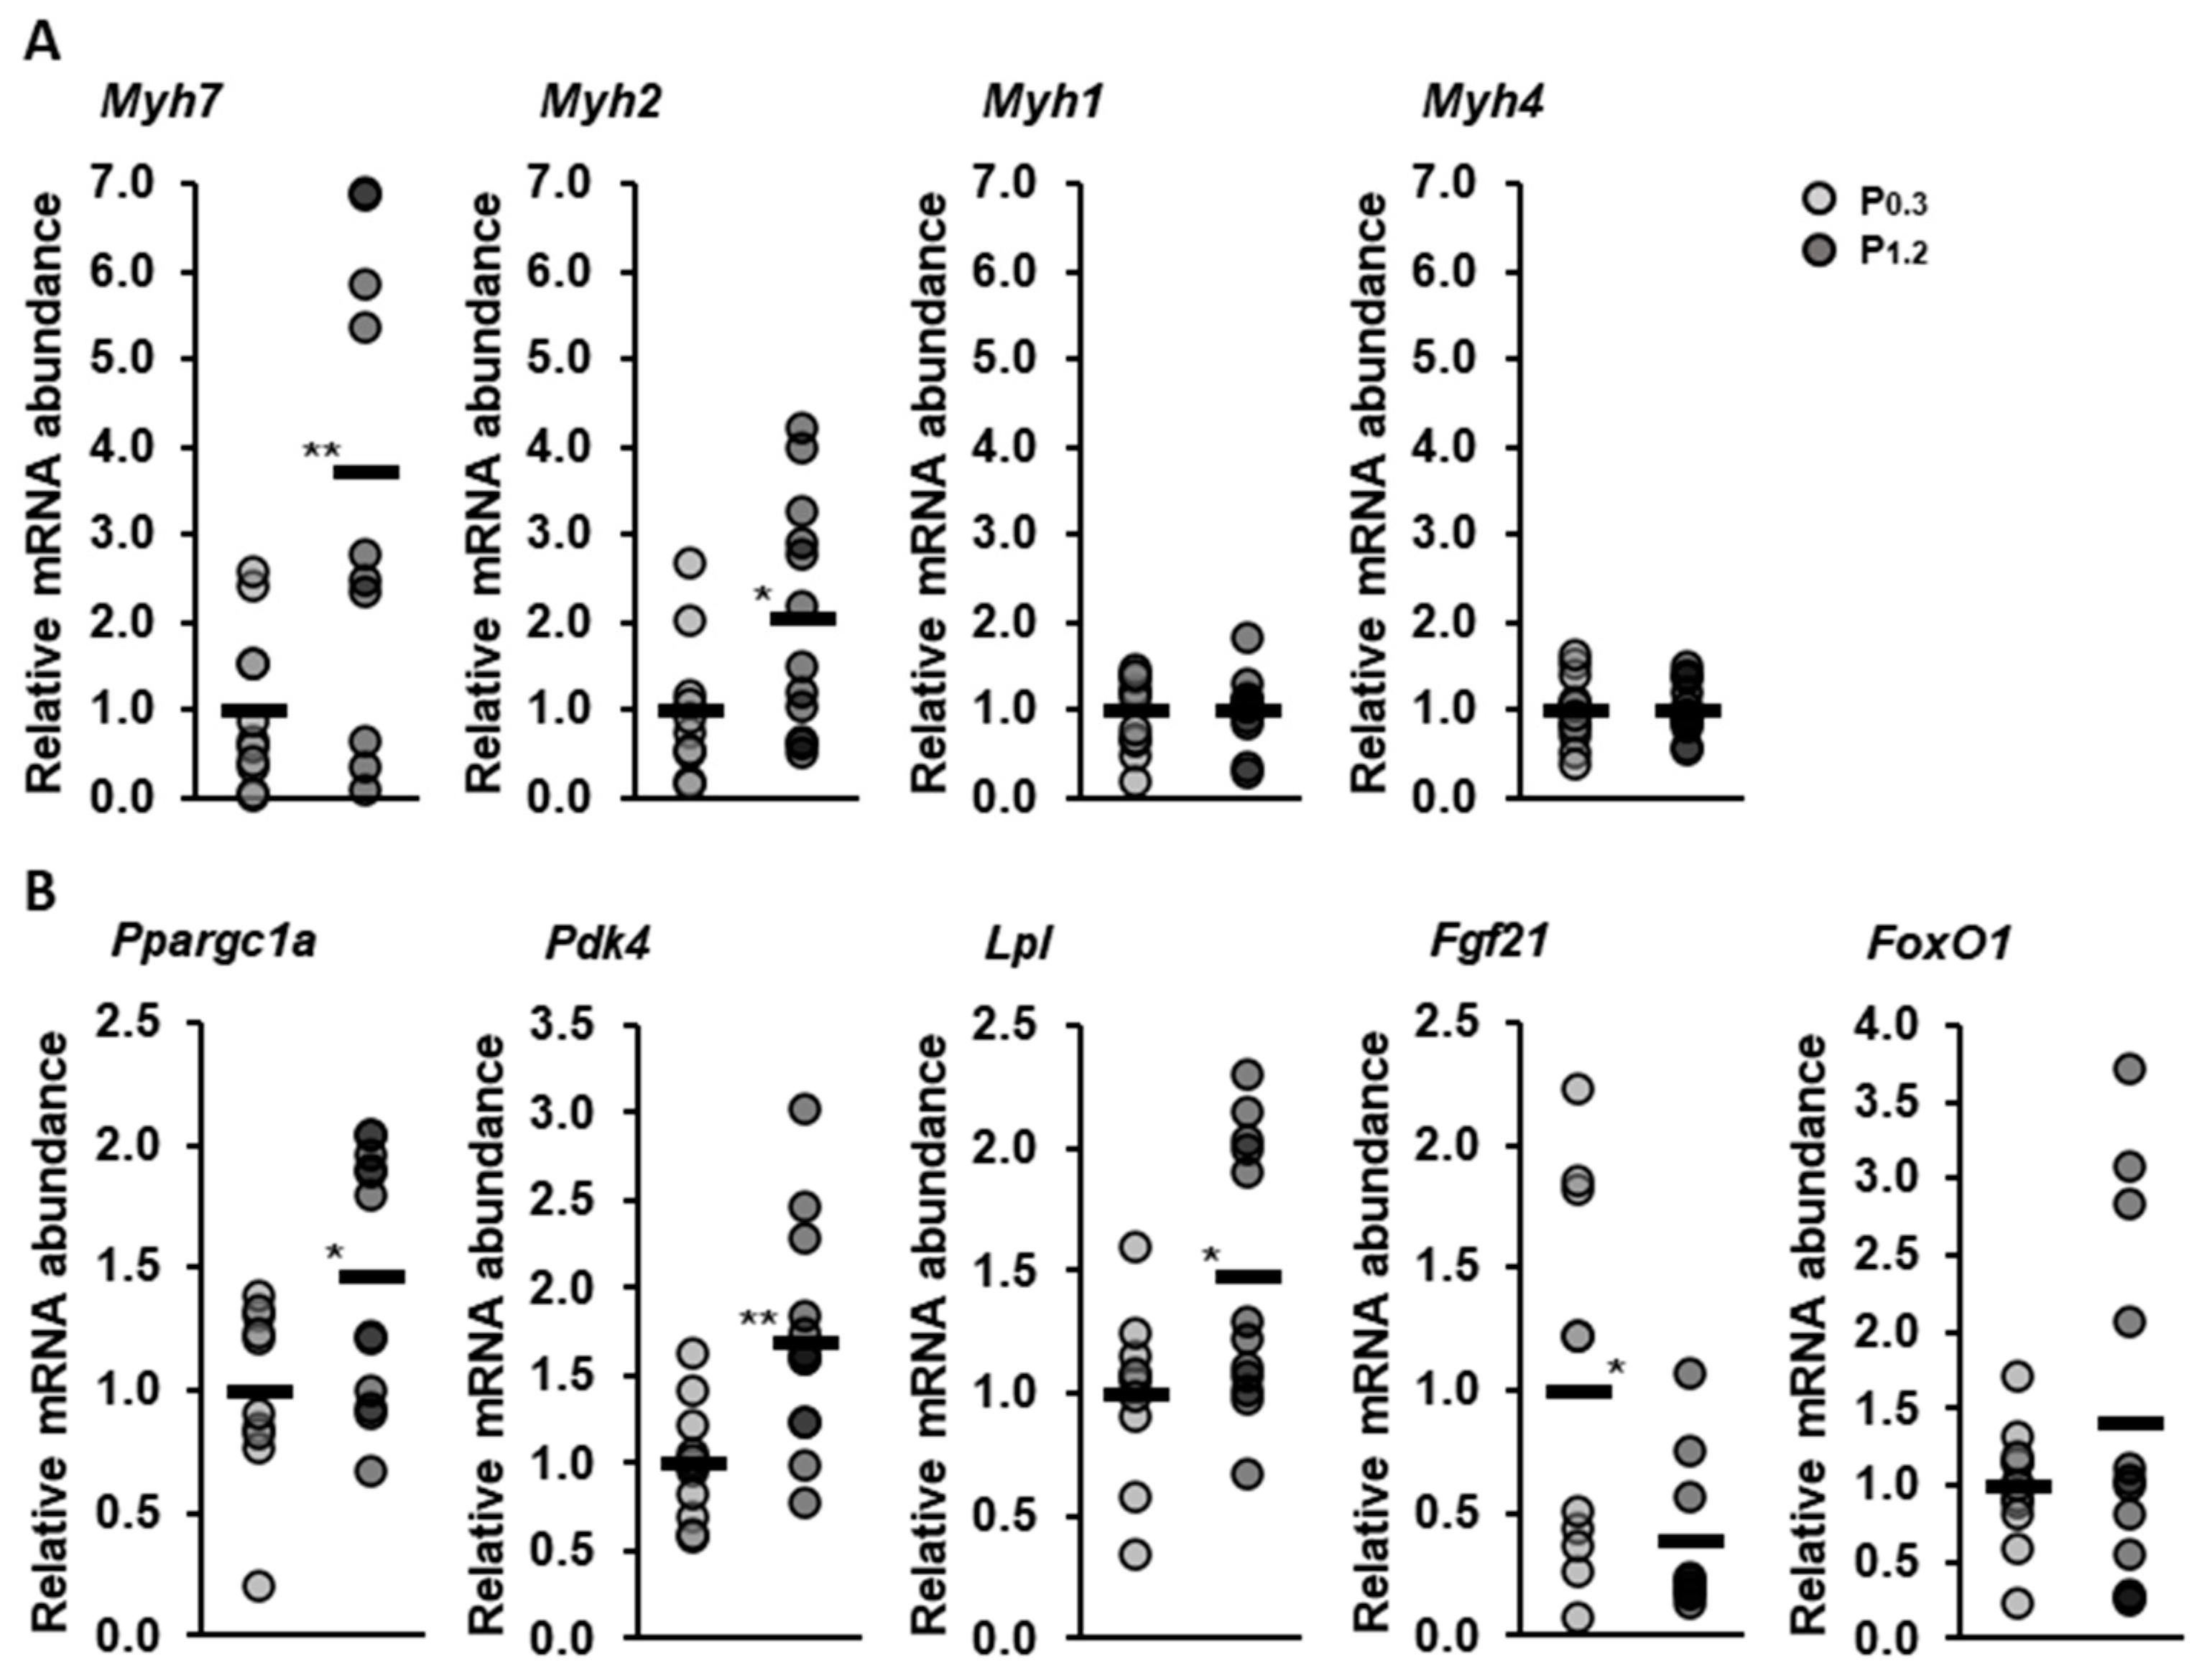
3.8. Effect of a High-Phosphorus Diet on Relative Muscle mRNA Abundance
3.9. Effect of a High-Phosphorus Diet on Relative Protein Levels in the Muscle
4. Discussion
5. Conclusions
Supplementary Materials
Author Contributions
Funding
Institutional Review Board Statement
Informed Consent Statement
Data Availability Statement
Conflicts of Interest
References
- Pietinen, P.; Paturi, M.; Reinivuo, H.; Tapanainen, H.; Valsta, L.M. FINDIET 2007 Survey: Energy and nutrient intakes. Public Health Nutr. 2010, 13, 920–924. [Google Scholar] [CrossRef]
- Chang, A.R.; Anderson, C. Dietary Phosphorus Intake and the Kidney. Annu. Rev. Nutr. 2017, 37, 321–346. [Google Scholar] [CrossRef]
- Welch, A.A.; Fransen, H.; Jenab, M.; Boutron-Ruault, M.C.; Tumino, R.; Agnoli, C.; Ericson, U.; Johansson, I.; Ferrari, P.; Engeset, D.; et al. Variation in intakes of calcium, phosphorus, magnesium, iron and potassium in 10 countries in the European Prospective Investigation into Cancer and Nutrition study. Eur. J. Clin. Nutr. 2009, 63 (Suppl. 4), S101–S121. [Google Scholar] [CrossRef]
- Bergman, C.; Gray-Scott, D.; Chen, J.-J.; Meacham, S. What is next for the Dietary Reference Intakes for bone metabolism related nutrients beyond calcium: Phosphorus, magnesium, vitamin D, and fluoride? Crit. Rev. Food Sci. Nutr. 2009, 49, 136–144. [Google Scholar] [CrossRef]
- Deutsche Gesellschaft für Ernährung; Österreichische Gesellschaft für Ernährung; Schweizerische Gesellschaft für Ernährung. DA-CH Referenzwerte für die Nährstoffzufuhr: 7. Aktualisierte Ausgabe, 2nd ed.; Neuer Umschau Buchverlag: Neustadt, Germany, 2021. [Google Scholar]
- Institute of Medicine (US) Standing Committee on the Scientific Evaluation of Dietary Reference Intakes. Dietary Reference Intakes for Calcium, Phosphorus, Magnesium, Vitamin D, and Fluoride; National Academies Press: Washington, DC, USA, 1997. [Google Scholar] [CrossRef]
- Moshfegh, A.; Kovalchik, A.F.; Clemens, J. Phosphorus Intake of the U.S. Population: What We Eat in America, NHANES 2011–2012. In Food Survey Research Group Dietary Data Brief; United States Department of Agriculture (USDA): Beltsville, MD, USA, 2016; pp. 1–6. [Google Scholar]
- Sullivan, C.M.; Leon, J.B.; Sehgal, A.R. Phosphorus-containing food additives and the accuracy of nutrient databases: Implications for renal patients. J. Ren. Nutr. 2007, 17, 350–354. [Google Scholar] [CrossRef]
- León, J.B.; Sullivan, C.M.; Sehgal, A.R. The prevalence of phosphorus-containing food additives in top-selling foods in grocery stores. J. Ren. Nutr. 2013, 23, 265–270.e2. [Google Scholar] [CrossRef]
- McClure, S.T.; Chang, A.R.; Selvin, E.; Rebholz, C.M.; Appel, L.J. Dietary Sources of Phosphorus among Adults in the United States: Results from NHANES 2001–2014. Nutrients 2017, 9, 95. [Google Scholar] [CrossRef]
- Calvo, M.S.; Uribarri, J. Public health impact of dietary phosphorus excess on bone and cardiovascular health in the general population. Am. J. Clin. Nutr. 2013, 98, 6–15. [Google Scholar] [CrossRef]
- Elliott, P.; Kesteloot, H.; Appel, L.J.; Dyer, A.R.; Ueshima, H.; Chan, Q.; Brown, I.J.; Zhao, L.; Stamler, J.; INTERMAP Cooperative Research Group. Dietary phosphorus and blood pressure: International study of macro- and micro-nutrients and blood pressure. Hypertension 2008, 51, 669–675. [Google Scholar] [CrossRef]
- Chang, A.R.; Lazo, M.; Appel, L.J.; Gutiérrez, O.M.; Grams, M.E. High dietary phosphorus intake is associated with all-cause mortality: Results from NHANES III. Am. J. Clin. Nutr. 2014, 99, 320–327. [Google Scholar] [CrossRef]
- Mizuno, M.; Mitchell, J.H.; Crawford, S.; Huang, C.-L.; Maalouf, N.; Hu, M.-C.; Moe, O.W.; Smith, S.A.; Vongpatanasin, W. High dietary phosphate intake induces hypertension and augments exercise pressor reflex function in rats. Am. J. Physiol. Regul. Integr. Comp. Physiol. 2016, 311, R39–R48. [Google Scholar] [CrossRef] [PubMed]
- Imi, Y.; Yabiki, N.; Abuduli, M.; Masuda, M.; Yamanaka-Okumura, H.; Taketani, Y. High phosphate diet suppresses lipogenesis in white adipose tissue. J. Clin. Biochem. Nutr. 2018, 63, 181–191. [Google Scholar] [CrossRef] [PubMed]
- Chun, S.; Bamba, T.; Suyama, T.; Ishijima, T.; Fukusaki, E.; Abe, K.; Nakai, Y. A High Phosphorus Diet Affects Lipid Metabolism in Rat Liver: A DNA Microarray Analysis. PLoS ONE 2016, 11, e0155386. [Google Scholar] [CrossRef] [PubMed]
- Ugrica, M.; Gehring, N.; Giesbertz, P.; Pastor-Arroyo, E.-M.; Daniel, H.; Wagner, C.A.; Rubio-Aliaga, I. Chronic High Phosphate Intake in Mice Affects Macronutrient Utilization and Body Composition. Mol. Nutr. Food Res. 2022, 66, e2100949. [Google Scholar] [CrossRef]
- Abuduli, M.; Ohminami, H.; Otani, T.; Kubo, H.; Ueda, H.; Kawai, Y.; Masuda, M.; Yamanaka-Okumura, H.; Sakaue, H.; Yamamoto, H.; et al. Effects of dietary phosphate on glucose and lipid metabolism. Am. J. Physiol. Endocrinol. Metab. 2016, 310, E526–E538. [Google Scholar] [CrossRef]
- Nowicki, M.; Fliser, D.; Fode, P.; Ritz, E. Changes in plasma phosphate levels influence insulin sensitivity under euglycemic conditions. J. Clin. Endocrinol. Metab. 1996, 81, 156–159. [Google Scholar] [CrossRef][Green Version]
- Venkataraman, P.S.; Blick, K.E.; Rao, R.; Fry, H.D.; Parker, M.K. Decline in serum calcium, magnesium, and phosphorus values with oral glucose in normal neonates: Studies of serum parathyroid hormone and calcitonin. J. Pediatr. 1986, 108, 607–610. [Google Scholar] [CrossRef]
- Oberhaensli, R.D.; Galloway, G.J.; Taylor, D.J.; Bore, P.J.; Radda, G.K. Assessment of human liver metabolism by phosphorus-31 magnetic resonance spectroscopy. Br. J. Radiol. 1986, 59, 695–699. [Google Scholar] [CrossRef]
- Fenton, T.R.; Eliasziw, M.; Lyon, A.W.; Tough, S.C.; Hanley, D.A. Meta-analysis of the quantity of calcium excretion associated with the net acid excretion of the modern diet under the acid-ash diet hypothesis. Am. J. Clin. Nutr. 2008, 88, 1159–1166. [Google Scholar] [CrossRef]
- Sugiura, S.H.; Dong, F.M.; Hardy, R.W. Primary responses of rainbow trout to dietary phosphorus concentrations. Aquac. Nutr. 2000, 6, 235–245. [Google Scholar] [CrossRef]
- Birge, S.J.; Haddad, J.G. 25-hydroxycholecalciferol stimulation of muscle metabolism. J. Clin. Investig. 1975, 56, 1100–1107. [Google Scholar] [CrossRef]
- Moore, L.W.; Nolte, J.V.; Gaber, A.O.; Suki, W.N. Association of dietary phosphate and serum phosphorus concentration by levels of kidney function. Am. J. Clin. Nutr. 2015, 102, 444–453. [Google Scholar] [CrossRef]
- Khattab, M.; Abi-Rashed, C.; Ghattas, H.; Hlais, S.; Obeid, O. Phosphorus ingestion improves oral glucose tolerance of healthy male subjects: A crossover experiment. Nutr. J. 2015, 14, 112. [Google Scholar] [CrossRef]
- Peri-Okonny, P.; Baskin, K.K.; Iwamoto, G.; Mitchell, J.H.; Smith, S.A.; Kim, H.K.; Szweda, L.I.; Bassel-Duby, R.; Fujikawa, T.; Castorena, C.M.; et al. High-Phosphate Diet Induces Exercise Intolerance and Impairs Fatty Acid Metabolism in Mice. Circulation 2019, 139, 1422–1434. [Google Scholar] [CrossRef] [PubMed]
- Brandt, M.; Allam, S.M. Analytik von TiO2 im Darminhalt und Kot nach Kjeldahlaufschluß. Arch. Anim. Nutr. 1987, 37, 454. [Google Scholar]
- Hafez, Y.S.; Mohamed, A.I.; Hewedy, F.M.; Singh, G. Effects of Microwave Heating on Solubility, Digestibility and Metabolism of Soy Protein. J. Food Sci. 1985, 50, 415–417. [Google Scholar] [CrossRef]
- Meyer, S.; Gessner, D.K.; Braune, M.S.; Friedhoff, T.; Most, E.; Höring, M.; Liebisch, G.; Zorn, H.; Eder, K.; Ringseis, R. Comprehensive evaluation of the metabolic effects of insect meal from Tenebrio molitor L. in growing pigs by transcriptomics, metabolomics and lipidomics. J. Anim. Sci. Biotechnol. 2020, 11, 20. [Google Scholar] [CrossRef]
- Schäfer, L.; Grundmann, S.M.; Friedrichs, S.; Lütjohann, D.; Höring, M.; Liebisch, G.; Most, E.; Ringseis, R.; Eder, K. Replacement of soybean oil by Hermetia illucens larvae fat in broiler diets alters the breast muscle lipidome and reduces lipid oxidation of the breast muscle during heat-processing. Arch. Anim. Nutr. 2023, 77, 121–140. [Google Scholar] [CrossRef]
- Bligh, E.G.; Dyer, W.J. A rapid method of total lipid extraction and purification. Can. J. Biochem. Physiol. 1959, 37, 911–917. [Google Scholar] [CrossRef]
- Liebisch, G.; Lieser, B.; Rathenberg, J.; Drobnik, W.; Schmitz, G. High-throughput quantification of phosphatidylcholine and sphingomyelin by electrospray ionization tandem mass spectrometry coupled with isotope correction algorithm. Biochim. Biophys. Acta 2004, 1686, 108–117. [Google Scholar] [CrossRef] [PubMed]
- Liebisch, G.; Binder, M.; Schifferer, R.; Langmann, T.; Schulz, B.; Schmitz, G. High throughput quantification of cholesterol and cholesteryl ester by electrospray ionization tandem mass spectrometry (ESI-MS/MS). Biochim. Biophys. Acta 2006, 1761, 121–128. [Google Scholar] [CrossRef]
- Liebisch, G.; Drobnik, W.; Lieser, B.; Schmitz, G. High-throughput quantification of lysophosphatidylcholine by electrospray ionization tandem mass spectrometry. Clin. Chem. 2002, 48, 2217–2224. [Google Scholar] [CrossRef]
- Matyash, V.; Liebisch, G.; Kurzchalia, T.V.; Shevchenko, A.; Schwudke, D. Lipid extraction by methyl-tert-butyl ether for high-throughput lipidomics. J. Lipid Res. 2008, 49, 1137–1146. [Google Scholar] [CrossRef]
- Zemski Berry, K.A.; Murphy, R.C. Electrospray ionization tandem mass spectrometry of glycerophosphoethanolamine plasmalogen phospholipids. J. Am. Soc. Mass Spectrom. 2004, 15, 1499–1508. [Google Scholar] [CrossRef]
- Liebisch, G.; Drobnik, W.; Reil, M.; Trümbach, B.; Arnecke, R.; Olgemöller, B.; Roscher, A.; Schmitz, G. Quantitative measurement of different ceramide species from crude cellular extracts by electrospray ionization tandem mass spectrometry (ESI-MS/MS). J. Lipid Res. 1999, 40, 1539–1546. [Google Scholar] [CrossRef]
- Liebisch, G.; Vizcaíno, J.A.; Köfeler, H.; Trötzmüller, M.; Griffiths, W.J.; Schmitz, G.; Spener, F.; Wakelam, M.J.O. Shorthand notation for lipid structures derived from mass spectrometry. J. Lipid Res. 2013, 54, 1523–1530. [Google Scholar] [CrossRef]
- Höring, M.; Ejsing, C.S.; Hermansson, M.; Liebisch, G. Quantification of Cholesterol and Cholesteryl Ester by Direct Flow Injection High-Resolution Fourier Transform Mass Spectrometry Utilizing Species-Specific Response Factors. Anal. Chem. 2019, 91, 3459–3466. [Google Scholar] [CrossRef]
- Husen, P.; Tarasov, K.; Katafiasz, M.; Sokol, E.; Vogt, J.; Baumgart, J.; Nitsch, R.; Ekroos, K.; Ejsing, C.S. Analysis of lipid experiments (ALEX): A software framework for analysis of high-resolution shotgun lipidomics data. PLoS ONE 2013, 8, e79736. [Google Scholar] [CrossRef]
- Gessner, D.K.; Winkler, A.; Koch, C.; Dusel, G.; Liebisch, G.; Ringseis, R.; Eder, K. Analysis of hepatic transcript profile and plasma lipid profile in early lactating dairy cows fed grape seed and grape marc meal extract. BMC Genom. 2017, 18, 253. [Google Scholar] [CrossRef]
- Edgar, R.; Domrachev, M.; Lash, A.E. Gene Expression Omnibus: NCBI gene expression and hybridization array data repository. Nucleic Acids Res. 2002, 30, 207–210. [Google Scholar] [CrossRef]
- Marschall, M.J.M.; Ringseis, R.; Gessner, D.K.; Grundmann, S.M.; Most, E.; Wen, G.; Maheshwari, G.; Zorn, H.; Eder, K. Effect of Ecdysterone on the Hepatic Transcriptome and Lipid Metabolism in Lean and Obese Zucker Rats. Int. J. Mol. Sci. 2021, 22, 5241. [Google Scholar] [CrossRef]
- Ringseis, R.; Zeitz, J.O.; Weber, A.; Koch, C.; Eder, K. Hepatic transcript profiling in early-lactation dairy cows fed rumen-protected niacin during the transition from late pregnancy to lactation. J. Dairy Sci. 2019, 102, 365–376. [Google Scholar] [CrossRef]
- Iwamoto, K.; Kakiuchi, C.; Bundo, M.; Ikeda, K.; Kato, T. Molecular characterization of bipolar disorder by comparing gene expression profiles of postmortem brains of major mental disorders. Mol. Psychiatry 2004, 9, 406–416. [Google Scholar] [CrossRef]
- Sherman, B.T.; Hao, M.; Qiu, J.; Jiao, X.; Baseler, M.W.; Lane, H.C.; Imamichi, T.; Chang, W. DAVID: A web server for functional enrichment analysis and functional annotation of gene lists (2021 update). Nucleic Acids Res. 2022, 50, W216–W221. [Google Scholar] [CrossRef]
- Da Huang, W.; Sherman, B.T.; Lempicki, R.A. Systematic and integrative analysis of large gene lists using DAVID bioinformatics resources. Nat. Protoc. 2009, 4, 44–57. [Google Scholar] [CrossRef]
- Zeitz, J.O.; Mohrmann, S.; Käding, S.C.; Devlikamov, M.; Niewalda, I.; Whelan, R.; Helmbrecht, A.; Eder, K. Effects of methionine on muscle protein synthesis and degradation pathways in broilers. J. Anim. Physiol. Anim. Nutr. 2018, 103, 191–203. [Google Scholar] [CrossRef]
- Niedan, S.; Kauer, M.; Aryee, D.N.T.; Kofler, R.; Schwentner, R.; Meier, A.; Pötschger, U.; Kontny, U.; Kovar, H. Suppression of FOXO1 is responsible for a growth regulatory repressive transcriptional sub-signature of EWS-FLI1 in Ewing sarcoma. Oncogene 2014, 33, 3927–3938. [Google Scholar] [CrossRef]
- Chong, J.; Xia, J. MetaboAnalystR: An R package for flexible and reproducible analysis of metabolomics data. Bioinformatics 2018, 34, 4313–4314. [Google Scholar] [CrossRef]
- Grundmann, S.M.; Schutkowski, A.; Berger, C.; Baur, A.C.; König, B.; Stangl, G.I. High-phosphorus diets reduce aortic lesions and cardiomyocyte size and modify lipid metabolism in Ldl receptor knockout mice. Sci. Rep. 2020, 10, 20748. [Google Scholar] [CrossRef]
- Ayoub, J.J.; Samra, M.J.A.; Hlais, S.A.; Bassil, M.S.; Obeid, O.A. Effect of phosphorus supplementation on weight gain and waist circumference of overweight/obese adults: A randomized clinical trial. Nutr. Diabetes 2015, 5, e189. [Google Scholar] [CrossRef]
- Stringham, R.M.; Bonilla, C.A.; Lytle, I.M. Normal serum calcium levels in albino mice. Comp. Biochem. Physiol. 1967, 22, 325–326. [Google Scholar] [CrossRef] [PubMed]
- Lee, S.-M.; Lee, S.H.; Jung, Y.; Lee, Y.; Yoon, J.H.; Choi, J.Y.; Hwang, C.Y.; Son, Y.H.; Park, S.S.; Hwang, G.-S.; et al. FABP3-mediated membrane lipid saturation alters fluidity and induces ER stress in skeletal muscle with aging. Nat. Commun. 2020, 11, 5661. [Google Scholar] [CrossRef]
- Bargui, R.; Solgadi, A.; Prost, B.; Chester, M.; Ferreiro, A.; Piquereau, J.; Moulin, M. Phospholipids: Identification and Implication in Muscle Pathophysiology. Int. J. Mol. Sci. 2021, 22, 8176. [Google Scholar] [CrossRef] [PubMed]
- He, P.; Mann-Collura, O.; Fling, J.; Edara, N.; Hetz, R.; Razzaque, M.S. High phosphate actively induces cytotoxicity by rewiring pro-survival and pro-apoptotic signaling networks in HEK293 and HeLa cells. FASEB J. 2021, 35, e20997. [Google Scholar] [CrossRef]
- Klingler, C.; Zhao, X.; Adhikary, T.; Li, J.; Xu, G.; Häring, H.-U.; Schleicher, E.; Lehmann, R.; Weigert, C. Lysophosphatidylcholines activate PPARδ and protect human skeletal muscle cells from lipotoxicity. Biochim. Biophys. Acta 2016, 1861 Pt A, 1980–1992. [Google Scholar] [CrossRef]
- Glass, D.J. Signaling pathways perturbing muscle mass. Curr. Opin. Clin. Nutr. Metab. Care 2010, 13, 225–229. [Google Scholar] [CrossRef]
- Kohn, A.D.; Summers, S.A.; Birnbaum, M.J.; Roth, R.A. Expression of a constitutively active Akt Ser/Thr kinase in 3T3-L1 adipocytes stimulates glucose uptake and glucose transporter 4 translocation. J. Biol. Chem. 1996, 271, 31372–31378. [Google Scholar] [CrossRef]
- Chung, L.-H.; Liu, S.-T.; Huang, S.-M.; Salter, D.M.; Lee, H.-S.; Hsu, Y.-J. High phosphate induces skeletal muscle atrophy and suppresses myogenic differentiation by increasing oxidative stress and activating Nrf2 signaling. Aging 2020, 12, 21446–21468. [Google Scholar] [CrossRef]
- Buas, M.F.; Kadesch, T. Regulation of skeletal myogenesis by Notch. Exp. Cell Res. 2010, 316, 3028–3033. [Google Scholar] [CrossRef]
- Gioftsidi, S.; Relaix, F.; Mourikis, P. The Notch signaling network in muscle stem cells during development, homeostasis, and disease. Sk. Muscle 2022, 12, 9. [Google Scholar] [CrossRef] [PubMed]
- Pette, D.; Staron, R.S. Cellular and molecular diversities of mammalian skeletal muscle fibers. In Reviews of Physiology, Biochemistry and Pharmacology; Springer: Berlin/Heidelberg, Germany, 1990; Volume 116, pp. 1–76. [Google Scholar]
- Spangenburg, E.E.; Booth, F.W. Molecular regulation of individual skeletal muscle fibre types. Acta Physiol. Scand. 2003, 178, 413–424. [Google Scholar] [CrossRef]
- Zierath, J.R.; Hawley, J.A. Skeletal muscle fiber type: Influence on contractile and metabolic properties. PLoS Biol. 2004, 2, e348. [Google Scholar] [CrossRef]
- Schiaffino, S.; Reggiani, C. Myosin isoforms in mammalian skeletal muscle. J. Appl. Physiol. 1994, 77, 493–501. [Google Scholar] [CrossRef]
- Smerdu, V.; Karsch-Mizrachi, I.; Campione, M.; Leinwand, L.; Schiaffino, S. Type IIx myosin heavy chain transcripts are expressed in type IIb fibers of human skeletal muscle. Am. J. Physiol. 1994, 267 Pt 1, C1723–C1728. [Google Scholar] [CrossRef] [PubMed]
- Peter, J.B.; Barnard, R.J.; Edgerton, V.R.; Gillespie, C.A.; Stempel, K.E. Metabolic profiles of three fiber types of skeletal muscle in guinea pigs and rabbits. Biochemistry 1972, 11, 2627–2633. [Google Scholar] [CrossRef]
- Barnard, R.J.; Edgerton, V.R.; Furukawa, T.; Peter, J.B. Histochemical, biochemical, and contractile properties of red, white, and intermediate fibers. Am. J. Physiol. 1971, 220, 410–414. [Google Scholar] [CrossRef]
- Cassano, P.; Sciancalepore, A.G.; Pesce, V.; Flück, M.; Hoppeler, H.; Calvani, M.; Mosconi, L.; Cantatore, P.; Gadaleta, M. Acetyl-L-carnitine feeding to unloaded rats triggers in soleus muscle the coordinated expression of genes involved in mitochondrial biogenesis. Biochim. Biophys. Acta 2006, 1757, 1421–1428. [Google Scholar] [CrossRef][Green Version]
- Fujita, N.; Nagatomo, F.; Murakami, S.; Kondo, H.; Ishihara, A.; Fujino, H. Effects of hyperbaric oxygen on metabolic capacity of the skeletal muscle in type 2 diabetic rats with obesity. Sci. World J. 2012, 2012, 637978. [Google Scholar] [CrossRef]
- Waters, R.E.; Rotevatn, S.; Li, P.; Annex, B.H.; Yan, Z. Voluntary running induces fiber type-specific angiogenesis in mouse skeletal muscle. Am. J. Physiol. Cell Physiol. 2004, 287, C1342–C1348. [Google Scholar] [CrossRef]
- Nagatomo, F.; Fujino, H.; Kondo, H.; Gu, N.; Takeda, I.; Ishioka, N.; Tsuda, K.; Ishihara, A. PGC-1α mRNA level and oxidative capacity of the plantaris muscle in rats with metabolic syndrome, hypertension, and type 2 diabetes. Acta Histochem. Cytochem. 2011, 44, 73–80. [Google Scholar] [CrossRef]
- Liang, H.; Ward, W.F. PGC-1alpha: A key regulator of energy metabolism. Adv. Physiol. Educ. 2006, 30, 145–151. [Google Scholar] [CrossRef] [PubMed]
- Mortensen, O.H.; Frandsen, L.; Schjerling, P.; Nishimura, E.; Grunnet, N. PGC-1alpha and PGC-1beta have both similar and distinct effects on myofiber switching toward an oxidative phenotype. Am. J. Physiol. Endocrinol. Metab. 2006, 291, E807–E816. [Google Scholar] [CrossRef] [PubMed]
- Lin, J.; Wu, H.; Tarr, P.T.; Zhang, C.-Y.; Wu, Z.; Boss, O.; Michael, L.F.; Puigserver, P.; Isotani, E.; Olson, E.N.; et al. Transcriptional co-activator PGC-1 alpha drives the formation of slow-twitch muscle fibres. Nature 2002, 418, 797–801. [Google Scholar] [CrossRef] [PubMed]
- Bassel-Duby, R.; Olson, E.N. Signaling pathways in skeletal muscle remodeling. Annu. Rev. Biochem. 2006, 75, 19–37. [Google Scholar] [CrossRef]
- Jansson, E.; Sylvén, C. Myoglobin concentration in single type I and type II muscle fibres in man. Histochemistry 1983, 78, 121–124. [Google Scholar] [CrossRef]
- Saltin, B. Metabolic fundamentals in exercise. Med. Sci. Sports 1973, 5, 137–146. [Google Scholar] [CrossRef]
- Pette, D.; Staron, R.S. Mammalian skeletal muscle fiber type transitions. Int. Rev. Cytol. 1997, 170, 143–223. [Google Scholar] [CrossRef]
- Schiaffino, S.; Reggiani, C. Fiber types in mammalian skeletal muscles. Physiol. Rev. 2011, 91, 1447–1531. [Google Scholar] [CrossRef]
- Fazeli, P.K.; Lun, M.; Kim, S.M.; Bredella, M.A.; Wright, S.; Zhang, Y.; Lee, H.; Catana, C.; Klibanski, A.; Patwari, P.; et al. FGF21 and the late adaptive response to starvation in humans. J. Clin. Investig. 2015, 125, 4601–4611. [Google Scholar] [CrossRef]


| Component (g/kg) | Adequate-Phosphorus Diet (0.30% Phosphorus) | High-Phosphorus Diet (1.20% Phosphorus) |
|---|---|---|
| Cornstarch | 524.05 | 513.61 |
| Casein 2 | 200 | 200 |
| Sucrose | 100 | 100 |
| Soybean oil | 50 | 50 |
| Cellulose | 50 | 50 |
| Mineral mix 1 | 25 | 25 |
| KH2PO4 2,3 | 6.86 | 46.39 |
| KHCO3 4 | 29.09 | - |
| Vitamin mix 5 | 10 | 10 |
| Titanium dioxide | 5 | 5 |
| P0.3 | P1.2 | p-Value | |
|---|---|---|---|
| Body weight, g | |||
| Initial | 29.8 ± 1.8 | 29.8 ± 2.0 | 0.960 |
| Week 1 | 30.1 ± 1.6 | 29.6 ± 2.3 | 0.563 |
| Week 2 | 30.7 ± 1.6 | 30.4 ± 2.3 | 0.679 |
| Week 3 | 31.6 ± 1.4 | 30.7 ± 2.0 | 0.235 |
| Week 4 | 32.3 ± 1.6 | 31.2 ± 2.1 | 0.162 |
| Week 5 | 33.0 ± 1.6 | 31.4 ± 1.8 | 0.033 |
| Week 6 | 34.0 ± 1.6 | 31.7 ± 1.8 | 0.003 |
| Feed and energy intake | |||
| Daily feed intake, g | 3.77 ± 0.44 | 3.87 ± 0.58 | 0.759 |
| Daily energy intake, KJ | 62.6 ± 7.3 | 63.7 ± 9.6 | 0.821 |
| Tibia length and organ weights | |||
| Tibia length right, cm | 1.78 ± 0.08 | 1.79 ± 0.02 | 0.730 |
| Tibia length left, cm | 1.80 ± 0.03 | 1.79 ± 0.02 | 0.294 |
| Heart, mg | 151 ± 12 | 159 ± 25 | 0.324 |
| Kidney right, mg | 177 ± 11 | 194 ± 32 | 0.099 |
| Liver, g | 1.54 ± 0.14 | 1.16 ± 0.24 | <0.001 |
| Liver to body weight ratio, mg/g | 4.53 ± 0.40 | 3.65 ± 0.71 | 0.001 |
| M. soleus right, mg | 9.75 ± 1.19 | 9.61 ± 1.48 | 0.799 |
| M. gastrocnemius right, mg | 170 ± 15 | 171 ± 14 | 0.871 |
| M. rectus femoris right, mg | 218 ± 47 | 208 ± 53 | 0.627 |
| P0.3 | P1.2 | p-Value | |
|---|---|---|---|
| ATTD, % | |||
| Phosphorus | 40.4 ± 3.9 | 73.3 ± 1.0 | 0.002 |
| Calcium | 5.09 ± 3.03 | 5.13 ± 2.17 | 0.222 |
| Crude ash | 54.5 ± 1.0 | 63.0 ± 0.8 | 0.001 |
| Crude lipids | 97.7 ± 0.5 | 96.5 ± 0.4 | 0.001 |
| Gross energy | 91.2 ± 0.4 | 90.6 ± 0.4 | 0.024 |
| P0.3 | P1.2 | p-Value | |
|---|---|---|---|
| Plasma concentration, mmol/L | |||
| Calcium | 2.42 ± 0.10 | 2.27 ± 0.13 | 0.004 |
| Inorganic phosphate | 2.16 ± 0.15 | 2.26 ± 0.19 | 0.127 |
| P0.3 | P1.2 | p-Value | |
|---|---|---|---|
| Major lipid classes, nmol/mg wet weight | |||
| Triacylglycerol | 7.61 ± 8.83 | 6.22 ± 5.66 | 0.987 |
| Phosphatidylcholine (PC) | 6.76 ± 1.05 | 6.09 ± 0.72 | 0.092 |
| Phosphatidylethanolamine (PE) | 2.45 ± 0.64 | 1.93 ± 0.34 | 0.027 |
| Phosphatidylinositol | 1.69 ± 0.19 | 1.67 ± 0.14 | 0.747 |
| Free cholesterol | 1.37 ± 0.47 | 1.48 ± 0.39 | 0.427 |
| Minor lipid classes, pmol/mg wet weight | |||
| Phosphatidylserine | 678 ± 103 | 669 ± 69 | 0.895 |
| PE-based plasmalogens | 676 ± 171 | 697 ± 126 | 0.625 |
| Cardiolipin | 438 ± 155 | 325 ± 118 | 0.060 |
| Sphingomyelin | 258 ± 62 | 271 ± 45 | 0.428 |
| Diacylglycerol | 164 ± 88 | 121 ± 30 | 0.058 |
| Phosphatidylglycerol | 94.9 ± 18.1 | 77.4 ± 11.8 | 0.011 |
| PC ether | 67.1 ± 44.3 | 81.5 ± 51.7 | 0.419 |
| Hexosylceramide | 61.0 ± 90.8 | 87.8 ± 106 | 0.584 |
| Lysophosphatidylcholine | 51.5 ± 12.8 | 38.4 ± 7.1 | 0.004 |
| Ceramide | 36.1 ± 5.7 | 35.1 ± 3.8 | 0.685 |
| Lysophosphatidylethanolamine | 27.3 ± 9.9 | 24.2 ± 7.6 | 0.422 |
| Cholesteryl ester | 5.60 ± 3.73 | 4.89 ± 8.61 | 0.119 |
| Sums, nmol/mg wet weight | |||
| Total | 22.4 ± 9.7 | 19.8 ± 5.1 | 0.495 |
| Phospholipids | 13.2 ± 2.3 | 11.9 ± 1.2 | 0.090 |
| Lipid composition, % of total lipids | |||
| Phosphatidylcholine | 33.4 ± 9.8 | 32.6 ± 8.5 | 0.898 |
| Triacylglycerol | 27.0 ± 21.5 | 27.0 ± 19.6 | 0.420 |
| Phosphatidylethanolamine | 12.1 ± 4.3 | 10.5 ± 3.7 | 0.534 |
| Phosphatidylinositol | 8.46 ± 2.56 | 8.88 ± 2.09 | 0.383 |
| Free cholesterol | 6.59 ± 2.03 | 7.97 ± 2.96 | 0.564 |
| Phosphatidylserine | 3.36 ± 1.01 | 3.58 ± 0.92 | 0.332 |
| PE-based plasmalogens | 3.27 ± 0.92 | 3.74 ± 1.14 | 0.136 |
| Cardiolipin | 2.17 ± 0.91 | 1.83 ± 0.96 | 0.661 |
| Sphingomyelin | 1.25 ± 0.34 | 1.45 ± 0.41 | 0.464 |
| Diacylglycerol | 0.734 ± 0.132 | 0.575 ± 0.238 | 0.095 |
| Phosphatidylglycerol | 0.461 ± 0.119 | 0.413 ± 0.110 | 0.357 |
| PC ether | 0.303 ± 0.112 | 0.451 ± 0.333 | 0.927 |
| Lysophosphatidylcholine | 0.247 ± 0.067 | 0.206 ± 0.063 | 0.266 |
| Hexosylceramide | 0.235 ± 0.231 | 0.498 ± 0.643 | 0.227 |
| Ceramide | 0.183 ± 0.063 | 0.187 ± 0.046 | 0.092 |
| Lysophosphatidylethanolamine | 0.129 ± 0.040 | 0.133 ± 0.059 | 0.829 |
| Cholesteryl ester | 0.0234 ± 0.0088 | 0.0209 ± 0.0305 | 0.243 |
| P0.3 | P1.2 | p-Value | |
|---|---|---|---|
| Relative protein level | |||
| AKT | 1.00 ± 0.31 | 1.20 ± 0.50 | 0.277 |
| pAKT | 1.00 ± 0.36 | 0.93 ± 0.42 | 0.655 |
| FoxO1 | 1.00 ± 0.68 | 1.10 ± 0.87 | 0.945 |
| pFoxO1 | 1.00 ± 0.39 | 0.98 ± 0.45 | 0.890 |
Disclaimer/Publisher’s Note: The statements, opinions and data contained in all publications are solely those of the individual author(s) and contributor(s) and not of MDPI and/or the editor(s). MDPI and/or the editor(s) disclaim responsibility for any injury to people or property resulting from any ideas, methods, instructions or products referred to in the content. |
© 2023 by the authors. Licensee MDPI, Basel, Switzerland. This article is an open access article distributed under the terms and conditions of the Creative Commons Attribution (CC BY) license (https://creativecommons.org/licenses/by/4.0/).
Share and Cite
Grundmann, S.M.; Ress, K.; Zimmermann, L.; Höring, M.; Liebisch, G.; Most, E.; Ringseis, R.; Eder, K. A High-Phosphorus Diet Moderately Alters the Lipidome and Transcriptome in the Skeletal Muscle of Adult Mice. Nutrients 2023, 15, 3734. https://doi.org/10.3390/nu15173734
Grundmann SM, Ress K, Zimmermann L, Höring M, Liebisch G, Most E, Ringseis R, Eder K. A High-Phosphorus Diet Moderately Alters the Lipidome and Transcriptome in the Skeletal Muscle of Adult Mice. Nutrients. 2023; 15(17):3734. https://doi.org/10.3390/nu15173734
Chicago/Turabian StyleGrundmann, Sarah M., Kerstin Ress, Lea Zimmermann, Marcus Höring, Gerhard Liebisch, Erika Most, Robert Ringseis, and Klaus Eder. 2023. "A High-Phosphorus Diet Moderately Alters the Lipidome and Transcriptome in the Skeletal Muscle of Adult Mice" Nutrients 15, no. 17: 3734. https://doi.org/10.3390/nu15173734
APA StyleGrundmann, S. M., Ress, K., Zimmermann, L., Höring, M., Liebisch, G., Most, E., Ringseis, R., & Eder, K. (2023). A High-Phosphorus Diet Moderately Alters the Lipidome and Transcriptome in the Skeletal Muscle of Adult Mice. Nutrients, 15(17), 3734. https://doi.org/10.3390/nu15173734


