
Genetically Predicted Vegetable Intake and Cardiovascular Diseases and Risk Factors: An Investigation with Mendelian Randomization

 , , and
Abstract
1. Introduction
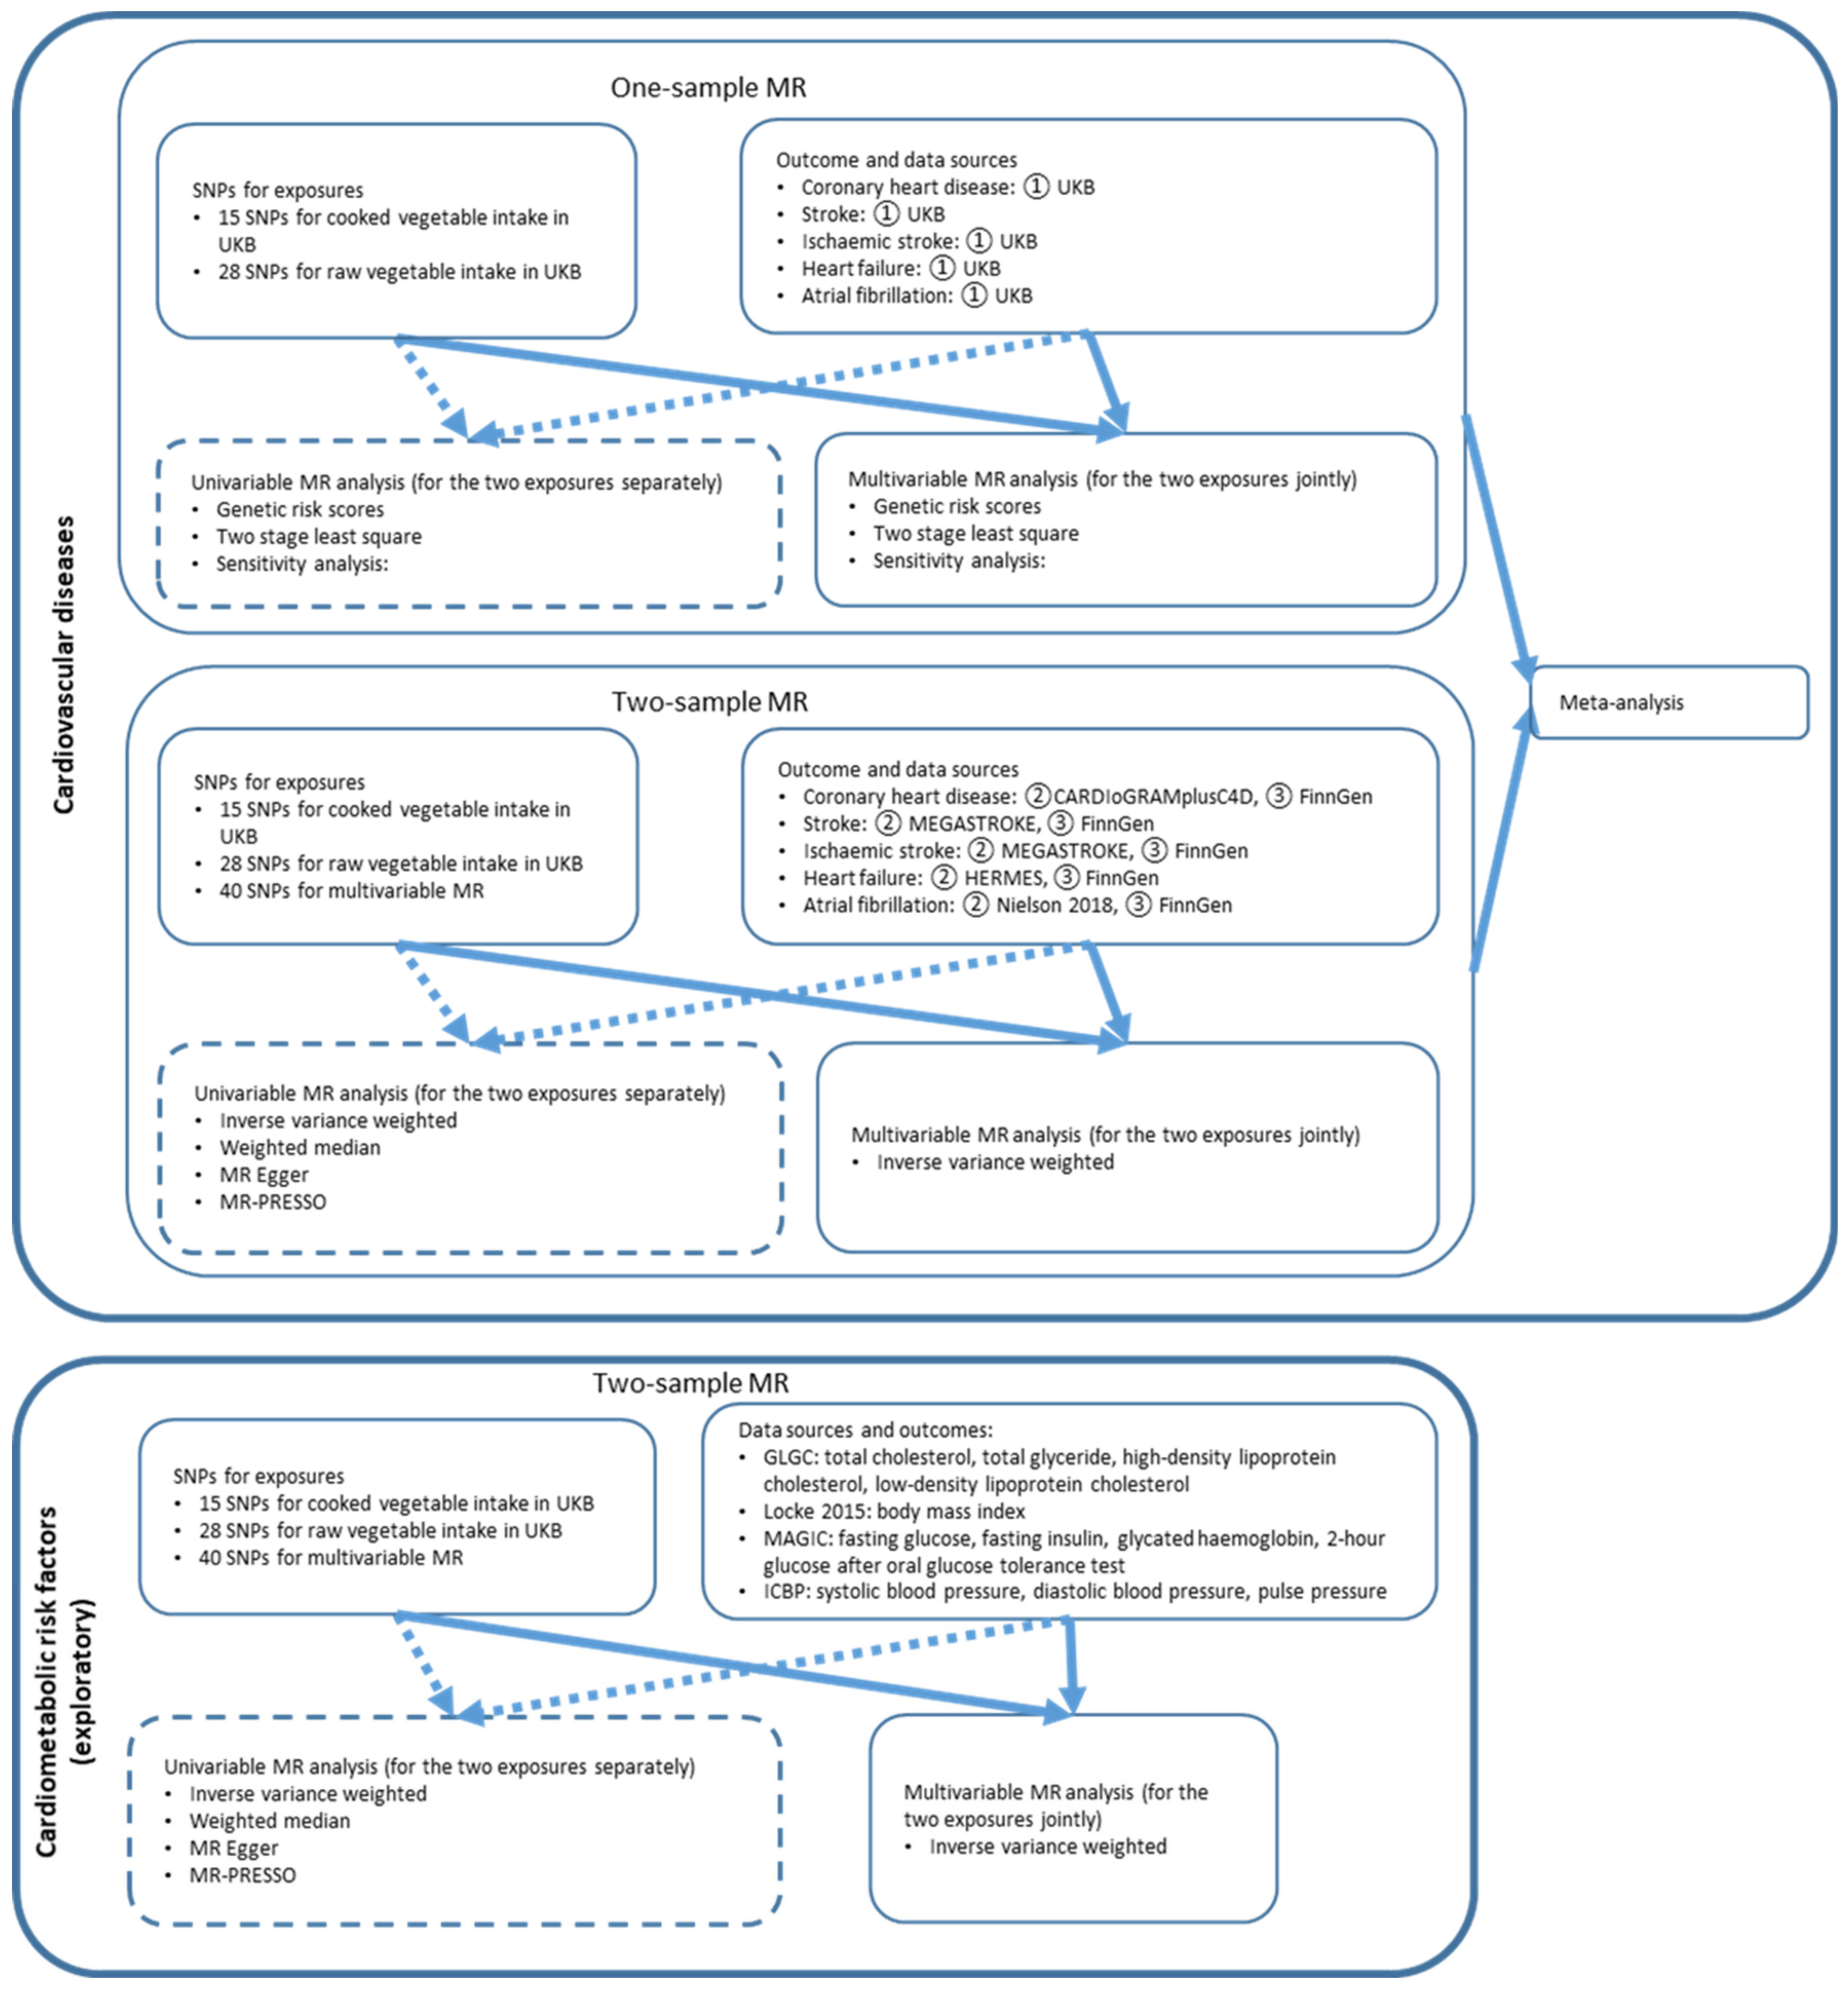
2. Methods
2.1. Genetic Instrument Selection
2.2. One-Sample MR
2.2.1. Data Source
2.2.2. Statistical Analysis
2.3. Two-Sample MR
2.3.1. Data Source
2.3.2. Statistical Analysis
2.4. Meta-Analysis
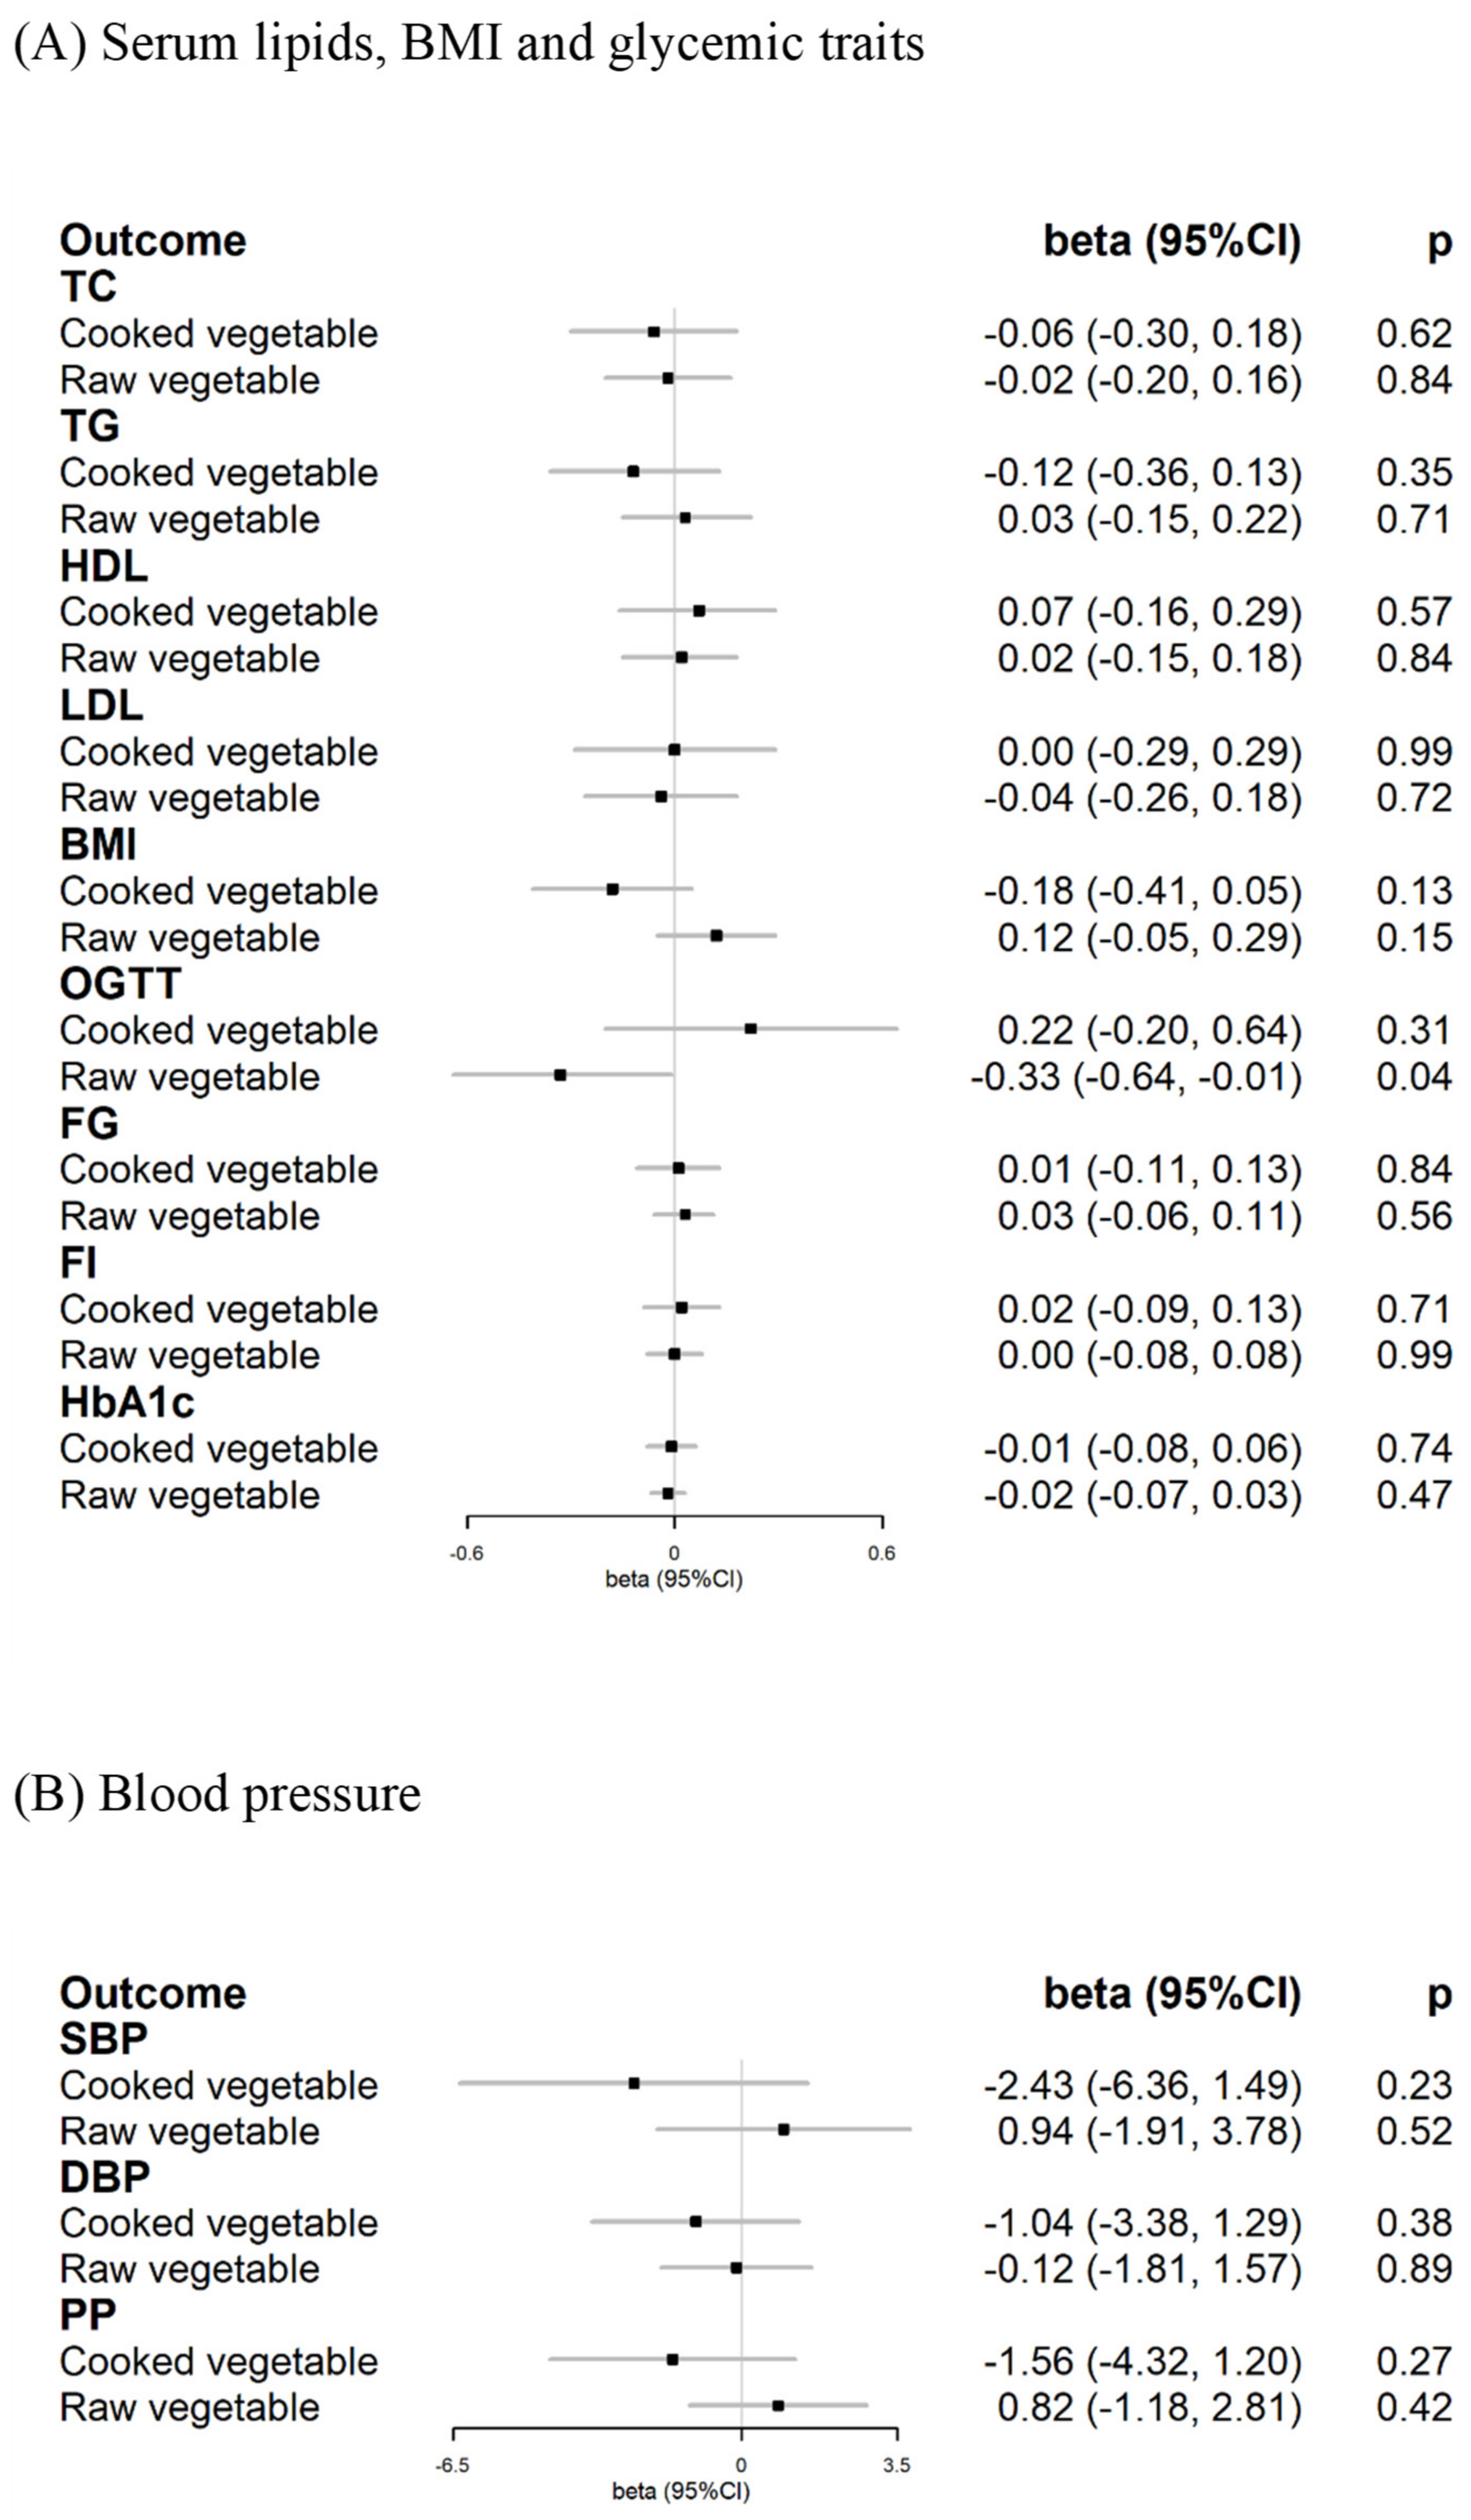
2.5. Cardiometabolic Risk Factors for Exploratory Mechanisms
3. Results
3.1. One-Sample MR
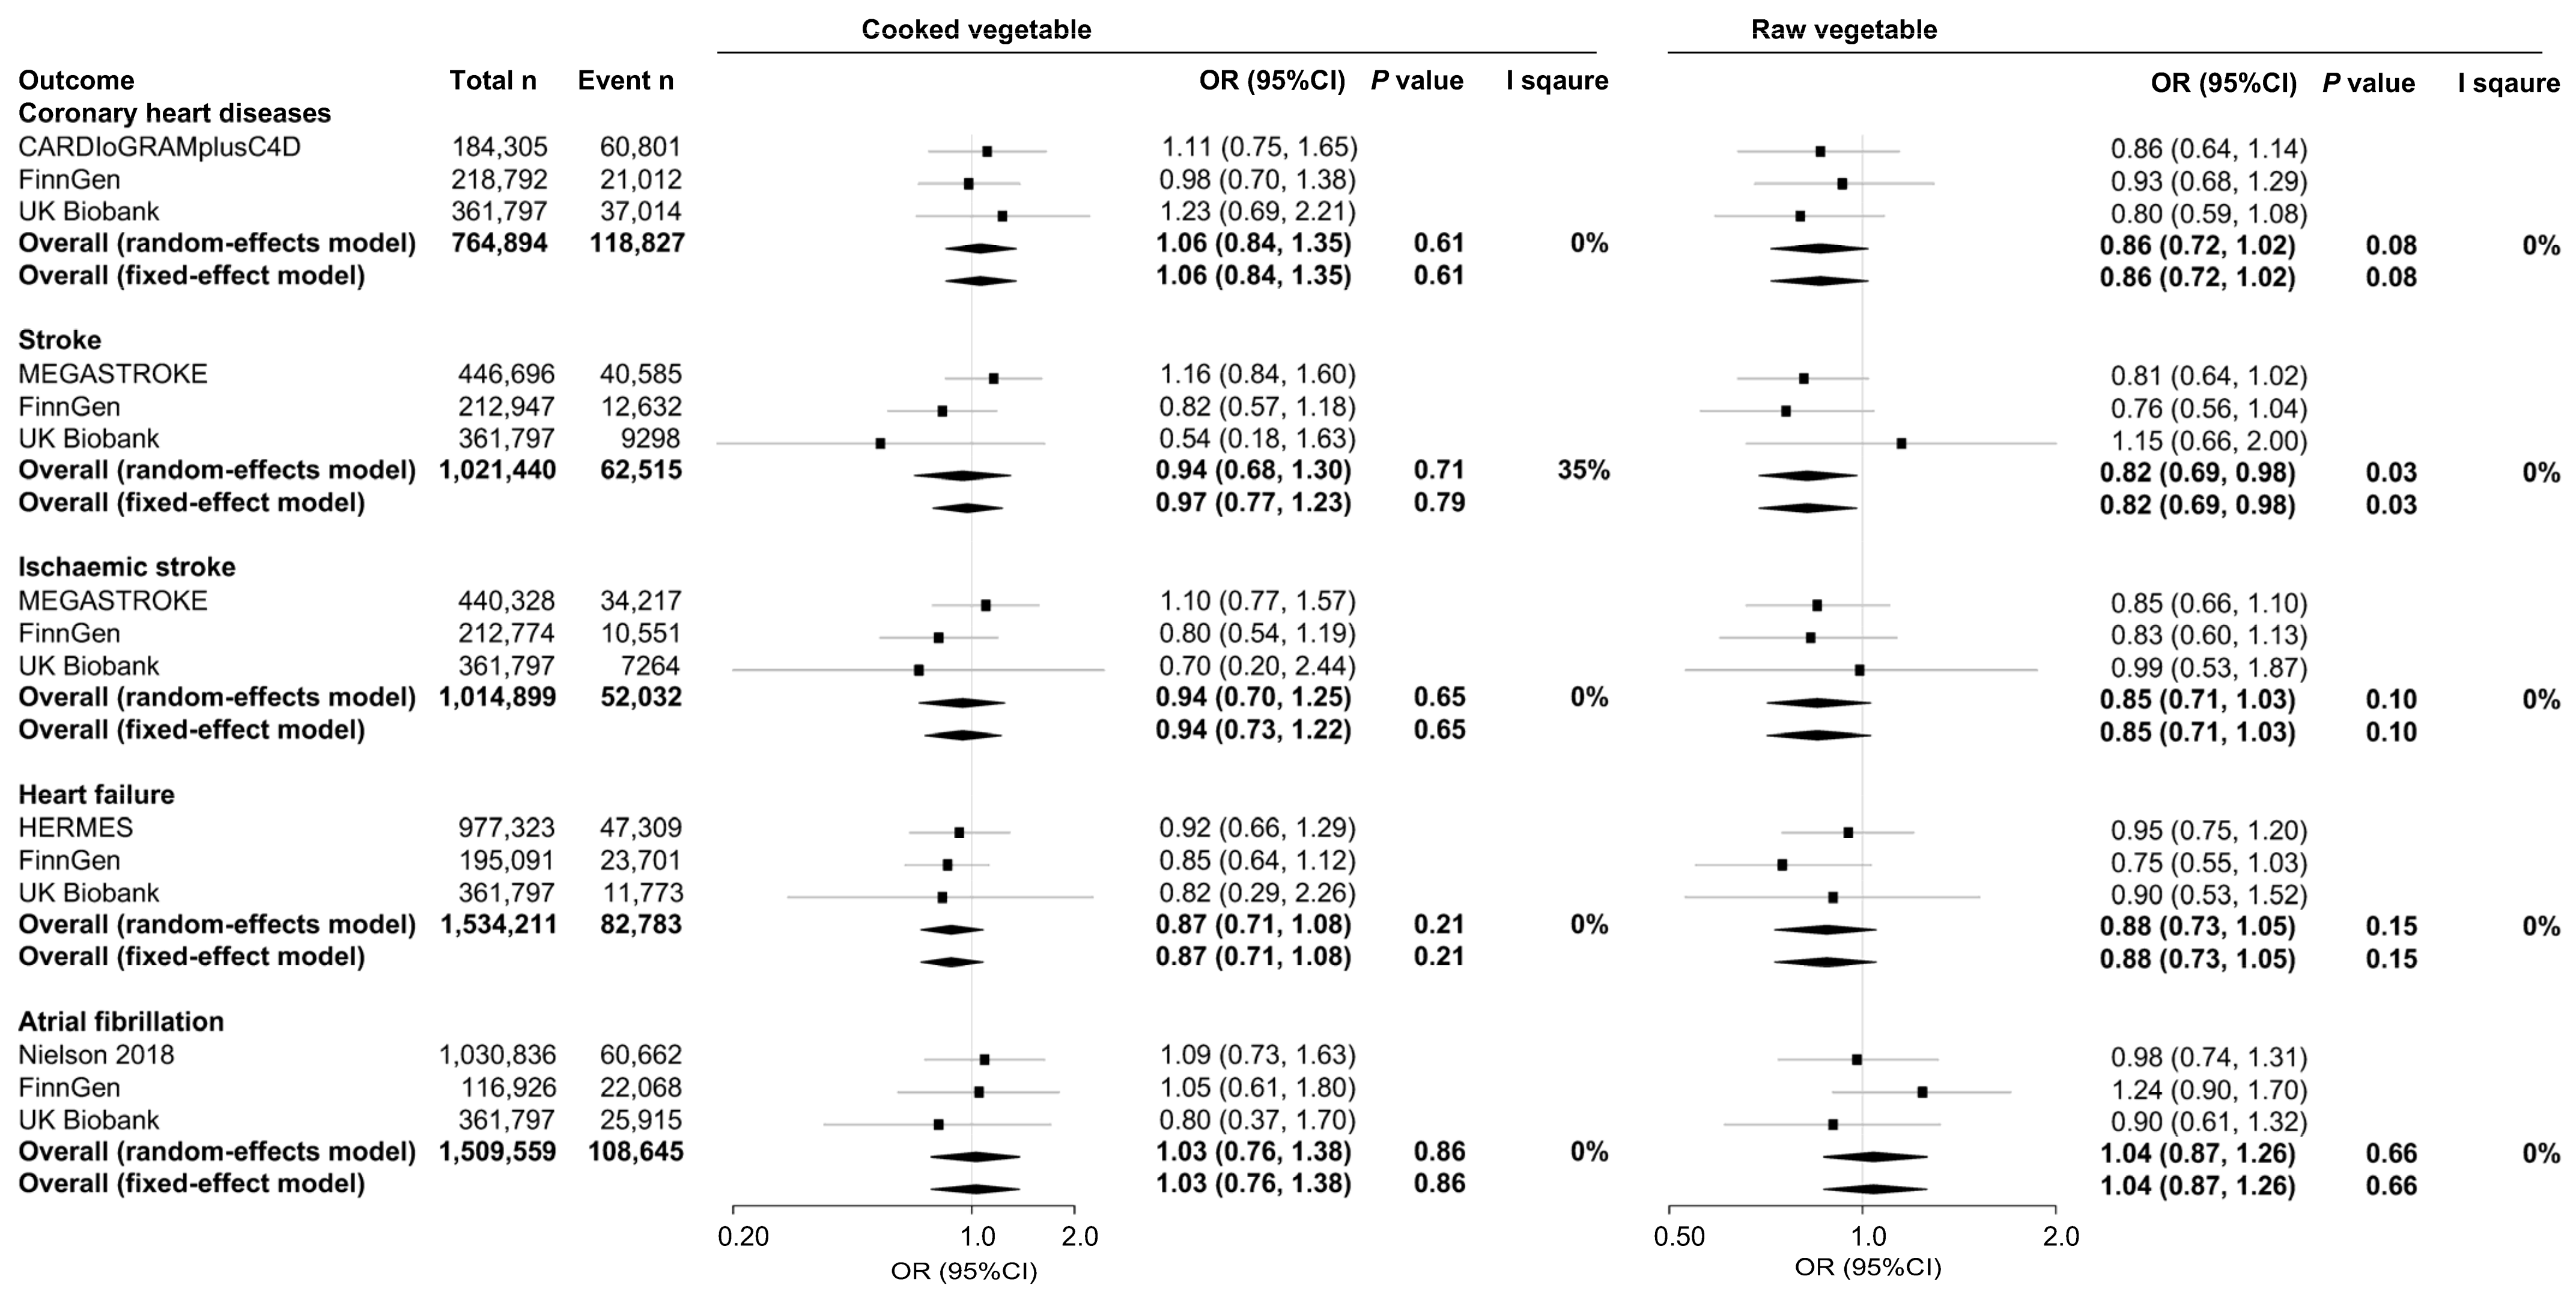
3.2. Two Sample MR
3.3. Meta-Analysis
3.4. Cardiometabolic Risk Factors for Exploratory Mechanisms
4. Discussion
5. Conclusions
Supplementary Materials
Author Contributions
Funding
Institutional Review Board Statement
Informed Consent Statement
Data Availability Statement
Acknowledgments
Conflicts of Interest
References
- Vos, T.; Lim, S.S.; Abbafati, C.; Abbas, K.M.; Abbasi, M.; Abbasifard, M.; Abbasi-Kangevari, M.; Abbastabar, H.; Abd-Allah, F.; Abdelalim, A.; et al. Global burden of 369 diseases and injuries in 204 countries and territories, 1990–2019, a systematic analysis for the Global Burden of Disease Study 2019. Lancet 2020, 396, 1204–1222. [Google Scholar] [CrossRef]
- Kathiresan, S.; Srivastava, D. Genetics of human cardiovascular disease. Cell 2012, 148, 1242–1257. [Google Scholar] [CrossRef] [PubMed]
- Roth, G.A.; Mensah, G.A.; Johnson, C.O.; Addolorato, G.; Ammirati, E.; Baddour, L.M.; Barengo, N.C.; Beaton, A.Z.; Benjamin, E.J.; Benziger, C.P.; et al. Global burden of cardiovascular diseases and risk factors, 1990–2019, update from the GBD 2019 study. J. Am. Coll. Cardiol. 2020, 76, 2982–3021. [Google Scholar] [CrossRef]
- Afshin, A.; Sur, P.J.; Fay, K.A.; Cornaby, L.; Ferrara, G.; Salama, J.S.; Mullany, E.C.; Abate, K.H.; Abbafati, C.; Abebe, Z.; et al. Health effects of dietary risks in 195 countries, 1990–2017, a systematic analysis for the Global Burden of Disease Study 2017. Lancet 2019, 393, 1958–1972. [Google Scholar] [CrossRef]
- Wallace, T.C.; Bailey, R.L.; Blumberg, J.B.; Burton-Freeman, B.; Chen, C.O.; Crowe-White, K.M.; Drewnowski, A.; Hooshmand, S.; Johnson, E.; Lewis, R.; et al. Fruits, vegetables, and health: A comprehensive narrative, umbrella review of the science and recommendations for enhanced public policy to improve intake. Crit. Rev. Food Sci. Nutr. 2020, 60, 2174–2211. [Google Scholar] [CrossRef] [PubMed]
- Mytton, O.T.; Nnoaham, K.; Eyles, H.; Scarborough, P.; Ni Mhurchu, C. Systematic review and meta-analysis of the effect of increased vegetable and fruit consumption on body weight and energy intake. BMC Public. Health 2014, 14, 886. [Google Scholar] [CrossRef] [PubMed]
- National Health Services. The Eatwell Guide. 2019. Available online: https://www.nhs.uk/live-well/eat-well/the-eatwell-guide/ (accessed on 26 November 2021).
- World Health Organization. Healthy Diet. 2020. Available online: https://www.who.int/news-room/fact-sheets/detail/healthy-diet (accessed on 26 November 2021).
- United States Department of Agriculture. Dietary Guidelines for Americans. 2020. Available online: https://www.dietaryguidelines.gov/sites/default/files/2020-12/Dietary_Guidelines_for_Americans_2020-2025.pdf (accessed on 26 November 2021).
- Zhan, J.; Liu, Y.-J.; Cai, L.-B.; Xu, F.-R.; Xie, T.; He, Q.-Q. Fruit and vegetable consumption and risk of cardiovascular disease: A meta-analysis of prospective cohort studies. Crit. Rev. Food Sci. Nutr. 2017, 57, 1650–1663. [Google Scholar] [CrossRef]
- Aune, D.; Giovannucci, E.; Boffetta, P.; Fadnes, L.T.; Keum, N.; Norat, T.; Greenwood, D.C.; Riboli, E.; Vatten, L.J.; Tonstad, S. Fruit and vegetable intake and the risk of cardiovascular disease, total cancer and all-cause mortality-a systematic review and dose-response meta-analysis of prospective studies. Int. J. Epidemiol. 2017, 46, 1029–1056. [Google Scholar] [CrossRef]
- Miller, V.; Mente, A.; Dehghan, M.; Rangarajan, S.; Zhang, X.; Swaminathan, S.; Dagenais, G.; Gupta, R.; Mohan, V.; Lear, S.; et al. Fruit, vegetable, and legume intake, and cardiovascular disease and deaths in 18 countries (PURE): A prospective cohort study. Lancet 2017, 390, 2037–2049. [Google Scholar] [CrossRef]
- Wang, D.D.; Li, Y.; Bhupathiraju, S.N.; Rosner, B.A.; Sun, Q.; Giovannucci, E.L.; Rimm, E.B.; Manson, J.E.; Willett, W.C.; Stampfer, M.J.; et al. Fruit and vegetable intake and mortality: Results from 2 prospective cohort studies of US men and women and a meta-analysis of 26 cohort studies. Circulation 2021, 143, 1642–1654. [Google Scholar] [CrossRef]
- Leenders, M.; Sluijs, I.; Ros, M.M.; Boshuizen, H.C.; Siersema, P.D.; Ferrari, P.; Weikert, C.; Tjønneland, A.; Olsen, A.; Boutron-Ruault, M.-C.; et al. Fruit and vegetable consumption and mortality. Am. J. Epidemiol. 2013, 178, 590–602. [Google Scholar] [CrossRef] [PubMed]
- Wang, J.; Geng, L. Effects of Socioeconomic Status on Physical and Psychological Health: Lifestyle as a Mediator. Int. J. Environ. Res. Public Health 2019, 16, 281. [Google Scholar] [CrossRef] [PubMed]
- Feng, Q.; Kim, J.H.; Omiyale, W.; Bešević, J.; Conroy, M.; May, M.; Yang, Z.; Wong, S.Y.-S.; Tsoi, K.K.-F.; Allen, N.; et al. Raw and cooked Vegetable consumption and risk of cardiovascular disease: A Study of 400,000 adults in UK Biobank. Front. Nutr. 2022, 9, 831470. [Google Scholar] [CrossRef] [PubMed]
- Shin, J.Y.; Kim, J.Y.; Kang, H.T.; Han, K.H.; Shim, J.Y. Effect of fruits and vegetables on metabolic syndrome: A systematic review and meta-analysis of randomized controlled trials. Int. J. Food Sci. Nutr. 2015, 66, 416–425. [Google Scholar] [CrossRef] [PubMed]
- Davey Smith, G.; Hemani, G. Mendelian randomization: Genetic anchors for causal inference in epidemiological studies. Hum. Mol. Genet. 2014, 23, R89–R98. [Google Scholar] [CrossRef] [PubMed]
- Wade, K.H.; Yarmolinsky, J.; Giovannucci, E.; Lewis, S.J.; Millwood, I.Y.; Munafò, M.R.; Meddens, F.; Burrows, K.; Bell, J.A.; Davies, N.M.; et al. Applying Mendelian randomization to appraise causality in relationships between nutrition and cancer. Cancer Causes Control. 2022, 33, 631–652. [Google Scholar] [CrossRef] [PubMed]
- Niarchou, M.; Byrne, E.M.; Trzaskowski, M.; Sidorenko, J.; Kemper, K.E.; McGrath, J.J.; Donovan, M.C.O.; Owen, M.J.; Wray, N.R. Genome-wide association study of dietary intake in the UK biobank study and its associations with schizophrenia and other traits. Transl. Psychiatry 2020, 10, 51. [Google Scholar] [CrossRef] [PubMed]
- Cole, J.B.; Florez, J.C.; Hirschhorn, J.N. Comprehensive genomic analysis of dietary habits in UK Biobank identifies hundreds of genetic associations. Nat. Commun. 2020, 11, 1467. [Google Scholar] [CrossRef]
- Canela-Xandri, O.; Rawlik, K.; Tenesa, A. An atlas of genetic associations in UK Biobank. Nat. Genet. 2018, 50, 1593–1599. [Google Scholar] [CrossRef]
- Bradbury, K.E.; Young, H.J.; Guo, W.; Key, T.J. Dietary assessment in UK Biobank: An evaluation of the performance of the touchscreen dietary questionnaire. J. Nutr. Sci. 2018, 7, e6. [Google Scholar] [CrossRef]
- Park, S.; Lee, S.; Kim, Y.; Lee, Y.; Kang, M.W.; Kim, K.; Kim, Y.C.; Han, S.S.; Lee, H.; Lee, J.P.; et al. Observational or genetically predicted higher vegetable intake and kidney function impairment: An integrated population-scale cross-sectional analysis and Mendelian randomization study. J. Nutr. 2021, 151, 1167–1174. [Google Scholar] [CrossRef] [PubMed]
- Pierce, B.L.; Ahsan, H.; VanderWeele, T.J. Power and instrument strength requirements for Mendelian randomization studies using multiple genetic variants. Int. J. Epidemiol. 2011, 40, 740–752. [Google Scholar] [CrossRef] [PubMed]
- Allen, N.; Sudlow, C.; Downey, P.; Peakman, T.; Danesh, J.; Elliott, P.; Gallacher, J.; Green, J.; Matthews, P.; Pell, J.; et al. UK Biobank: Current status and what it means for epidemiology. Health Policy Technol. 2012, 1, 123–126. [Google Scholar] [CrossRef]
- Bycroft, C.; Freeman, C.; Petkova, D.; Band, G.; Elliott, L.T.; Sharp, K.; Motyer, A.; Vukcevic, D.; Delaneau, O.; O’connell, J.; et al. The UK Biobank resource with deep phenotyping and genomic data. Nature 2018, 562, 203–209. [Google Scholar] [CrossRef] [PubMed]
- Burgess, S.; Davey Smith, G.; Davies, N.M.; Dudbridge, F.; Gill, D.; Glymour, M.M.; Hartwig, F.P.; Holmes, M.V.; Minelli, C.; Relton, C.L.; et al. Guidelines for performing Mendelian randomization investigations. Wellcome Open Res. 2020, 4, 186. [Google Scholar] [CrossRef]
- Sun, Y.-Q.; Burgess, S.; Staley, J.R.; Wood, A.M.; Bell, S.; Kaptoge, S.K.; Guo, Q.; Bolton, T.R.; Mason, A.M.; Butterworth, A.S.; et al. Body mass index and all cause mortality in HUNT and UK Biobank studies: Linear and non-linear mendelian randomisation analyses. BMJ 2019, 364, l1042. [Google Scholar] [CrossRef]
- Nikpay, M.; Goel, A.; Won, H.-H.; Hall, L.M.; Willenborg, C.; Kanoni, S.; Saleheen, D.; Kyriakou, T.; Nelson, C.P.; Hopewell, J.C.; et al. A comprehensive 1000 Genomes-based genome-wide association meta-analysis of coronary artery disease. Nat. Genet. 2015, 47, 1121–1130. [Google Scholar] [CrossRef]
- Malik, R.; Chauhan, G.; Traylor, M.; Sargurupremraj, M.; Okada, Y.; Mishra, A.; Rutten-Jacobs, L.; Giese, A.-K.; van der Laan, S.W.; Gretarsdottir, S.; et al. Multiancestry genome-wide association study of 520,000 subjects identifies 32 loci associated with stroke and stroke subtypes. Nat. Genet. 2018, 50, 524–537. [Google Scholar] [CrossRef]
- Shah, S.; Henry, A.; Roselli, C.; Lin, H.; Sveinbjörnsson, G.; Fatemifar, G.; Hedman, K.; Wilk, J.B.; Morley, M.P.; Chaffin, M.D.; et al. Genome-wide association and Mendelian randomisation analysis provide insights into the pathogenesis of heart failure. Nat. Commun. 2020, 11, 163. [Google Scholar] [CrossRef]
- Nielsen, J.B.; Thorolfsdottir, R.B.; Fritsche, L.G.; Zhou, W.; Skov, M.W.; Graham, S.E.; Herron, T.J.; McCarthy, S.; Schmidt, E.M.; Sveinbjornsson, G.; et al. Biobank-driven genomic discovery yields new insight into atrial fibrillation biology. Nat. Genet. 2018, 50, 1234–1239. [Google Scholar] [CrossRef]
- FinnGen. FinnGen Consortium (Release 5). 2021. Available online: https://r5.finngen.fi/ (accessed on 26 November 2021).
- Hartwig, F.P.; Davies, N.M.; Hemani, G.; Davey Smith, G. Two-sample Mendelian randomization: Avoiding the downsides of a powerful, widely applicable but potentially fallible technique. Int. J. Epidemiol. 2016, 45, 1717–1726. [Google Scholar] [CrossRef] [PubMed]
- Zheng, J.; Baird, D.; Borges, M.-C.; Bowden, J.; Hemani, G.; Haycock, P.; Evans, D.M.; Smith, G.D. Recent developments in Mendelian randomization studies. Curr. Epidemiol. Rep. 2017, 4, 330–345. [Google Scholar] [CrossRef] [PubMed]
- Bowden, J.; Davey Smith, G.; Haycock, P.C.; Burgess, S. Consistent estimation in Mendelian randomization with some invalid instruments using a weighted median estimator. Genet. Epidemiol. 2016, 40, 304–314. [Google Scholar] [CrossRef]
- Verbanck, M.; Chen, C.-Y.; Neale, B.; Do, R. Detection of widespread horizontal pleiotropy in causal relationships inferred from Mendelian randomization between complex traits and diseases. Nat. Genet. 2018, 50, 693–698. [Google Scholar] [CrossRef]
- Burgess, S.; Davies, N.M.; Thompson, S.G. Bias due to participant overlap in two-sample Mendelian randomization. Genet. Epidemiol. 2016, 40, 597–608. [Google Scholar] [CrossRef] [PubMed]
- Global Lipids Genetics Consortium. Discovery and refinement of loci associated with lipid levels. Nat. Genet. 2013, 45, 1274–1283. [Google Scholar] [CrossRef] [PubMed]
- Locke, A.E.; Kahali, B.; Berndt, S.I.; Justice, A.E.; Pers, T.H.; Day, F.R.; Powell, C.; Vedantam, S.; Buchkovich, M.L.; Yang, J.; et al. Genetic studies of body mass index yield new insights for obesity biology. Nature 2015, 518, 197–206. [Google Scholar] [CrossRef]
- Chen, J.; Spracklen, C.N.; Marenne, G.; Varshney, A.; Corbin, L.J.; Luan, J.; Willems, S.M.; Wu, Y.; Zhang, X.; Horikoshi, M.; et al. The trans-ancestral genomic architecture of glycemic traits. Nat. Genet. 2021, 53, 840–860. [Google Scholar] [CrossRef]
- Wain, L.V.; Vaez, A.; Jansen, R.; Joehanes, R.; van der Most, P.J.; Erzurumluoglu, A.M.; O’reilly, P.F.; Cabrera, C.P.; Warren, H.R.; Rose, L.M.; et al. Novel blood pressure locus and gene discovery using genome-wide association study and expression data sets from blood and the kidney. Hypertension 2017, 70, e4–e19. [Google Scholar] [CrossRef]
- Woodside, J.V.; Young, I.S.; McKinley, M.C. Fruit and vegetable intake and risk of cardiovascular disease. Proc. Nutr. Soc. 2013, 72, 399–406. [Google Scholar] [CrossRef]
- Hartley, L.; Igbinedion, E.; Holmes, J.; Flowers, N.; Thorogood, M.; Clarke, A.; Stranges, S.; Hooper, L.; Rees, K. Increased consumption of fruit and vegetables for the primary prevention of cardiovascular diseases. Cochrane Database Syst. Rev. 2013, 2021, CD009874. [Google Scholar] [CrossRef]
- Lawlor, D.A. Vitamin C is not associated with coronary heart disease risk once life course socioeconomic position is taken into account: Prospective findings from the British women’s heart and health study. Heart 2005, 91, 1086–1087. [Google Scholar] [CrossRef] [PubMed]
- Burgess, S.; Thompson, S.G. Multivariable Mendelian randomization: The use of pleiotropic genetic variants to estimate causal effects. Am. J. Epidemiol. 2015, 181, 251–260. [Google Scholar] [CrossRef] [PubMed]
- Schatzkin, A.; Abnet, C.C.; Cross, A.J.; Gunter, M.; Pfeiffer, R.; Gail, M.; Lim, U.; Davey-Smith, G. Mendelian Randomization: How It Can—And Cannot—Help Confirm Causal Relations between Nutrition and Cancer. Cancer Prev. Res. 2009, 2, 104–113. [Google Scholar] [CrossRef] [PubMed][Green Version]
- Slavin, J.L.; Lloyd, B. Health benefits of fruits and vegetables. Adv. Nutr. 2012, 3, 506–516. [Google Scholar] [CrossRef] [PubMed]
- Baldrick, F.R.; Woodside, J.V.; Elborn, J.S.; Young, I.S.; McKinley, M.C. Biomarkers of fruit and vegetable intake in human intervention studies: A systematic review. Crit. Rev. Food Sci. Nutr. 2011, 51, 795–815. [Google Scholar] [CrossRef] [PubMed]
- Kobylecki, C.J.; Afzal, S.; Davey Smith, G.; Nordestgaard, B.G. Genetically high plasma vitamin C, intake of fruit and vegetables, and risk of ischemic heart disease and all-cause mortality: A Mendelian randomization study. Am. J. Clin. Nutr. 2015, 101, 1135–1143. [Google Scholar] [CrossRef]
- Zhu, J.; Ling, Y.; Tse, L.A.; Kinra, S.; Li, Y. Circulating vitamin C and the risk of cardiovascular diseases: A Mendelian randomization study. Nutr. Metab. Cardiovasc. Dis. 2021, 31, 2398–2406. [Google Scholar] [CrossRef]
- Luo, J.; le Cessie, S.; van Heemst, D.; Noordam, R. Diet-derived circulating antioxidants and risk of coronary heart disease. J. Am. Coll. Cardiol. 2021, 77, 45–54. [Google Scholar] [CrossRef]
- Martens, L.G.; Luo, J.; Willems van Dijk, K.; Jukema, J.W.; Noordam, R.; van Heemst, D. Diet-derived antioxidants do not decrease risk of ischemic stroke: A Mendelian randomization study in 1 million people. J. Am. Heart Assoc. 2021, 10, e022567. [Google Scholar] [CrossRef]
- Liu, R.H. Health benefits of fruit and vegetables are from additive and synergistic combinations of phytochemicals. Am. J. Clin. Nutr. 2003, 78, 517S–520S. [Google Scholar] [CrossRef]
- Labrecque, J.A.; Swanson, S.A. Interpretation and Potential Biases of Mendelian Randomization Estimates with Time-Varying Exposures. Am. J. Epidemiol. 2019, 188, 231–238. [Google Scholar] [CrossRef]
- Schulze, M.B.; Martínez-González, M.A.; Fung, T.T.; Lichtenstein, A.H.; Forouhi, N.G. Food based dietary patterns and chronic disease prevention. BMJ 2018, 361, k2396. [Google Scholar] [CrossRef]
- Tapsell, L.C.; Neale, E.P.; Satija, A.; Hu, F.B. Foods, nutrients, and dietary patterns: Interconnections and implications for dietary guidelines. Adv. Nutr. 2016, 7, 445–454. [Google Scholar] [CrossRef]
- Oude Griep, L.; Verschuren, W.M.M.; Kromhout, D.; Ocké, M.C.; Geleijnse, J.M. Raw and processed fruit and vegetable consumption and 10-year stroke incidence in a population-based cohort study in the Netherlands. Eur. J. Clin. Nutr. 2011, 65, 791–799. [Google Scholar] [CrossRef]


| SNPs | Chromo-Some | Position | Effect Allele | Other Allele | Effect Allele Frequency | Beta | Standard Error | p-Value | F-Statistic | Nearest Gene |
|---|---|---|---|---|---|---|---|---|---|---|
| Cooked vegetable intake | ||||||||||
| rs1534749 | 1 | 190028576 | C | T | 0.470 | −0.017 | 0.003 | 2.15 × 10⁻⁷ | 26.895 | BRINP3 |
| rs3001363 | 1 | 154125067 | T | C | 0.489 | −0.018 | 0.003 | 2.68 × 10⁻⁸ | 30.929 | NUP210L |
| rs113993820 | 2 | 102766634 | T | G | 0.019 | −0.061 | 0.012 | 3.53 × 10⁻⁷ | 25.939 | IL1R1 |
| rs2102738 | 2 | 172525884 | C | A | 0.172 | −0.023 | 0.004 | 1.15 × 10⁻⁷ | 28.098 | DYNC1I2 |
| rs442291 | 2 | 79676305 | C | T | 0.389 | 0.023 | 0.003 | 4.03 × 10⁻¹² | 48.113 | CTNNA2 |
| rs17653477 | 3 | 71170319 | G | A | 0.031 | −0.046 | 0.009 | 1.31 × 10⁻⁶ | 23.415 | FOXP1 |
| rs10020708 | 4 | 178097496 | A | C | 0.494 | −0.015 | 0.003 | 2.52 × 10⁻⁶ | 22.156 | NEIL3 |
| rs17714824 | 5 | 158254070 | T | G | 0.175 | 0.024 | 0.004 | 1.36 × 10⁻⁸ | 32.245 | EBF1, FABP6 |
| rs33947258 | 5 | 141194870 | A | C | 0.261 | 0.023 | 0.004 | 5.01 × 10⁻¹⁰ | 38.673 | PCDH1 |
| rs12190945 | 6 | 84162042 | G | A | 0.296 | −0.015 | 0.004 | 2.46 × 10⁻⁵ | 17.791 | ME1 |
| rs6975898 | 7 | 4540687 | G | T | 0.376 | −0.017 | 0.003 | 5.61 × 10⁻⁷ | 25.044 | FOXK1 |
| rs11995369 | 8 | 89649177 | C | T | 0.202 | 0.023 | 0.004 | 2.40 × 10⁻⁸ | 31.142 | MMP16 |
| rs10156602 | 9 | 96345328 | G | A | 0.362 | 0.020 | 0.003 | 4.66 × 10⁻⁹ | 34.329 | PHF2 |
| rs10161952 | 13 | 59474383 | C | A | 0.313 | −0.017 | 0.004 | 2.60 × 10⁻⁶ | 22.093 | DIAPH3 |
| rs6420335 | 13 | 69556727 | G | C | 0.467 | −0.018 | 0.003 | 3.07 × 10⁻⁸ | 30.665 | KLHL1 |
| Raw vegetable intake | ||||||||||
| rs11209780 | 1 | 71876652 | A | G | 0.216 | −0.025 | 0.005 | 1.33 × 10⁻⁷ | 27.821 | NEGR1 |
| rs3001363 | 1 | 154125067 | T | C | 0.489 | −0.025 | 0.004 | 9.01 × 10⁻¹¹ | 42.028 | NUP210L |
| rs3828120 | 1 | 82434387 | A | T | 0.328 | 0.023 | 0.004 | 1.20 × 10⁻⁸ | 32.494 | ADGRL2 |
| rs11125813 | 2 | 59991047 | A | G | 0.219 | 0.023 | 0.005 | 7.26 × 10⁻⁷ | 24.546 | BCL11A |
| rs4281874 | 2 | 176451226 | T | C | 0.265 | 0.023 | 0.004 | 1.14 × 10⁻⁷ | 28.127 | LNPK |
| rs442291 | 2 | 79676305 | C | T | 0.389 | 0.023 | 0.004 | 2.49 × 10⁻⁹ | 35.549 | CTNNA2 |
| rs78940216 | 2 | 27153318 | A | G | 0.111 | −0.030 | 0.006 | 9.70 × 10⁻⁷ | 23.988 | DPYSL5 |
| rs12630752 | 3 | 44303185 | G | A | 0.234 | −0.023 | 0.005 | 3.73 × 10⁻⁷ | 25.829 | TOPAZ1 |
| rs17075255 | 5 | 164759108 | T | C | 0.234 | −0.028 | 0.005 | 6.98 × 10⁻¹⁰ | 38.027 | MAT2B |
| rs2915858 | 5 | 166542621 | G | A | 0.432 | 0.022 | 0.004 | 8.80 × 10⁻⁹ | 33.092 | TENM2 |
| rs62380935 | 5 | 137723585 | G | A | 0.215 | 0.026 | 0.005 | 3.44 × 10⁻⁸ | 30.442 | KDM3B |
| rs9359954 | 6 | 92318594 | G | T | 0.479 | 0.017 | 0.004 | 5.93 × 10⁻⁶ | 20.509 | MAP3K7 |
| rs57221424 | 7 | 35215670 | G | C | 0.322 | 0.024 | 0.004 | 3.28 × 10⁻⁹ | 35.011 | DPY19L2 |
| rs6958768 | 7 | 77773693 | C | A | 0.167 | −0.026 | 0.005 | 6.78 × 10⁻⁷ | 24.677 | MAGI2 |
| rs13255011 | 8 | 35051793 | T | C | 0.479 | 0.021 | 0.004 | 6.54 × 10⁻⁸ | 29.197 | UNC5D |
| rs13267577 | 8 | 4847469 | T | C | 0.381 | −0.024 | 0.004 | 1.05 × 10⁻⁹ | 37.239 | CSMD1 |
| rs1520919 | 8 | 64696606 | A | G | 0.299 | −0.026 | 0.004 | 7.55 × 10⁻¹⁰ | 37.873 | YTHDF3 |
| rs687135 | 9 | 37257202 | T | C | 0.454 | −0.021 | 0.004 | 3.55 × 10⁻⁸ | 30.386 | ZCCHC7 |
| rs7857380 | 9 | 128555022 | C | A | 0.365 | −0.027 | 0.004 | 1.26 × 10⁻¹¹ | 45.877 | PBX3 |
| rs67497633 | 10 | 103815495 | A | G | 0.169 | 0.029 | 0.005 | 1.69 × 10⁻⁸ | 31.827 | ARMH3 |
| rs11608727 | 12 | 110060984 | G | T | 0.196 | −0.026 | 0.005 | 6.77 × 10⁻⁸ | 29.131 | MVK |
| rs10161952 | 13 | 59474383 | C | A | 0.313 | −0.021 | 0.004 | 1.95 × 10⁻⁷ | 27.082 | DIAPH3 |
| rs77797947 | 13 | 56160164 | A | C | 0.033 | 0.051 | 0.012 | 9.28 × 10⁻⁶ | 19.655 | PRR20A |
| rs9323534 | 14 | 20586432 | T | C | 0.433 | −0.022 | 0.004 | 2.00 × 10⁻⁸ | 31.493 | OR4K17 |
| rs1437761 | 15 | 97010698 | C | T | 0.249 | −0.023 | 0.004 | 1.13 × 10⁻⁷ | 28.132 | NR2F2 |
| rs956362 | 15 | 35927655 | G | A | 0.212 | 0.020 | 0.005 | 2.40 × 10⁻⁵ | 17.841 | DPH6 |
| rs2447090 | 17 | 2298974 | G | A | 0.361 | −0.018 | 0.004 | 4.81 × 10⁻⁶ | 20.911 | MNT |
| rs6079589 | 20 | 14850762 | T | C | 0.218 | −0.025 | 0.005 | 3.09 × 10⁻⁸ | 30.652 | MACROD2 |
Disclaimer/Publisher’s Note: The statements, opinions and data contained in all publications are solely those of the individual author(s) and contributor(s) and not of MDPI and/or the editor(s). MDPI and/or the editor(s) disclaim responsibility for any injury to people or property resulting from any ideas, methods, instructions or products referred to in the content. |
© 2023 by the authors. Licensee MDPI, Basel, Switzerland. This article is an open access article distributed under the terms and conditions of the Creative Commons Attribution (CC BY) license (https://creativecommons.org/licenses/by/4.0/).
Share and Cite
Feng, Q.; Grant, A.J.; Yang, Q.; Burgess, S.; Bešević, J.; Conroy, M.; Omiyale, W.; Sun, Y.; Allen, N.; Lacey, B. Genetically Predicted Vegetable Intake and Cardiovascular Diseases and Risk Factors: An Investigation with Mendelian Randomization. Nutrients 2023, 15, 3682. https://doi.org/10.3390/nu15173682
Feng Q, Grant AJ, Yang Q, Burgess S, Bešević J, Conroy M, Omiyale W, Sun Y, Allen N, Lacey B. Genetically Predicted Vegetable Intake and Cardiovascular Diseases and Risk Factors: An Investigation with Mendelian Randomization. Nutrients. 2023; 15(17):3682. https://doi.org/10.3390/nu15173682
Chicago/Turabian StyleFeng, Qi, Andrew J. Grant, Qian Yang, Stephen Burgess, Jelena Bešević, Megan Conroy, Wemimo Omiyale, Yangbo Sun, Naomi Allen, and Ben Lacey. 2023. "Genetically Predicted Vegetable Intake and Cardiovascular Diseases and Risk Factors: An Investigation with Mendelian Randomization" Nutrients 15, no. 17: 3682. https://doi.org/10.3390/nu15173682
APA StyleFeng, Q., Grant, A. J., Yang, Q., Burgess, S., Bešević, J., Conroy, M., Omiyale, W., Sun, Y., Allen, N., & Lacey, B. (2023). Genetically Predicted Vegetable Intake and Cardiovascular Diseases and Risk Factors: An Investigation with Mendelian Randomization. Nutrients, 15(17), 3682. https://doi.org/10.3390/nu15173682