
Lifestyle Modification: Evaluation of the Effects of Physical Activity and Low-Glycemic-Index Mediterranean Diet on Fibrosis Score
 , , , ,
  and
and
Abstract
1. Introduction
2. Materials and Methods
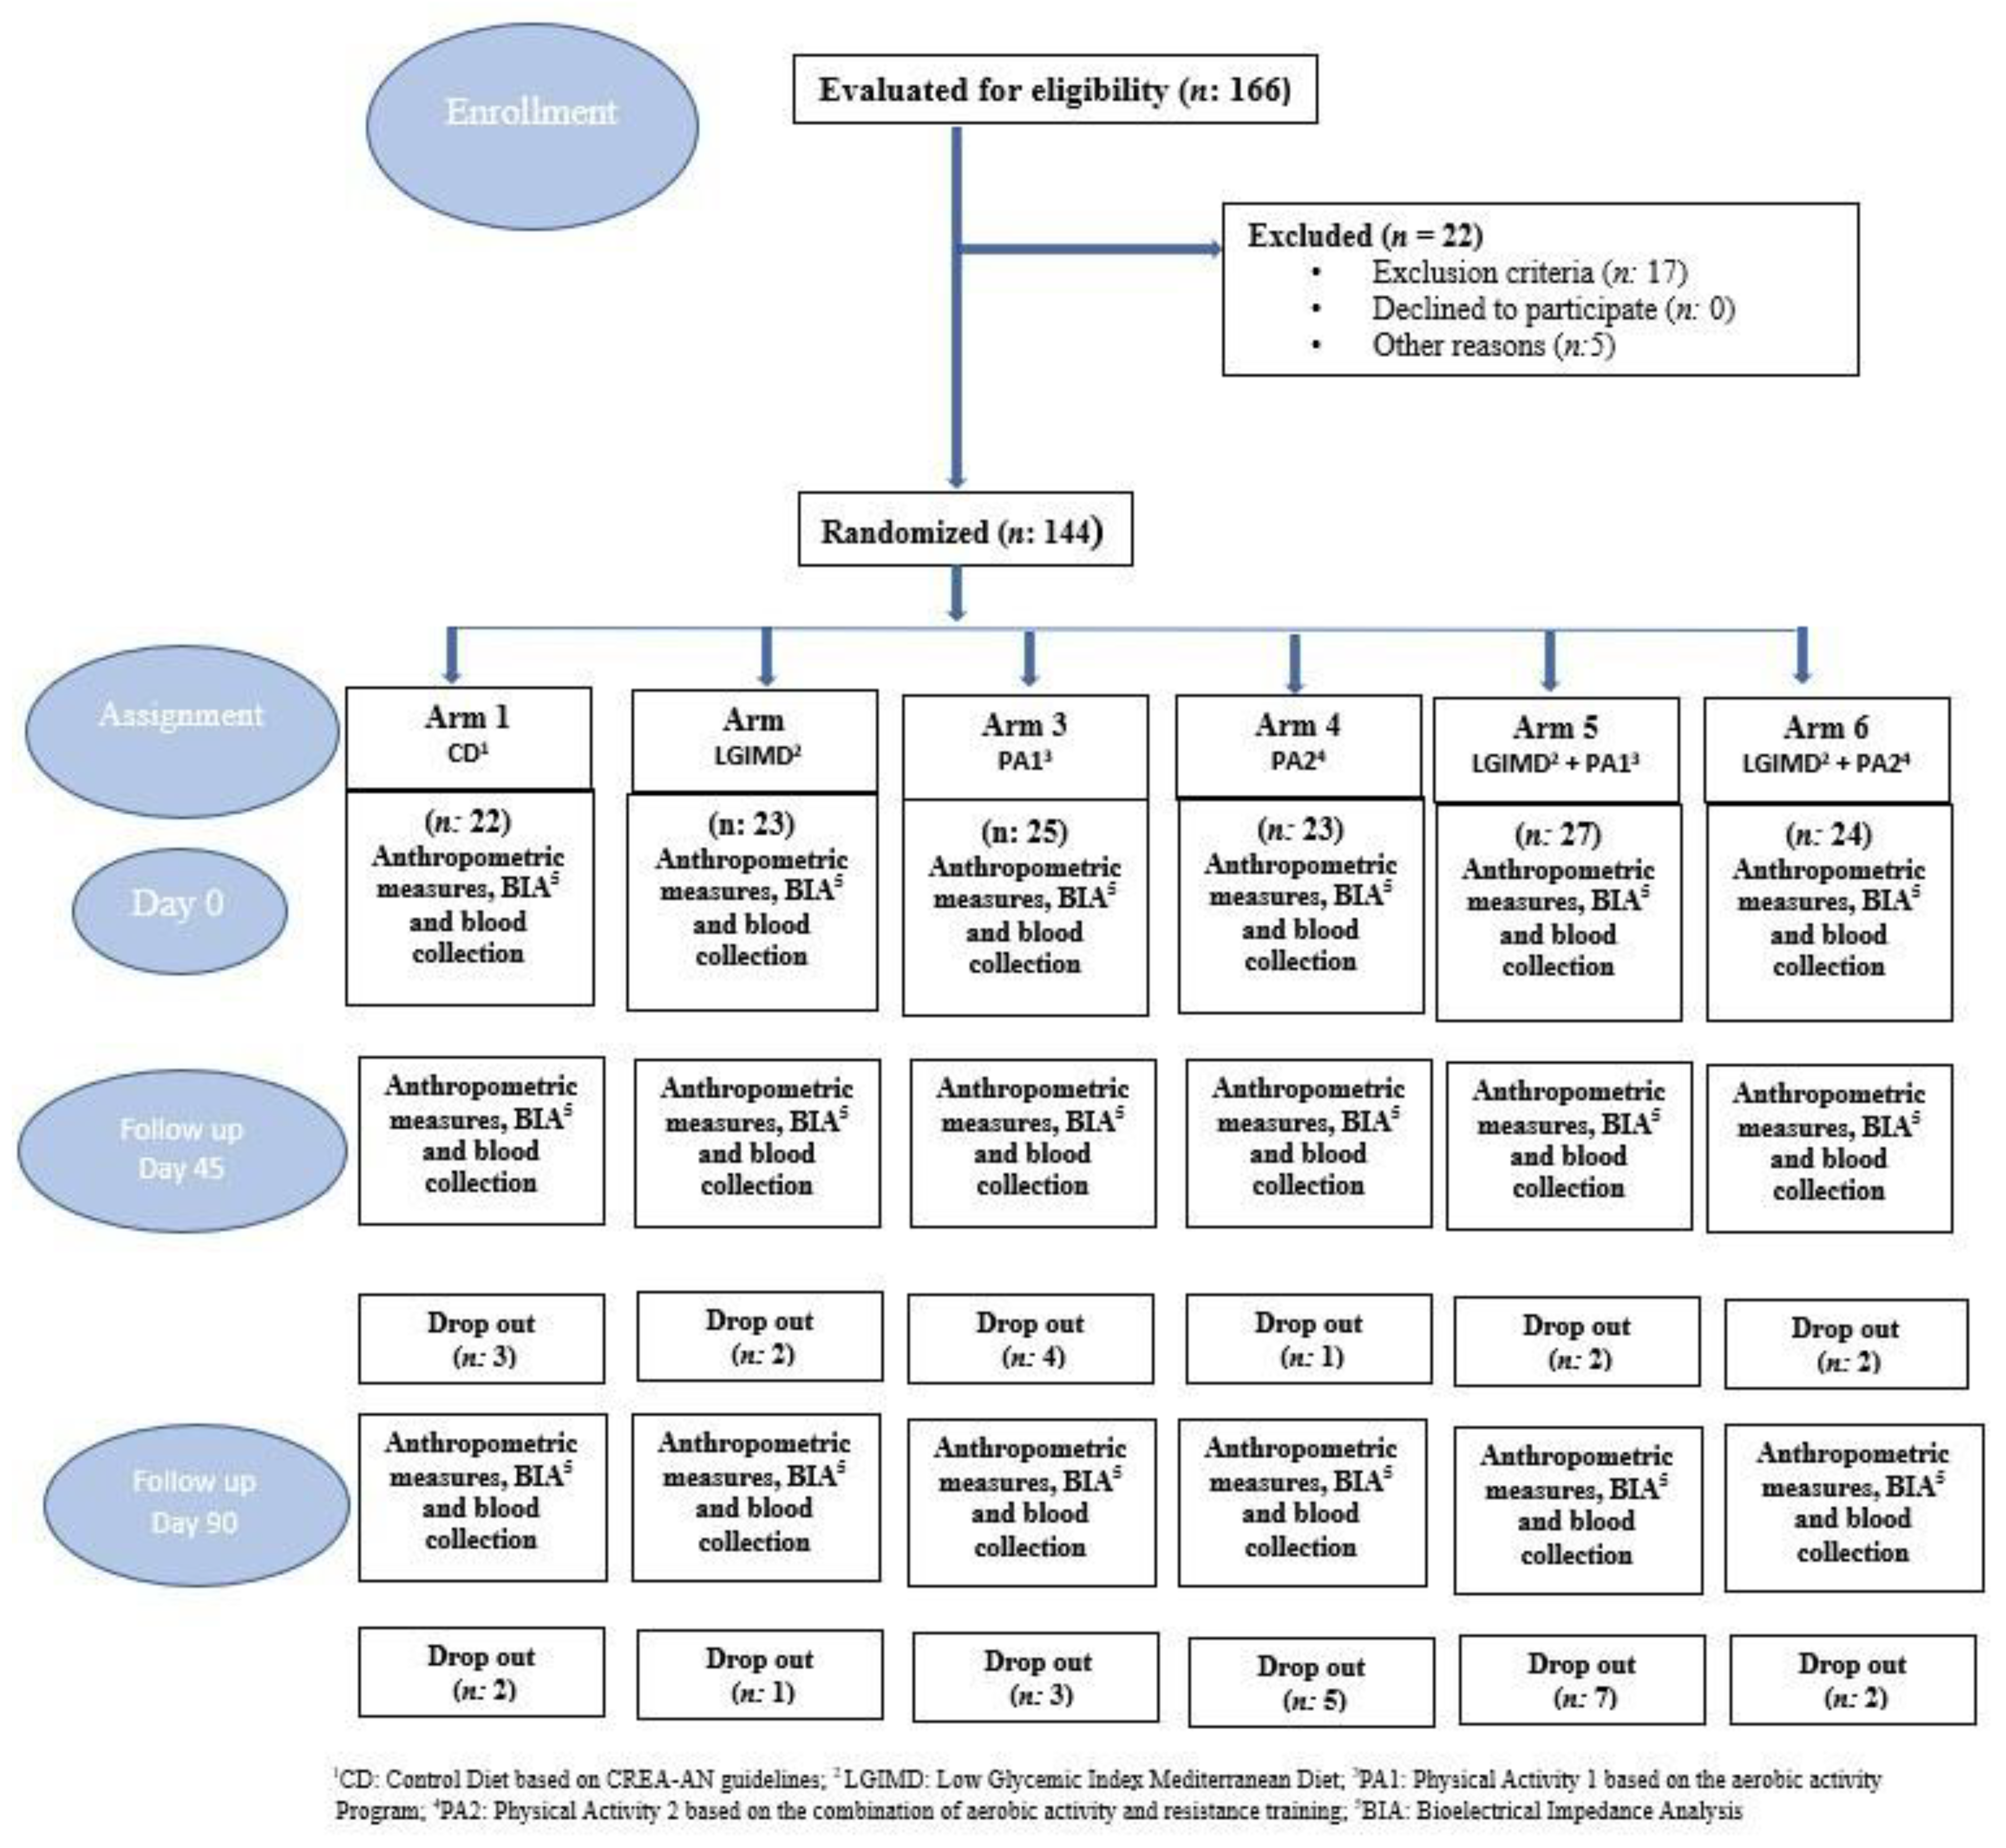
2.1. Participants
2.2. Study Design
2.3. Sample Size
2.4. Data Collection
2.5. Outcome Assessment
2.6. Randomization and Masking
2.7. Dietary Interventions
2.8. Physical Activity Interventions
2.8.1. Aerobic Activity Program
2.8.2. Combined Aerobic and Resistance Activity Program
2.9. Statistical Analysis
3. Results
4. Discussion
5. Conclusions
Supplementary Materials
Author Contributions
Funding
Institutional Review Board Statement
Informed Consent Statement
Data Availability Statement
Conflicts of Interest
References
- Eguchi, Y.; Wong, G.; Lee, E.; Akhtar, O.; Lopes, R.; Sumida, Y. Epidemiology of Non-alcoholic Fatty Liver Disease and Non-alcoholic Steatohepatitis in Japan: A Focused Literature Review. JGH Open 2020, 4, 808–817. [Google Scholar] [CrossRef]
- Targher, G. Non-Alcoholic Fatty Liver Disease, the Metabolic Syndrome and the Risk of Cardiovascular Disease: The Plot Thickens. Diabet. Med. 2007, 24, 1–6. [Google Scholar] [CrossRef]
- Yabe, Y.; Kim, T.; Oh, S.; Shida, T.; Oshida, N.; Hasegawa, N.; Okada, K.; Someya, N.; Mizokami, Y.; Shoda, J. Relationships of Dietary Habits and Physical Activity Status with Non-Alcoholic Fatty Liver Disease Featuring Advanced Fibrosis. Int. J. Environ. Res. Public Health 2021, 18, 8918. [Google Scholar] [CrossRef]
- Loomba, R.; Chalasani, N. The Hierarchical Model of NAFLD: Prognostic Significance of Histologic Features in NASH. Gastroenterology 2015, 149, 278–281. [Google Scholar] [CrossRef]
- Le, M.H.; Devaki, P.; Ha, N.B.; Jun, D.W.; Te, H.S.; Cheung, R.C.; Nguyen, M.H. Prevalence of Non-Alcoholic Fatty Liver Disease and Risk Factors for Advanced Fibrosis and Mortality in the United States. PLoS ONE 2017, 12, e0173499. [Google Scholar] [CrossRef]
- Mangla, N.; Ajmera, V.H.; Caussy, C.; Sirlin, C.; Brouha, S.; Bajwa-Dulai, S.; Madamba, E.; Bettencourt, R.; Richards, L.; Loomba, R. Liver Stiffness Severity Is Associated With Increased Cardiovascular Risk in Patients With Type 2 Diabetes. Clin. Gastroenterol. Hepatol. 2020, 18, 744–746.e1. [Google Scholar] [CrossRef] [PubMed]
- Campos-Murguía, A.; Ruiz-Margáin, A.; González-Regueiro, J.A.; Macías-Rodríguez, R.U. Clinical Assessment and Management of Liver Fibrosis in Non-Alcoholic Fatty Liver Disease. WJG 2020, 26, 5919–5943. [Google Scholar] [CrossRef]
- Vilar-Gomez, E.; Martinez-Perez, Y.; Calzadilla-Bertot, L.; Torres-Gonzalez, A.; Gra-Oramas, B.; Gonzalez-Fabian, L.; Friedman, S.L.; Diago, M.; Romero-Gomez, M. Weight Loss Through Lifestyle Modification Significantly Reduces Features of Nonalcoholic Steatohepatitis. Gastroenterology 2015, 149, 367–378.e5. [Google Scholar] [CrossRef]
- Miryan, M.; Darbandi, M.; Moradi, M.; Najafi, F.; Soleimani, D.; Pasdar, Y. Relationship between the Mediterranean Diet and Risk of Hepatic Fibrosis in Patients with Non-Alcoholic Fatty Liver Disease: A Cross-Sectional Analysis of the RaNCD Cohort. Front. Nutr. 2023, 10, 1062008. [Google Scholar] [CrossRef]
- Kim, Y.; Chang, Y.; Cho, Y.K.; Ahn, J.; Shin, H.; Ryu, S. Obesity and Weight Gain Are Associated With Progression of Fibrosis in Patients With Nonalcoholic Fatty Liver Disease. Clin. Gastroenterol. Hepatol. 2019, 17, 543–550.e2. [Google Scholar] [CrossRef]
- Buttacavoli, M.; Gruttad’Auria, C.I.; Olivo, M.; Virdone, R.; Castrogiovanni, A.; Mazzuca, E.; Marotta, A.M.; Marrone, O.; Madonia, S.; Bonsignore, M.R. Liver Steatosis and Fibrosis in OSA Patients After Long-Term CPAP Treatment: A Preliminary Ultrasound Study. Ultrasound Med. Biol. 2016, 42, 104–109. [Google Scholar] [CrossRef] [PubMed]
- Oh, S.; So, R.; Shida, T.; Matsuo, T.; Kim, B.; Akiyama, K.; Isobe, T.; Okamoto, Y.; Tanaka, K.; Shoda, J. High-Intensity Aerobic Exercise Improves Both Hepatic Fat Content and Stiffness in Sedentary Obese Men with Nonalcoholic Fatty Liver Disease. Sci. Rep. 2017, 7, 43029. [Google Scholar] [CrossRef] [PubMed]
- Kistler, K.D.; Brunt, E.M.; Clark, J.M.; Diehl, A.M.; Sallis, J.F.; Schwimmer, J.B. Physical Activity Recommendations, Exercise Intensity, and Histological Severity of Nonalcoholic Fatty Liver Disease. Am. J. Gastroenterol. 2011, 106, 460–468. [Google Scholar] [CrossRef] [PubMed]
- Misciagna, G.; Del Pilar Díaz, M.; Caramia, D.V.; Bonfiglio, C.; Franco, I.; Noviello, M.R.; Chiloiro, M.; Abbrescia, D.I.; Mirizzi, A.; Tanzi, M.; et al. Effect of a Low Glycemic Index Mediterranean Diet on Non-Alcoholic Fatty Liver Disease. A Randomized Controlled Clinici Trial. J. Nutr. Health Aging 2017, 21, 404–412. [Google Scholar] [CrossRef] [PubMed]
- Franco, I.; Bianco, A.; Dìaz, M.D.P.; Bonfiglio, C.; Chiloiro, M.; Pou, S.A.; Becaria Coquet, J.; Mirizzi, A.; Nitti, A.; Campanella, A.; et al. Effectiveness of Two Physical Activity Programs on Non-Alcoholic Fatty Liver Disease. a Randomized Controlled Clinical Trial. Rev. Fac. Cien. Med. Univ. Nac. Cordoba 2019, 76, 26. [Google Scholar] [CrossRef] [PubMed]
- Franco, I.; Bianco, A.; Mirizzi, A.; Campanella, A.; Bonfiglio, C.; Sorino, P.; Notarnicola, M.; Tutino, V.; Cozzolongo, R.; Giannuzzi, V.; et al. Physical Activity and Low Glycemic Index Mediterranean Diet: Main and Modification Effects on NAFLD Score. Results from a Randomized Clinical Trial. Nutrients 2020, 13, 66. [Google Scholar] [CrossRef]
- Bianco, A.; Franco, I.; Curci, R.; Bonfiglio, C.; Campanella, A.; Mirizzi, A.; Fucilli, F.; Di Giovanni, G.; Giampaolo, N.; Pesole, P.L.; et al. Diet and Exercise Exert a Differential Effect on Glucose Metabolism Markers According to the Degree of NAFLD Severity. Nutrients 2023, 15, 2252. [Google Scholar] [CrossRef]
- Craig, C.L.; Marshall, A.L.; Sjöström, M.; Bauman, A.E.; Booth, M.L.; Ainsworth, B.E.; Pratt, M.; Ekelund, U.; Yngve, A.; Sallis, J.F.; et al. International Physical Activity Questionnaire: 12-Country Reliability and Validity. Med. Sci. Sports Exerc. 2003, 35, 1381–1395. [Google Scholar] [CrossRef]
- Riboli, E.; Hunt, K.; Slimani, N.; Ferrari, P.; Norat, T.; Fahey, M.; Charrondière, U.; Hémon, B.; Casagrande, C.; Vignat, J.; et al. European Prospective Investigation into Cancer and Nutrition (EPIC): Study Populations and Data Collection. Public Health Nutr. 2002, 5, 1113–1124. [Google Scholar] [CrossRef]
- Tutino, V.; De Nunzio, V.; Caruso, M.; Bonfiglio, C.; Franco, I.; Mirizzi, A.; De Leonardis, G.; Cozzolongo, R.; Giannuzzi, V.; Giannelli, G.; et al. Aerobic Physical Activity and a Low Glycemic Diet Reduce the AA/EPA Ratio in Red Blood Cell Membranes of Patients with NAFLD. Nutrients 2018, 10, 1299. [Google Scholar] [CrossRef]
- Lee, S.J.; Kim, S.U. Noninvasive Monitoring of Hepatic Steatosis: Controlled Attenuation Parameter and Magnetic Resonance Imaging-Proton Density Fat Fraction in Patients with Nonalcoholic Fatty Liver Disease. Expert Rev. Gastroenterol. Hepatol. 2019, 13, 523–530. [Google Scholar] [CrossRef] [PubMed]
- Cusi, K.; Isaacs, S.; Barb, D.; Basu, R.; Caprio, S.; Garvey, W.T.; Kashyap, S.; Mechanick, J.I.; Mouzaki, M.; Nadolsky, K.; et al. American Association of Clinical Endocrinology Clinical Practice Guideline for the Diagnosis and Management of Nonalcoholic Fatty Liver Disease in Primary Care and Endocrinology Clinical Settings. Endocr. Pract. 2022, 28, 528–562. [Google Scholar] [CrossRef] [PubMed]
- Berzigotti, A. Non-Invasive Assessment of Non-Alcoholic Fatty Liver Disease: Ultrasound and Transient Elastography. Rev. Recent Clin. Trials 2015, 9, 170–177. [Google Scholar] [CrossRef]
- Cialfa, E.; D’amicis, A.; Leclercq, C.; Quaglia, G.; Sette, S.; Ticca, M.; Tomassi, G. Linee Guida per Una Sana Alimentazione Italiana. Rome Ist. Naz. Ric. Gli Aliment. Nutr. 2003, 86. [Google Scholar]
- Alberti-Fidanza, A.; Fidanza, F. Mediterranean Adequacy Index of Italian Diets. Public Health Nutr. 2004, 7, 937–941. [Google Scholar] [CrossRef]
- Laukkanen, R.; Oja, P.; Pasanen, M.; Vuori, I. Validity of a Two Kilometre Walking Test for Estimating Maximal Aerobic Power in Overweight Adults. Int. J. Obes. Relat. Metab. Disord. J. Int. Assoc. Study Obes. 1992, 16, 263–268. [Google Scholar]
- Canadian Society for Exercise Physiology. The Canadian Physical Activity, Fitness and Lifestyle Approach (CPAFLA): CSEP—Health and Fitness Program’s Health-Related Appraisal and Counselling Strategy; Canadian Society for Exercise Physiology: Ottawa, ON, Canada, 2003. [Google Scholar]
- Hoeger, W.W.K.; Hopkins, D.R. A Comparison of the Sit and Reach and the Modified Sit and Reach in the Measurement of Flexibility in Women. Res. Q. Exerc. Sport 1992, 63, 191–195. [Google Scholar] [CrossRef]
- Tanaka, H.; Monahan, K.D.; Seals, D.R. Age-Predicted Maximal Heart Rate Revisited. J. Am. Coll. Cardiol. 2001, 37, 153–156. [Google Scholar] [CrossRef]
- Liang, K.-Y.; Zeger, S.L. Longitudinal Data Analysis Using Generalized Linear Models. Biometrika 1986, 73, 13–22. [Google Scholar] [CrossRef]
- Kawanishi, N.; Niihara, H.; Mizokami, T.; Yano, H.; Suzuki, K. Exercise Training Attenuates Adipose Tissue Fibrosis in Diet-Induced Obese Mice. Biochem. Biophys. Res. Commun. 2013, 440, 774–779. [Google Scholar] [CrossRef]
- Pessin, J.E.; Kwon, H. How Does High-Fat Diet Induce Adipose Tissue Fibrosis? J. Investig. Med. 2012, 60, 1147–1150. [Google Scholar] [CrossRef]
- Wynn, T.A.; Ramalingam, T.R. Mechanisms of Fibrosis: Therapeutic Translation for Fibrotic Disease. Nat. Med. 2012, 18, 1028–1040. [Google Scholar] [CrossRef]
- Kim, D.; Konyn, P.; Cholankeril, G.; Ahmed, A. Physical Activity Is Associated With Nonalcoholic Fatty Liver Disease and Significant Fibrosis Measured by FibroScan. Clin. Gastroenterol. Hepatol. 2022, 20, e1438–e1455. [Google Scholar] [CrossRef]
- Chalasani, N.; Younossi, Z.; Lavine, J.E.; Charlton, M.; Cusi, K.; Rinella, M.; Harrison, S.A.; Brunt, E.M.; Sanyal, A.J. The Diagnosis and Management of Nonalcoholic Fatty Liver Disease: Practice Guidance from the American Association for the Study of Liver Diseases. Hepatology 2018, 67, 328–357. [Google Scholar] [CrossRef]
- Saura-Calixto, F.; Goñi, I. Definition of the Mediterranean Diet Based on Bioactive Compounds. Crit. Rev. Food Sci. Nutr. 2009, 49, 145–152. [Google Scholar] [CrossRef]
- Van Dijk, S.J.; Feskens, E.J.; Bos, M.B.; Hoelen, D.W.; Heijligenberg, R.; Bromhaar, M.G.; De Groot, L.C.; De Vries, J.H.; Müller, M.; Afman, L.A. A Saturated Fatty Acid–Rich Diet Induces an Obesity-Linked Proinflammatory Gene Expression Profile in Adipose Tissue of Subjects at Risk of Metabolic Syndrome. Am. J. Clin. Nutr. 2009, 90, 1656–1664. [Google Scholar] [CrossRef] [PubMed]
- Uribarri, J.; Del Castillo, M.D.; De La Maza, M.P.; Filip, R.; Gugliucci, A.; Luevano-Contreras, C.; Macías-Cervantes, M.H.; Markowicz Bastos, D.H.; Medrano, A.; Menini, T.; et al. Dietary Advanced Glycation End Products and Their Role in Health and Disease. Adv. Nutr. 2015, 6, 461–473. [Google Scholar] [CrossRef] [PubMed]
- Koschinsky, T.; He, C.-J.; Mitsuhashi, T.; Bucala, R.; Liu, C.; Buenting, C.; Heitmann, K.; Vlassara, H. Orally Absorbed Reactive Glycation Products (Glycotoxins): An Environmental Risk Factor in Diabetic Nephropathy. Proc. Natl. Acad. Sci. USA 1997, 94, 6474–6479. [Google Scholar] [CrossRef]
- Ramasamy, R.; Yan, S.F.; Schmidt, A.M. Advanced Glycation Endproducts: From Precursors to RAGE: Round and Round We Go. Amino Acids 2012, 42, 1151–1161. [Google Scholar] [CrossRef]
- Romero-Gómez, M.; Zelber-Sagi, S.; Trenell, M. Treatment of NAFLD with Diet, Physical Activity and Exercise. J. Hepatol. 2017, 67, 829–846. [Google Scholar] [CrossRef] [PubMed]
- Oh, S.; Tanaka, K.; Tsujimoto, T.; So, R.; Shida, T.; Shoda, J. Regular Exercise Coupled to Diet Regimen Accelerates Reduction of Hepatic Steatosis and Associated Pathological Conditions in Nonalcoholic Fatty Liver Disease. Metab. Syndr. Relat. Disord. 2014, 12, 290–298. [Google Scholar] [CrossRef]
- Johnson, N.A.; Sachinwalla, T.; Walton, D.W.; Smith, K.; Armstrong, A.; Thompson, M.W.; George, J. Aerobic Exercise Training Reduces Hepatic and Visceral Lipids in Obese Individuals without Weight Loss. Hepatology 2009, 50, 1105–1112. [Google Scholar] [CrossRef]
- Junichi, S.; Sechang, O.; Takashi, S.; Kiyoji, T. Liver, Muscle, and Insulin Resistance in Obese Subjects: Exercise Effects. Jpn. J. Phys. Fitness Sports Med. 2015, 64, 42. [Google Scholar]
- Houghton, D.; Thoma, C.; Hallsworth, K.; Cassidy, S.; Hardy, T.; Burt, A.D.; Tiniakos, D.; Hollingsworth, K.G.; Taylor, R.; Day, C.P.; et al. Exercise Reduces Liver Lipids and Visceral Adiposity in Patients With Nonalcoholic Steatohepatitis in a Randomized Controlled Trial. Clin. Gastroenterol. Hepatol. 2017, 15, 96–102.e3. [Google Scholar] [CrossRef] [PubMed]
- Van Der Poorten, D.; Milner, K.-L.; Hui, J.; Hodge, A.; Trenell, M.I.; Kench, J.G.; London, R.; Peduto, T.; Chisholm, D.J.; George, J. Visceral Fat: A Key Mediator of Steatohepatitis in Metabolic Liver Disease. Hepatology 2008, 48, 449–457. [Google Scholar] [CrossRef]
- Feldstein, A.E.; Wieckowska, A.; Lopez, A.R.; Liu, Y.-C.; Zein, N.N.; McCullough, A.J. Cytokeratin-18 Fragment Levels as Noninvasive Biomarkers for Nonalcoholic Steatohepatitis: A Multicenter Validation Study. Hepatology 2009, 50, 1072–1078. [Google Scholar] [CrossRef]
- Fealy, C.E.; Haus, J.M.; Solomon, T.P.J.; Pagadala, M.; Flask, C.A.; McCullough, A.J.; Kirwan, J.P. Short-Term Exercise Reduces Markers of Hepatocyte Apoptosis in Nonalcoholic Fatty Liver Disease. J. Appl. Physiol. 2012, 113, 1–6. [Google Scholar] [CrossRef] [PubMed]
- Hashida, R.; Kawaguchi, T.; Bekki, M.; Omoto, M.; Matsuse, H.; Nago, T.; Takano, Y.; Ueno, T.; Koga, H.; George, J.; et al. Aerobic vs. Resistance Exercise in Non-Alcoholic Fatty Liver Disease: A Systematic Review. J. Hepatol. 2017, 66, 142–152. [Google Scholar] [CrossRef]
- Hallsworth, K.; Fattakhova, G.; Hollingsworth, K.G.; Thoma, C.; Moore, S.; Taylor, R.; Day, C.P.; Trenell, M.I. Resistance Exercise Reduces Liver Fat and Its Mediators in Non-Alcoholic Fatty Liver Disease Independent of Weight Loss. Gut 2011, 60, 1278–1283. [Google Scholar] [CrossRef]
- Charatcharoenwitthaya, P.; Kuljiratitikal, K.; Aksornchanya, O.; Chaiyasoot, K.; Bandidniyamanon, W.; Charatcharoenwitthaya, N. Moderate-Intensity Aerobic vs Resistance Exercise and Dietary Modification in Patients With Nonalcoholic Fatty Liver Disease: A Randomized Clinical Trial. Clin. Transl. Gastroenterol. 2021, 12, e00316. [Google Scholar] [CrossRef]


| Working Arms | ||||||
|---|---|---|---|---|---|---|
| Variables | C a | LGIMD b | PA1 c | PA2 d | PA1+LGIMD e | PA2+LGIMD f |
| N | 22 | 23 | 25 | 23 | 27 | 24 |
| Gender | ||||||
| Male | 11 (50%) | 13 (57%) | 14 (56%) | 17 (74%) | 18 (67%) | 16 (67%) |
| Female | 11 (50%) | 10 (43%) | 11 (44%) | 6 (26%) | 9 (33%) | 8 (33%) |
| Age (Years) | 50.70 (8.67) | 50.74 (1.75) | 50.45 (9.45) | 46.23 (9.39) | 50.32 (9.61) | 36.75 (10.50) |
| Single | 1 (6%) | 1 (6%) | 1 (5%) | 3 (19%) | 2 (10%) | 3 (16%) |
| Married | 17 (94%) | 17 (94%) | 18 (90%) | 11 (69%) | 17 (81%) | 16 (84%) |
| Divorced | 0 (0%) | 0 (0%) | 1 (5%) | 0 (0%) | 2 (10%) | 0 (0%) |
| Widowed | 0 (0%) | 0 (0%) | 0 (0%) | 2 (13%) | 0 (0%) | 0 (0%) |
| Study level | ||||||
| Elementary | 1 (6%) | 2 (11%) | 0 (0%) | 0 (0%) | 1 (5%) | 0 (0%) |
| Secondary school | 10 (56%) | 8 (42%) | 8 (40%) | 3 (18%) | 4 (19%) | 6 (30%) |
| High school | 6 (33%) | 7 (37%) | 9 (45%) | 9 (53%) | 8 (38%) | 12 (60%) |
| Diploma university | 1 (6%) | 1 (5%) | 0 (0%) | 0 (0%) | 0 (0%) | 0 (0%) |
| University degree | 0 (0%) | 1 (5%) | 3 (15%) | 5 (29%) | 8 (38%) | 2 (10%) |
| Smoking status | ||||||
| Never smoked | 13 (68%) | 10 (50%) | 12 (55%) | 10 (56%) | 17 (71%) | 12 (55%) |
| Former smoker | 5 (26%) | 6 (30%) | 5 (23%) | 4 (22%) | 4 (17%) | 4 (18%) |
| Current smoker | 1 (5%) | 4 (20%) | 5 (23%) | 4 (22%) | 3 (13%) | 6 (27%) |
| Variables | Follow-Up | Working Arms | ||||||
|---|---|---|---|---|---|---|---|---|
| C a | LGIMD b | PA1 c | PA2 d | PA1+LGIMD5 e | PA2+LGIMD f | p-Value | ||
| N | Baseline | 22 | 23 | 25 | 23 | 27 | 24 | |
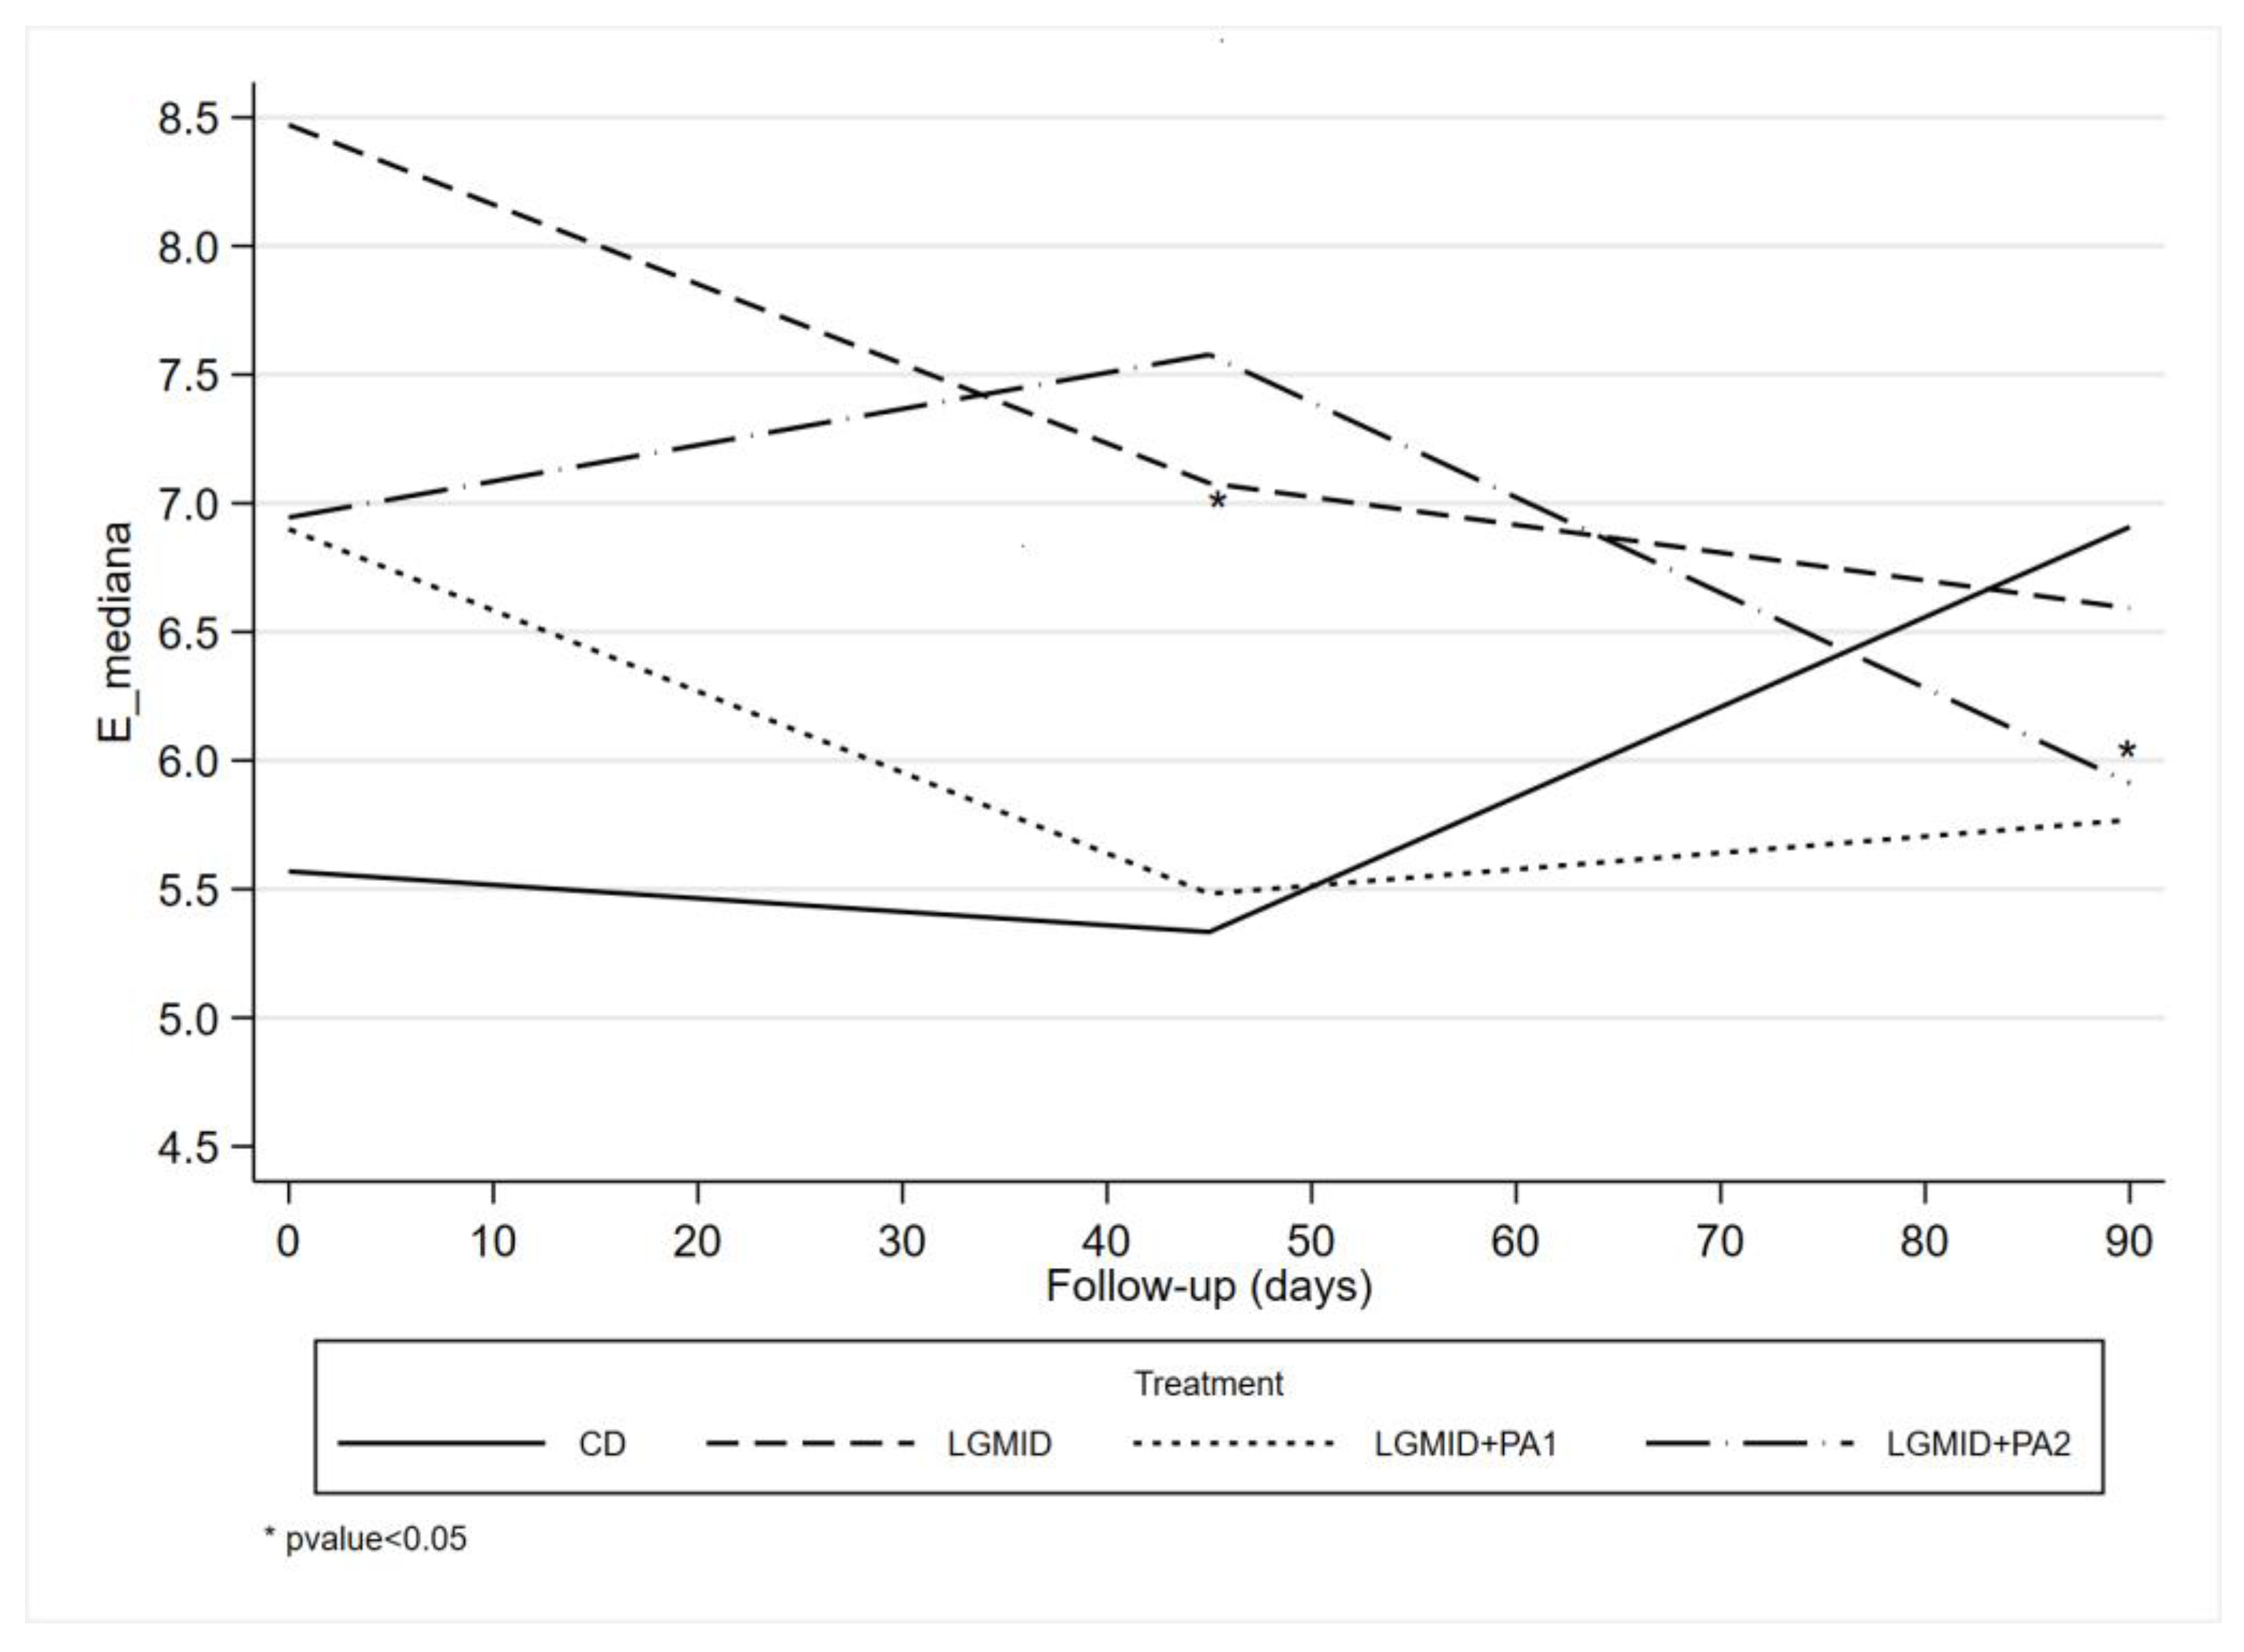
| E (kPa) g | Baseline | 5.95 (2.12) | 7.35 (4.43) | 6.48 (2.66) | 6.17 (2.24) | 6.48 (3.48) | 6.55 (3.76) | 0.79 |
| 45 days | 5.29 (1.45) | 6.74 (2.94) | 6.55 (2.99) | 5.46 (1.65) | 5.25 (2.07) | 7.23 (6.82) | 0.31 | |
| 90 days | 7.04 (4.62) | 6.17 (1.71) | 6.88 (2.71) | 6.39 (2.38) | 5.89 (3.17) | 5.47 (2.25) | 0.57 | |
| CAP (dB/m) h | Baseline | 349.09 (60.28) | 341.57 (45.17) | 339.92 (44.89) | 334.78 (51.01) | 328.56 (52.05) | 323.63 (53.98) | 0.58 |
| 45 days | 322.12 (83.18) | 296.52 (51.10) | 295.10 (50.68) | 299.55 (63.73) | 275.61 (75.84) | 289.38 (70.15) | 0.39 | |
| 90 days | 307.80 (73.10) | 303.72 (81.70) | 287.88 (54.59) | 284.11 (62.22) | 259.84 (57.01) | 289.18 (72.96) | 0.21 | |
| SBP (Hg mm) i | Baseline | 126.14 (12.14) | 128.86 (17.86) | 123.80 (13.17) | 118.00 (13.22) | 127.04 (13.82) | 122.71 (17.00) | 0.20 |
| 45 days | 121.67 (16.80) | 120.48 (14.31) | 119.50 (10.50) | 116.25 (12.66) | 120.87 (13.03) | 117.08 (13.34) | 0.75 | |
| 90 days | 122.33 (12.37) | 122.78 (12.27) | 119.06 (10.04) | 116.25 (10.88) | 123.61 (12.34) | 118.41 (12.95) | 0.40 | |
| DBP (Hg mm) l | Baseline | 81.59 (8.51) | 82.73 (9.73) | 80.60 (6.18) | 79.50 (6.26) | 82.59 (6.10) | 81.04 (9.32) | 0.73 |
| 45 days | 80.28 (7.37) | 79.76 (8.14) | 79.50 (8.57) | 79.00 (7.88) | 80.00 (7.39) | 77.71 (5.51) | 0.89 | |
| 90 days | 81.67 (8.16) | 77.50 (9.74) | 80.63 (6.80) | 79.69 (6.94) | 81.94 (6.89) | 77.50 (6.50) | 0.29 | |
| BMI m | Baseline | 34.14 (4.97) | 32.91 (4.26) | 32.73 (5.37) | 30.79 (3.16) | 33.07 (4.20) | 34.09 (3.77) | 0.13 |
| 45 days | 32.50 (4.57) | 30.70 (4.22) | 31.87 (4.96) | 30.05 (3.27) | 31.50 (3.61) | 32.19 (3.42) | 0.35 | |
| 90 days | 32.12 (5.11) | 30.14 (4.73) | 31.01 (4.69) | 29.80 (3.53) | 30.89 (3.91) | 31.97 (3.67) | 0.53 | |
| WC (cm) n | Baseline | 106.59 (11.80) | 102.91 (10.98) | 103.84 (8.58) | 99.70 (8.10) | 103.48 (11.89) | 104.46 (12.15) | 0.42 |
| 45 days | 102.11 (12.24) | 97.24 (10.19) | 101.43 (9.71) | 97.32 (6.76) | 97.92 (9.06) | 99.96 (10.20) | 0.42 | |
| 90 days | 101.00 (11.47) | 95.72 (9.69) | 99.41 (8.71) | 97.16 (6.54) | 98.01 (8.91) | 98.91 (10.57) | 0.66 | |
| HC (cm) o | Baseline | 113.59 (11.97) | 110.35 (10.18) | 109.76 (9.54) | 106.78 (7.90) | 107.67 (7.88) | 111.46 (8.04) | 0.15 |
| 45 days | 109.39 (9.80) | 105.29 (8.89) | 106.90 (11.04) | 105.18 (8.23) | 104.68 (7.12) | 107.96 (9.58) | 0.51 | |
| 90 days | 107.31 (11.32) | 104.28 (8.46) | 106.82 (8.61) | 102.68 (7.68) | 103.75 (8.42) | 107.09 (7.52) | 0.42 | |
| BCM p | Baseline | 31.87 (6.59) | 32.29 (5.53) | 33.20 (7.24) | 34.94 (5.79) | 33.49 (7.63) | 34.68 (7.27) | 0.60 |
| 45 days | 31.11 (6.31) | 31.28 (5.74) | 33.46 (7.16) | 34.15 (5.16) | 32.05 (6.84) | 33.90 (6.48) | 0.46 | |
| 90 days | 32.09 (6.47) | 31.90 (6.05) | 32.54 (6.72) | 35.08 (4.85) | 32.26 (7.11) | 34.14 (7.10) | 0.61 | |
| FM q | Baseline | 34.21 (12.24) | 31.17 (10.54) | 30.85 (10.68) | 28.07 (7.13) | 31.04 (7.64) | 33.90 (9.16) | 0.31 |
| 45 days | 31.12 (11.31) | 26.84 (9.10) | 29.43 (10.36) | 26.48 (7.76) | 28.49 (6.62) | 29.99 (7.85) | 0.51 | |
| 90 days | 29.82 (12.84) | 24.82 (8.94) | 27.31 (9.34) | 25.46 (7.67) | 26.41 (7.34) | 28.71 (8.57) | 0.60 | |
| FFM r | Baseline | 59.07 (9.99) | 59.27 (9.29) | 60.73 (11.47) | 62.54 (8.72) | 61.71 (11.76) | 62.97 (12.11) | 0.76 |
| 45 days | 57.62 (9.75) | 57.69 (8.64) | 60.71 (10.95) | 61.90 (7.83) | 59.71 (10.64) | 61.44 (10.93) | 0.61 | |
| 90 days | 59.33 (10.15) | 59.17 (9.27) | 60.11 (10.39) | 63.53 (7.60) | 60.19 (11.16) | 62.10 (11.63) | 0.78 | |
| GLUCOSE (mmol/L) | Baseline | 5.33 (0.67) | 5.90 (1.33) | 5.78 (1.70) | 5.41 (0.75) | 5.36 (0.62) | 5.49 (0.67) | 0.77 |
| 45 days | 5.09 (0.40) | 5.77 (1.09) | 5.43 (1.29) | 5.15 (0.63) | 5.20 (0.63) | 5.35 (0.60) | 0.10 | |
| 90 days | 5.10 (0.40) | 5.90 (1.38) | 5.60 (1.53) | 5.28 (1.07) | 5.25 (0.89) | 5.36 (0.53) | 0.26 | |
| TC (mmol/L) s | Baseline | 5.11 (1.06) | 5.11 (1.41) | 5.00 (0.82) | 5.31 (0.93) | 5.25 (1.10) | 5.34 (1.01) | 0.79 |
| 45 days | 5.05 (0.85) | 4.63 (1.13) | 4.97 (0.82) | 5.17 (0.82) | 4.93 (0.88) | 4.73 (1.00) | 0.38 | |
| 90 days | 5.04 (0.69) | 4.94 (1.32) | 5.32 (0.70) | 5.50 (0.92) | 4.95 (0.96) | 4.90 (1.04) | 0.30 | |
| TGL (mmol/L) t | Baseline | 1.19 (0.62) | 1.65 (1.18) | 1.39 (0.99) | 1.39 (0.66) | 1.63 (1.06) | 1.63 (0.89) | 0.78 |
| 45 days | 1.07 (0.52) | 1.45 (0.93) | 1.25 (0.66) | 1.18 (0.74) | 1.32 (1.11) | 1.23 (0.84) | 0.80 | |
| 90 days | 1.08 (0.56) | 1.42 (0.77) | 1.22 (0.62) | 1.38 (0.73) | 1.15 (0.62) | 1.30 (0.88) | 0.73 | |
| HDL-C (mmol/L) u | Baseline | 1.22 (0.34) | 1.18 (0.36) | 1.13 (0.27) | 1.16 (0.30) | 1.14 (0.22) | 1.09 (0.29) | 0.80 |
| 45 days | 1.19 (0.33) | 1.12 (0.36) | 1.06 (0.24) | 1.16 (0.30) | 1.29 (0.78) | 1.04 (0.32) | 0.39 | |
| 90 days | 1.16 (0.33) | 1.24 (0.46) | 1.15 (0.21) | 1.24 (0.27) | 1.21 (0.23) | 1.11 (0.28) | 0.70 | |
| HOMA-IR v | Baseline | 2.93 (1.69) | 2.83 (1.26) | 3.01 (1.68) | 2.51 (1.59) | 3.24 (1.76) | 3.20 (1.36) | 0.81 |
| 45 days | 2.14 (1.15) | 2.59 (1.86) | 2.05 (1.02) | 1.90 (1.20) | 2.05 (0.87) | 1.99 (0.91) | 0.60 | |
| 90 days | 2.06 (1.27) | 2.80 (1.46) | 2.32 (1.20) | 2.33 (2.33) | 3.75 (6.65) | 2.43 (1.38) | 0.65 | |
| HBA1C (mmol/mol) z | Baseline | 0.06 (0.00) | 0.06 (0.01) | 0.06 (0.01) | 0.06 (0.01) | 0.06 (0.00) | 0.06 (0.00) | 0.83 |
| 45 days | 0.06 (0.00) | 0.06 (0.01) | 0.06 (0.00) | 0.06 (0.01) | 0.06 (0.00) | 0.06 (0.01) | 0.85 | |
| 90 days | 0.06 (0.00) | 0.05 (0.00) | 0.06 (0.00) | 0.06 (0.01) | 0.05 (0.00) | 0.06 (0.00) | 0.47 | |
| β | 95% CI | p-Value | |
|---|---|---|---|
| Follow-up | |||
| Baseline | 0.00 | ||
| 45 days | 0.25 | [1.02, 1.52] | 0.70 |
| 3 months | 1.79 | [0.21, 3.38] | 0.02 |
| Treatment | |||
| CD a | 0.00 | ||
| LGIMD b | 2.94 | [0.67, 5.22] | 0.01 |
| PA1 c | 1.33 | [−0.59, 3.25] | 0.17 |
| PA2 d | 1.21 | [−0.54, 2.95] | 0.17 |
| PA1+LGIMD e | 1.25 | [−0.51, 3.02] | 0.16 |
| PA2+LGIMD f | 1.14 | [−0.53, 2.81] | 0.18 |
| Treatment#time | |||
| LGMID # baseline | 0.00 | ||
| LGMID # 45 days | −0.84 | [−3.01, 1.32] | 0.44 |
| LGMID # 90 days | −2.85 | [−5.24, −0.45] | 0.02 |
| PA1 # baseline | 0.00 | ||
| PA1 # 45 days | 0.04 | [−1.89, 1.96] | 0.97 |
| PA1 # 90 days | −0.60 | [−2.89, 1.70] | 0.61 |
| PA2 # baseline | 0.00 | ||
| PA2 # 45 days | −0.36 | [−2.06, 1.34] | 0.67 |
| PA2 # 90 days | −1.11 | [−3.22, 0.99] | 0.30 |
| LGMID+PA1 # baseline | 0.00 | ||
| LGMID+PA # 45 days | −1.21 | [−2.93, 0.51] | 0.16 |
| LGMID+PA1 # 90 days | −2.37 | [−4.39, −0.35] | 0.02 |
| LGMID+PA2 # baseline | 0.00 | ||
| LGMID+PA2 # 45 days | 1.02 | [−0.72, 2.75] | 0.25 |
| LGMID+PA2 # 90 days | −2.21 | [−4.10, −0.32] | 0.02 |
| Follow-Up#Treatment | Contrast | 95% CI |
|---|---|---|
| (2 vs. 1) CD a | 0.25 | [−1.02, 1.52] |
| (3 vs. 2) CD | 1.54 | [−0.02, 3.11] |
| (2 vs. 1) LGMID b | −0.60 | [−2.43, 1.24] |
| (3 vs. 2) LGMID | −0.46 | [−1.97, 1.05] |
| (2 vs. 1) PA1 c | 0.28 | [−1.20, 1.77] |
| (3 vs. 2) PA1 | 0.91 | [−0.75, 2.57] |
| (2 vs. 1) PA2 d | −0.11 | [−1.29, 1.06] |
| (3 vs. 2) PA2 | 0.79 | [−0.61, 2.19] |
| (2 vs. 1) LGMID+PA1 e | −0.96 | [−2.22, 0.29] |
| (3 vs. 2) LGMID+PA1 | 0.38 | [−0.75, 1.52] |
| (2 vs. 1) LGMID+PA2 f | 1.26 * | [0.03, 2.49] |
| (3 vs. 2) LGMID+PA2 | −1.68 * | [−2.87, −0.49] |
Disclaimer/Publisher’s Note: The statements, opinions and data contained in all publications are solely those of the individual author(s) and contributor(s) and not of MDPI and/or the editor(s). MDPI and/or the editor(s) disclaim responsibility for any injury to people or property resulting from any ideas, methods, instructions or products referred to in the content. |
© 2023 by the authors. Licensee MDPI, Basel, Switzerland. This article is an open access article distributed under the terms and conditions of the Creative Commons Attribution (CC BY) license (https://creativecommons.org/licenses/by/4.0/).
Share and Cite
Curci, R.; Bianco, A.; Franco, I.; Bonfiglio, C.; Campanella, A.; Mirizzi, A.; Giannuzzi, V.; Cozzolongo, R.; Veronese, N.; Osella, A.R. Lifestyle Modification: Evaluation of the Effects of Physical Activity and Low-Glycemic-Index Mediterranean Diet on Fibrosis Score. Nutrients 2023, 15, 3520. https://doi.org/10.3390/nu15163520
Curci R, Bianco A, Franco I, Bonfiglio C, Campanella A, Mirizzi A, Giannuzzi V, Cozzolongo R, Veronese N, Osella AR. Lifestyle Modification: Evaluation of the Effects of Physical Activity and Low-Glycemic-Index Mediterranean Diet on Fibrosis Score. Nutrients. 2023; 15(16):3520. https://doi.org/10.3390/nu15163520
Chicago/Turabian StyleCurci, Ritanna, Antonella Bianco, Isabella Franco, Caterina Bonfiglio, Angelo Campanella, Antonella Mirizzi, Vito Giannuzzi, Raffaele Cozzolongo, Nicola Veronese, and Alberto Ruben Osella. 2023. "Lifestyle Modification: Evaluation of the Effects of Physical Activity and Low-Glycemic-Index Mediterranean Diet on Fibrosis Score" Nutrients 15, no. 16: 3520. https://doi.org/10.3390/nu15163520
APA StyleCurci, R., Bianco, A., Franco, I., Bonfiglio, C., Campanella, A., Mirizzi, A., Giannuzzi, V., Cozzolongo, R., Veronese, N., & Osella, A. R. (2023). Lifestyle Modification: Evaluation of the Effects of Physical Activity and Low-Glycemic-Index Mediterranean Diet on Fibrosis Score. Nutrients, 15(16), 3520. https://doi.org/10.3390/nu15163520