
Linking Metallic Micronutrients and Toxic Xenobiotics to Atherosclerosis and Fatty Liver Disease—Postmortem ICP-MS Analysis of Selected Human Tissues

 , , , , , , ,
  ,
,
Abstract
:1. Introduction
2. Materials and Methods
2.1. Studied Groups
2.2. Tissue Samples
2.3. Sample Mineralisation
2.4. ICP-MS Analysis
2.5. Statistics
3. Results
3.1. Mineral Status of the Investigated Tissues Based on ICP-MS Measurements
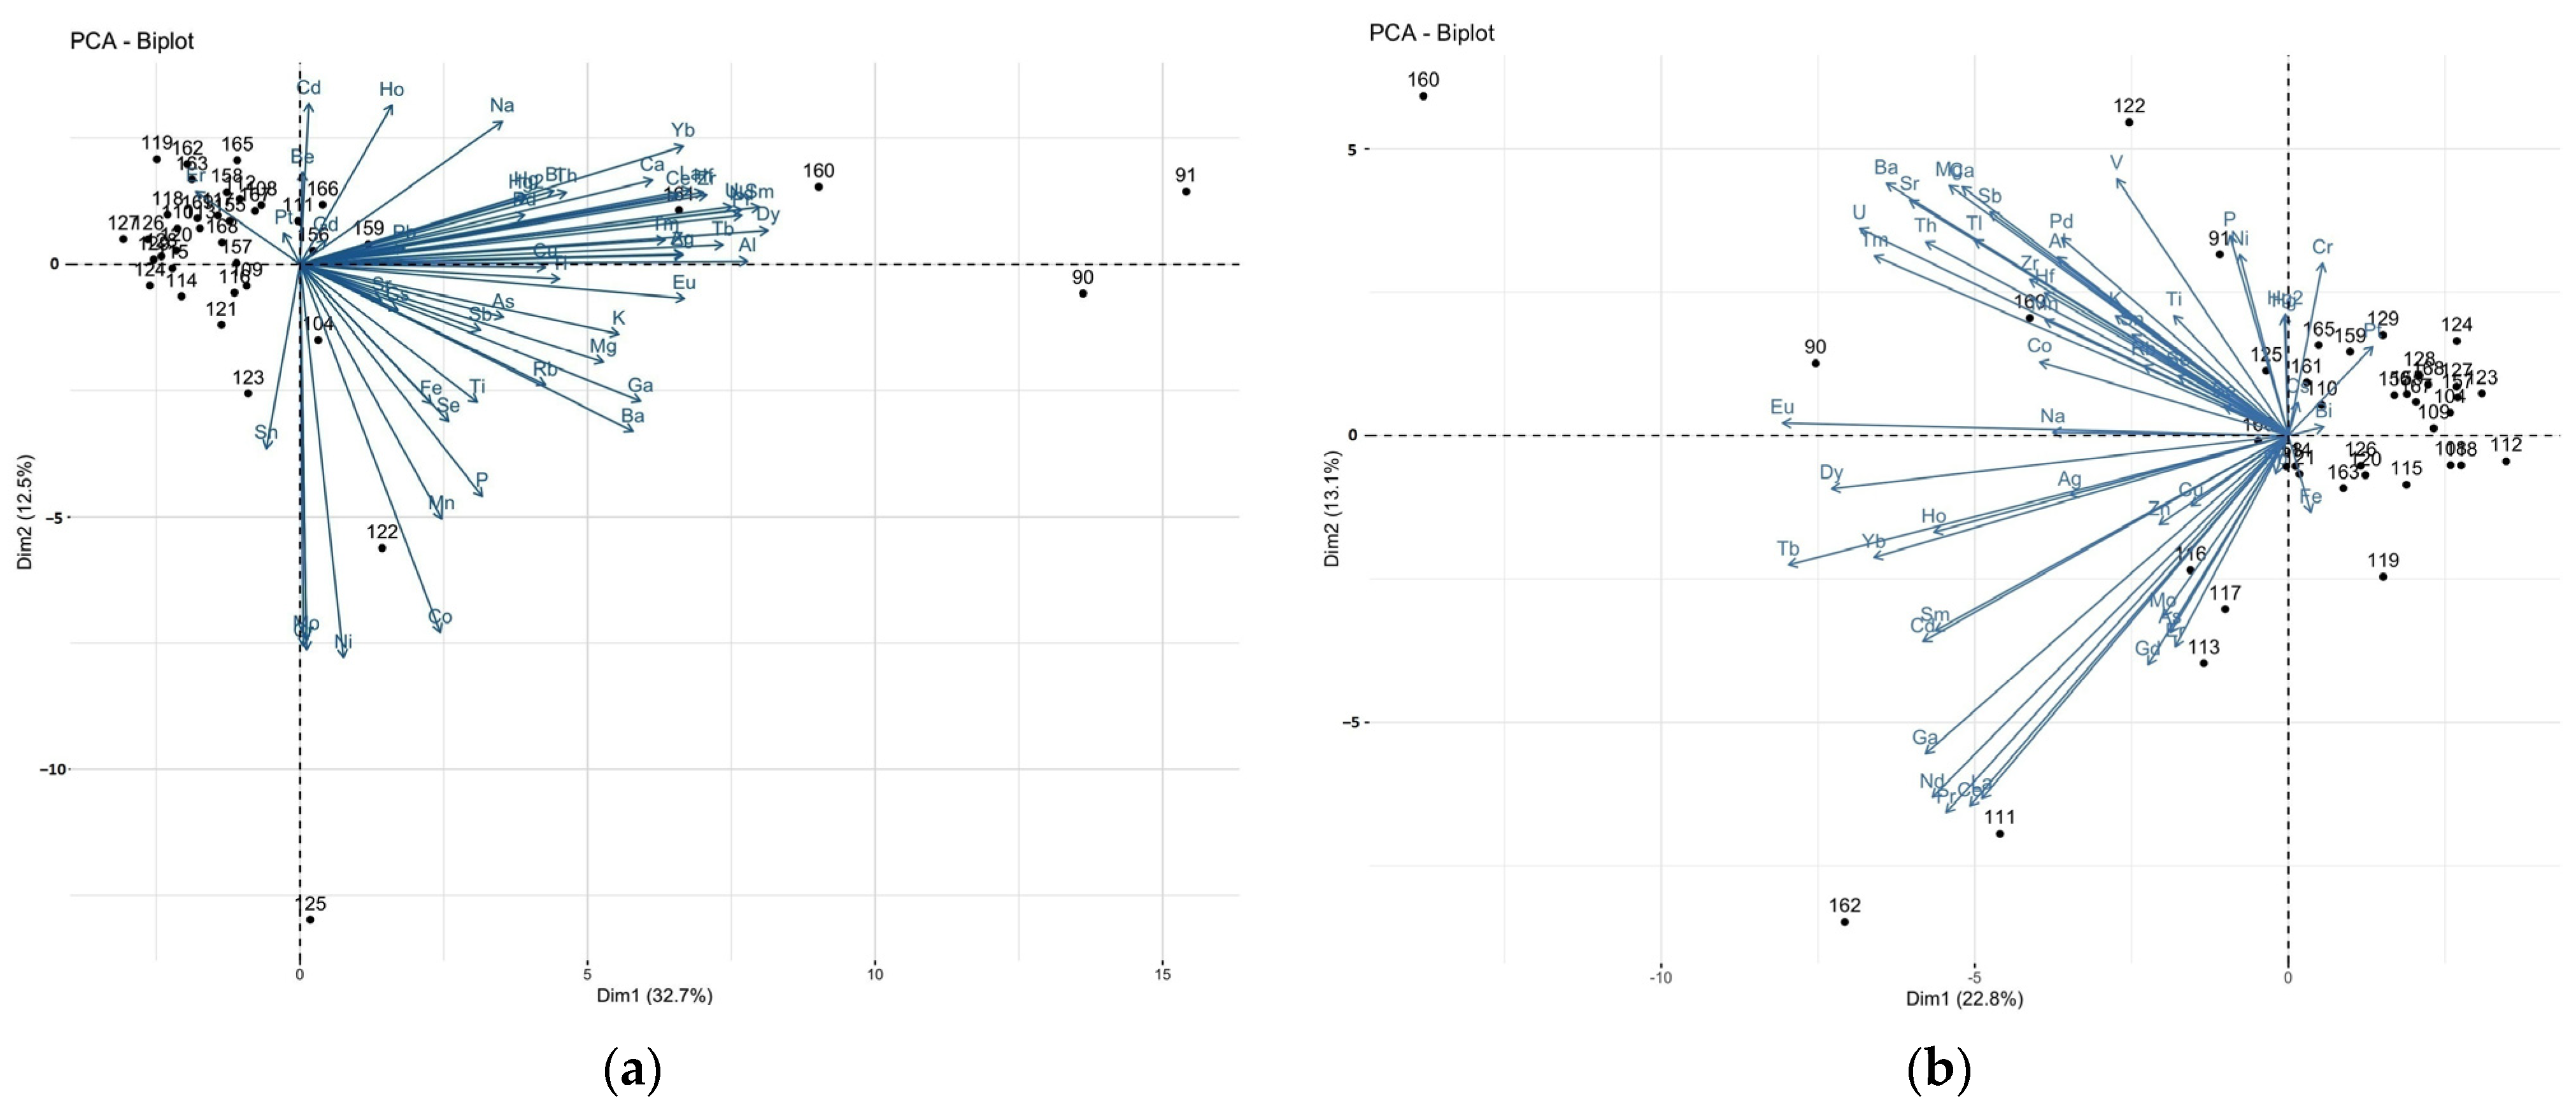
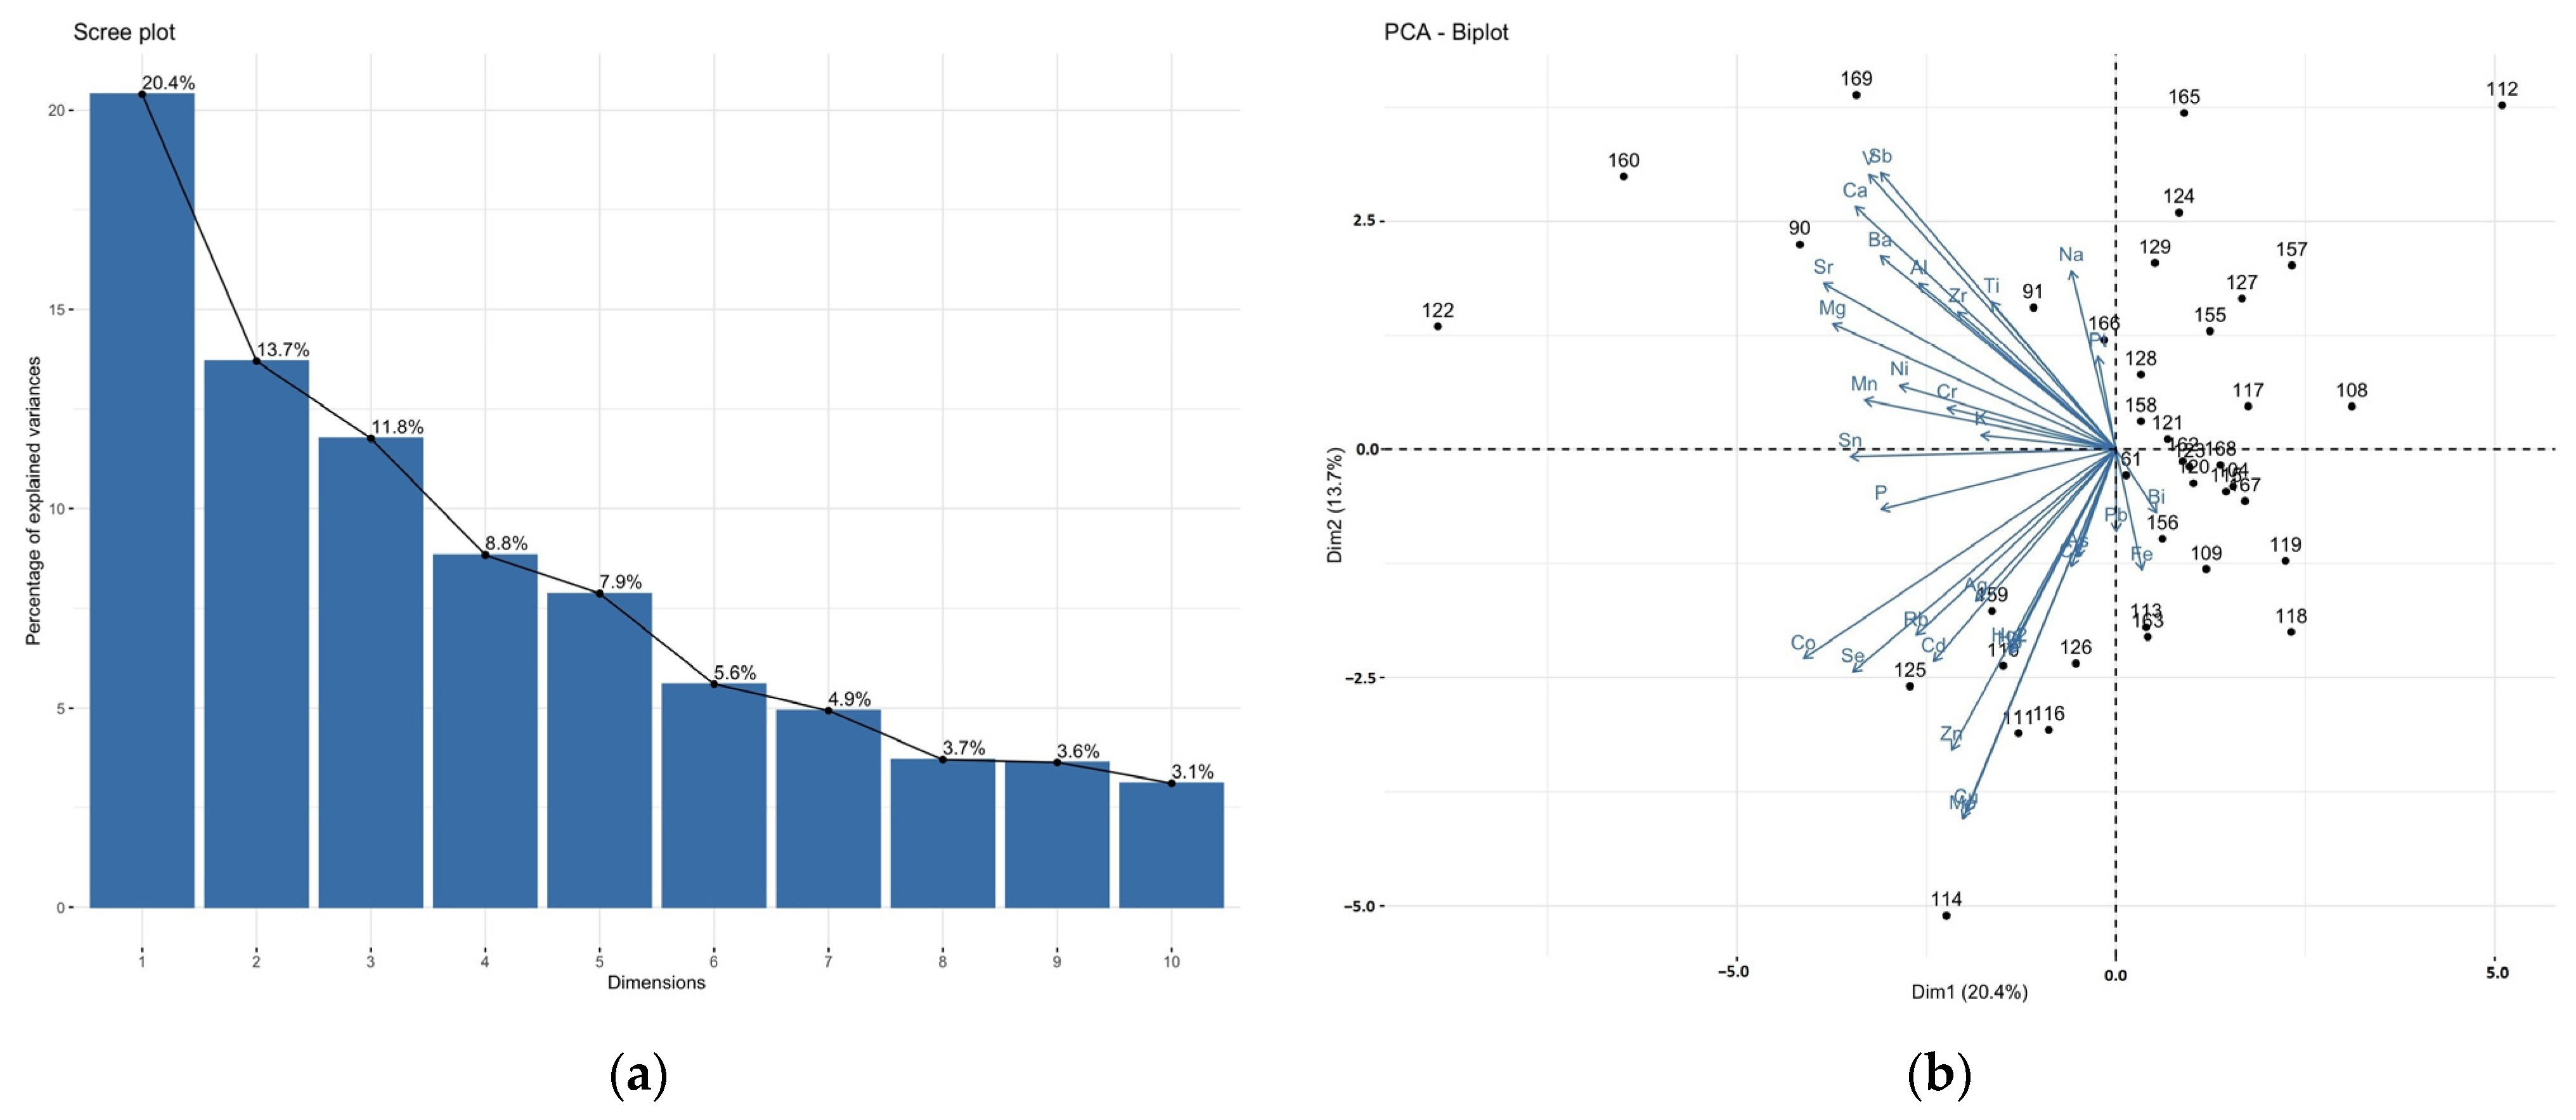
3.2. Correlations between Elements in the Brain and Liver Samples: Principal Component Analysis (PCA)
3.3. Differences in the Elemental Composition of the Tissues between the Groups Studied
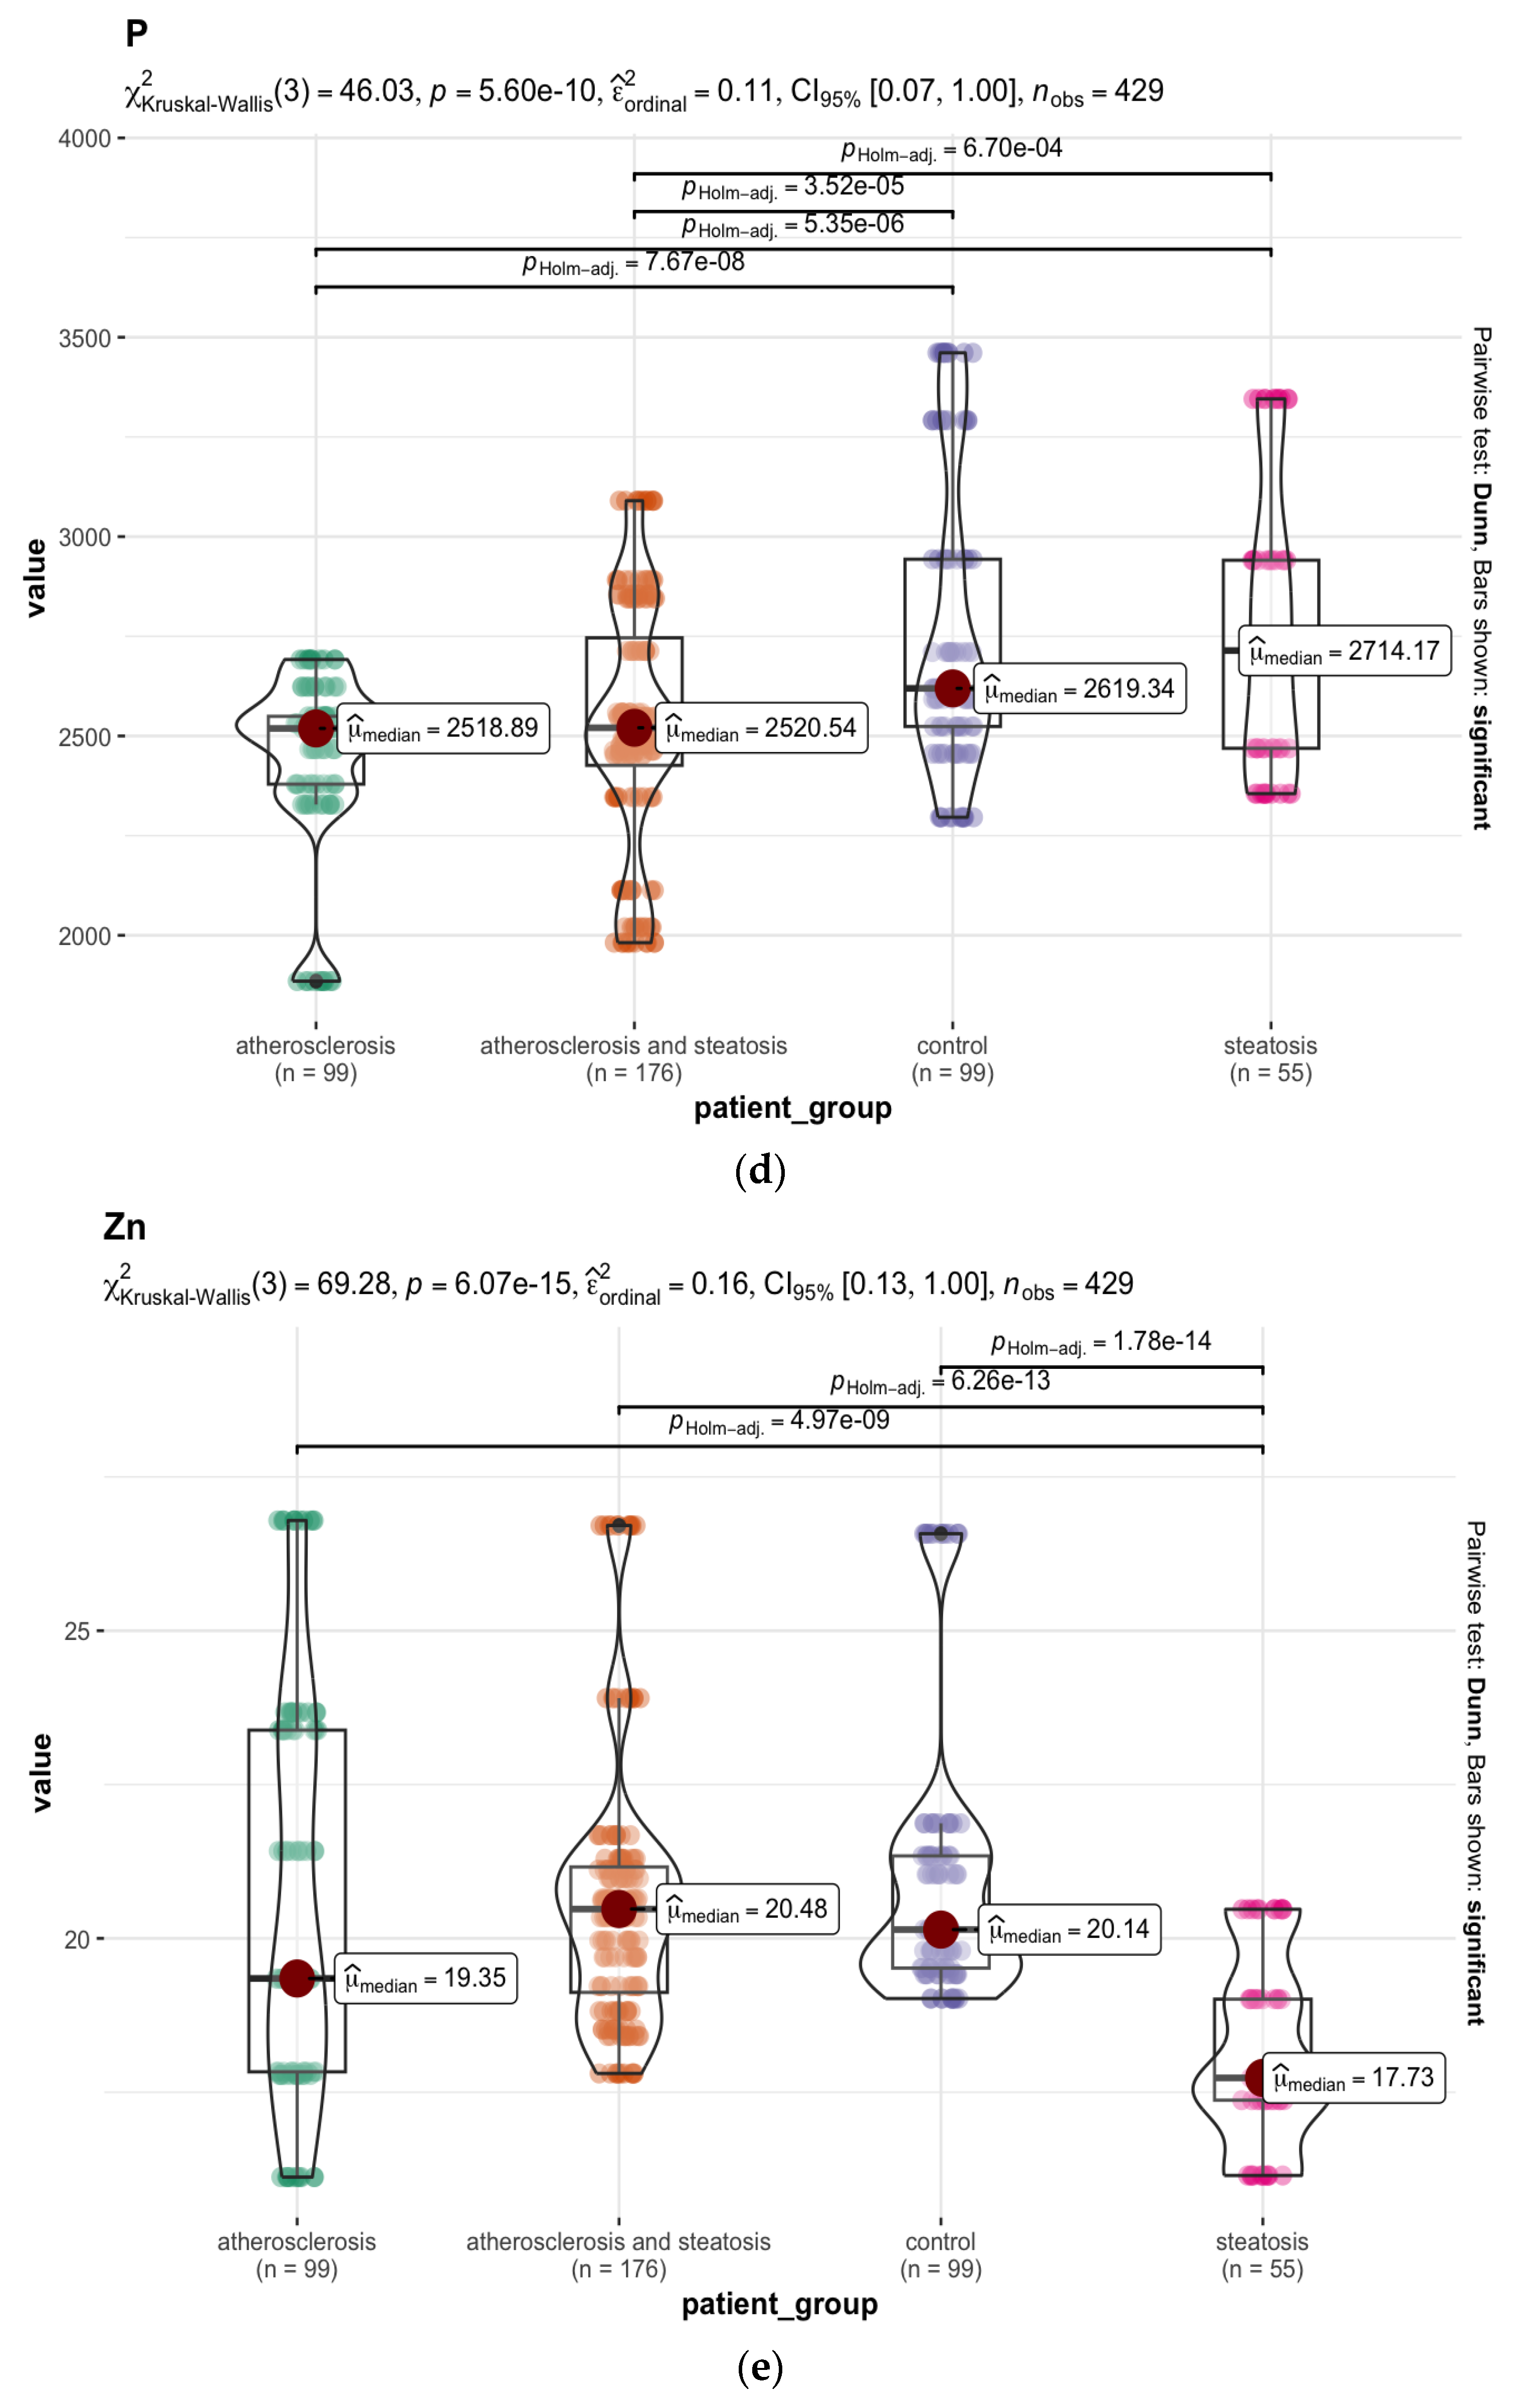
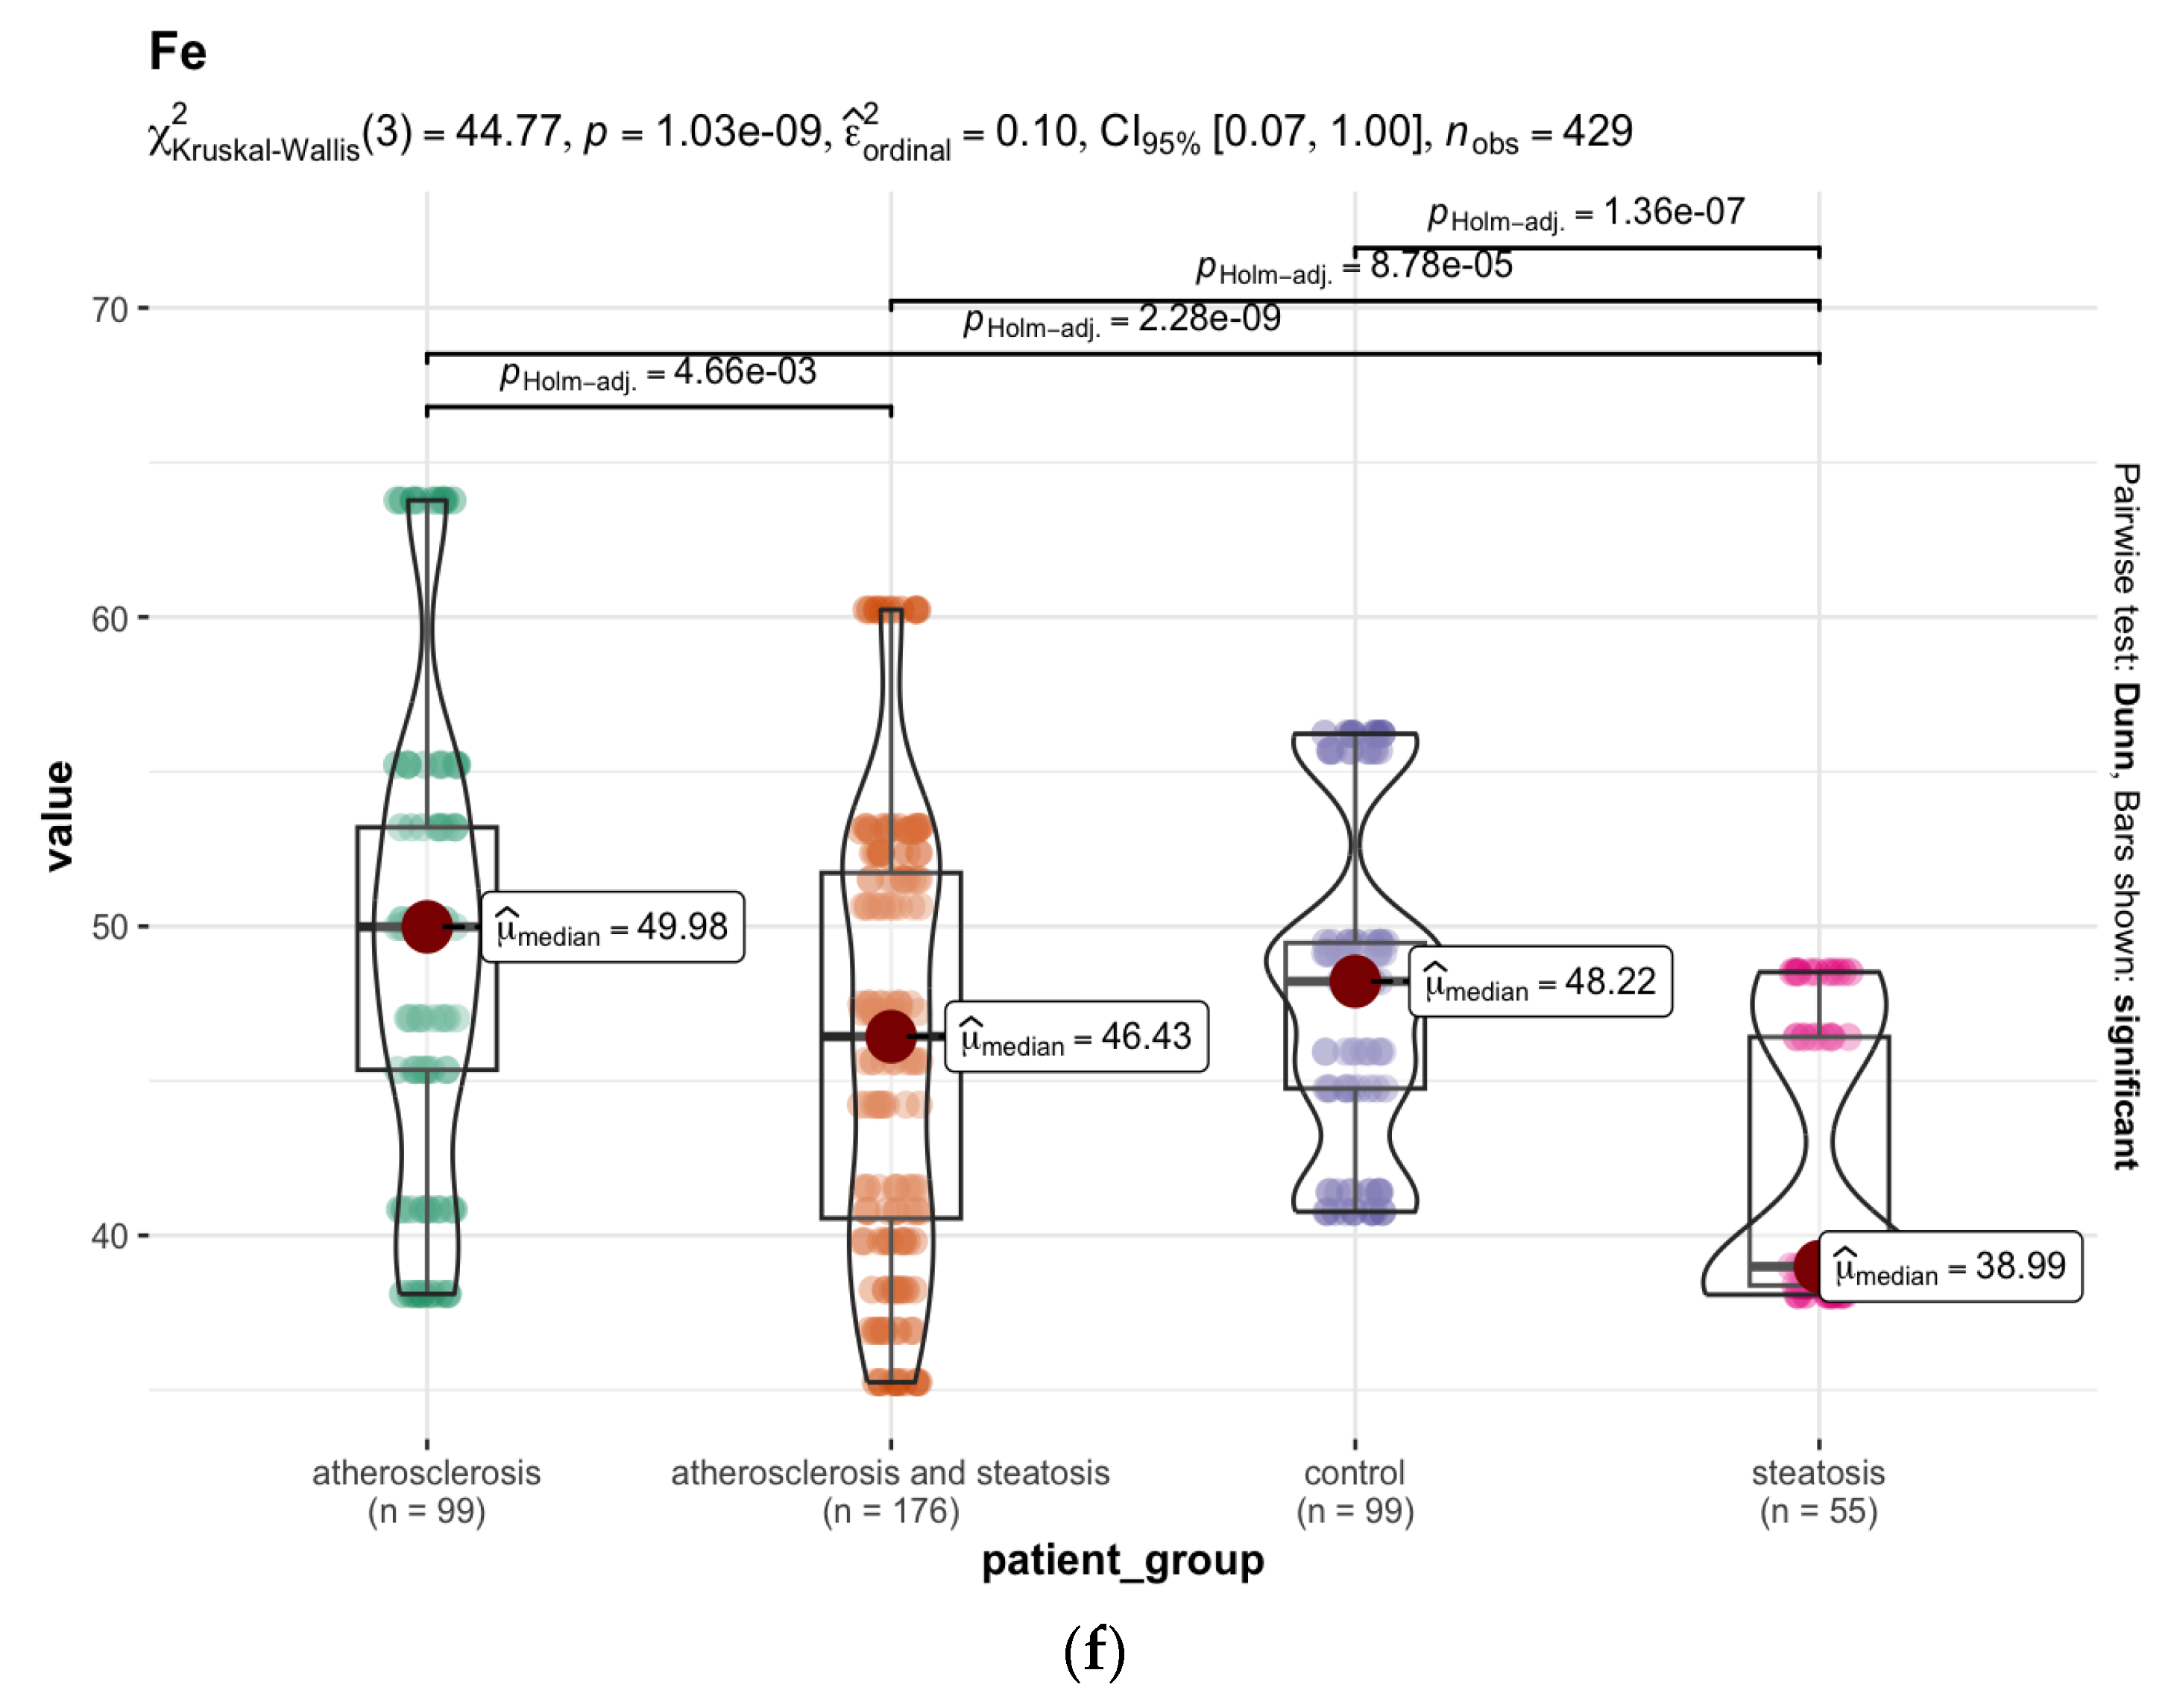
3.3.1. The Liver
3.3.2. The Brain
3.4. Differences in Elemental Composition of the Brain and Liver Samples in Selected Cases
4. Discussion
4.1. Atherosclerosis vs. Hepatic Steatosis—The Mineral Difference in the Liver
4.2. Atherosclerosis vs. Steatosis Mineral Difference in the Brain
4.3. Cases of Outliers
4.3.1. A Hip Prosthesis
4.3.2. Bipolar Disorder (BD)
5. Conclusions
Supplementary Materials
Author Contributions
Funding
Institutional Review Board Statement
Informed Consent Statement
Data Availability Statement
Conflicts of Interest
References
- Fuchs, M. Non-Alcoholic Fatty Liver Disease: The Bile Acid-Activated Farnesoid X Receptor as an Emerging Treatment Target. J. Lipids 2012, 2012, 934396. [Google Scholar] [CrossRef] [Green Version]
- Hassen, G.; Singh, A.; Belete, G.; Jain, N.; De la Hoz, I.; Camacho-Leon, G.P.; Dargie, N.K.; Carrera, K.G.; Alemu, T.; Jhaveri, S.; et al. Nonalcoholic Fatty Liver Disease: An Emerging Modern-Day Risk Factor for Cardiovascular Disease. Cureus 2022, 14, e25495. [Google Scholar] [CrossRef]
- Cai, J.; Zhang, X.-J.; Ji, Y.-X.; Zhang, P.; She, Z.-G.; Li, H. Nonalcoholic Fatty Liver Disease Pandemic Fuels the Upsurge in Cardiovascular Diseases. Circ. Res. 2020, 126, 679–704. [Google Scholar] [CrossRef]
- Stahl, E.P.; Dhindsa, D.S.; Lee, S.K.; Sandesara, P.B.; Chalasani, N.P.; Sperling, L.S. Nonalcoholic Fatty Liver Disease and the Heart: JACC State-of-the-Art Review. J. Am. Coll. Cardiol. 2019, 73, 948–963. [Google Scholar] [CrossRef]
- Lee, H.; Lee, Y.-H.; Kim, S.U.; Kim, H.C. Metabolic Dysfunction-Associated Fatty Liver Disease and Incident Cardiovascular Disease Risk: A Nationwide Cohort Study. Clin. Gastroenterol. Hepatol. Off. Clin. Pract. J. Am. Gastroenterol. Assoc. 2021, 19, 2138–2147. [Google Scholar] [CrossRef]
- Salgado Alvarez, G.A.; Pinto Galvez, S.M.; Garcia Mora, U.; Cano Contreras, A.D.; Durán Rosas, C.; Priego-Parra, B.A.; Triana Romero, A.; Amieva Balmori, M.; Roesch Dietlen, F.; Martinez Vazquez, S.E.; et al. Higher Cardiovascular Risk Scores and Liver Fibrosis Risk Estimated by Biomarkers in Patients with Metabolic-Dysfunction-Associated Fatty Liver Disease. World J. Hepatol. 2022, 14, 1633–1642. [Google Scholar] [CrossRef]
- World Health Organization (WHO). Available online: https://www.who.int (accessed on 29 January 2023).
- Ampuero, J.; Gallego-Durán, R.; Romero-Gómez, M. Association of NAFLD with Subclinical Atherosclerosis and Coronary-Artery Disease: Meta-Analysis. Rev. Esp. Enferm. Dig. 2015, 107, 10–16. [Google Scholar]
- Angulo, P. Nonalcoholic Fatty Liver Disease. N. Engl. J. Med. 2002, 346, 1221–1231. [Google Scholar] [CrossRef] [Green Version]
- Clouston, A.D.; Powell, E.E. Nonalcoholic Fatty Liver Disease: Is All the Fat Bad? Intern. Med. J. 2004, 34, 187–191. [Google Scholar] [CrossRef]
- Behera, A.; Sahu, A.; Nayak, S.K.; Agrawal, K.C. Liver autopsy study—Incidental pathological findings. Pathol. Update Trop. J. Path. Micro. 2017, 3, 390–395. [Google Scholar] [CrossRef]
- Odriozola, A.; Santos-Laso, A.; del Barrio, M.; Cabezas, J.; Iruzubieta, P.; Arias-Loste, M.T.; Rivas, C.; Duque, J.C.R.; Antón, Á.; Fábrega, E.; et al. Fatty Liver Disease, Metabolism and Alcohol Interplay: A Comprehensive Review. Int. J. Mol. Sci. 2023, 24, 7791. [Google Scholar] [CrossRef]
- Rhodes, F.A.; Cococcia, S.; Patel, P.; Panovska-Griffiths, J.; Tanwar, S.; Westbrook, R.H.; Rodger, A.; Rosenberg, W. Is there scope to improve the selection of patients with alcohol-related liver disease for referral to secondary care? A retrospective analysis of primary care referrals to a UK liver centre, incorporating simple blood tests. BMJ Open 2021, 11, e047786. [Google Scholar] [CrossRef]
- Alagarsamy, J.; Muthureddy, Y.; Subhash Rao Yadav, N. Incidentally discovered diseases—An Autopsy Study of Fifty Cases. Int. J. Sci. Res. 2014, 3, 1332. [Google Scholar]
- Singal, P.; Kaur, M.; Deepika. Incidental Findings in Autopsy Examination of Liver: A Study of 70 Cases. Ann. Int. Med. Den. Res. 2017, 3, PT30–PT32. [Google Scholar] [CrossRef]
- Devi, P.M.; Myrthong, B.G.; Meera, T.; Nabachandra, H. Pathological Findings of Liver in Autopsy Cases A Study at Imphal. J. Indian Acad. Forensic Med. 2013, 35, 206. [Google Scholar]
- Bravo-Espinoza, I.E.; Arist-Urista, G.; Durán-Padilla, M.A.; Pérez-Hernández, J.L.; López-Pérez, R.Y.; Pérez-Santos, P.L.; Montenegro-Tablada, J.L.; Escobedo-Uribe, J.; Servín-Caamaño, A.; Higuera-De la Tijera, F. Incidental finding of fatty liver in autopsies. Ann. Hepatol. 2022, 27, 100604. [Google Scholar] [CrossRef]
- Thamil Selvi, R.; Selvam, V.; Subramaniam, P.M. Common Silent Liver Disease In and Around of Salem Population: An Autopsy Study. J. Clin. Diagn. Res. 2012, 6, 207–210. [Google Scholar]
- Desmet, V.; Rosai, J. Liver. In Surgical Pathology; Rosai, J., Ed.; Elsevier Mosby: St. Louis, MO, USA, 2004; pp. 925–940. [Google Scholar]
- Hoebinger, C.; Rajcic, D.; Hendrikx, T. Oxidized Lipids: Common Immunogenic Drivers of Non-Alcoholic Fatty Liver Disease and Atherosclerosis. Front. Cardiovasc. Med. 2021, 8, 824481. [Google Scholar] [CrossRef]
- Glass, C.K.; Witztum, J.L. Atherosclerosis. the road ahead. Cell 2001, 104, 503–516. [Google Scholar] [CrossRef] [Green Version]
- Ross, R. Atherosclerosis-an inflammatory disease. N. Engl. J. Med. 1999, 340, 115–126. [Google Scholar] [CrossRef]
- Wei, T.; Liu, J.; Zhang, D.; Wang, X.; Li, G.; Ma, R.; Chen, G.; Lin, X.; Guo, X. The Relationship Between Nutrition and Atherosclerosis. Front. Bioeng. Biotechnol. 2021, 9, 635504. [Google Scholar] [CrossRef]
- World Health Organization (WHO). Cardiovascular Disease (CVDs). Available online: https://www.who.int/news-room/fact-sheets/detail/cardiovascular-diseases-(cvds) (accessed on 11 June 2021).
- Visseren, F.L.J.; Mach, F.; Smulders, Y.M.; Carballo, D.; Koskinas, K.C.; Bäck, M.; Benetos, A.; Biffi, A.; Boavida, J.M.; Capodanno, D.; et al. ESC National Cardiac Societies; ESC Scientific Document Group. 2021 ESC Guidelines on cardiovascular disease prevention in clinical practice. Eur. Heart J. 2021, 42, 3227–3337. [Google Scholar] [CrossRef]
- Rao, M.; Xavier, D.; Devi, P.; Sigamani, A.; Faruqui, A.; Gupta, R.; Kerkar, P.; Jain, R.K.; Joshi, R.; Chidambaram, N.; et al. Prevalence, treatments and outcomes of coronary artery disease in Indians: A systematic review. Indian Heart J. 2015, 67, 302–310. [Google Scholar] [CrossRef] [Green Version]
- Vaideeswar, P.; Tyagi, S.; Singaravel, S. Pathology of Atherosclerotic Coronary Artery Disease in the Young Indian Population. Forensic Sci. Res. 2019, 4, 241–246. [Google Scholar] [CrossRef] [Green Version]
- Zhu, Y.; Xian, X.; Wang, Z.; Bi, Y.; Chen, Q.; Han, X.; Tang, D.; Chen, R. Research progress on the relationship between atherosclerosis and inflammation. Biomolecules 2018, 8, 80. [Google Scholar] [CrossRef] [Green Version]
- Förstermann, U.; Xia, N.; Li, H. Roles of vascular oxidative stress and nitric oxide in the pathogenesis of atherosclerosis. Circ. Res. 2017, 120, 713–735. [Google Scholar] [CrossRef]
- Saxton, A.; Manna, B. Anatomy, Thorax, Heart Right Coronary Arteries. In StatPearls Treasure Island (FL); StatPearls Publishing: St. Petersburg, FL, USA, 2019. [Google Scholar]
- Da Luz, P.L.; Libby, P.; Laurindo, F.R.; Chagas, A.C. Endothelium in Atherosclerosis: Plaque Formation and Its Complications. In Endothelium and Cardiovascular Diseases: Vascular Biology and Clinical Syndromes; Da Luz, P.L., Libby, P., Laurindo, F.R., Chagas, A.C., Eds.; Elsevier: London, UK, 2018; pp. 493–512. [Google Scholar]
- Babaniamansour, P.; Mohammadi, M.; Babaniamansour, S.; Aliniagerdroudbari, E. The Relation between Atherosclerosis Plaque Composition and Plaque Rupture. J. Med. Signals Sens. 2020, 10, 267–273. [Google Scholar] [CrossRef]
- Libby, P.; Pasterkamp, G. Requiem for the ‘vulnerable plaque’. Eur. Heart J. 2015, 36, 2984–2987. [Google Scholar] [CrossRef] [Green Version]
- Cilla, M.; Peña, E.; Martínez, M.A. 3D computational parametric analysis of eccentric atheroma plaque: Influence of axial and circumferential residual stresses. Biomech. Model Mechanobiol. 2012, 11, 1001–1013. [Google Scholar] [CrossRef]
- Barrett, H.E.; Van der Heiden, K.; Farrell, E.; Gijsen, F.J.H.; Akyildiz, A.C. Calcifications in atherosclerotic plaques and impact on plaque biomechanics. J. Biomech. 2019, 87, 1–12. [Google Scholar] [CrossRef]
- Liang, X.; Xenos, M.; Alemu, Y.; Rambhia, S.H.; Lavi, I.; Kornowski, R.; Gruberg, L.; Fuchs, S.; Einav, S.; Bluestein, D. Biomechanical factors in coronary vulnerable plaque risk of rupture: Intravascular ultrasound-based patient-specific fluid-structure interaction studies. Coron. Artery Dis. 2013, 24, 75–87. [Google Scholar] [CrossRef] [Green Version]
- Li, Z.Y.; Howarth, S.; Trivedi, R.A.; U-King-Im, J.M.; Graves, M.J.; Brown, A.; Wang, L.; Gillard, J.H. Stress analysis of carotid plaque rupture based on in vivo high resolution MRI. J. Biomech. 2006, 39, 2611–2622. [Google Scholar] [CrossRef]
- Stachowska, E.; Chlubek, D.; Dołęgowska, B.; Gutowski, P.; Jakubowska, K.; Noceń, I.; Machoy, Z.; Szumiłowicz, H.; Cnotliwy, M. Possible interactions of fluoride, calcium, and fatty acids in atherosclerotic plaques. Acta Angiol. 2003, 9, 151–157. [Google Scholar]
- Kooi, M.E.; Cappendijk, V.C.; Cleutjens, K.B.; Kessels, A.G.; Kitslaar, P.J.; Borgers, M.; Frederik, P.M.; Daemen, M.J.; van Engelshoven, J.M. Accumulation of ultrasmall superparamagnetic particles of iron oxide in human atherosclerotic plaques can be detected by in vivo magnetic resonance imaging. Circulation 2003, 107, 2453–2458. [Google Scholar] [CrossRef] [Green Version]
- Uca, Y.O.; Hallmann, D.; Hesse, B.; Seim, C.; Stolzenburg, N.; Pietsch, H.; Schnorr, J.; Taupitz, M. Microdistribution of Magnetic Resonance Imaging Contrast Agents in Atherosclerotic Plaques Determined by LA-ICP-MS and SR-μXRF Imaging. Mol. Imaging Biol. 2021, 23, 382–393. [Google Scholar] [CrossRef]
- Hanć, A.; Komorowicz, I.; Iskra, M.; Majewski, W.; Barałkiewicz, D. Application of spectroscopic techniques: ICP-OES, LA-ICP-MS and chemometric methods for studying the relationships between trace elements in clinical samples from patients with atherosclerosis obliterans. Anal. Bioanal, Chem. 2011, 399, 3221–3231. [Google Scholar] [CrossRef] [Green Version]
- Zhang, L.; She, Z.G.; Li, H.; Zhang, X.J. Non-alcoholic fatty liver disease: A metabolic burden promoting atherosclerosis. Clin. Sci. 2020, 134, 1775–1799. [Google Scholar] [CrossRef]
- Gaudio, E.; Nobili, V.; Franchitto, A.; Onori, P.; Carpino, G. Nonalcoholic fatty liver disease and atherosclerosis. Intern. Emerg. Med. 2012, 7, S297–S305. [Google Scholar] [CrossRef]
- Andújar-Vera, F.; Ferrer-Millán, M.; García-Fontana, C.; García-Fontana, B.; González-Salvatierra, S.; Sanabria-de la Torre, R.; Martínez-Heredia, L.; Riquelme-Gallego, B.; Muñoz-Torres, M. Analysis of the Genetic Relationship between Atherosclerosis and Non-Alcoholic Fatty Liver Disease through Biological Interaction Networks. Int. J. Mol. Sci. 2023, 24, 4124. [Google Scholar] [CrossRef]
- Atef, M.E.; Anand-Srivastava, M.B. Role of PKCδ in Enhanced Expression of Gqα/PLCβ1 Proteins and VSMC Hypertrophy in Spontaneously Hypertensive Rats. PLoS ONE 2016, 11, e0157955. [Google Scholar] [CrossRef] [Green Version]
- McLean, K.; Schirm, S.; Johns, A.; Morser, J.; Light, D.R. FXa-Induced Responses in Vascular Wall Cells Are PAR-Mediated and Inhibited by ZK-807834. Thromb. Res. 2001, 103, 281–297. [Google Scholar] [CrossRef]
- Koch, M.; Zernecke, A. The Hemostatic System as a Regulator of Inflammation in Atherosclerosis. IUBMB Life 2014, 66, 735–744. [Google Scholar] [CrossRef]
- Marin, V.; Farnarier, C.; Grès, S.; Kaplanski, S.; Su, M.S.; Dinarello, C.A.; Kaplanski, G. The P38 Mitogen-Activated Protein Kinase Pathway Plays a Critical Role in Thrombin-Induced Endothelial Chemokine Production and Leukocyte Recruitment. Blood 2001, 98, 667–673. [Google Scholar] [CrossRef] [Green Version]
- Karış, D.; Tarhan, D.; Boyacıoğlu, K.; Köksal, C.; Ercan, A.M. The comparison of zinc, copper and iron levels in serum, aorta and left internal mammarian artery tissues in coronary by-pass graft surgery patients. J. Trace Elem. Med. Biol. 2019, 51, 86–90. [Google Scholar] [CrossRef]
- Szebeni, A.; Varga, I.; Kovács, B.; Tolvaj, G.; Zalatnai, A. Elements from Liver Biopsy Materials of Patients with Chronic Diffuse Liver Diseases with Different Ultrasound Attenuation. In Liver Biopsy; Takahashi, H., Ed.; InTechOpen: London, UK, 2011. [Google Scholar]
- Baj, J.; Teresiński, G.; Kowalska, B.; Krajka, T.; Buszewicz, G.; Forma, A.; Flieger, W.; Karakuła, K.H.; Kędzierawski, P.; Cywka, T.; et al. ICP-MS Multi-Elemental Analysis of the Human Meninges Collected from Sudden Death Victims in South-Eastern Poland. Molecules 2022, 27, 1911. [Google Scholar] [CrossRef]
- Baj, J.; Forma, A.; Kowalska, B.; Teresiński, G.; Buszewicz, G.; Majerek, D.; Flieger, W.; Maciejewski, R.; Karakuła, K.; Flieger, M.; et al. Multi-Elemental Analysis of Human Optic Chiasm—A New Perspective to Reveal the Pathomechanism of Nerve Fibers’ Degeneration. Int. J. Environ. Res. Public Health 2022, 19, 4420. [Google Scholar] [CrossRef]
- Baj, J.; Kowalska, B.; Flieger, W.; Radzikowska-Büchner, E.; Forma, A.; Czeczelewski, M.; Kędzierawski, P.; Karakuła, K.; Flieger, M.; Majerek, D.; et al. Assessment of the Concentration of 51 Elements in the Liver and in Various Parts of the Human Brain—Profiling of the Mineral Status. Nutrients 2023, 15, 2799. [Google Scholar] [CrossRef]
- R Core Team. R: A Language and Environment for Statistical Computing, Versión, 4.3.0; R Foundation for Statistical Computing: Indianapolis, IN, USA, 2023; Available online: https://www.r-project.org/ (accessed on 21 April 2023).
- Kassambara, A.; Mundt, F. Factoextra: Extract and Visualize the Results of Multivariate Data Analyses. R Package Version 1.0.7. 2020. Available online: https://CRAN.R-project.org/package=factoextra (accessed on 23 October 2022).
- Sievert, C. Interactive Web-Based Data Visualization with R, Plotly, and Shiny, 1st ed.; CRC Press: Boca Raton, FL, USA, 2020; Available online: https://plotly-r.com (accessed on 28 January 2020).
- Kassambara, A. Rstatix: Pipe-Friendly Framework for Basic Statistical Tests. Available online: https://CRAN.R-project.org/package=rstatix (accessed on 1 February 2023).
- Wickham, H.; Averick, M.; Bryan, J.; Chang, W.; D’Agostino McGowan, L.; François, R.; Grolemund, G.; Hayes, A.; Henry, L.; Hester, J.; et al. Welcome to the Tidyverse. J. Open Source Softw. 2019, 4, 1686. [Google Scholar] [CrossRef] [Green Version]
- Sjoberg, D.D.; Whiting, K.; Curry, M.; Lavery, J.A.; Larmarange, J. Reproducible Summary Tables with the Gtsummary Package. R J. 2021, 13, 570–580. [Google Scholar] [CrossRef]
- Jolliffe, I.T. Principal Component Analysis; Springer Series w Statistics (SSS); Springer: New York, NY, USA, 2002. [Google Scholar]
- Liu, H. Comparing Welch’s ANOVA, a Kruskal-Wallis Test and Traditional ANOVA in Case of Heterogeneity of Variance; Virginia Commonwealth University: Richmond, VA, USA, 2015. [Google Scholar] [CrossRef]
- Barbara, M.; Mindikoglu, A.L. The role of zinc in the prevention and treatment of nonalcoholic fatty liver disease. Metabol Open 2021, 11, 100105. [Google Scholar] [CrossRef]
- Akdas, S.; Yazihan, N. Serum zinc level and dietary zinc intake status in non-alcoholic fatty liver disease: A meta-analysis and systematic review. Hepatol. Forum 2020, 2, 59–67. [Google Scholar] [CrossRef]
- Ito, T.; Ishigami, M.; Ishizu, Y.; Kuzuya, T.; Honda, T.; Ishikawa, T. Correlation of serum zinc levels with pathological and laboratory findings in patients with nonalcoholic fatty liver disease. Eur. J. Gastroenterol. Hepatol. 2020, 32, 748–753. [Google Scholar] [CrossRef]
- Kotronen, A.; Peltonen, M.; Hakkarainen, A.; Sevastianova, K.; Bergholm, R.; Johansson, L.M. Prediction of non-alcoholic fatty liver disease and liver fat using metabolic and genetic factors. Gastroenterology 2009, 137, 865–872. [Google Scholar] [CrossRef]
- Sterling, R.K.; Lissen, E.; Clumeck, N.; Sola, R.; Correa, M.C.; Montaner, J. Development of a simple noninvasive index to predict significant fibrosis in patients with HIV/HCV coinfection. Hepatology 2006, 43, 1317–1325. [Google Scholar] [CrossRef]
- Gatiatulina, E.R.; Sheina, E.A.; Nemereshina, O.N.; Popova, E.V.; Polyakova, V.S.; Agletdinov, E.F. Effect of Zn supplementation on trace element status in rats with diet-induced non-alcoholic fatty liver disease. Biol. Trace Elem. Res. 2020, 197, 202–212. [Google Scholar] [CrossRef]
- Qi, Y.; Zhang, Z.; Liu, S.; Aluo, Z.; Zhang, L.; Yu, L. Zinc supplementation alleviates lipid and glucose metabolic disorders induced by a high-fat diet. J. Agric. Food Chem. 2020, 68, 5189–5200. [Google Scholar] [CrossRef]
- Vivero, A.; Ruz, M.; Rivera, M.; Miranda, K.; Sacristán, C.; Espinosa, A. Zinc supplementation and strength exercise in rats with type 2 diabetes: Akt and PTP1B phosphorylation in nonalcoholic fatty liver. Biol. Trace Elem. Res. 2021, 199, 2215–2224. [Google Scholar] [CrossRef]
- Aigner, E.; Strasser, M.; Haufe, H.; Sonnweber, T.; Hohla, F.; Stadlmayr, A.; Solioz, M.; Tilg, H.; Patsch, W.; Weiss, G.; et al. A role for low hepatic copper concentrations in nonalcoholic Fatty liver disease. Am. J. Gastroenterol. 2010, 105, 1978–1985. [Google Scholar] [CrossRef]
- Aigner, E.; Weiss, G.; Datz, C. Dysregulation of iron and copper homeostasis in nonalcoholic fatty liver. World J. Hepatol. 2015, 7, 177–188. [Google Scholar] [CrossRef] [Green Version]
- Majewski, W.; Iskra, M.; Stanisic, M.; Laciak, M.; Mackiewicz, A.; Staniszewski, R. The importance of ceruloplasmin oxidase activity in patients with chronic lower limb atherosclerotic ischemia. Int. Angiol. 2007, 26, 341–345. [Google Scholar]
- Chen, S.Y.; Wu, C.F.; Wu, C.; Chan, C.C.; Hwang, J.S.; Su, T.C. Urban Fine Particulate Matter and Elements Associated with Subclinical Atherosclerosis in Adolescents and Young Adults. Environ. Sci. Technol. 2022, 56, 7266–7274. [Google Scholar] [CrossRef]
- Salonen, J.T.; Salonen, R.; Seppänen, K.; Kantola, M.; Suntioinen, S.; Korpela, H. Interactions of serum copper, selenium, and low density lipoprotein cholesterol in atherogenesis. BMJ 1991, 302, 756–760. [Google Scholar] [CrossRef] [Green Version]
- Hamilton, I.M.; Gilmore, W.S.; Strain, J.J. Marginal copper deficiency and atherosclerosis. Biol. Trace Elem. Res. 2000, 78, 179–189. [Google Scholar] [CrossRef]
- Lamb, D.J.; Reeves, G.L.; Taylor, A.; Ferns, G.A. Dietary copper supplementation reduces atherosclerosis in the cholesterol-fed rabbit. Atherosclerosis 1999, 146, 33–43. [Google Scholar] [CrossRef]
- Fanni, D.; Gerosa, C.; Nurchi, V.M.; Suri, J.S.; Nardi, V.; Congiu, T.; Coni, P.; Ravarino, A.; Cerrone, G.; Piras, M.; et al. Trace elements and the carotid plaque: The GOOD (Mg, Zn, Se), the UGLY (Fe, Cu), and the BAD (P, Ca)? Eur. Rev. Med. Pharmacol. Sci. 2021, 25, 3772–3790. [Google Scholar] [CrossRef]
- Lee, S.; Nam, K.H.; Seong, J.K.; Ryu, D.Y. Molybdate Attenuates Lipid Accumulation in the Livers of Mice Fed a Diet Deficient in Methionine and Choline. Biol. Pharm. Bull. 2018, 41, 1203–1210. [Google Scholar] [CrossRef] [Green Version]
- Li, L.; Huang, L.; Huang, S.; Luo, X.; Zhang, H.; Mo, Z.; Wu, T.; Yang, X. Non-linear association of serum molybdenum and linear association of serum zinc with nonalcoholic fatty liver disease: Multiple-exposure and Mendelian randomization approach. Sci. Total Environ. 2020, 720, 137655. [Google Scholar] [CrossRef]
- Li, L.; Yang, X. The Essential Element Manganese, Oxidative Stress, and Metabolic Diseases: Links and Interactions. Oxid. Med. Cell Longev. 2018, 2018, 7580707. [Google Scholar] [CrossRef] [Green Version]
- Nasr, P.; Ignatova, S.; Lundberg, P.; Kechagias, S.; Ekstedt, M. Low hepatic manganese concentrations in patients with hepatic steatosis—A cohort study of copper, iron and manganese in liver biopsies. J. Trace Elem. Med. Biol. 2021, 67, 126772. [Google Scholar] [CrossRef]
- Aschner, J.L.; Aschner, M. Nutritional aspects of manganese homeostasis. Mol. Aspects Med. 2005, 26, 353–362. [Google Scholar] [CrossRef]
- Britton, L.J.; Subramaniam, V.N.; Crawford, D.H. Iron and non-alcoholic fatty liver disease. World J. Gastroenterol. 2016, 22, 8112–8122. [Google Scholar] [CrossRef] [Green Version]
- Hagström, H.; Nasr, P.; Bottai, M.; Ekstedt, M.; Kechagias, S.; Hultcrantz, R.; Stål, P. Elevated serum ferritin is associated with increased mortality in non-alcoholic fatty liver disease after 16 years of follow-up. Liver Int. 2016, 36, 1688–1695. [Google Scholar] [CrossRef]
- Rokita, E.; Cichocki, T.; Heck, D.; Jarczyk, L.; Kunz, J.; Strzalkowski, A. Elemental composition of inorganic deposits in the wall of human aorta. Trace Elem. Med. 1989, 6, 158–164. [Google Scholar]
- Tomazic, B.B.; Brown, W.E.; Scoen, F.J. Physicochemical properties of calcific deposits isolated from porcine bioprosthetic heart valves removed from patients following 2–13 years function. J. Biomed. Mater. Res. 1994, 28, 35–47. [Google Scholar] [CrossRef]
- Higgins, C.L.; Marvel, S.A.; Morrisett, J.D. Quantification of calcification in atherosclerotic lesions. Arterioscler. Thromb. Vasc. Biol. 2005, 25, 1567–1576. [Google Scholar] [CrossRef] [Green Version]
- Ye, Q.; Park, J.E.; Gugnani, K.; Betharia, S.; Pino-Figueroa, A.; Kim, J. Influence of iron metabolism on manganese transport and toxicity. Metallomics 2017, 9, 1028–1046. [Google Scholar] [CrossRef]
- Siddappa, A.J.; Rao, R.B.; Wobken, J.D.; Casperson, K.; Leibold, E.A.; Connor, J.R.; Georgieff, M.K. Iron deficiency alters iron regulatory protein and iron transport protein expression in the perinatal rat brain. Pediatr. Res. 2003, 53, 800–807. [Google Scholar] [CrossRef] [Green Version]
- Baringer, S.L.; Neely, E.B.; Palsa, K.; Simpson, I.A.; Connor, J.R. Regulation of brain iron uptake by apo- and holo-transferrin is dependent on sex and delivery protein. Fluids Barriers CNS 2022, 19, 49. [Google Scholar] [CrossRef]
- Ennis, K.; Felt, B.; Georgieff, M.K.; Rao, R. Early-Life Iron Deficiency Alters Glucose Transporter-1 Expression in the Adult Rodent Hippocampus. J. Nutr. 2019, 149, 1660–1666. [Google Scholar] [CrossRef]
- Fitsanakis, V.A.; Zhang, N.; Avison, M.J.; Erikson, K.M.; Gore, J.C.; Aschner, M. Changes in dietary iron exacerbate regional brain manganese accumulation as determined by magnetic resonance imaging. Toxicol. Sci. 2011, 120, 146–153. [Google Scholar] [CrossRef] [Green Version]
- Polyzois, I.; Nikolopoulos, D.; Michos, I.; Patsouris, E.; Theocharis, S. Local and systemic toxicity of nanoscale debris particles in total hip arthroplasty. J. App. Toxicol. 2012, 32, 255–269. [Google Scholar] [CrossRef] [PubMed]
- Nicolli, A.; Bortoletti, I.; Maso, S.; Trevisan, A. Course of Metal Ions after a Revision of Malfunctioning Metal-on-Metal Total Hip Prostheses. Medicina 2021, 57, 115. [Google Scholar] [CrossRef] [PubMed]
- Lutter, C.; Klüß, D.; Enz, A.; Mittelmeier, W. Impingement of metal-polyethylene hip prostheses: Potential cause of high systemic titanium levels? Orthopäde 2020, 49, 1066–1071. [Google Scholar] [CrossRef]
- Fleischer, H.; Lutter, C.; Büttner, A.; Mittelmeier, W.; Thurow, K. Semi-Automated Determination of Heavy Metals in Autopsy Tissue Using Robot-Assisted Sample Preparation and ICP-MS. Molecules 2021, 26, 3820. [Google Scholar] [CrossRef]
- Lützner, J.; Günther, K.P.; Postler, A.; Morlock, M. Metal Ion Release after Hip and Knee Arthroplasty—Causes, Biological Effects and Diagnostics. Z. Orthop. Unfall. 2020, 158, 369–382. [Google Scholar] [CrossRef]
- Perumal, V.; Alkire, M.; Swank, M.L. Unusual presentation of cobalt hypersensitivity in a patient with a metal-on-metal bearing in total hip arthroplasty. Am. J. Orthop. 2010, 39, E39–E41. [Google Scholar]
- Rizzetti, M.C.; Liberini, P.; Zarattini, G.; Catalani, S.; Pazzaglia, U.; Apostoli, P.; Padovani, A. Loss of sight and sound. Could it be the hip? Lancet 2009, 373, 1052. [Google Scholar] [CrossRef]
- Moretti, B.; Pesce, V.; Maccagnano, G.; Vicenti, G.; Lovreglio, P.; Soleo, L.; Apostoli, P. Peripheral neuropathy after hip replacement failure: Is vanadium the culprit? Lancet 2012, 379, 1676. [Google Scholar] [CrossRef]
- Pompéu de Moraes, D.; González-Morales, S.; Toledano-Serrabona, J.; Sánchez-Garcés, M.Á.; Bettmer, J.; Montes-Bayón, M.; Corte-Rodríguez, M. Tracking soluble and nanoparticulated titanium released in vivo from metal dental implant debris using (single-particle)-ICP-MS. J. Trace Elem. Med. Biol. 2023, 77, 127143. [Google Scholar] [CrossRef]
- Toledano-Serrabona, J.; Camps-Font, O.; de Moraes, D.P.; Corte-Rodríguez, M.; Montes-Bayón, M.; Valmaseda-Castellón, E.; Gay-Escoda, C.; Sánchez-Garcés, M.Á. Ion release and local effects of titanium metal particles from dental implants: An experimental study in rats. J. Periodontol. 2023, 94, 119–129. [Google Scholar] [CrossRef]
- Dean, B.; Lam, L.Q.; Scarr, E.; Duce, J.A. Cortical biometals: Changed levels in suicide and with mood disorders. J. Affect. Disord. 2018, 243, 539–544. [Google Scholar] [CrossRef] [PubMed]
- Sampath, V.P.; Singh, S.V.; Pelov, I.; Tirosh, O.; Erel, Y.; Lichtstein, D. Chemical Element Profiling in the Sera and Brain of Bipolar Disorders Patients and Healthy Controls. Int. J. Mol. Sci. 2022, 23, 14362. [Google Scholar] [CrossRef]
- Alasfar, R.H.; Isaifan, R.J. Aluminum environmental pollution: The silent killer. Environ. Sci. Pollut. Res. Int. 2021, 28, 44587–44597. [Google Scholar] [CrossRef] [PubMed]
- Krewski, D.; Yokel, R.A.; Nieboer, E.; Borchelt, D.; Cohen, J.; Harry, J.; Kacew, S.; Lindsay, J.; Mahfouz, A.M.; Rondeau, V. Human health risk assessment for aluminium, aluminium oxide, and aluminium hydroxide. J. Toxicol. Environ. Health B Crit. Rev. 2007, 10, 1–269. [Google Scholar] [CrossRef] [PubMed]
- Dey, M.; Singh, R.K. Neurotoxic effects of aluminium exposure as a potential risk factor for Alzheimer’s disease. Pharmacol. Rep. 2022, 74, 439–450. [Google Scholar] [CrossRef]
- Maya, S.; Prakash, T.; Das Madhu, K.; Goli, D. Multifaceted effects of aluminium in neurodegenerative diseases: A review. Biomed. Pharmacother. 2016, 83, 746–754. [Google Scholar] [CrossRef] [PubMed]
- Cantley, L.C., Jr.; Josephson, L.; Warner, R.; Yanagisawa, M.; Lechene, C.; Guidotti, G. Vanadate is a potent (Na,K)-ATPase inhibitor found in ATP derived from muscle. J. Biol. Chem. 1977, 252, 7421–7423. [Google Scholar] [CrossRef]
- Conri, C.; Simonoff, M.; Fleury, B.; Moreau, F. Does vanadium play a role in depressive states? Biol. Psychiatry 1986, 21, 546–548. [Google Scholar] [CrossRef] [PubMed]
- Naylor, G.J.; Corrigan, F.M.; Smith, A.H.; Connelly, P.; Ward, N.I. Further studies of vanadium in depressive psychosis. Br. J. Psychiatry 1987, 150, 656–661. [Google Scholar] [CrossRef]
- Adebiyi, O.E.; Olopade, J.O.; Olayemi, F.O. Sodium metavanadate induced cognitive decline, behavioral impairments, oxidative stress and down regulation of myelin basic protein in mice hippocampus: Ameliorative roles of beta-spinasterol, and stigmasterol. Brain Behav. 2018, 8, e01014. [Google Scholar] [CrossRef] [Green Version]
- Sanchez, D.J.; Colomina, M.T.; Domingo, J.L. Effects of vanadium on activity and learning in rats. Physiol. Behav. 1998, 63, 345–350. [Google Scholar] [CrossRef] [PubMed]
- Sampath, V.P.; Singh, S.V.; Pelov, I.; Horesh, N.; Zannadeh, H.; Tirosh, O.; Erel, Y.; Lichtstein, D. Vanadium in Bipolar Disorders—Reviving an Old Hypothesis. Int. J. Mol. Sci. 2022, 23, 13901. [Google Scholar] [CrossRef] [PubMed]


| Population | Gender | % | BMI 1 | Min–Max Age | Median Age | Mean Age ± SD 2 |
|---|---|---|---|---|---|---|
| n = 39 | Female n = 9 | 23.08 | 26.56 ± 9.38 | 23–80 | 53.0 | 52.17 ± 24.38 |
| Male n = 30 | 76.92 | 26.80 ± 4.65 | 26–81 | 54.5 | 52.33 ± 16.35 |
| Compared Groups | Group A vs. Group B | Group B vs. Group D | Group A vs. Group D | |||
|---|---|---|---|---|---|---|
| Sample Location | Brain | Liver | Brain | Liver | Brain | Liver |
| Alkali and alkaline Earth metals | rubidium 85Rb, 88Sr, 9Be, 44Ca | - | 85Rb, 88Sr, 9Be, 44Ca, 24Mg, 39K | - | 88Sr, 39K | - |
| Transition metals | 90Zr, 66Zn, 52Cr, 59Co, 63Cu, 111Cd, 201Hg, 202Hg, 178Hf, 107Ag, 51V, 195Pt, 56Fe | 111Cd, 66Zn, 95Mo | 90Zr, 66Zn, 201Hg, 202Hg, 178Hf, 47Ti, 51V, 107Ag, 63Cu, 56Fe, 60Ni, 55Mn | - | 63Cu, 111Cd, 52Cr, 59Co, 47Ti | 51V |
| Lanthanides | 139La, 141Pr, 146Nd, 147Sm, 157Gd, 166Er, 172Yb, 169Tm, 165Ho, 163Dy | - | 139La, 172Yb, 169Tm, 147Sm, 141Pr, 146Nd, 166Er, 165Ho, 163Dy, 140Ce | - | 172Yb, 157Gd, 166Er, 165Ho, 159Tb, 147Sm | - |
| Actinides | 238U, 232Th | - | 238U | - | - | - |
| Semimetals | - | - | - | - | As | - |
| Basic metals (p-block) | 205Tl, 118Sn, 208Pb, 71Ga | - | 208Pb, 71Ga | 118Sn | 205Tl, 118Sn | - |
| Nonmetals | 78Se, 31P | - | 78Se | - | 31P | - |
| Chemical Element | Group A N = 9 1 | Group B N = 5 1 | Group C N = 16 1 | Group D N = 9 1 | p-Value 2 |
|---|---|---|---|---|---|
| 51V 3 | 1.19 (0.84, 1.58) | 6.07 (2.56, 7.82) | 1.64 (1.20, 2.54) | 3.05 (2.86, 3.99) | 0.018 |
| 63Cu 3 | 3499 (3034, 4513) | 1865 (1824, 2359) | 2438 (2171, 3466) | 3792 (2710, 4043) | 0.048 |
| 66Zn 4 | 120 (77, 146) | 64 (59, 69) | 67 (58, 81) | 79 (67, 122) | 0.006 |
| 71Ga 3 | 1.34 (0.45, 2.11) | 0.17 (0.00, 0.61) | 0.73 (0.40, 1.02) | 1.06 (0.84, 4.37) | 0.046 |
| 95Mo 3 | 7841 (6151, 9183) | 2887 (2513, 2994) | 3174 (2515, 6292) | 5771 (4088, 7989) | 0.006 |
| 111Cd 3 | 1857 (872, 2390) | 331 (262, 479) | 455 (262, 627) | 858 (532, 1084) | 0.003 |
| 118Sn 3 | 8 (3, 14) | 1 (0, 1) | 0 (0, 5) | 17 (12, 57) | 0.004 |
| 141Pr 3 | 1.48 (0.61, 2.66) | 0.49 (0.28, 0.55) | 0.48 (0.30, 0.87) | 1.20 (0.76, 3.23) | 0.046 |
| 238U 3 | 0.14 (0.02, 0.18) | 0.00 (0.00, 0.00) | 0.01 (0.00, 0.05) | 0.10 (0.03, 0.31) | 0.023 |
| Chemical Element | Group A N = 99 1 | Group B N = 55 1 | Group C N = 176 1 | Group D N = 99 1 | p-Value 2 |
|---|---|---|---|---|---|
| 63Cu 3 | 3425 (2761, 3677) | 2714 (2452, 3029) | 3220 (2797, 3548) | 2692 (2624, 3541) | <0.001 |
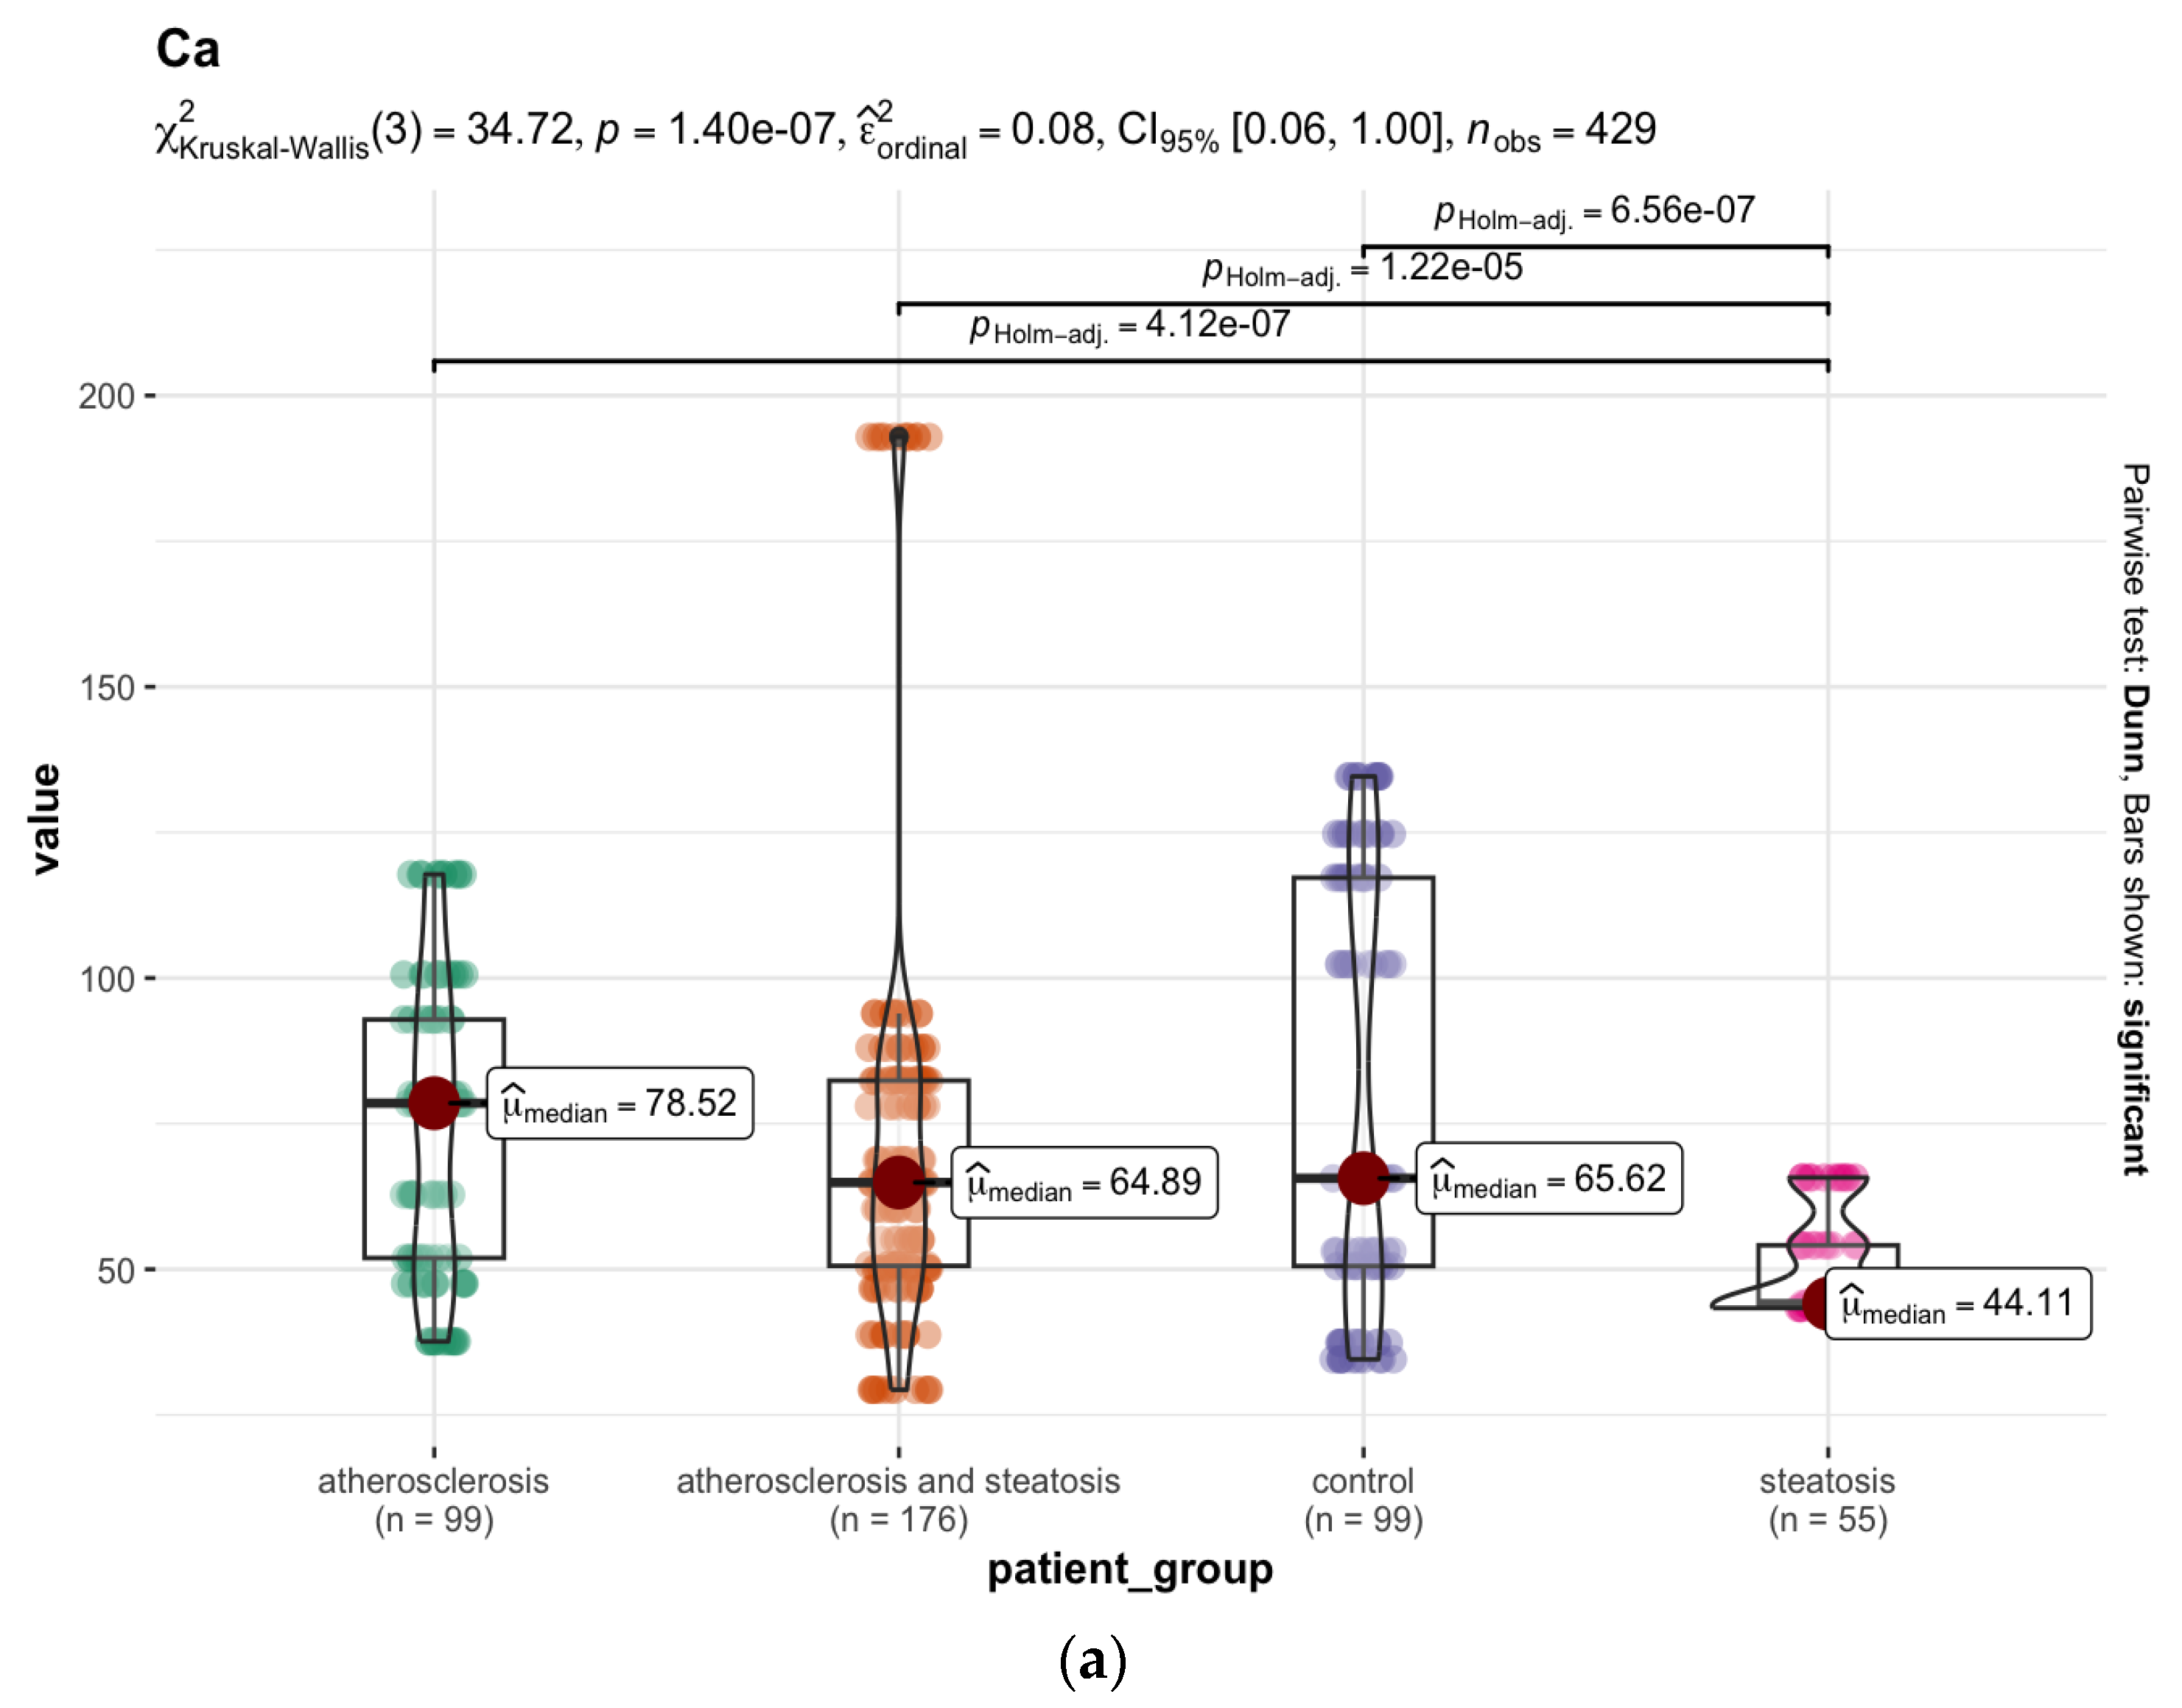
| 44Ca 4 | 79 (52, 93) | 44 (44, 54) | 65 (51, 82) | 66 (51, 117) | <0.001 |
| 52Cr 3 | 7 (2, 20) | 33 (6, 253) | 10 (7, 24) | 15 (9, 27) | <0.001 |
| 56Fe 4 | 50 (45, 53) | 39 (38, 46) | 46 (41, 52) | 48 (45, 49) | <0.001 |
| 31P 4 | 2519 (2379, 2549) | 2714 (2469, 2941) | 2521 (2426, 2746) | 2619 (2524, 2943) | <0.001 |
| 208Pb 3 | 13 (3, 24) | 2 (2, 10) | 14 (9, 20) | 16 (9, 20) | <0.001 |
| 66Zn 4 | 19.3 (17.8, 23.4) | 17.7 (17.4, 19.0) | 20.5 (19.1, 21.2) | 20.1 (19.5, 21.3) | <0.001 |
| 111Cd 3 | 35 (23, 39) | 10 (9, 12) | 20 (10, 26) | 15 (8, 19) | <0.001 |
| 88Sr 3 | 169 (136, 262) | 343 (251, 386) | 219 (175, 300) | 286 (190, 303) | <0.001 |
| 78Se 3 | 126 (108, 131) | 111 (106, 124) | 122 (110, 139) | 144 (108, 149) | <0.001 |
| 85Rb 3 | 2066 (1648, 2340) | 1338 (1272, 1596) | 1669 (1448, 1849) | 1866 (1699, 2461) | <0.001 |
Disclaimer/Publisher’s Note: The statements, opinions and data contained in all publications are solely those of the individual author(s) and contributor(s) and not of MDPI and/or the editor(s). MDPI and/or the editor(s) disclaim responsibility for any injury to people or property resulting from any ideas, methods, instructions or products referred to in the content. |
© 2023 by the authors. Licensee MDPI, Basel, Switzerland. This article is an open access article distributed under the terms and conditions of the Creative Commons Attribution (CC BY) license (https://creativecommons.org/licenses/by/4.0/).
Share and Cite
Baj, J.; Kowalska, B.; Barbachowska, A.; Forma, A.; Flieger, M.; Majerek, D.; Teresiński, G.; Flieger, W.; Portincasa, P.; Buszewicz, G.; et al. Linking Metallic Micronutrients and Toxic Xenobiotics to Atherosclerosis and Fatty Liver Disease—Postmortem ICP-MS Analysis of Selected Human Tissues. Nutrients 2023, 15, 3458. https://doi.org/10.3390/nu15153458
Baj J, Kowalska B, Barbachowska A, Forma A, Flieger M, Majerek D, Teresiński G, Flieger W, Portincasa P, Buszewicz G, et al. Linking Metallic Micronutrients and Toxic Xenobiotics to Atherosclerosis and Fatty Liver Disease—Postmortem ICP-MS Analysis of Selected Human Tissues. Nutrients. 2023; 15(15):3458. https://doi.org/10.3390/nu15153458
Chicago/Turabian StyleBaj, Jacek, Beata Kowalska, Aleksandra Barbachowska, Alicja Forma, Michał Flieger, Dariusz Majerek, Grzegorz Teresiński, Wojciech Flieger, Piero Portincasa, Grzegorz Buszewicz, and et al. 2023. "Linking Metallic Micronutrients and Toxic Xenobiotics to Atherosclerosis and Fatty Liver Disease—Postmortem ICP-MS Analysis of Selected Human Tissues" Nutrients 15, no. 15: 3458. https://doi.org/10.3390/nu15153458
APA StyleBaj, J., Kowalska, B., Barbachowska, A., Forma, A., Flieger, M., Majerek, D., Teresiński, G., Flieger, W., Portincasa, P., Buszewicz, G., Radzikowska-Büchner, E., & Flieger, J. (2023). Linking Metallic Micronutrients and Toxic Xenobiotics to Atherosclerosis and Fatty Liver Disease—Postmortem ICP-MS Analysis of Selected Human Tissues. Nutrients, 15(15), 3458. https://doi.org/10.3390/nu15153458