
Dietary Intake and Its Association with Birth Outcomes in Women with Nausea and Vomiting during the Second Trimester of Pregnancy: A Prospective Cohort Study in Japan


 , , , , ,
Abstract
:1. Introduction
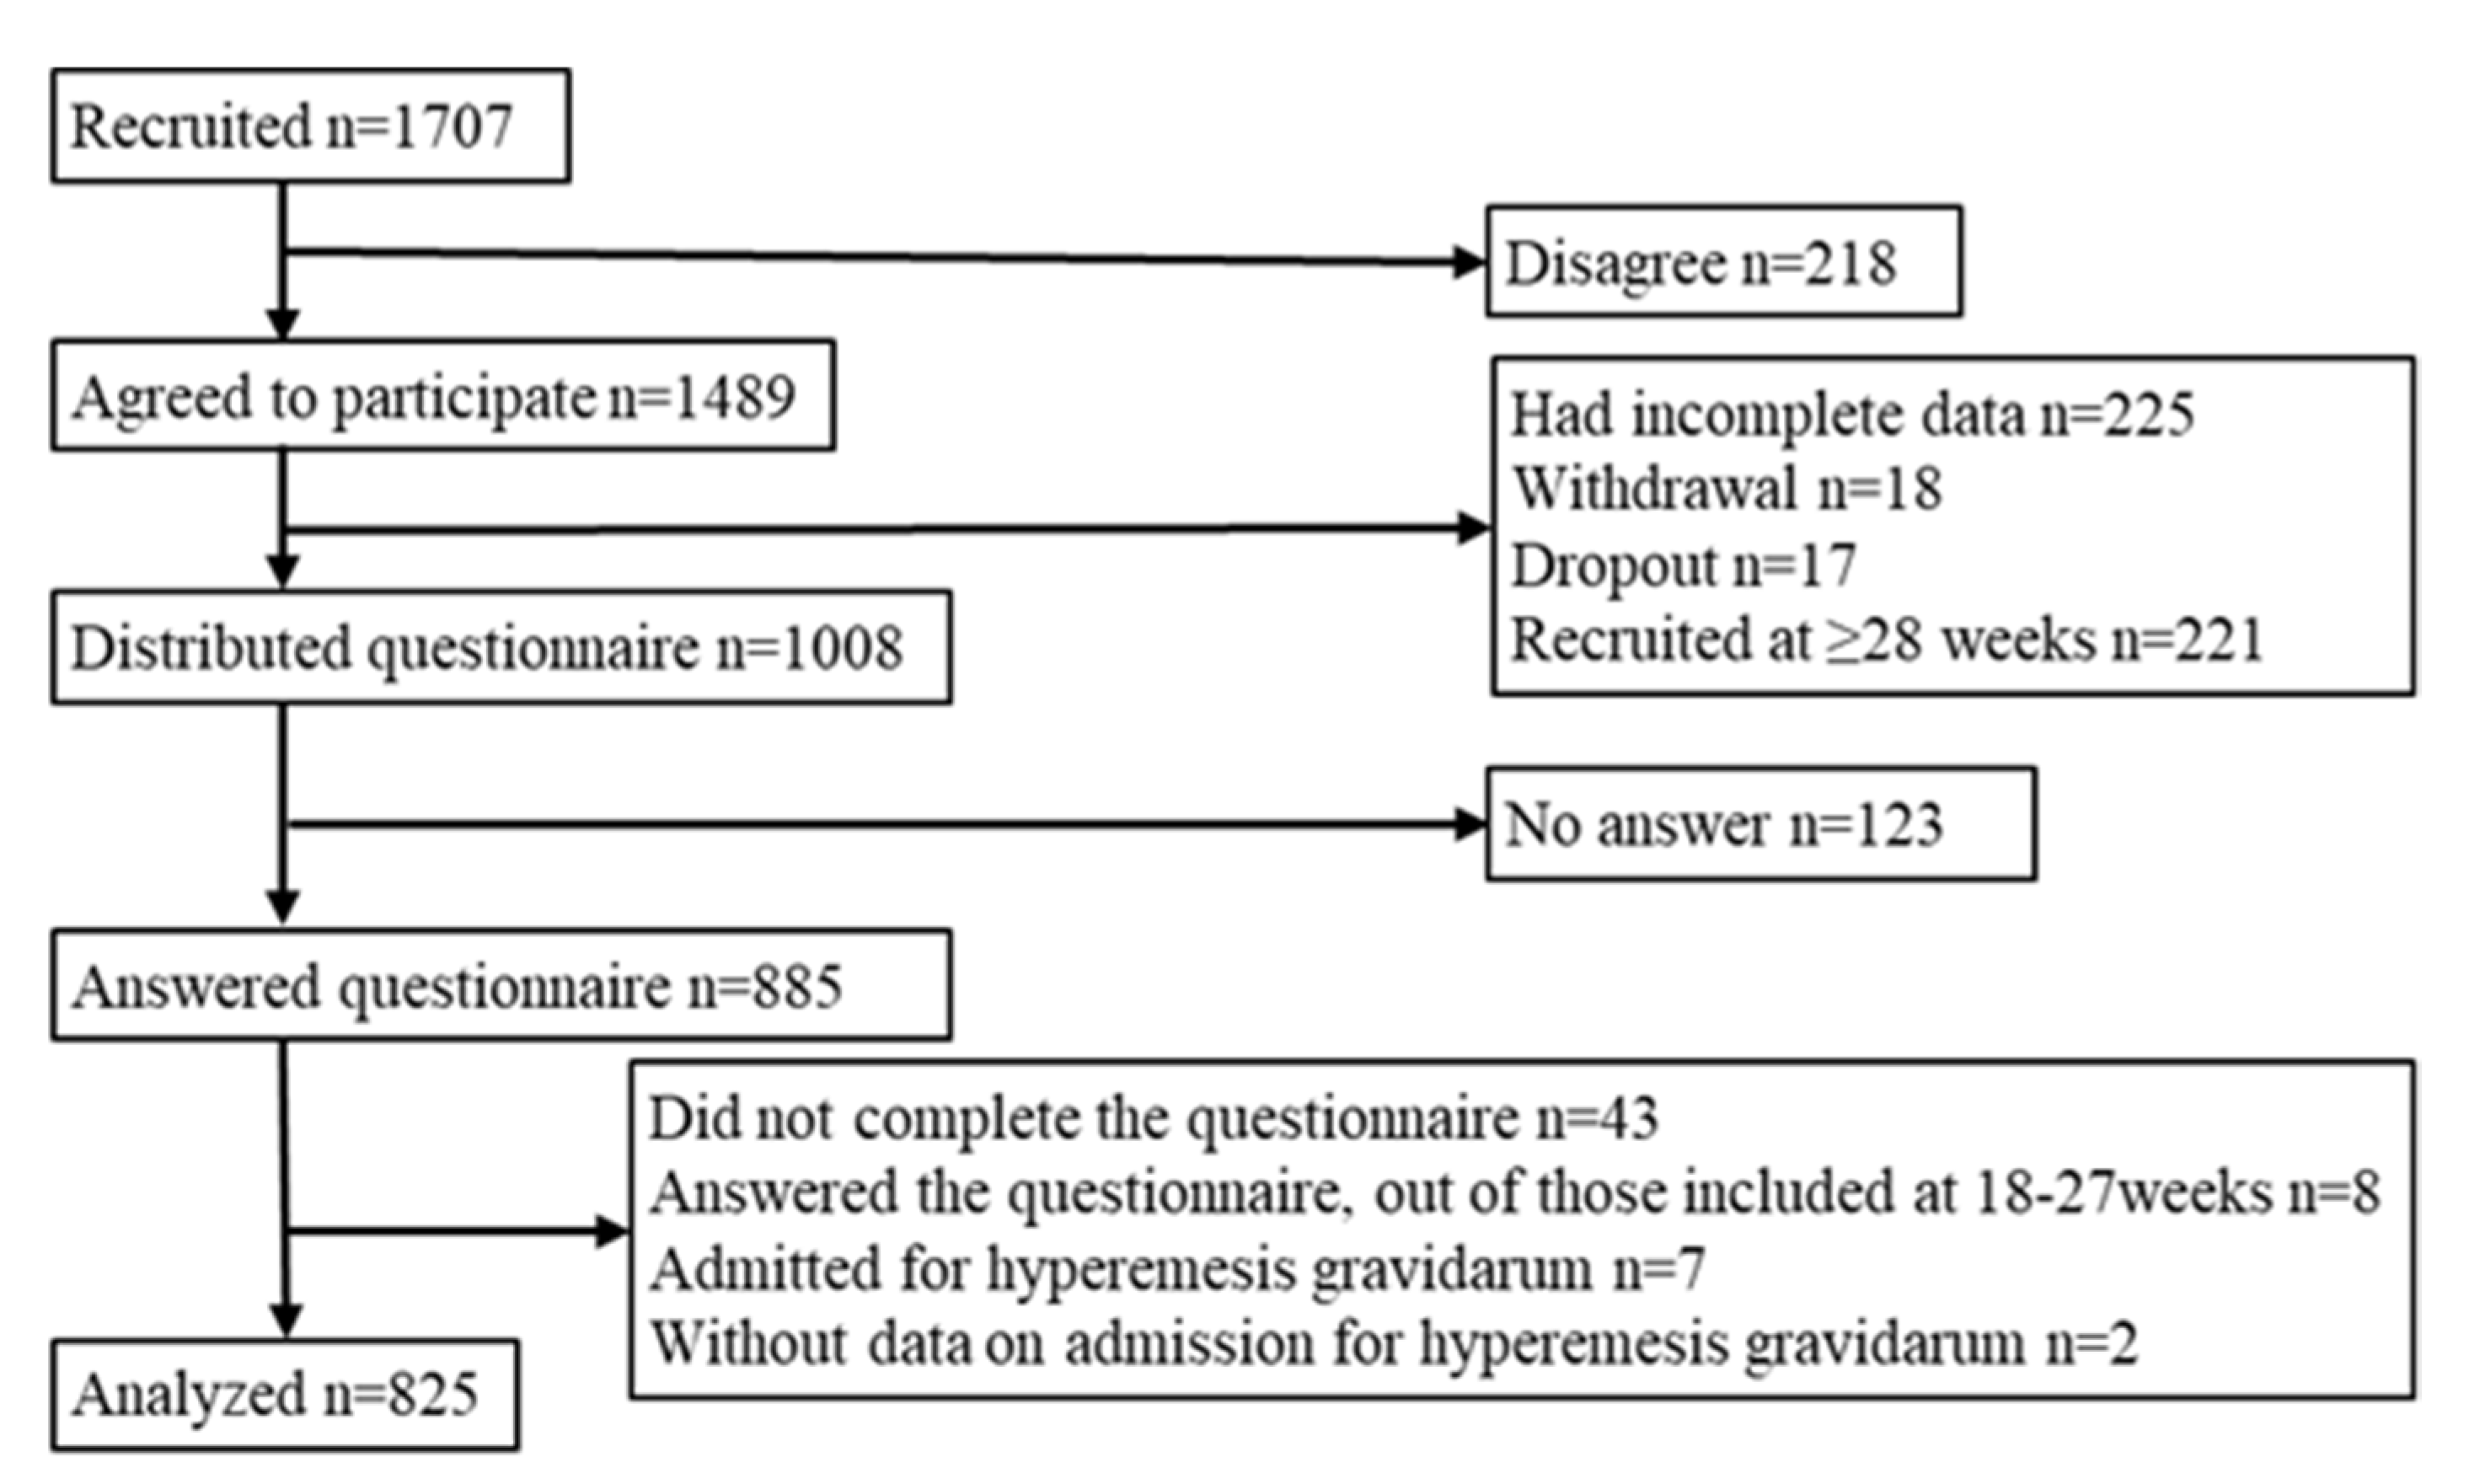
2. Materials and Methods
3. Results
3.1. Nausea and Vomiting in Pregnancy
3.2. Demographic Characteristics
3.3. Dietary Intake
3.4. Gestational Weight Gain, Low Birth Weight, and Preterm Birth
4. Discussion
5. Conclusions
Author Contributions
Funding
Institutional Review Board Statement
Informed Consent Statement
Data Availability Statement
Acknowledgments
Conflicts of Interest
References
- Bustos, M.; Venkataramanan, R.; Caritis, S.; Auton, N. Nausea and Vomiting of Pregnancy—What’s New? HHS Public Access Author Manuscr. 2018, 202, 62–72. [Google Scholar] [CrossRef] [Green Version]
- Liu, C.; Zhao, G.; Qiao, D.; Wang, L.; He, Y.; Zhao, M.; Fan, Y.; Jiang, E. Emerging Progress in Nausea and Vomiting of Pregnancy and Hyperemesis Gravidarum: Challenges and Opportunities. Front. Med. 2022, 8, 809270. [Google Scholar] [CrossRef]
- Lacroix, R.; Eason, E.; Melzack, R. Nausea and Vomiting during Pregnancy: A Prospective Study of Its Frequency, Intensity, and Patterns of Change. Am. J. Obstet. Gynecol. 2000, 182, 931–937. [Google Scholar] [CrossRef]
- Sierra, H.; Cordova, M.; Chen, C.-S.J.; Rajadhyaksha, M. Confocal Imaging–Guided Laser Ablation of Basal Cell Carcinomas: An Ex Vivo Study. J. Investig. Dermatol. 2015, 135, 612–615. [Google Scholar] [CrossRef] [Green Version]
- Lacasse, A.; Rey, E.; Ferreira, E.; Morin, C.; Bérard, A. Epidemiology of Nausea and Vomiting of Pregnancy: Prevalence, Severity, Determinants, and the Importance of Race/Ethnicity. BMC Pregnancy Childbirth 2009, 9, 26. [Google Scholar] [CrossRef]
- Birkeland, E.; Stokke, G.; Tangvik, R.J.; Torkildsen, E.A.; Boateng, J.; Wollen, A.L.; Albrechtsen, S.; Flaatten, H.; Trovik, J. Norwegian PUQE (Pregnancy-Unique Quantification of Emesis and Nausea) Identifies Patients with Hyperemesis Gravidarum and Poor Nutritional Intake: A Prospective Cohort Validation Study. PLoS ONE 2015, 10, e0119962. [Google Scholar] [CrossRef] [Green Version]
- Dietary Reference Intakes for Japanese. 2020. Available online: https://www.mhlw.go.jp/content/10904750/000586553.pdf (accessed on 10 June 2023). (In Japanese)
- Suzuki, H.; Hamada, H.; Matsuzaki, M.; Ota, E. Analysis of Differences in Lifestyle and Nutrition Intake of Women in Each Stage of Pregnancy. Bull. St. Luke’s Int. Univ. 2022, 8, 105–110. [Google Scholar] [CrossRef]
- Latva-Pukkila, U.; Isolauri, E.; Laitinen, K. Dietary and Clinical Impacts of Nausea and Vomiting during Pregnancy. J. Human Nutr. Diet. 2010, 23, 69–77. [Google Scholar] [CrossRef]
- Crozier, S.R.; Inskip, H.M.; Godfrey, K.M.; Cooper, C.; Robinson, S.M. Nausea and Vomiting in Early Pregnancy: Effects on Food Intake and Diet Quality. Matern. Child. Nutr. 2017, 13, e12389. [Google Scholar] [CrossRef]
- Zhu, S.; Zhao, A.; Lan, H.; Li, P.; Mao, S.; Szeto, I.M.-Y.; Jiang, H.; Zhang, Y. Nausea and Vomiting during Early Pregnancy among Chinese Women and Its Association with Nutritional Intakes. Nutrients 2023, 15, 933. [Google Scholar] [CrossRef]
- Chortatos, A.; Haugen, M.; Iversen, P.; Vikanes, Å.; Magnus, P.; Veierød, M. Nausea and Vomiting in Pregnancy: Associations with Maternal Gestational Diet and Lifestyle Factors in the Norwegian Mother and Child Cohort Study. BJOG 2013, 120, 1642–1653. [Google Scholar] [CrossRef]
- Goldstein, R.F.; Abell, S.K.; Ranasinha, S.; Misso, M.; Boyle, J.A.; Black, M.H.; Li, N.; Hu, G.; Corrado, F.; Rode, L.; et al. Association of Gestational Weight Gain With Maternal and Infant Outcomes. JAMA 2017, 317, 2207. [Google Scholar] [CrossRef]
- Enomoto, K.; Aoki, S.; Toma, R.; Fujiwara, K.; Sakamaki, K.; Hirahara, F. Pregnancy Outcomes Based on Pre-Pregnancy Body Mass Index in Japanese Women. PLoS ONE 2016, 11, e0157081. [Google Scholar] [CrossRef]
- Chortatos, A.; Haugen, M.; Iversen, P.O.; Vikanes, Å.; Eberhard-Gran, M.; Bjelland, E.K.; Magnus, P.; Veierød, M.B. Pregnancy Complications and Birth Outcomes among Women Experiencing Nausea Only or Nausea and Vomiting during Pregnancy in the Norwegian Mother and Child Cohort Study. BMC Pregnancy Childbirth 2015, 15, 138. [Google Scholar] [CrossRef] [Green Version]
- Mitsuda, N.; Eitoku, M.; Yamasaki, K.; Sakaguchi, M.; Yasumitsu-Lovell, K.; Maeda, N.; Fujieda, M.; Suganuma, N. Nausea and Vomiting during Pregnancy Associated with Lower Incidence of Preterm Births: The Japan Environment and Children’s Study (JECS). BMC Pregnancy Childbirth 2018, 18, 268. [Google Scholar] [CrossRef]
- Japan, Pregnancy, Eating, and Activity, Cohort Study (J-Peach Study). Available online: https://j-birthcohorts.net/cohorts/jpeach-study/ (accessed on 3 May 2023).
- Statistics Bureau, Ministry of Internal Affairs and Communications. Population of Cites. In Japan Statistical Yearbook 2023; Statistics Bureau, Ministry of Internal Affairs and Communications: Tokyo, Japan, 2023; pp. 49–59. [Google Scholar]
- Itakura, A.; Shoji, S.; Shigeru, A.; Kotaro, F.; Junichi, H.; Hironobu, H.; Kamei, Y.; Eiji, K.; Shintaro, M.; Mamoru, M.; et al. Guidelines for obstetrical practice in Japan: Japan Society of Obstetrics and Gynecology and Japan Association of Obstetricians and Gynecologists 2020 edition. J. Obstet. Gynaecol. Res. 2023, 49, 5–53. [Google Scholar]
- Einarson, T.R.; Piwko, C.; Koren, G. Prevalence of Nausea and Vomiting of Pregnancy in the USA: A Meta-Analysis. J. Popul. Ther. Clin. Pharmacol. 2013, 20, 163–170. [Google Scholar]
- Morokuma, S.; Shimokawa, M.; Kato, K.; Sanefuji, M.; Shibata, E.; Tsuji, M.; Senju, A.; Kawamoto, T.; Kusuhara, K.; Saito, H.; et al. Relationship between Hyperemesis Gravidarum and Small-for-Gestational-Age in the Japanese Population: The Japan Environment and Children’s Study (JECS). BMC Pregnancy Childbirth 2016, 16, 247. [Google Scholar] [CrossRef] [Green Version]
- Koren, G.; Piwko, C.; Ahn, E.; Boskovic, R.; Maltepe, C.; Einarson, A.; Navioz, Y.; Ungar, W.J. Validation Studies of the Pregnancy Unique-Quantification of Emesis (PUQE) Scores. J. Obstet. Gynaecol. 2005, 25, 241–244. [Google Scholar] [CrossRef]
- Hada, A.; Minatani, M.; Wakamatsu, M.; Koren, G.; Kitamura, T. The Pregnancy-Unique Quantification of Emesis and Nausea (PUQE-24): Configural, Measurement, and Structural Invariance between Nulliparas and Multiparas and across Two Measurement Time Points. Healthcare 2021, 9, 1553. [Google Scholar] [CrossRef]
- Lacasse, A.; Rey, E.; Ferreira, E.; Morin, C.; Bérard, A. Validity of a Modified Pregnancy-Unique Quantification of Emesis and Nausea (PUQE) Scoring Index to Assess Severity of Nausea and Vomiting of Pregnancy. Am. J. Obstet. Gynecol. 2008, 198, e1–e71. [Google Scholar] [CrossRef]
- Summary Report of Comprehensive Survey of Living Conditions. 2019. Available online: https://www.mhlw.go.jp/english/database/db-hss/dl/report_gaikyo_2019.pdf (accessed on 29 May 2023). (In Japanese)
- Outline of Revision of Dietary Guidelines for Women during Pregnancy and Postpartum. Available online: https://www.mhlw.go.jp/content/000776927.pdf (accessed on 10 June 2023).
- Kobayashi, S.; Murakami, K.; Sasaki, S.; Okubo, H.; Hirota, N.; Notsu, A.; Fukui, M.; Date, C. Comparison of Relative Validity of Food Group Intakes Estimated by Comprehensive and Brief-Type Self-Administered Diet History Questionnaires against 16 d Dietary Records in Japanese Adults. Public Health Nutr. 2011, 14, 1200–1211. [Google Scholar] [CrossRef] [Green Version]
- Kobayashi, S.; Honda, S.; Murakami, K.; Sasaki, S.; Okubo, H.; Hirota, N.; Notsu, A.; Fukui, M.; Date, C. Both Comprehensive and Brief Self-Administered Diet History Questionnaires Satisfactorily Rank Nutrient Intakes in Japanese Adults. J. Epidemiol. 2012, 22, 151–159. [Google Scholar] [CrossRef] [Green Version]
- Ogawa, K.; Jwa, S.-C.; Kobayashi, M.; Morisaki, N.; Sago, H.; Fujiwara, T. Validation of a Food Frequency Questionnaire for Japanese Pregnant Women with and without Nausea and Vomiting in Early Pregnancy. J. Epidemiol. 2017, 27, 201–208. [Google Scholar] [CrossRef] [PubMed]
- Takei, H.; Shiraishi, M.; Matsuzaki, M.; Haruna, M. Factors Related to Vegetable Intake among Pregnant Japanese Women: A Cross-Sectional Study. Appetite 2019, 132, 175–181. [Google Scholar] [CrossRef]
- Faul, F.; Erdfelder, E.; Lang, A.-G.; Buchner, A. G*Power 3: A Flexible Statistical Power Analysis Program for the Social, Behavioral, and Biomedical Sciences. Behav. Res. Methods 2007, 39, 175–191. [Google Scholar] [CrossRef] [PubMed]
- Abe, E.; Kobayashi, M. Association of Nausea and Vomiting with Nutritional Intake and Gestational Weight Gain during Pregnancy. Int. J. Human Cult. Stud. 2020, 2020, 380–384. [Google Scholar] [CrossRef]
- Kugahara, T.; Ohashi, K. Characteristics of Nausea and Vomiting in Pregnant Japanese Women. Nurs. Health Sci. 2006, 8, 179–184. [Google Scholar] [CrossRef]
- Shiraishi, M.; Haruna, M.; Matsuzaki, M.; Murayama, R.; Sasaki, S. Pre-Pregnancy BMI, Gestational Weight Gain and Body Image Are Associated with Dietary under-Reporting in Pregnant Japanese Women. J. Nutr. Sci. 2018, 7, e12. [Google Scholar] [CrossRef] [Green Version]
- Patil, C.L.; Abrams, E.T.; Steinmetz, A.R.; Young, S.L. Appetite Sensations and Nausea and Vomiting in Pregnancy: An Overview of the Explanations. Ecol. Food Nutr. 2012, 51, 394–417. [Google Scholar] [CrossRef]
- Choo, E.; Dando, R. The Impact of Pregnancy on Taste Function. Chem. Senses 2017, 42, 279–286. [Google Scholar] [CrossRef]
- Morisaki, N.; Piedvache, A.; Morokuma, S.; Nakahara, K.; Ogawa, M.; Kato, K.; Sanefuji, M.; Shibata, E.; Tsuji, M.; Shimono, M.; et al. Gestational Weight Gain Growth Charts Adapted to Japanese Pregnancies Using a Bayesian Approach in a Longitudinal Study: The Japan Environment and Children’s Study. J. Epidemiol. 2023, 33, JE20210049. [Google Scholar] [CrossRef] [PubMed]
- Statistics on Birth. Available online: https://www.mhlw.go.jp/toukei/saikin/hw/jinkou/tokusyu/syussyo07/dl/02.pdf (accessed on 2 June 2023). (In Japanese)
- Liu, L.; Ma, Y.; Wang, N.; Lin, W.; Liu, Y.; Wen, D. Maternal Body Mass Index and Risk of Neonatal Adverse Outcomes in China: A Systematic Review and Meta-Analysis. BMC Pregnancy Childbirth 2019, 19, 105. [Google Scholar] [CrossRef] [PubMed]
- Ellilä, P.; Laitinen, L.; Nurmi, M.; Rautava, P.; Koivisto, M.; Polo-Kantola, P. Nausea and Vomiting of Pregnancy: A Study with Pregnancy-Unique Quantification of Emesis Questionnaire. Eur. J. Obstet. Gynecol. Reprod. Biol. 2018, 230, 60–67. [Google Scholar] [CrossRef] [PubMed]
- Information Policy and Industrial Relations, Ministry of Health, Labour and Welfare. Vital Statistics of Japan. 2019. Available online: https://www.mhlw.go.jp/english/database/db-hw/vs01.html (accessed on 19 July 2023).
- Ministry of Internal Affairs and Communications Division Population Census 2020 Population Census Detailed Sample Tabulation. Available online: https://www.e-stat.go.jp/dbview?sid=0003464354 (accessed on 19 July 2023).
- Ministry of Health, Labour and Welfare. BMI Distribution by National Health and Nutrition Survey. Available online: https://www.e-stat.go.jp/dbview?sid=0003224180 (accessed on 18 July 2023). (In Japanese)


| All (n = 825) | No and Mild (n = 682) | Moderate and Severe (n = 143) | p | ||||
|---|---|---|---|---|---|---|---|
| Median (Q1–Q3) or n (%) | Median (Q1–Q3) or n (%) | Median (Q1–Q3) or n (%) | |||||
| Gestational week while answering the questionnaire | 22.0 | (19.0–24.0) | 22.0 | (19.0–24.0) | 20.0 | (18.0–23.0) | <0.001 a |
| Age (n = 790) | 34.0 | (31.0–38.0) | 34.0 | (31.0–38.0) | 34.0 | (31.0–38.0) | 0.959 a |
| Parity | |||||||
| Primipara | 432 | (52.4) | 352 | (51.6) | 80 | (55.9) | 0.358 b |
| Multipara | 393 | (47.6) | 330 | (48.4) | 63 | (44.1) | |
| Number of fetuses | |||||||
| Singleton | 797 | (96.6) | 656 | (96.2) | 141 | (98.6) | 0.204 b |
| Multiple | 28 | (3.4) | 26 | (3.8) | 2 | (1.4) | |
| Pre-pregnancy BMI, kg/m2 (n = 822) | |||||||
| <18.5 | 114 | (13.9) | 97 | (14.3) | 17 | (12.0) | 0.150 b |
| 18.5–24.9 | 601 | (73.1) | 502 | (73.8) | 99 | (69.7) | |
| 25.0–29.9 | 73 | (8.9) | 57 | (8.4) | 16 | (11.3) | |
| ≥30.0 | 34 | (4.1) | 24 | (3.5) | 10 | (7.0) | |
| Marital status | |||||||
| Married | 810 | (98.2) | 673 | (98.7) | 137 | (95.8) | 0.031 b |
| Not married | 15 | (1.8) | 9 | (1.3) | 6 | (4.2) | |
| Education | |||||||
| Junior high/High school | 100 | (12.1) | 81 | (11.9) | 19 | (13.3) | 0.468 b |
| Vocational training school or junior college | 207 | (25.1) | 165 | (24.2) | 42 | (29.4) | |
| College | 445 | (53.9) | 373 | (54.7) | 72 | (50.3) | |
| Postgraduate | 73 | (8.8) | 63 | (9.2) | 10 | (7.0) | |
| Work | |||||||
| Yes | 533 | (64.6) | 435 | (63.8) | 98 | (68.5) | 0.292 b |
| No | 292 | (35.4) | 247 | (36.2) | 45 | (31.5) | |
| Household income | |||||||
| <7 million yen | 402 | (48.7) | 330 | (48.4) | 72 | (50.3) | 0.713 b |
| ≥7 million yen | 423 | (51.3) | 352 | (51.6) | 71 | (49.7) | |
| Smoking during pregnancy | |||||||
| No | 796 | (96.5) | 654 | (95.9) | 142 | (99.3) | 0.045 b |
| Yes | 29 | (3.5) | 28 | (4.1) | 1 | (0.7) | |
| City | |||||||
| Yamagata | 159 | (19.3) | 139 | (20.4) | 20 | (14.0) | 0.127 b |
| Tokyo | 292 | (35.4) | 239 | (35.0) | 53 | (37.1) | |
| Osaka | 223 | (27.0) | 187 | (27.4) | 36 | (25.2) | |
| Fukuoka | 151 | (18.3) | 117 | (17.2) | 34 | (23.8) | |
| All (n = 755) | No and Mild (n = 634) | Moderate and Severe (n = 121) | p | |
|---|---|---|---|---|
| Median (Q1–Q3) or n (%) | Median (Q1–Q3) or n (%) | Median (Q1–Q3) or n (%) | ||
| Energy (kcal) | 1494.0 (1278.1–1767.3) | 1493.2 (1279.7–1765.8) | 1501.0 (1250.3–1779.5) | 0.902 |
| Protein (g/kg of body mass) | 1.0 (0.8–1.2) | 1.0 (0.8–1.2) | 1.0 (0.8–1.1) | 0.573 |
| Magnesium (mg/1000 kcal) | 122.6 (107.3–138.9) | 122.7 (107.1–139.5) | 121.6 (108.2–136.5) | 0.944 |
| Iron (mg/1000 kcal) | 3.9 (3.4–4.5) | 3.8 (3.3–4.5) | 3.9 (3.4–4.5) | 0.797 |
| Zinc (mg/1000 kcal) | 4.4 (4.1–4.8) | 4.4 (4.1–4.8) | 4.4 (4.0–4.8) | 0.607 |
| Copper (mg/1000 kcal) | 0.6 (0.5–0.7) | 0.6 (0.5–0.7) | 0.6 (0.6–0.7) | 0.355 |
| Vitamin B1 (mg/1000 kcal) | 0.4 (0.4–0.5) | 0.4 (0.4–0.5) | 0.4 (0.4–0.5) | 0.666 |
| Vitamin B2 (mg/1000 kcal) | 0.7 (0.6–0.8) | 0.7 (0.6–0.8) | 0.6 (0.5–0.7) | 0.179 |
| Vitamin B6 (mg/1000 kcal) | 0.6 (0.5–0.7) | 0.6 (0.5–0.7) | 0.6 (0.5–0.7) | 0.766 |
| Vitamin B12 (mg/1000 kcal) | 3.4 (2.5–4.8) | 3.4 (2.5–4.7) | 3.6 (2.5–5.4) | 0.215 |
| Folate (mg/1000 kcal) | 154.3 (126.1–189.5) | 155.8 (124.9–190.9) | 150.9 (127.9–180.7) | 0.542 |
| Vitamin C (mg/1000 kcal) | 56.5 (41.0–73.7) | 56.5 (41.2–73.1) | 57.0 (40.4–77.8) | 0.635 |
| All (n = 755) | No and Mild (n = 634) | Moderate and Severe (n = 121) | p | |
|---|---|---|---|---|
| Median (Q1–Q3) | Median (Q1–Q3) | Median (Q1–Q3) | ||
| Rice | 158.7 (104.2–201.3) | 160.9 (104.9–202.3) | 148.3 (101.1–200.6) | 0.372 |
| Bread | 19.6 (11.7–33.9) | 19.8 (11.6–33.9) | 19.3 (12.3–33.6) | 0.670 |
| Noodles | 38.4 (24.2–59.8) | 36.9 (23.7–56.7) | 48.6 (28.4–72.9) | <0.001 |
| Bean | 28.1 (16.1–43.7) | 28.8 (15.9–44.8) | 26.7 (16.8–38.8) | 0.302 |
| Vegetables | 110.6 (80.6–151.9) | 111.2 (81.7–154.0) | 106.1 (73.9–141.3) | 0.133 |
| Pickled vegetables | 2.1 (0.0–6.4) | 2.0 (0.0–6.0) | 3.1 (0.8–7.9) | 0.013 |
| Fruit | 44.4 (0.0–39.9) | 43.9 (0.0–39.4) | 45.4 (0.0–42.5) | 0.576 |
| Seaweed | 3.0 (1.4–7.0) | 3.0 (1.4–7.0) | 3.1 (1.4–7.0) | 0.965 |
| Red meat | 20.2 (15.7–26.1) | 20.1 (15.5–26.0) | 20.8 (16.1–26.2) | 0.727 |
| Processed meat | 20.2 (15.7–26.1) | 20.1 (15.5–26.0) | 20.8 (16.1–26.2) | 0.727 |
| Egg | 17.8 (12.3–28.6) | 17.5 (12.3–28.1) | 18.9 (12.6–29.9) | 0.489 |
| Alcohol | 0.0 (0.0–0.0) | 0.0 (0.0–0.0) | 0.0 (0.0–0.0) | 0.620 |
| Tea | 14.0 (0.0–56.7) | 12.7 (0.0–53.7) | 19.3 (0.0–76.4) | 0.031 |
| Juice | 42.7 (11.4–89.7) | 36.9 (10.4–85.4) | 65.7 (23.2–122.8) | <0.001 |
| Coffee | 6.5 (0.0–39.9) | 6.3 (0.0–39.4) | 6.8 (0.0–42.5) | 0.612 |
| All (n = 825) | No and Mild (n = 682) | Moderate and Severe (n = 143) | p | ||||
|---|---|---|---|---|---|---|---|
| Median (Q1–Q3) or n (%) | Median (Q1–Q3) or n (%) | Median (Q1–Q3) or n (%) | |||||
| Number of meals including snack | 4.0 | (3.0–4.0) | 4.0 | (3.0–4.0) | 4.0 | (3.0–4.0) | 0.210 a |
| Skip breakfast | |||||||
| Yes | 147 | (17.8) | 110 | (16.1) | 37 | (25.9) | 0.008 b |
| No | 678 | (82.2) | 572 | (83.9) | 106 | (74.1) | |
| Skipped meal (weekday) | |||||||
| Yes | 199 | (24.1) | 150 | (22.0) | 49 | (34.3) | 0.003 b |
| No | 626 | (75.9) | 532 | (78.0) | 94 | (65.7) | |
| Check label: nutrients | |||||||
| Yes | 496 | (60.1) | 421 | (61.7) | 75 | (52.4) | 0.048 b |
| No | 329 | (39.9) | 261 | (38.3) | 68 | (47.6) | |
| Check label: calories | |||||||
| Yes | 495 | (60.0) | 417 | (61.1) | 78 | (54.5) | 0.159 b |
| No | 330 | (40.0) | 265 | (38.9) | 65 | (45.5) | |
| Prepare meals | |||||||
| by self | 692 | (92.1) | 575 | (91.9) | 117 | (93.6) | 0.589 b |
| the others | 59 | (7.9) | 51 | (8.1) | 8 | (6.4) | |
| All | No and Mild | Moderate and Severe | p | ||||
|---|---|---|---|---|---|---|---|
| Median (Q1–Q3) or n (%) | Median (Q1–Q3) or n (%) | Median (Q1–Q3) or n (%) | |||||
| Total GWG (n = 684) (kg) | 9.9 | (7.8–12.0) | 10.0 | (7.9–12.1) | 9.0 | (6.4–11.4) | 0.007 a |
| Pre–pregnancy BMI (kg/m2) | |||||||
| <18.5 (n = 94) | 10.4 | (8.4–12.0) | 10.0 | (8.7–12.0) | 9.8 | (7.5–12.0) | 0.415 a |
| 18.5–24.9 (n = 500) | 10.1 | (8.0–12.1) | 10.1 | (8.1–12.3) | 9.6 | (7.2–11.4) | 0.050 a |
| 25.0–29.9 (n = 58) | 7.6 | (4.4–11.6) | 7.8 | (3.2–11.1) | 5.8 | (3.3–10.1) | 0.824 a |
| ≥30.0 (n = 30) | 6.7 | (2.8–8.7) | 7.7 | (2.6–10.7) | 5.2 | (3.5–8.0) | 0.689 a |
| GWG (kg) | |||||||
| 1st trimester (around 12 week, n = 603) | 0.3 | (−1.0–1.6) | 0.5 | (−0.8–1.7) | −0.3 | (−2.0–0.9) | <0.001 a |
| Pre-pregnancy BMI (kg/m2) | |||||||
| <18.5 (n = 84) | 0.7 | (−0.4–1.7) | 0.8 | (−0.4–1.8) | 0.4 | (−1.0–1.1) | 0.171 a |
| 18.5–24.9 (n = 434) | 0.4 | (−0.9–1.6) | 0.5 | (−0.8–1.7) | −0.2 | (−1.8–0.9) | 0.003 a |
| 25.0–29.9 (n = 53) | −0.3 | (−2.8–1.8) | −0.2 | (−2.9–2.1) | −0.9 | (−3.2–1.0) | 0.273 a |
| ≥30.0 (n = 30) | −0.9 | (−3.7–0.4) | −0.8 | (−4.0–0.4) | −1.1 | (−3.1–1.6) | 0.722 a |
| 2nd trimester (around 24 week, n = 644) | 4.1 | (2.1–6.0) | 4.1 | (2.4–6.0) | 3.4 | (0.7–5.6) | 0.002 a |
| Pre-pregnancy BMI (kg/m2) | |||||||
| <18.5 (n = 86) | 4.6 | (2.4–6.4) | 4.7 | (2.9–6.7) | 4.0 | (2.1–5.7) | 0.387 a |
| 18.5–24.9 (n = 471) | 4.3 | (2.4–6.0) | 4.3 | (2.5–6.0) | 3.4 | (1.0–5.7) | 0.008 a |
| 25.0–29.9 (n = 55) | 2.8 | (0.3–5.2) | 2.8 | (0.6–5.5) | 3.2 | (−0.4–5.6) | 0.862 a |
| ≥30.0 (n = 30) | 0.6 | (−1.5–3.8) | 0.6 | (−1.8–3.6) | 0.0 | (−1.4–3.8) | 0.929 a |
| Insufficient GWG (n = 654) | |||||||
| Yes | 337 | (51.5) | 271 | (50.5) | 66.0 | (56.4) | 0.262 b |
| No | 317 | (48.5) | 266 | (49.5) | 51.0 | (43.6) | |
| GWG increase rate (kg/week) | |||||||
| Through pregnancy (n = 684) | 0.26 | (0.20–0.31) | 0.26 | (0.21–0.32) | 0.24 | (0.17–0.30) | 0.009 a |
| Pre-pregnancy BMI (kg/m2) | |||||||
| <18.5 (n = 94) | 0.27 | (0.22–0.32) | 0.27 | (0.22–0.32) | 0.27 | (0.20–0.31) | 0.509 a |
| 18.5–24.9 (n = 497) | 0.26 | (0.21–0.31) | 0.26 | (0.21–0.32) | 0.25 | (0.19–0.30) | 0.050 a |
| 25.0–29.9 (n = 58) | 0.20 | (0.11–0.30) | 0.21 | (0.14–0.31) | 0.15 | (0.08–0.30) | 0.817 a |
| ≥30.0 (n = 30) | 0.17 | (0.07–0.24) | 0.19 | (0.07–0.27) | 0.13 | (0.09–0.20) | 0.625 a |
| 1st trimester (around 12 week, n = 603) | 0.03 | (−0.07–0.12) | 0.03 | (−0.06–0.13) | −0.02 | (−0.15–0.08) | <0.001 a |
| Pre-pregnancy BMI (kg/m2) | |||||||
| <18.5 (n = 84) | 0.05 | (−0.03–0.12) | 0.05 | (−0.03–0.13) | 0.03 | (−0.08–0.07) | 0.177 a |
| 18.5–24.9 (n = 434) | 0.03 | (−0.07–0.12) | 0.04 | (−0.06–0.13) | −0.01 | (−0.13–0.08) | 0.005 a |
| 25.0–29.9 (n = 53) | −0.03 | (−0.21–0.12) | −0.01 | (−0.20–0.14) | −0.08 | (−0.26–0.07) | 0.230 a |
| ≥30.0 (n = 30) | −0.07 | (−0.28–0.03) | −0.06 | (−0.32–0.03) | −0.11 | (−0.25–0.14) | 0.790 a |
| 1st to 2nd trimester (around 12–24 week, n = 566) | 0.36 | (0.27–0.46) | 0.36 | (0.27–0.46) | 0.36 | (0.25–0.45) | 0.438 a |
| Pre-pregnancy BMI (kg/m2) | |||||||
| <18.5 (n = 76) | 0.41 | (0.29–0.48) | 0.41 | (0.30–0.49) | 0.40 | (0.28–0.46) | 0.678 a |
| 18.5–24.9 (n = 407) | 0.37 | (0.28–0.46) | 0.36 | (0.28–0.46) | 0.38 | (0.28–0.46) | 0.572 a |
| 25.0–29.9 (n = 51) | 0.29 | (0.20–0.41) | 0.28 | (0.17–0.42) | 0.29 | (0.22–0.42) | 0.559 a |
| ≥30.0 (n = 30) | 0.24 | (0.05–0.38) | 0.30 | (0.09–0.46) | 0.20 | (0.04–0.25) | 0.114 a |
| Birth weight (n = 743) (g) | 3020.0 | (2752.0–3288.0) | 3024.0 | (2751.0–3291.0) | 3000.0 | (2751.5–3223.0) | 0.482 c |
| Pre-pregnancy BMI (kg/m2) | |||||||
| <18.5 (n = 102) | 2950.0 | (2669.5–3206.5) | 2956.0 | (2657.5–3208.5) | 2880.0 | (2702.5–3086.5) | 0.956 c |
| 18.5–24.9 (n = 541) | 3024.0 | (2766.0–3294.0) | 3024.0 | (2764.0–3307.0) | 3006.0 | (2772.0–3199.5) | 0.407 c |
| 25.0–29.9 (n = 66) | 3112.0 | (2792.0–3314.3) | 3130.0 | (2822.5–3288.0) | 3000.0 | (2713.0–3339.8) | 0.782 c |
| ≥30.0 (n = 32) | 3150.0 | (2868.0–3381.5) | 3146.0 | (2797.0–3350.0) | 3146.0 | (2797.0–3350.0) | 0.711 c |
| Low birth weight <2500 g | |||||||
| Yes | 48 | (7.0) | 36 | (6.5) | 12.0 | (9.5) | 0.246 b |
| No | 635 | (93.0) | 521 | (93.5) | 114.0 | (90.5) | |
| Delivery week (n = 736) | 39.0 | (38.0–40.0) | 39.0 | (38.0–40.0) | 39.0 | (37.0–40.0) | 0.783 a |
| Preterm birth <37 w | |||||||
| Yes | 52 | (7.1) | 44 | (7.3) | 8.0 | (6.0) | 0.604 b |
| No | 684 | (92.9) | 558 | (92.7) | 126.0 | (94.0) | |
Disclaimer/Publisher’s Note: The statements, opinions and data contained in all publications are solely those of the individual author(s) and contributor(s) and not of MDPI and/or the editor(s). MDPI and/or the editor(s) disclaim responsibility for any injury to people or property resulting from any ideas, methods, instructions or products referred to in the content. |
© 2023 by the authors. Licensee MDPI, Basel, Switzerland. This article is an open access article distributed under the terms and conditions of the Creative Commons Attribution (CC BY) license (https://creativecommons.org/licenses/by/4.0/).
Share and Cite
Nishihara, N.; Haruna, M.; Usui, Y.; Yonezawa, K.; Hikita, N.; Sasagawa, E.; Nakano, K.; Tanaka, M.; Ohori, R.; Aoyama, S.; et al. Dietary Intake and Its Association with Birth Outcomes in Women with Nausea and Vomiting during the Second Trimester of Pregnancy: A Prospective Cohort Study in Japan. Nutrients 2023, 15, 3383. https://doi.org/10.3390/nu15153383
Nishihara N, Haruna M, Usui Y, Yonezawa K, Hikita N, Sasagawa E, Nakano K, Tanaka M, Ohori R, Aoyama S, et al. Dietary Intake and Its Association with Birth Outcomes in Women with Nausea and Vomiting during the Second Trimester of Pregnancy: A Prospective Cohort Study in Japan. Nutrients. 2023; 15(15):3383. https://doi.org/10.3390/nu15153383
Chicago/Turabian StyleNishihara, Nao, Megumi Haruna, Yuriko Usui, Kaori Yonezawa, Naoko Hikita, Emi Sasagawa, Keiko Nakano, Moeko Tanaka, Riko Ohori, Satoko Aoyama, and et al. 2023. "Dietary Intake and Its Association with Birth Outcomes in Women with Nausea and Vomiting during the Second Trimester of Pregnancy: A Prospective Cohort Study in Japan" Nutrients 15, no. 15: 3383. https://doi.org/10.3390/nu15153383
APA StyleNishihara, N., Haruna, M., Usui, Y., Yonezawa, K., Hikita, N., Sasagawa, E., Nakano, K., Tanaka, M., Ohori, R., Aoyama, S., Sasaki, S., Fujita, M., Matsuzaki, M., Suetsugu, Y., & Sato, Y. (2023). Dietary Intake and Its Association with Birth Outcomes in Women with Nausea and Vomiting during the Second Trimester of Pregnancy: A Prospective Cohort Study in Japan. Nutrients, 15(15), 3383. https://doi.org/10.3390/nu15153383