

Prevalence and Risk Factors for Iron Deficiency Anemia among Children under Five and Women of Reproductive Age in Pakistan: Findings from the National Nutrition Survey 2018
 , , ,
, , ,
Abstract
:1. Introduction
2. Materials and Methods
3. Results
3.1. Child, Maternal, and Household Characteristics
3.2. Women and Household Characteristics
3.3. Risk Factors for Iron Deficiency Anemia in Children under Five
3.4. Risk Factors for Iron Deficiency Anemia in Women of Reproductive Age
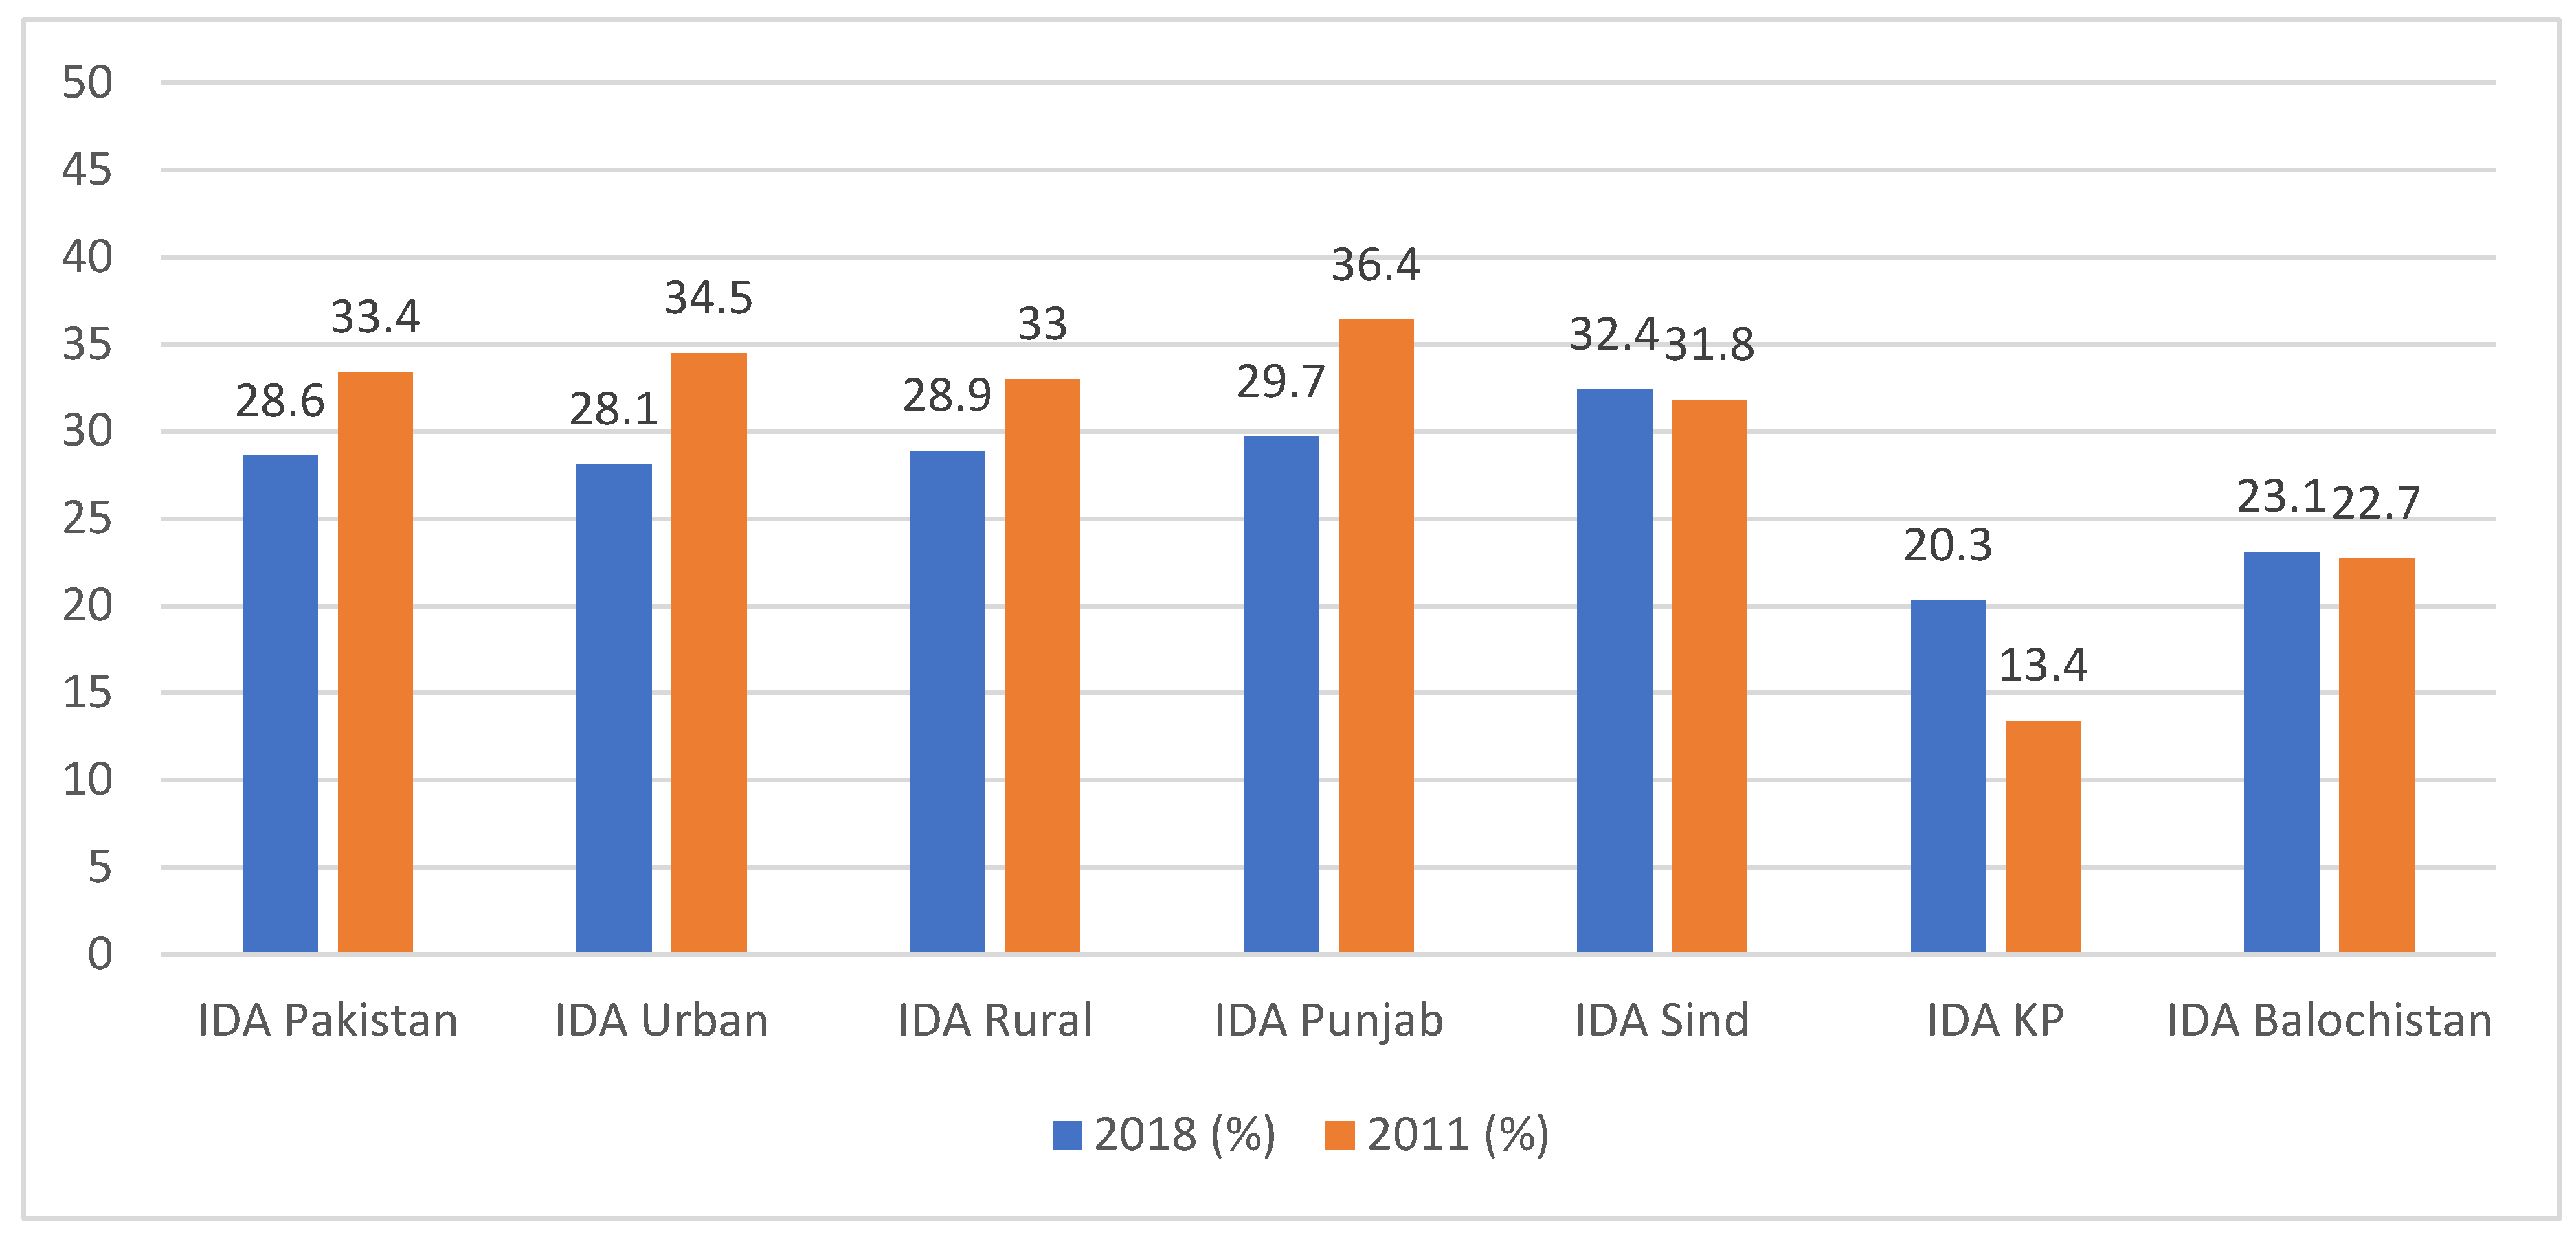
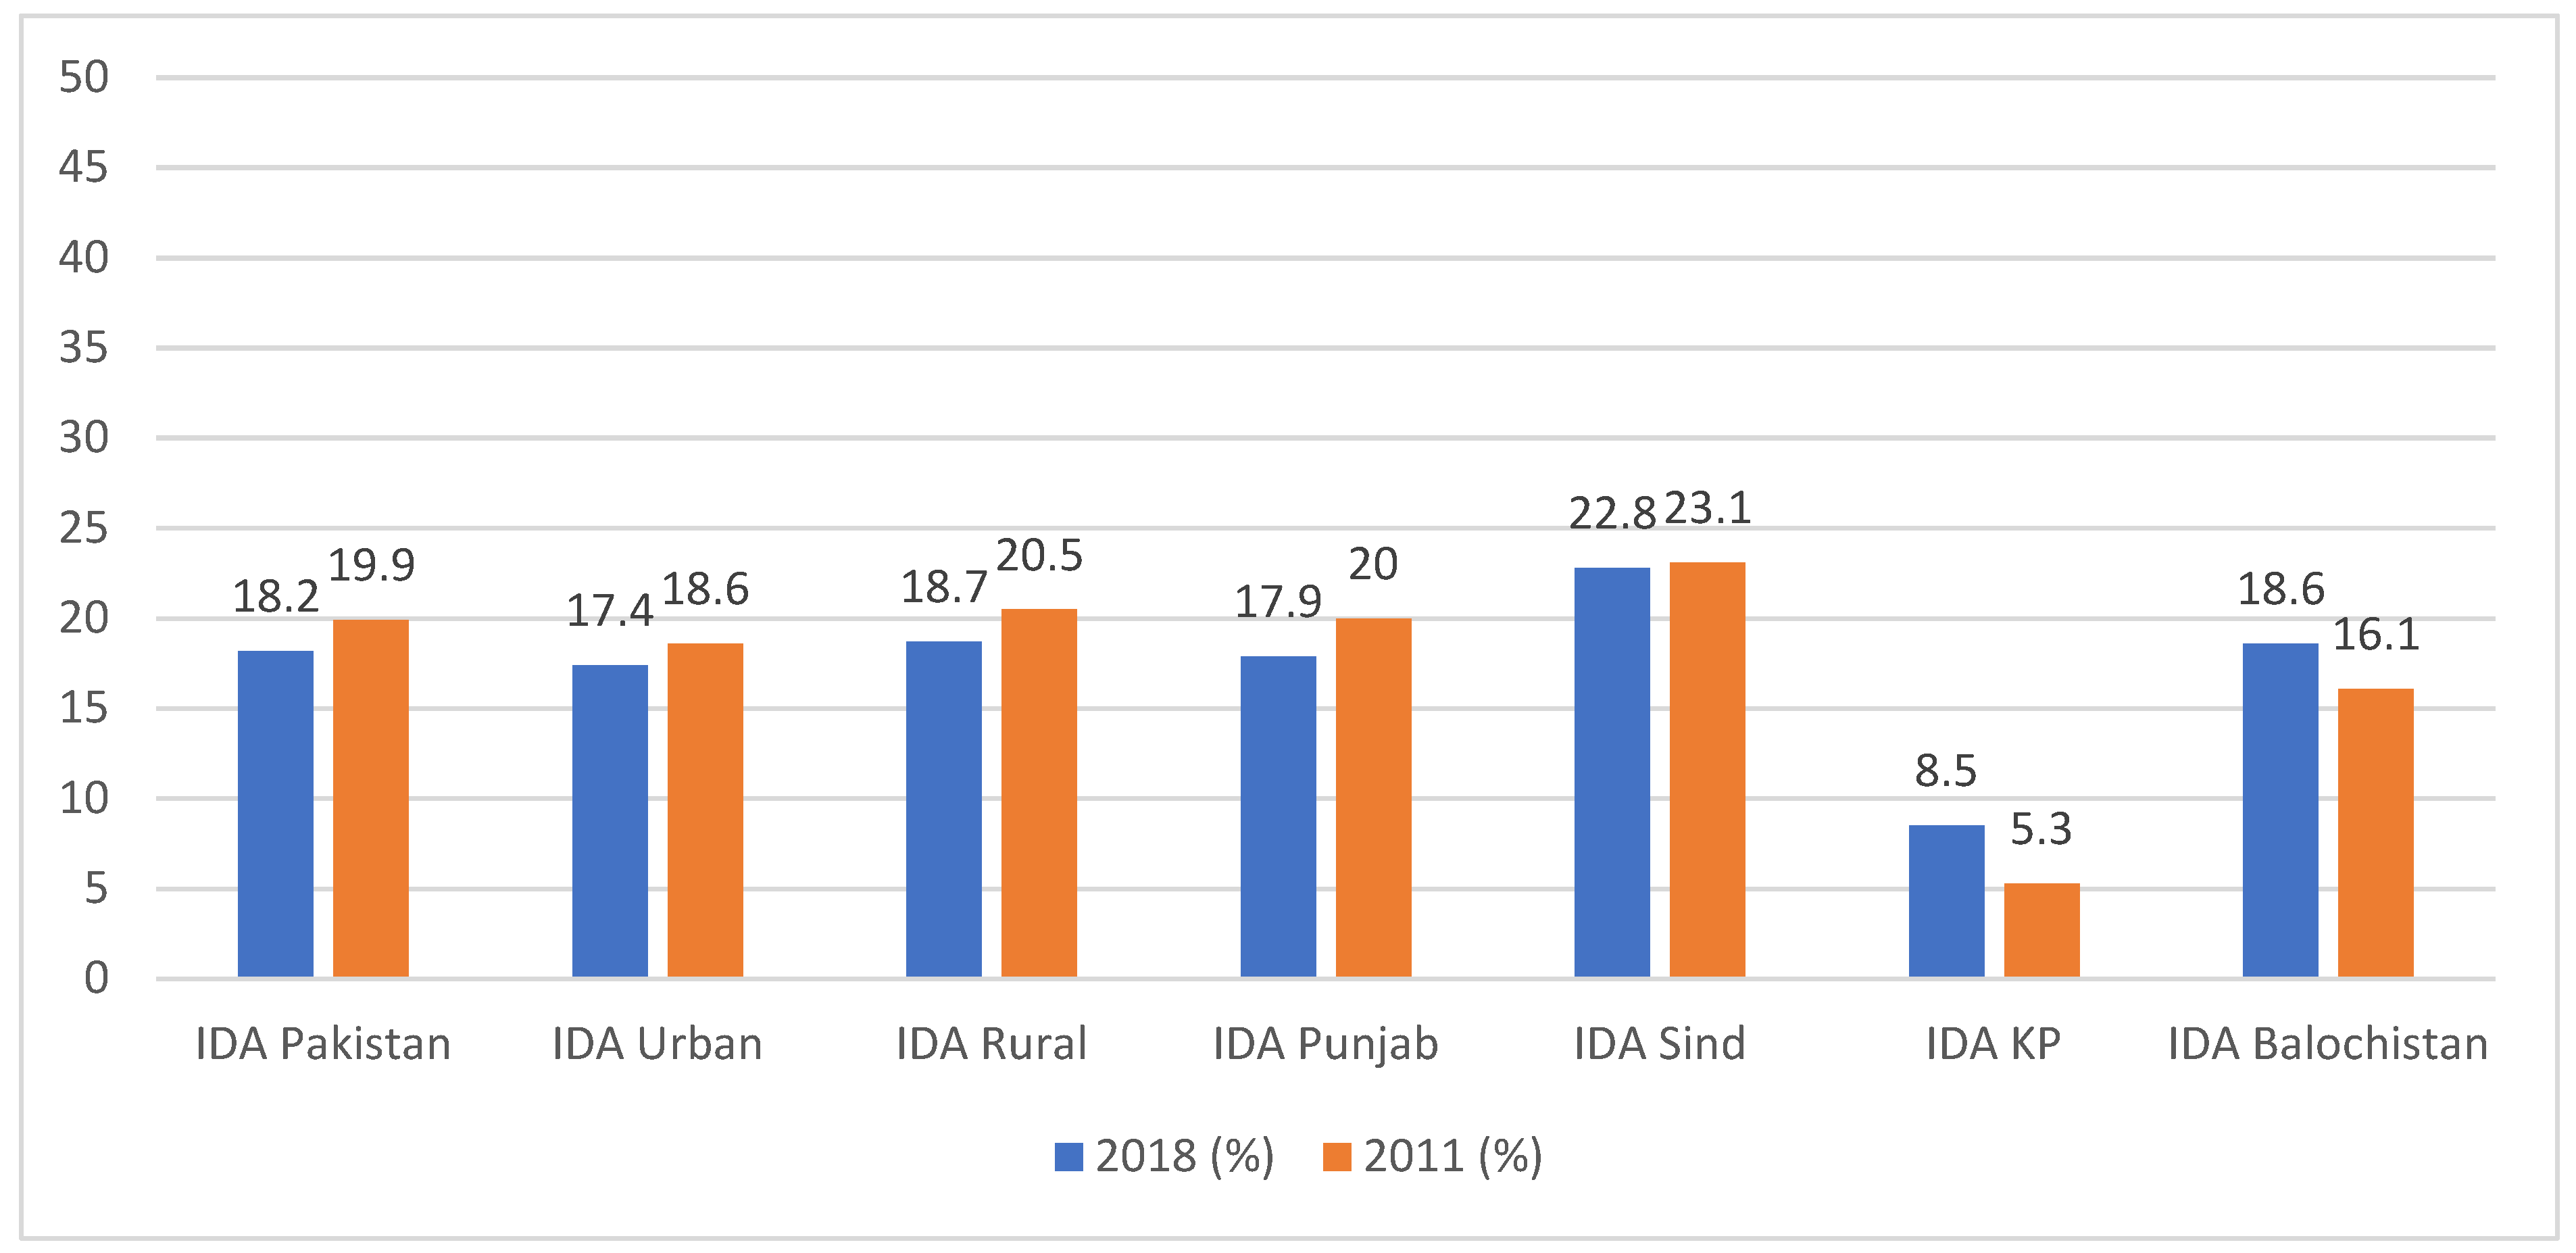
3.5. Comparison with Previous National Nutrition Survey 2011
4. Discussion
5. Conclusions
Author Contributions
Funding
Institutional Review Board Statement
Informed Consent Statement
Data Availability Statement
Acknowledgments
Conflicts of Interest
References
- World Health Organization. Anemia Policy Brief. 2014. Available online: https://www.who.int/publications/i/item/WHO-NMH-NHD-14.4 (accessed on 8 March 2023).
- World Health Organization. Global Nutrition Targets 2025: Policy Brief Series. 2014. Available online: https://www.who.int/publications/i/item/WHO-NMH-NHD-14.2 (accessed on 8 March 2023).
- Stevens, G.A.; Finucane, M.M.; De-Regil, L.M.; Paciorek, C.J.; Flaxman, S.R.; Branca, F.; Peña-Rosas, J.P.; Bhutta, Z.A.; Ezzati, M.; on behalf of Nutrition Impact Model Study Group (Anaemia). Global, regional, and national trends in haemoglobin concentration and prevalence of total and severe anaemia in children and pregnant and non-pregnant women for 1995–2011: A systematic analysis of population-representative data. Lancet Glob. Health 2013, 1, e16–e25. [Google Scholar] [CrossRef] [PubMed] [Green Version]
- UNICEF; UN University; WHO. Iron Deficiency Anaemia: Assessment, Prevention, and Control—A Guide for Programme Managers; WHO/NHD/01.3; WHO: Geneva, Switzerland, 2001.
- Black, R.E.; Allen, L.H.; Bhutta, Z.A.; Caulfield, L.E.; de Onis, M.; Ezzati, M.; Mathers, C.; Rivera, J.; Maternal and Child Undernutrition Study Group. Maternal and child undernutrition: Global and regional exposures and health consequences. Lancet 2008, 371, 243–260. [Google Scholar] [CrossRef] [PubMed]
- World Bank. Prevalence of Anemia among Children (% of Children Ages 6–59 Months). 2021. Available online: https://data.worldbank.org/indicator/SH.ANM.CHLD.ZS (accessed on 8 March 2023).
- World Bank. Prevalence of Anemia among Women of Reproductive Age (% of Women Ages 15–49). 2021. Available online: https://data.worldbank.org/indicator/SH.ANM.ALLW.ZS (accessed on 10 March 2023).
- World Bank. Prevalence of Anemia among Pregnant Women (%). 2021. Available online: https://data.worldbank.org/indicator/SH.PRG.ANEM (accessed on 10 March 2023).
- National Institute of Population Studies (NIPS) [Pakistan]; ICF. Pakistan Demographic and Health Survey 2017–18; NIPS: Islamabad, Pakistan; Rockville, ML, USA; ICF: Islamabad, Pakistan; Rockville, ML, USA, 2019. [Google Scholar]
- Government of Pakistan. National Nutrition Survey 2018. 2019. Available online: http://phkh.nhsrc.pk/sites/default/files/2021-03/National%20Nutrition%20Survey%20Key%20Findings%20Volum%201%20UNICEF%202018.pdf (accessed on 10 March 2023).
- Government of Afghanistan. Afghanistan Health Survey 2018. 2019. Available online: https://www.kit.nl/wp-content/uploads/2019/07/AHS-2018-report-FINAL-15-4-2019.pdf (accessed on 10 March 2023).
- National Institute of Population Research and Training (NIPORT); ICF. Bangladesh Demographic and Health Survey 2017–18; NIPORT: Dhaka, Bangladesh; Rockville, ML, USA; ICF: Dhaka, Bangladesh; Rockville, ML, USA, 2020. [Google Scholar]
- National Statistics Bureau. Bhutan Multiple Indicator Survey; National Statistics Bureau: Thimphu, Bhutan, 2011. [Google Scholar]
- International Institute for Population Sciences (IIPS); ICF. National Family Health Survey (NFHS-4), 2015–16; IIPS: India, Mumbai, 2017. [Google Scholar]
- Ministry of Health and Medical Education (Iran); Statistical Centre of Iran. Iran Multiple Indicator Demographic and Health Survey; National Institute for Health Research: Tehran, Iran, 2010.
- Ministry of Health (MOH) [Maldives]; ICF. Maldives Demographic and Health Survey 2016–17; MOH: Malé, Maldives; Rockville, ML, USA; ICF: Malé, Maldives; Rockville, ML, USA, 2018.
- Ministry of Health, Nepal; New ERA; ICF. Nepal Demographic and Health Survey 2016; Ministry of Health: Kathmandu, Nepal, 2017.
- Department of Census and Statistics (DCS); Ministry of Health, Nutrition and Indigenous Medicine. Sri Lanka Demographic and Health Survey 2016; DCS: Battaramulla, Sri Lanka, 2017.
- World Bank. Anemia at a Glance. 2004. Available online: http://web.worldbank.org/archive/website01213/WEB/IMAGES/ANEMIAAA.PDF (accessed on 10 March 2023).
- Horton, S.; Ross, J. The economics of iron deficiency. Food Policy 2003, 28, 51–75. [Google Scholar] [CrossRef]
- Shekar, M.; Kakietek, J.; Eberwein, J.D.; Walters, D. An Investment Framework for Nutrition: Reaching the Global Targets for Stunting, Anemia, Breastfeeding, and Wasting; The World Bank: Washington, DC, USA, 2017. [Google Scholar] [CrossRef]
- WHO. Pakistan’s Lady Health Worker Programme. 2008. Available online: https://chwcentral.org/pakistans-lady-health-worker-program/ (accessed on 15 March 2023).
- Oxford Policy Management. Lady Health Worker Programme. Performance Evaluation: Pakistan. 2019. Available online: https://www.unicef.org/pakistan/reports/performance-evaluation-report-lady-health-workers-programme-pakistan (accessed on 15 March 2023).
- Nutrition International. Saving Lives through Food Fortification in Pakistan. 2021. Available online: https://www.nutritionintl.org/project/food-fortification-program-ffp-pakistan/ (accessed on 15 March 2023).
- Food Fortification Programme. Food Fortification Programme: Fortifying Pakistan’s Future. 2021. Available online: http://www.ffp-pakistan.org/about-us/# (accessed on 15 March 2023).
- Government of Sindh. Food Fortification. 2021. Available online: https://www.aap.gos.pk/intiatives/sindh-multi-sectoral-action-for-nutrition/food-fortification/ (accessed on 15 March 2023).
- World Health Organization. Hemoglobin Concentrations for the Diagnosis of Anemia and Assessment of Severity. Vitamin and Mineral Nutrition Information System (VMNIS): Switzerland. 2011. Available online: https://apps.who.int/iris/handle/10665/85839 (accessed on 18 March 2023).
- Diagnostics, R. Cobas c 311 Analyzer: Operator’s Manual. 2010. Available online: https://elabdoc-prod.roche.com/eLD/api/downloads/1157159b-191e-e411-ed82-00215a9b0ba8?countryIsoCode=cz (accessed on 8 July 2023).
- Roche Diagnostics. Cobas CRP Test- REF 08024669119 -ENG. Available online: https://www.rochecanada.com/content/dam/rochexx/roche-ca/products/docs/package_inserts/cobasCRP-08024669190-EN-Can.pdf (accessed on 9 July 2023).
- DiaSorin. LIAISON® 25 OH Vitamin D Total Assay. Available online: https://www.diasorin.com/sites/default/files/allegati_prodotti/ese_25_oh_vit_m0870004213_e_low.pdf (accessed on 8 July 2023).
- Cassap, M. Iron, Copper and Zinc Determination in Wine Using Flame Atomic Absorption Spectroscopy. Available online: https://assets.thermofisher.com/TFS-Assets/CMD/Application-Notes/AN-43189-AAS-Iron-Copper-Zinc-Wine-AN43189-EN.pdf (accessed on 9 July 2023).
- Government of Pakistan. National Nutrition Survey 2011. 2013. Available online: https://www.humanitarianresponse.info/en/operations/pakistan/document/national-nutrition-survey-2011 (accessed on 4 April 2023).
- Habib, M.A.; Raynes-Greenow, C.; Soofi, S.B.; Ali, N.; Nausheen, S.; Ahmed, I.; Bhutta, Z.A. Prevalence and determinants of iron deficiency anemia among non-pregnant women of reproductive age in Pakistan. Asia Pac. J. Clin. Nutr. 2018, 27, 195–203. [Google Scholar] [PubMed]
- Dreyfuss, M.L.; Stoltzfus, R.J.; Shrestha, J.B.; Pradhan, E.K.; LeClerq, S.C.; Khatry, S.K.; Shrestha, S.R.; Katz, J.; Albonico, M.; West, K.P., Jr. Hookworms, malaria and vitamin A deficiency contribute to anemia and iron deficiency among pregnant women in the plains of Nepal. J. Nutr. 2000, 130, 2527–2536. [Google Scholar] [CrossRef] [PubMed] [Green Version]
- Government of Pakistan. National Nutrition Survey 2018—Annexures. 2018. Available online: http://phkh.nhsrc.pk/sites/default/files/2021-03/National%20Nutrition%20Survey%20Key%20Findings%20Volum%203%20UNICEF%202018.pdf (accessed on 4 April 2023).
- Sunuwar, D.R.; Singh, D.R.; Chaudhary, N.K.; Pradhan, P.M.S.; Rai, P.; Tiwari, K. Prevalence and factors associated with anemia among women of reproductive age in seven South and Southeast Asian countries: Evidence from nationally representative surveys. PLoS ONE 2020, 15, e0236449. [Google Scholar] [CrossRef]
- Gautam, S.; Min, H.; Kim, H.; Jeong, H.-S. Determining factors for the prevalence of anemia in women of reproductive age in Nepal: Evidence from recent national survey data. PLoS ONE 2019, 14, e0218288. [Google Scholar] [CrossRef] [Green Version]
- Harding, K.L.; Aguayo, V.M.; Namirembe, G.; Webb, P. Determinants of anemia among women and children in Nepal and Pakistan: An analysis of recent national survey data. Matern. Child Nutr. 2017, 14, e12478. [Google Scholar] [CrossRef] [Green Version]
- Sun, J.; Wu, H.; Zhao, M.; Magnussen, C.G.; Xi, B. Prevalence and changes of anemia among young children and women in 47 low- and middle-income countries, 2000–2018. Eclinicalmedicine 2021, 41. [Google Scholar] [CrossRef]
- Khan, J.R.; Awan, N.; Misu, F. Determinants of anemia among 6–59 months aged children in Bangladesh: Evidence from nationally representative data. BMC Pediatr. 2016, 16, 3. [Google Scholar] [CrossRef] [Green Version]
- Campbell, R.K.; Aguayo, V.M.; Kang, Y.; Dzed, L.; Joshi, V.; Waid, J.L.; Gupta, S.D.; Haselow, N.; West, K.P. Epidemiology of anaemia in children, adolescent girls, and women in Bhutan. Matern. Child Nutr. 2018, 14, e12740. [Google Scholar] [CrossRef] [PubMed]
- Dutta, M.; Bhise, M.; Prashad, L.; Chaurasia, H.; Debnath, P. Prevalence and risk factors of anemia among children 6–59 months in India: A multilevel analysis. Clin. Epidemiol. Glob. Health 2020, 8, 868–878. [Google Scholar] [CrossRef] [Green Version]
- Sunuwar, D.R.; Singh, D.R.; Adhikari, B.; Shrestha, S.; Pradhan, P.M.S. Factors affecting anaemia among women of reproductive age in Nepal: A multilevel and spatial analysis. BMJ Open 2021, 11, e041982. [Google Scholar] [CrossRef] [PubMed]
- Pande, S.; Ranjan, R.; Kratasyuk, V.A. Is Body Mass Index a potential biomarker for anemia in obese adolescents? J. Nutr. Intermed. Metab. 2018, 15, 1–2. [Google Scholar] [CrossRef]
- Abdelhaleim, A.F.; Amer, A.Y.; Soliman, J.S.A. Association of Zinc Deficiency with Iron Deficiency Anemia and its Symptoms: Results from a Case-control Study. Cureus 2019, 11, e3811. [Google Scholar] [CrossRef] [Green Version]
- Semba, R.; Bloem, M. The anemia of vitamin A deficiency: Epidemiology and pathogenesis. Eur. J. Clin. Nutr. 2002, 56, 271–281. [Google Scholar] [CrossRef] [Green Version]
- Cepeda-Lopez, A.C.; Aeberli, I.; Zimmermann, M.B. Does Obesity Increase Risk for Iron Deficiency? A Review of the Literature and the Potential Mechanisms. Int. J. Vitam. Nutr. Res. 2010, 80, 263–270. [Google Scholar] [CrossRef]
- Aigner, E.; Feldman, A.; Datz, C. Obesity as an Emerging Risk Factor for Iron Deficiency. Nutrients 2014, 6, 3587–3600. [Google Scholar] [CrossRef]
- Cepeda-Lopez, A.C.; Melse-Boonstra, A.; Zimmermann, M.B.; Herter-Aeberli, I. In overweight and obese women, dietary iron absorption is reduced and the enhancement of iron absorption by ascorbic acid is one-half that in normal-weight women. Am. J. Clin. Nutr. 2015, 102, 1389–1397. [Google Scholar] [CrossRef] [Green Version]
- Ausk, K.J.; Ioannou, G.N. Is Obesity Associated with Anemia of Chronic Disease? A Population-based Study. Obesity 2008, 16, 2356–2361. [Google Scholar] [CrossRef]
- Pasricha, S.-R.; Tye-Din, J.; Muckenthaler, M.U.; Swinkels, D.W. Iron deficiency. Lancet 2020, 397, 233–248. [Google Scholar] [CrossRef]
- Styczyński, J.; Słomka, A.; Łęcka, M.; Albrecht, K.; Romiszewski, M.; Pogorzała, M.; Kubicka, M.; Kuryło-Rafińska, B.; Tejza, B.; Gadomska, G.; et al. Soluble Hemojuvelin and Ferritin: Potential Prognostic Markers in Pediatric Hematopoietic Cell Transplantation. Cancers 2023, 15, 1041. [Google Scholar] [CrossRef] [PubMed]
- Wegmüller, R.; Bah, A.; Kendall, L.; Goheen, M.M.; Sanyang, S.; Danso, E.; A Sise, E.; Jallow, A.; Verhoef, H.; Jallow, M.W.; et al. Hepcidin-guided screen-and-treat interventions for young children with iron-deficiency anaemia in The Gambia: An individually randomised, three-arm, double-blind, controlled, proof-of-concept, non-inferiority trial. Lancet Glob. Health. 2023, 11, e105–e116. [Google Scholar] [CrossRef] [PubMed]
- Vásquez-Velásquez, C.; Fernandez-Guzman, D.; Quispe-Vicuña, C.; Caira-Chuquineyra, B.; Ccami-Bernal, F.; Castillo-Gutierrez, P.; Arredondo-Nontol, M.; Gonzales, G.F. Evaluating the Diagnostic Performance of Hemoglobin in the Diagnosis of Iron Deficiency Anemia in High-Altitude Populations: A Scoping Review. Int. J. Environ. Res. Public Health 2023, 20, 6117. [Google Scholar] [CrossRef] [PubMed]


| Maternal, Child, and Household Characteristics | n (%) |
|---|---|
| Mother’s Education | |
| None | 10,299 (54.8) |
| Primary | 1990 (12.4) |
| Middle | 1659 (9.7) |
| Secondary | 2073 (12.7) |
| Higher | 1793 (10.4) |
| Maternal Working Status | |
| Housewife | 15,748 (89.6) |
| Others | 2066 (10.4) |
| Mother’s Age | |
| Less than 20 years | 238 (1.3) |
| 20–34 years | 12,343 (71.5) |
| 35–49 years | 5233 (27.2) |
| Child Characteristics | |
| Gender | |
| Male | 9145 (51.0) |
| Female | 8669 (49.0) |
| Child’s Age | |
| 6–23 months | 3471 (19.4) |
| 24–59 months | 14,343 (80.6) |
| Diarrhea in Last 2 Weeks | |
| Yes | 1504 (7.6) |
| No | 16,310 (92.4) |
| ARI in Last 2 Weeks | |
| Yes | 486 (1.9) |
| No | 17,328 (98.1) |
| Fever in Last 2 Weeks | |
| Yes | 2582 (13.7) |
| No | 15,232 (86.3) |
| Biomarker Results | |
| Hb, Mean ± SD | 10.6 ± 2.5 |
| Ferritin, Mean ± SD | 20.2 ± 32.3 |
| IDA | |
| Deficient (Anemia and Low Ferritin) | 4694 (28.9) |
| Non-Deficient | 13,120 (71.1) |
| Household Characteristics | |
| Family Size | |
| ≤6 members | 9884 (57.7) |
| 7 or more members | 7930 (42.3) |
| Number of Children under five | |
| <5 | 17,652 (99.1) |
| ≥5 | 162 (0.9) |
| Drinking Water Sources | |
| Improved sources | 16,005 (92.4) |
| Unimproved sources | 1809 (7.6) |
| Sanitation Facilities | |
| Improved sanitation facility | 14,353 (84.4) |
| Unimproved sanitation facility | 3461 (15.6) |
| Food Insecurity Status | |
| Food secure | 10,787 (60.8) |
| Mild food insecure | 2016 (11.8) |
| Moderate food insecure | 1388 (8.3) |
| Severe food insecure | 3623 (19.1) |
| Household received Financial Assistance in Last 12 months | |
| Yes | 842 (4.9) |
| No | 16,972 (95.1) |
| Wealth Status (quintiles) | |
| Poorest | 4380 (19.4) |
| Second | 4144 (20.6) |
| Middle | 3748 (21.1) |
| Fourth | 3251 (21.4) |
| Richest | 2291 (17.5) |
| Community Characteristics | |
| Area | |
| Urban | 5540 (37.9) |
| Rural | 12,274 (62.1) |
| Province | |
| Punjab | 7208 (55.1) |
| Sindh | 3532 (27.2) |
| KP | 2086 (9.3) |
| Balochistan | 2272 (4.7) |
| ICT | 178 (0.8) |
| FATA | 302 (0.9) |
| AJK | 1270 (1.6) |
| GB | 966 (0.5) |
| Women’s Household and Community Characteristics | n (%) |
|---|---|
| Women Education | |
| None | 12,664 (53.7) |
| Primary | 2402 (12.1) |
| Middle | 2012 (9.6) |
| Secondary | 2600 (12.9) |
| Higher | 2436 (11.7) |
| Working Status | |
| Housewife | 18,774 (86.5) |
| Others | 3340 (13.5) |
| Age | |
| 15–29 years | 9605 (44.9) |
| 30–49 years | 12,509 (55.1) |
| BMI (kg/m2) | |
| Underweight (<18.5) | 2364 (10.4) |
| Normal (18.5–24.9) | 10,595 (45.4) |
| Overweight (25.0–29.9) | 5853 (27.5) |
| Obese (≥30) | 3302 (16.8) |
| Marital Status | |
| Currently Married | 20,505 (93.1) |
| Ever Married | 324 (1.6) |
| Un-Married | 1285 (5.3) |
| Micronutrient Status | |
| Hb, Mean ± SD | 12.1 ± 2.1 |
| Ferritin, Mean ± SD | 32.5 ± 61.1 |
| IDA | |
| Deficient (Anemia and Low Ferritin) | 3992 (18.4) |
| Non-Deficient | 18,122 (81.6) |
| Vitamin A | |
| Severe (<0.35 µmol/L) | 1113 (4.8) |
| Mild (0.35–0.70 µmol/L) | 5083 (22.3) |
| Non-Deficient (>0.70 µmol/L) | 15,918 (72.9) |
| Zinc | |
| Deficient (<60 µg/dL) | 4809 (22.2) |
| Non-Deficient (≥60 µg/dL) | 17,305 (77.8) |
| Vitamin D | |
| Severe Deficiency (<8.0 ng/mL) | 6005 (25.2) |
| Deficiency (8.0–20.0 ng/mL) | 11,661 (54.4) |
| Desirable (>20.0–30.0 ng/mL) | 2324 (11.6) |
| Sufficient (>30.0 ng/mL) | 2124 (8.7) |
| Household Characteristics | |
| Family Size | |
| ≤6 members | 12,267 (58.0) |
| 7 or more members | 9847 (42.0) |
| Drinking Water Sources | |
| Improved sources | 19,836 (92.4) |
| Unimproved sources | 2278 (7.6) |
| Sanitation Facilities | |
| Improved sanitation facility | 17,904 (84.8) |
| Unimproved sanitation facility | 4210 (15.2) |
| Food Insecurity Status | |
| Food secure | 13,217 (60.3) |
| Mild food insecure | 2607 (11.8) |
| Moderate food insecure | 1723 (8.3) |
| Severe food insecure | 4567 (19.6) |
| Household received Financial Assistance in Last 12 Months | |
| Yes | 1136 (5.2) |
| No | 20,978 (94.8) |
| Wealth Status (quintiles) | |
| Poorest | 5427 (18.7) |
| Second | 4964 (19.4) |
| Middle | 4601 (20.9) |
| Fourth | 4047 (21.7) |
| Richest | 3075 (19.2) |
| Community Characteristics | |
| Area | |
| Urban | 7050 (39.7) |
| Rural | 15,064 (60.3) |
| Province | |
| Punjab | 8486 (53.7) |
| Sindh | 4495 (28.2) |
| KP | 2568 (9.2) |
| Balochistan | 3048 (4.8) |
| ICT | 285 (1.1) |
| FATA | 394 (0.9) |
| AJK | 1612 (1.7) |
| GB | 1226 (0.5) |
| Deficient (Anemia and Low Ferritin) | Non-Deficient | Unadjusted Odd Ratio (OR) [95% CI] | p-Values | Adjusted Odd Ratio (OR) [95% CI] | p-Values | |
|---|---|---|---|---|---|---|
| Maternal Characteristics | ||||||
| Mother’s Education | ||||||
| None | 2716 (29.4) | 7583 (70.6) | 1.203 (1.034–1.4) | 0.017 | ||
| Primary | 568 (31.2) | 1422 (68.8) | 1.305 (1.085–1.571) | 0.005 | ||
| Middle | 440 (28.9) | 1219 (71.1) | 1.171 (0.962–1.425) | 0.115 | ||
| Secondary | 543 (26.7) | 1530 (73.3) | 1.05 (0.872–1.265) | 0.607 | ||
| Higher | 427 (25.7) | 1366 (74.3) | Ref. | |||
| Maternal Working Status | ||||||
| Housewife | 4175 (28.8) | 11,573 (71.2) | Ref. | |||
| Others | 519 (29.5) | 1547 (70.5) | 1.035 (0.904–1.185) | 0.617 | ||
| Mother’s Age | ||||||
| Less than 20 years | 61 (26.5) | 177 (73.5) | Ref. | |||
| 20–34 years | 3335 (29.7) | 9008 (70.3) | 1.173 (0.831–1.656) | 0.365 | ||
| 35–49 years | 1298 (26.6) | 3935 (73.4) | 1.006 (0.709–1.428) | 0.974 | ||
| Child Characteristics | ||||||
| Gender | ||||||
| Male | 2403 (29.3) | 6742 (70.7) | 1.047 (0.962–1.139) | 0.290 | ||
| Female | 2291 (28.4) | 6378 (71.6) | Ref. | |||
| Child’s Age | ||||||
| 6–23 months | 1017 (31.6) | 2454 (68.4) | 1.179 (1.062–1.31) | 0.002 | 1.198 (1.076–1.333) | 0.001 |
| 24–59 months | 3677 (28.2) | 10,666 (71.8) | Ref. | Ref. | ||
| Diarrhea in Last 2 Weeks | ||||||
| Yes | 484 (35.8) | 1020 (64.2) | 1.415 (1.224–1.637) | <0.001 | 1.319 (1.127–1.544) | 0.001 |
| No | 4210 (28.3) | 12,100 (71.7) | Ref. | Ref. | ||
| ARI in Last 2 Weeks | ||||||
| Yes | 128 (25.9) | 358 (74.1) | 0.858 (0.662–1.113) | 0.250 | ||
| No | 4566 (28.9) | 12,762 (71.1) | Ref. | |||
| Fever in Last 2 Weeks | ||||||
| Yes | 761 (33.1) | 1821 (66.9) | 1.263 (1.124–1.421) | <0.001 | 1.16 (1.023–1.315) | 0.02 |
| No | 3933 (28.2) | 11,299 (71.8) | Ref. | Ref. | ||
| Household Characteristics | ||||||
| Family Size | ||||||
| ≤6 members | 2581 (28.0) | 7303 (72.0) | Ref. | |||
| 7 or more members | 2113 (30.1) | 5817 (69.9) | 1.109 (1.018–1.207) | 0.017 | ||
| Number of Children under Five | ||||||
| <5 | 4639 (28.7) | 13,013 (71.3) | Ref. | Ref. | ||
| ≥5 | 55 (42.9) | 107 (57.1) | 1.867 (1.21–2.879) | 0.005 | 1.997 (1.282–3.11) | 0.002 |
| Drinking Water Sources | ||||||
| Improved sources | 4290 (29.2) | 11,715 (70.8) | Ref. | |||
| Unimproved sources | 404 (24.8) | 1405 (75.2) | 0.801 (0.679–0.945) | 0.009 | ||
| Sanitation Facilities | ||||||
| Improved sanitation facility | 3723 (28.0) | 10,630 (72.0) | Ref. | Ref. | ||
| Unimproved sanitation facility | 971 (33.8) | 2490 (66.2) | 1.318 (1.184–1.467) | <0.001 | 1.168 (1.019–1.338) | 0.026 |
| Food Insecurity Status | ||||||
| Food Secure | 2782 (28.1) | 8005 (71.9) | Ref. | Ref. | ||
| Mild food insecure | 508 (28.1) | 1508 (71.9) | 0.999 (0.87–1.145) | 0.983 | ||
| Moderate food insecure | 415 (32.3) | 973 (67.7) | 1.22 (1.043–1.427) | 0.013 | ||
| Severe food insecure | 989 (30.3) | 2634 (69.7) | 1.114 (0.999–1.243) | 0.052 | ||
| Household received Financial Assistance in Last 12 Months | ||||||
| Yes | 270 (37.6) | 572 (62.4) | Ref. | Ref. | ||
| No | 4424 (28.4) | 12,548 (71.6) | 0.66 (0.551–0.792) | <0.001 | 0.776 (0.641–0.939) | 0.009 |
| Wealth Status (quintiles) | ||||||
| Poorest | 1194 (32.7) | 3186 (67.3) | 1.314 (1.14–1.514) | <0.001 | 1.271 (1.076–1.502) | 0.005 |
| Second | 1086 (29.9) | 3058 (70.1) | 1.15 (0.996–1.327) | 0.057 | 1.222 (1.053–1.418) | 0.008 |
| Middle | 982 (27.7) | 2766 (72.3) | 1.034 (0.894–1.195) | 0.651 | 1.088 (0.939–1.259) | 0.262 |
| Fourth | 835 (27.1) | 2416 (72.9) | 1.001 (0.863–1.161) | 0.994 | 1.026 (0.884–1.19) | 0.738 |
| Richest | 597 (27.0) | 1694 (73.0) | Ref. | Ref. | ||
| Community Characteristics | ||||||
| Area | ||||||
| Urban | 1477 (28.4) | 4063 (71.6) | Ref. | |||
| Rural | 3217 (29.2) | 9057 (70.8) | 1.041 (0.95–1.139) | 0.389 | ||
| Province | ||||||
| Punjab | 2149 (30.1) | 5059 (69.9) | 2.487 (2.018–3.064) | <0.001 | 2.929 (2.365–3.628) | <0.001 |
| Sindh | 1170 (32.4) | 2362 (67.6) | 2.774 (2.236–3.441) | <0.001 | 2.904 (2.33–3.619) | <0.001 |
| KP | 369 (19.8) | 1717 (80.2) | 1.427 (1.123–1.815) | 0.004 | 1.551 (1.216–1.977) | <0.001 |
| Balochistan | 512 (20.9) | 1760 (79.1) | 1.53 (1.196–1.957) | 0.001 | 1.58 (1.23–2.029) | <0.001 |
| ICT | 30 (16.7) | 148 (83.3) | 1.162 (0.736–1.835) | 0.518 | 1.421 (0.896–2.256) | 0.136 |
| FATA | 62 (22.0) | 240 (78.0) | 1.634 (1.106–2.414) | 0.014 | 1.621 (1.092–2.406) | 0.017 |
| AJK | 246 (18.4) | 1024 (81.6) | 1.307 (1.002–1.705) | 0.048 | 1.441 (1.099–1.889) | 0.008 |
| GB | 156 (14.7) | 810 (85.3) | Ref. | Ref. |
| Deficient (Anemia and Low Ferritin) | Non-Deficient | Unadjusted Odd Ratio (OR) [95% CI] | p-Values | Adjusted Odd Ratio (OR) [95% CI] | p-Values | |
|---|---|---|---|---|---|---|
| Women Characteristics | ||||||
| Education | ||||||
| None | 2480 (20.7) | 10,184 (79.3) | 1.708 (1.453–2.006) | <0.001 | 1.536 (1.3–1.815) | <0.001 |
| Primary | 415 (17.1) | 1987 (82.9) | 1.35 (1.108–1.644) | 0.003 | 1.263 (1.034–1.544) | 0.022 |
| Middle | 354 (18.0) | 1658 (82.0) | 1.433 (1.161–1.768) | 0.001 | 1.399 (1.129–1.733) | 0.002 |
| Secondary | 410 (14.5) | 2190 (85.5) | 1.106 (0.901–1.358) | 0.337 | 1.086 (0.882–1.338) | 0.435 |
| Higher | 333 (13.3) | 2103 (86.7) | Ref. | Ref. | ||
| Working Status | ||||||
| Housewife | 3351 (18.1) | 15,423 (81.9) | Ref. | |||
| Others | 641 (19.9) | 2699 (80.1) | 1.125 (0.996–1.272) | 0.058 | ||
| Age | ||||||
| 15–29 years | 1754 (18.5) | 7851 (81.5) | Ref. | |||
| 30–49 years | 2238 (18.2) | 10,271 (81.8) | 0.981 (0.899–1.071) | 0.668 | ||
| BMI (kg/m2) | ||||||
| Underweight (<18.5) | 560 (24.3) | 1804 (75.7) | 1.262 (1.104–1.441) | 0.001 | 1.098 (0.957–1.261) | 0.182 |
| Normal (18.5–24.9) | 2044 (20.3) | 8551 (79.7) | Ref. | Ref. | ||
| Overweight (25.0–29.9) | 919 (15.4) | 4934 (84.6) | 0.714 (0.641–0.796) | <0.001 | 0.772 (0.691–0.862) | <0.001 |
| Obese (≥30) | 469 (14.2) | 2833 (85.8) | 0.65 (0.567–0.745) | <0.001 | 0.712 (0.62–0.817) | <0.001 |
| Marital Status | ||||||
| Currently Married | 3714 (18.3) | 16,791 (81.7) | 1.034 (0.843–1.267) | 0.751 | ||
| Ever Married | 56 (21.2) | 268 (78.8) | 1.242 (0.82–1.884) | 0.306 | ||
| Un-Married | 222 (17.8) | 1063 (82.2) | Ref. | |||
| Micronutrient Status | ||||||
| Vitamin A | ||||||
| Severe (<0.35 µmol/L) | 219 (21.6) | 894 (78.4) | 1.358 (1.126–1.637) | 0.001 | 1.266 (1.051–1.524) | 0.013 |
| Mild (0.35–0.70 µmol/L) | 1111 (22.6) | 3972 (77.4) | 1.44 (1.305–1.589) | <0.001 | 1.369 (1.238–1.513) | <0.001 |
| Non deficient (>0.70 µmol/L) | 2662 (16.8) | 13,256 (83.2) | Ref. | Ref. | ||
| Zinc | ||||||
| Deficient (<60 µg/dL) | 1077 (23.4) | 3732 (76.6) | 1.504 (1.364–1.659) | <0.001 | 1.424 (1.289–1.573) | <0.001 |
| Non-Deficient (≥60 µg/dL) | 2915 (16.9) | 14,390 (83.1) | Ref. | Ref. | ||
| Vitamin D | ||||||
| Severe Deficiency (<8.0 ng/mL) | 998 (16.5) | 5007 (83.5) | 0.961 (0.808–1.143) | 0.656 | ||
| Deficiency (8.0–20.0 ng/mL) | 2173 (18.8) | 9488 (81.2) | 1.13 (0.966–1.322) | 0.125 | ||
| Desirable (>20.0–30.0 ng/mL) | 469 (21.3) | 1855 (78.7) | 1.316 (1.09–1.589) | 0.004 | ||
| Sufficient (>30.0 ng/mL) | 352 (17.0) | 1772 (83.0) | Ref. | |||
| Household Characteristics | ||||||
| Family size | ||||||
| ≤6 members | 2195 (18.1) | 10,072 (81.9) | Ref. | |||
| ≥7 members | 1797 (18.7) | 8050 (81.3) | 1.043 (0.955–1.138) | 0.348 | ||
| Drinking Water Sources | ||||||
| Improved sources | 3585 (18.3) | 16,251 (81.7) | Ref. | |||
| Unimproved sources | 407 (18.6) | 1871 (81.4) | 1.019 (0.86–1.208) | 0.824 | ||
| Sanitation Facilities | ||||||
| Improved sanitation facility | 3049 (17.3) | 14,855 (82.7) | Ref. | |||
| Unimproved sanitation facility | 943 (24.5) | 3267 (75.5) | 1.557 (1.398–1.733) | <0.001 | ||
| Food Insecurity Status | ||||||
| Food Secure | 2149 (16.4) | 11,068 (83.6) | Ref. | Ref. | ||
| Mild food insecure | 493 (20.2) | 2114 (79.8) | 1.292 (1.127–1.482) | <0.001 | 1.223 (1.064–1.405) | 0.005 |
| Moderate food insecure | 350 (20.6) | 1373 (79.4) | 1.32 (1.124–1.55) | 0.001 | 1.134 (0.96–1.339) | 0.138 |
| Severe food insecure | 1000 (22.4) | 3567 (77.6) | 1.468 (1.319–1.634) | <0.001 | 1.202 (1.074–1.344) | 0.001 |
| Household received Financial Assistance in Last 12 Months | ||||||
| Yes | 247 (25.0) | 889 (75.0) | Ref. | |||
| No | 3745 (18.0) | 17,233 (82.0) | 0.657 (0.551–0.784) | <0.001 | ||
| Wealth Status (quintiles) | ||||||
| Poorest | 1200 (24.6) | 4227 (75.4) | 1.753 (1.519–2.025) | <0.001 | ||
| Second | 920 (19.8) | 4044 (80.2) | 1.325 (1.143–1.536) | <0.001 | ||
| Middle | 758 (16.5) | 3843 (83.5) | 1.058 (0.91–1.231) | 0.461 | ||
| Fourth | 638 (16.0) | 3409 (84.0) | 1.023 (0.877–1.194) | 0.774 | ||
| Richest | 476 (15.7) | 2599 (84.3) | Ref. | |||
| Community Characteristics | ||||||
| Area | ||||||
| Urban | 1236 (17.2) | 5814 (82.8) | Ref. | |||
| Rural | 2756 (19.1) | 12,308 (80.9) | 1.133 (1.033–1.243) | 0.008 | ||
| Province | ||||||
| Punjab | 1522 (17.9) | 6964 (82.1) | 1.03 (0.854–1.242) | 0.758 | 1.022 (0.842–1.239) | 0.828 |
| Sindh | 1068 (22.8) | 3427 (77.2) | 1.396 (1.151–1.692) | 0.001 | 1.25 (1.024–1.526) | 0.028 |
| KP | 243 (8.9) | 2325 (91.1) | 0.461 (0.365–0.583) | <0.001 | 0.443 (0.349–0.562) | <0.001 |
| Balochistan | 598 (17.8) | 2450 (82.2) | 1.023 (0.824–1.27) | 0.837 | 0.873 (0.698–1.092) | 0.234 |
| ICT | 35 (11.8) | 250 (88.2) | 0.628 (0.413–0.954) | 0.029 | 0.714 (0.466–1.094) | 0.122 |
| FATA | 40 (13.6) | 354 (86.4) | 0.744 (0.467–1.185) | 0.213 | 0.701 (0.44–1.118) | 0.136 |
| AJK | 273 (16.9) | 1339 (83.1) | 0.962 (0.751–1.232) | 0.757 | 1.015 (0.789–1.307) | 0.906 |
| GB | 213 (17.5) | 1013 (82.5) | Ref. | Ref. |
Disclaimer/Publisher’s Note: The statements, opinions and data contained in all publications are solely those of the individual author(s) and contributor(s) and not of MDPI and/or the editor(s). MDPI and/or the editor(s) disclaim responsibility for any injury to people or property resulting from any ideas, methods, instructions or products referred to in the content. |
© 2023 by the authors. Licensee MDPI, Basel, Switzerland. This article is an open access article distributed under the terms and conditions of the Creative Commons Attribution (CC BY) license (https://creativecommons.org/licenses/by/4.0/).
Share and Cite
Habib, A.; Kureishy, S.; Soofi, S.; Hussain, I.; Rizvi, A.; Ahmed, I.; Ahmed, K.M.; Achakzai, A.B.K.; Bhutta, Z.A. Prevalence and Risk Factors for Iron Deficiency Anemia among Children under Five and Women of Reproductive Age in Pakistan: Findings from the National Nutrition Survey 2018. Nutrients 2023, 15, 3361. https://doi.org/10.3390/nu15153361
Habib A, Kureishy S, Soofi S, Hussain I, Rizvi A, Ahmed I, Ahmed KM, Achakzai ABK, Bhutta ZA. Prevalence and Risk Factors for Iron Deficiency Anemia among Children under Five and Women of Reproductive Age in Pakistan: Findings from the National Nutrition Survey 2018. Nutrients. 2023; 15(15):3361. https://doi.org/10.3390/nu15153361
Chicago/Turabian StyleHabib, Atif, Sumra Kureishy, Sajid Soofi, Imtiaz Hussain, Arjumand Rizvi, Imran Ahmed, Khawaja Masuood Ahmed, Abdul Baseer Khan Achakzai, and Zulfiqar A. Bhutta. 2023. "Prevalence and Risk Factors for Iron Deficiency Anemia among Children under Five and Women of Reproductive Age in Pakistan: Findings from the National Nutrition Survey 2018" Nutrients 15, no. 15: 3361. https://doi.org/10.3390/nu15153361
APA StyleHabib, A., Kureishy, S., Soofi, S., Hussain, I., Rizvi, A., Ahmed, I., Ahmed, K. M., Achakzai, A. B. K., & Bhutta, Z. A. (2023). Prevalence and Risk Factors for Iron Deficiency Anemia among Children under Five and Women of Reproductive Age in Pakistan: Findings from the National Nutrition Survey 2018. Nutrients, 15(15), 3361. https://doi.org/10.3390/nu15153361