Article

Prevalence of Vitamin B12 and Folate Deficiencies in Indian Children and Adolescents

by
Tattari Shalini
1,
Raghu Pullakhandam
1,
Santu Ghosh
2,
Bharati Kulkarni
1,
Hemalatha Rajkumar
1,
Harshpal S. Sachdev
3,
Anura V. Kurpad
2 and
Geereddy Bhanuprakash Reddy
1,*
1
National Institute of Nutrition, Jamai-Osmania, Tarnaka, Hyderabad 500007, India
2
St. John’s Medical College, Bangalore 560034, India
3
Sitaram Bhartia Institute of Science and Research, New Delhi 110016, India
*
Author to whom correspondence should be addressed.
Nutrients 2023, 15(13), 3026; https://doi.org/10.3390/nu15133026
Submission received: 14 May 2023 / Revised: 16 June 2023 / Accepted: 21 June 2023 / Published: 3 July 2023
(This article belongs to the Section Nutritional Epidemiology)

Abstract

:
Deficiencies of vitamin B12 (B12) and folate (FA) are of particular interest due to their pleiotropic role in 1-carbon metabolism. In addition to adverse birth outcomes, deficiencies of B12 and FA, or an imbalance in FA/B12 status, are linked to metabolic disorders. Indian diets that are predominantly plant food-based could be deficient in these vitamins, but there are no national estimates of the prevalence of B12 and FA deficiency in Indian children and adolescents, nor their associations with age, sex and growth indicators. The recent Comprehensive National Nutrition Survey (CNNS-2016-18) provided estimates of the prevalence of B12 and FA deficiency at the national and state levels among preschool (1–4 years: 9976 and 11,004 children, respectively), school-age children (5–9 years: 12,156 and 14,125) and adolescents (10–19 years: 11,748 and 13,621). Serum B12 and erythrocyte FA were measured by the direct chemiluminescence method and their deficiency was defined using WHO cut-offs. The prevalence of B12 and FA deficiency was high among adolescents (31.0%, CI: 28.7–33.5 and 35.6%, CI: 33.1–8.2) compared to school-age (17.3%, CI: 15.4–19.3 and 27.6%, CI: 25.5–29.9) and preschool children (13.8%, CI: 11.7–16.2 and 22.8%, CI: 20.5–25.2, respectively). The prevalence of both B12 and FA deficiency was significantly higher by 8% and 5%, respectively, in adolescent boys compared to girls. There was no association between anthropometric undernutrition and B12 and FA deficiency. There was wide regional variation in the prevalence of B12 and FA deficiency, but no rural–urban differences were observed across all age groups. The national prevalence of B12 deficiency among preschool or school-age children was <20% (the cut-off that indicates a public health problem). However, FA deficiency in these age groups and both FA and B12 deficiencies in adolescents were >20%, warranting further investigation.

1. Introduction

Among micronutrients, vitamin B12 (B12) and folate (FA) are critical as they are required in a plethora of metabolic and biological functions [1,2]. B12 and FA have overlapping biological functions in DNA synthesis and the development of red blood cells (RBC) and the myelin sheath, which are essential for normal growth and development [3]. One central pathway for both is the methyl transfer reaction in the methionine cycle, which converts homocysteine (Hcy) to methionine. Folate is engaged in many methylation reactions covering DNA, proteins, phospholipids and neurotransmitter metabolism [4]. B12 is only found in animal-source foods such as meat, poultry, fish and dairy products, while folate is abundant in both animal and plant foods.
B12 and FA deficiencies occur throughout the lifecycle, with different outcomes. During pregnancy, they are associated with an increased risk of adverse outcomes such as neural tube defects and low birth weight, intrauterine growth retardation, miscarriage and pre-eclampsia [5,6,7]. In children, B12 and FA deficiency can result in megaloblastic anemia, poor growth and stunting, increased risk of infections, cognitive dysfunction, neurologic damage and brain atrophy in severe cases [2,3,4,8]. There is also a high prevalence of the double burden of malnutrition, where multiple biomarkers of cardiovascular disorders (CVDs) are elevated even in undernourished children and adolescents [9]. B12 and FA deficiencies are associated with hyperhomocysteinemia, which is a CVD risk factor [10,11,12], and during pregnancy, an imbalance in FA/B12 status has been associated with adverse birth outcomes [5] and adiposity and insulin resistance in the offspring [13]. Although a high prevalence of B12 (27–67%) and FA (12–42%) deficiency has been reported in India [11,12,14,15,16,17], the studies were not nationally representative.
The Indian Comprehensive National Nutrition Survey (CNNS) was conducted during 2016–2018 and evaluated the anthropometry, along with serum B12 and erythrocyte FA concentrations, among 1–19-year-old children and adolescents across all the Indian geographic states. This offered an opportunity to quantify the prevalence of B12 and FA deficiency at a national and state level in children and adolescents, stratified by age and gender. We also evaluated the association of B12 and FA deficiency with demographic and socioeconomic variables, as well as reported morbidity and anemia prevalence.

2. Methodology

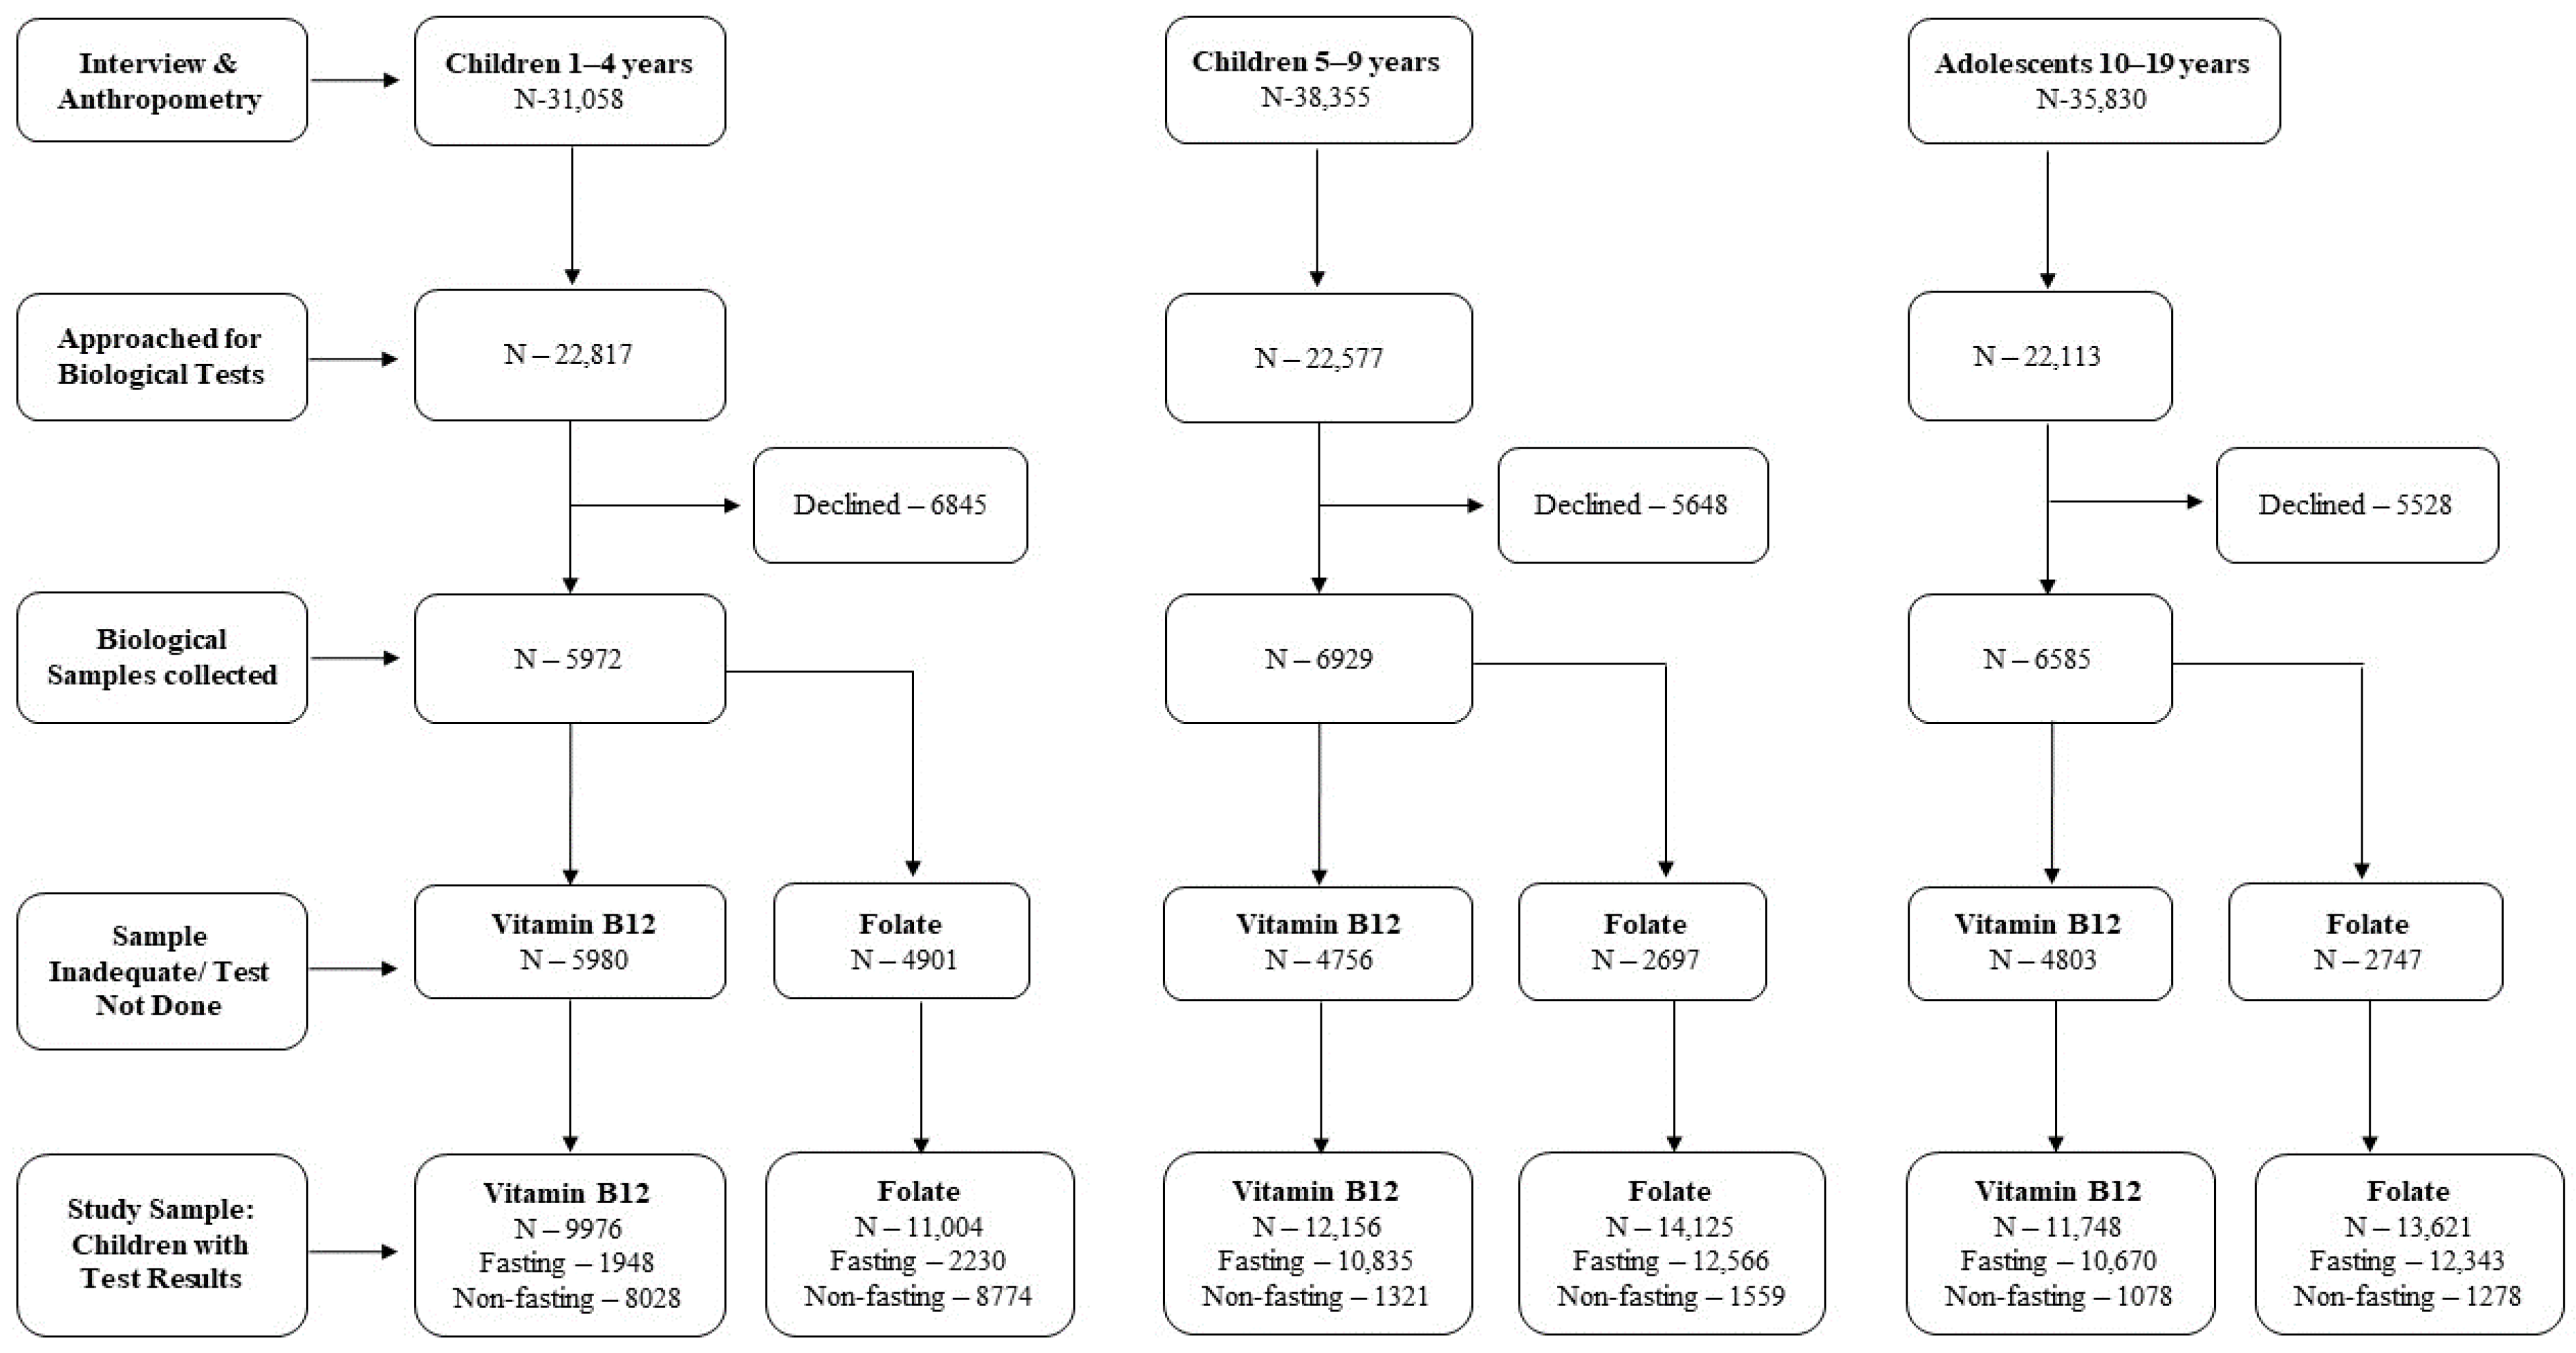
2.1. CNNS Survey, Serum B12 and Erythrocyte FA Analysis

The CNNS was a community-based cross-sectional survey conducted among Indian children and adolescents in 29 states and the union territory of Delhi from February 2016 to October 2018 in collaboration with UNICEF, India and the Population Council, under the supervision of the Ministry of Health and Family Welfare, Government of India. The methodological details of the survey are available in the CNNS report [18]. Briefly, CNNS used a multi-stage stratified, probability proportional to size (PPS) cluster sampling to enroll preschool children (1–4 years), school-age children (5–9 years) and adolescents (10–19 years) to adequately represent the national, state, male–female and urban–rural population. For biological sampling, 50% of all the children who completed anthropometry were selected by systematic random sampling. Children/adolescents with a physical deformity, cognitive disability, chronic illness, acute febrile/infectious illness, acute injury or pregnancy were excluded. Ethical approval was obtained from the Institutional Review Boards of Population Council, New York, NY, USA, and the Post-Graduate Institute of Medical Education and Research, Chandigarh, India [18]. Informed consent from the parents/caregivers of children under 10 years, informed consent of parents/caregivers of adolescents (11–17 years) and the latter’s agreement, and informed consent of adolescents older than 17 years were obtained. All procedures and methods were performed in accordance with the Declaration of Helsinki.
Household socioeconomic and demographic characteristics, information on history of morbidity in the preceding two weeks and iron–folic acid (IFA) supplementation in the previous week, and anthropometric data of one child/adolescent per age group were collected from each household. The wealth index based on the possession of common household items and facilities was computed as described in the National Family Health Survey (NFHS)-4 [19]. Access to facilities such as drinking water, hand washing and sanitation was categorized based on WHO/UNICEF Joint Monitoring Programme for Water Supply, Sanitation and Hygiene (WASH) guidelines [20]. Age–sex standardized height-for-age (HAZ), weight-for-height (WHZ), and BMI-for-age Z-scores were calculated using the WHO Growth Reference Standards [21].
The day before sample collection, parents and children were instructed to ensure overnight fasting (8–10 h) in the latter. Venous blood samples (7 mL blood from children under 5 and 10 mL from 5–19-year-olds) and recordings of binary (yes/no) information on fasting status and time of sample collection were obtained by trained phlebotomists. The blood samples were transported in cool bags (3L-12H-08P, PronGo) to the nearest collection center, where the serum/plasma and erythrocytes were separated and divided into aliquots within 6 h of sample collection. Biochemical analyses were carried out by SRL Labs in Mumbai, Gurugram and Kolkata, India, and are reported in detail elsewhere [22]. Briefly, serum B12 and erythrocyte FA levels were estimated using a chemiluminescence-based competitive immunoassay (Siemens Centaur) [18]. Hemoglobin was estimated in whole blood by the cyanmethemoglobin method (Beckman Coulter, LH 750). Rigorous quality control procedures were implemented for sample collection, transportation and testing using standard internal and external quality assurance procedures [18,22].
Using WHO guidelines, B12 deficiency was defined as serum B12 < 203 pg/mL (150 pmol/L; conversion factor: 0.738) and FA deficiency as erythrocyte FA < 151 ng/mL (342 nmol/L; conversion factor: 2.266) for all age groups [23]. Anemia was diagnosed using WHO Hb cut-offs (g/dL): <11.0 (1–4 years), <11.5 (5–11 years), <12.0 (12–14 years), <12.0 (15–19 years, girls) and <13.0 (15–19 years, boys) [24]. According to the Biomarkers Reflecting Inflammation and Nutritional Determinants of Anemia (BRINDA) report, B12 and FA concentrations do not require adjustment for inflammation [25], and hence, no adjustment was performed in the present study.

2.2. Statistical Analyses

Statistical analyses were conducted using the SPSS statistical package (version 23, SPSS Inc., Chicago, IL, USA). The proportion of demographic characteristics of the study sample included in the present analysis was compared with the proportion in the entire CNNS survey sample to rule out selection bias due to nested sampling. Serum B12 and erythrocyte FA concentrations are presented as geometric mean (GM) and geometric standard deviation (GSD), since their distributions were skewed. Relevant sampling weights were used wherever indicated in order to ensure the representativeness of the estimates at the national/state level as well as at the local level, such as rural, urban and urban slum areas in metropolitan cities. The prevalence of B12 and FA deficiency, along with 95% confidence intervals (CI), was estimated at the national and state levels. Sub-group analyses were also performed to evaluate urban–rural, age, gender, sociodemographic and WASH differentials. The association between the prevalence of B12 and FA deficiency with age groups in different states was evaluated using the Spearman rank-order correlation.

3. Results

3.1. Characteristics of the Study Population

A total of 1,05,243 children and adolescents (preschool: 31,058, school-age: 38,355, adolescents: 35,830) were interviewed and their anthropometric data were collected; serum B12 and erythrocyte FA concentrations were available for 33,880 and 38,750 children and adolescents (preschool: 9976 and 11,004, school-age: 12,156 and 14,125 and adolescents: 11,748 and 13,621, respectively) (Figure 1). The sociodemographic characteristics were almost similar among participants for whom anthropometric data were collected (total sample) and the study sample (B12 and FA), except the proportion of children aged 3–4 and 7–9 years included in the study sample was higher than that of those aged 1–2 and 5–6 years (61% vs. 39%) (Table S1). Table 1 shows the age-specific general characteristics of the study population. Among preschool children, 35% were stunted and underweight, 16% were wasted/thin and about 15% had diarrhea two weeks prior to the survey in both B12 and FA study samples.

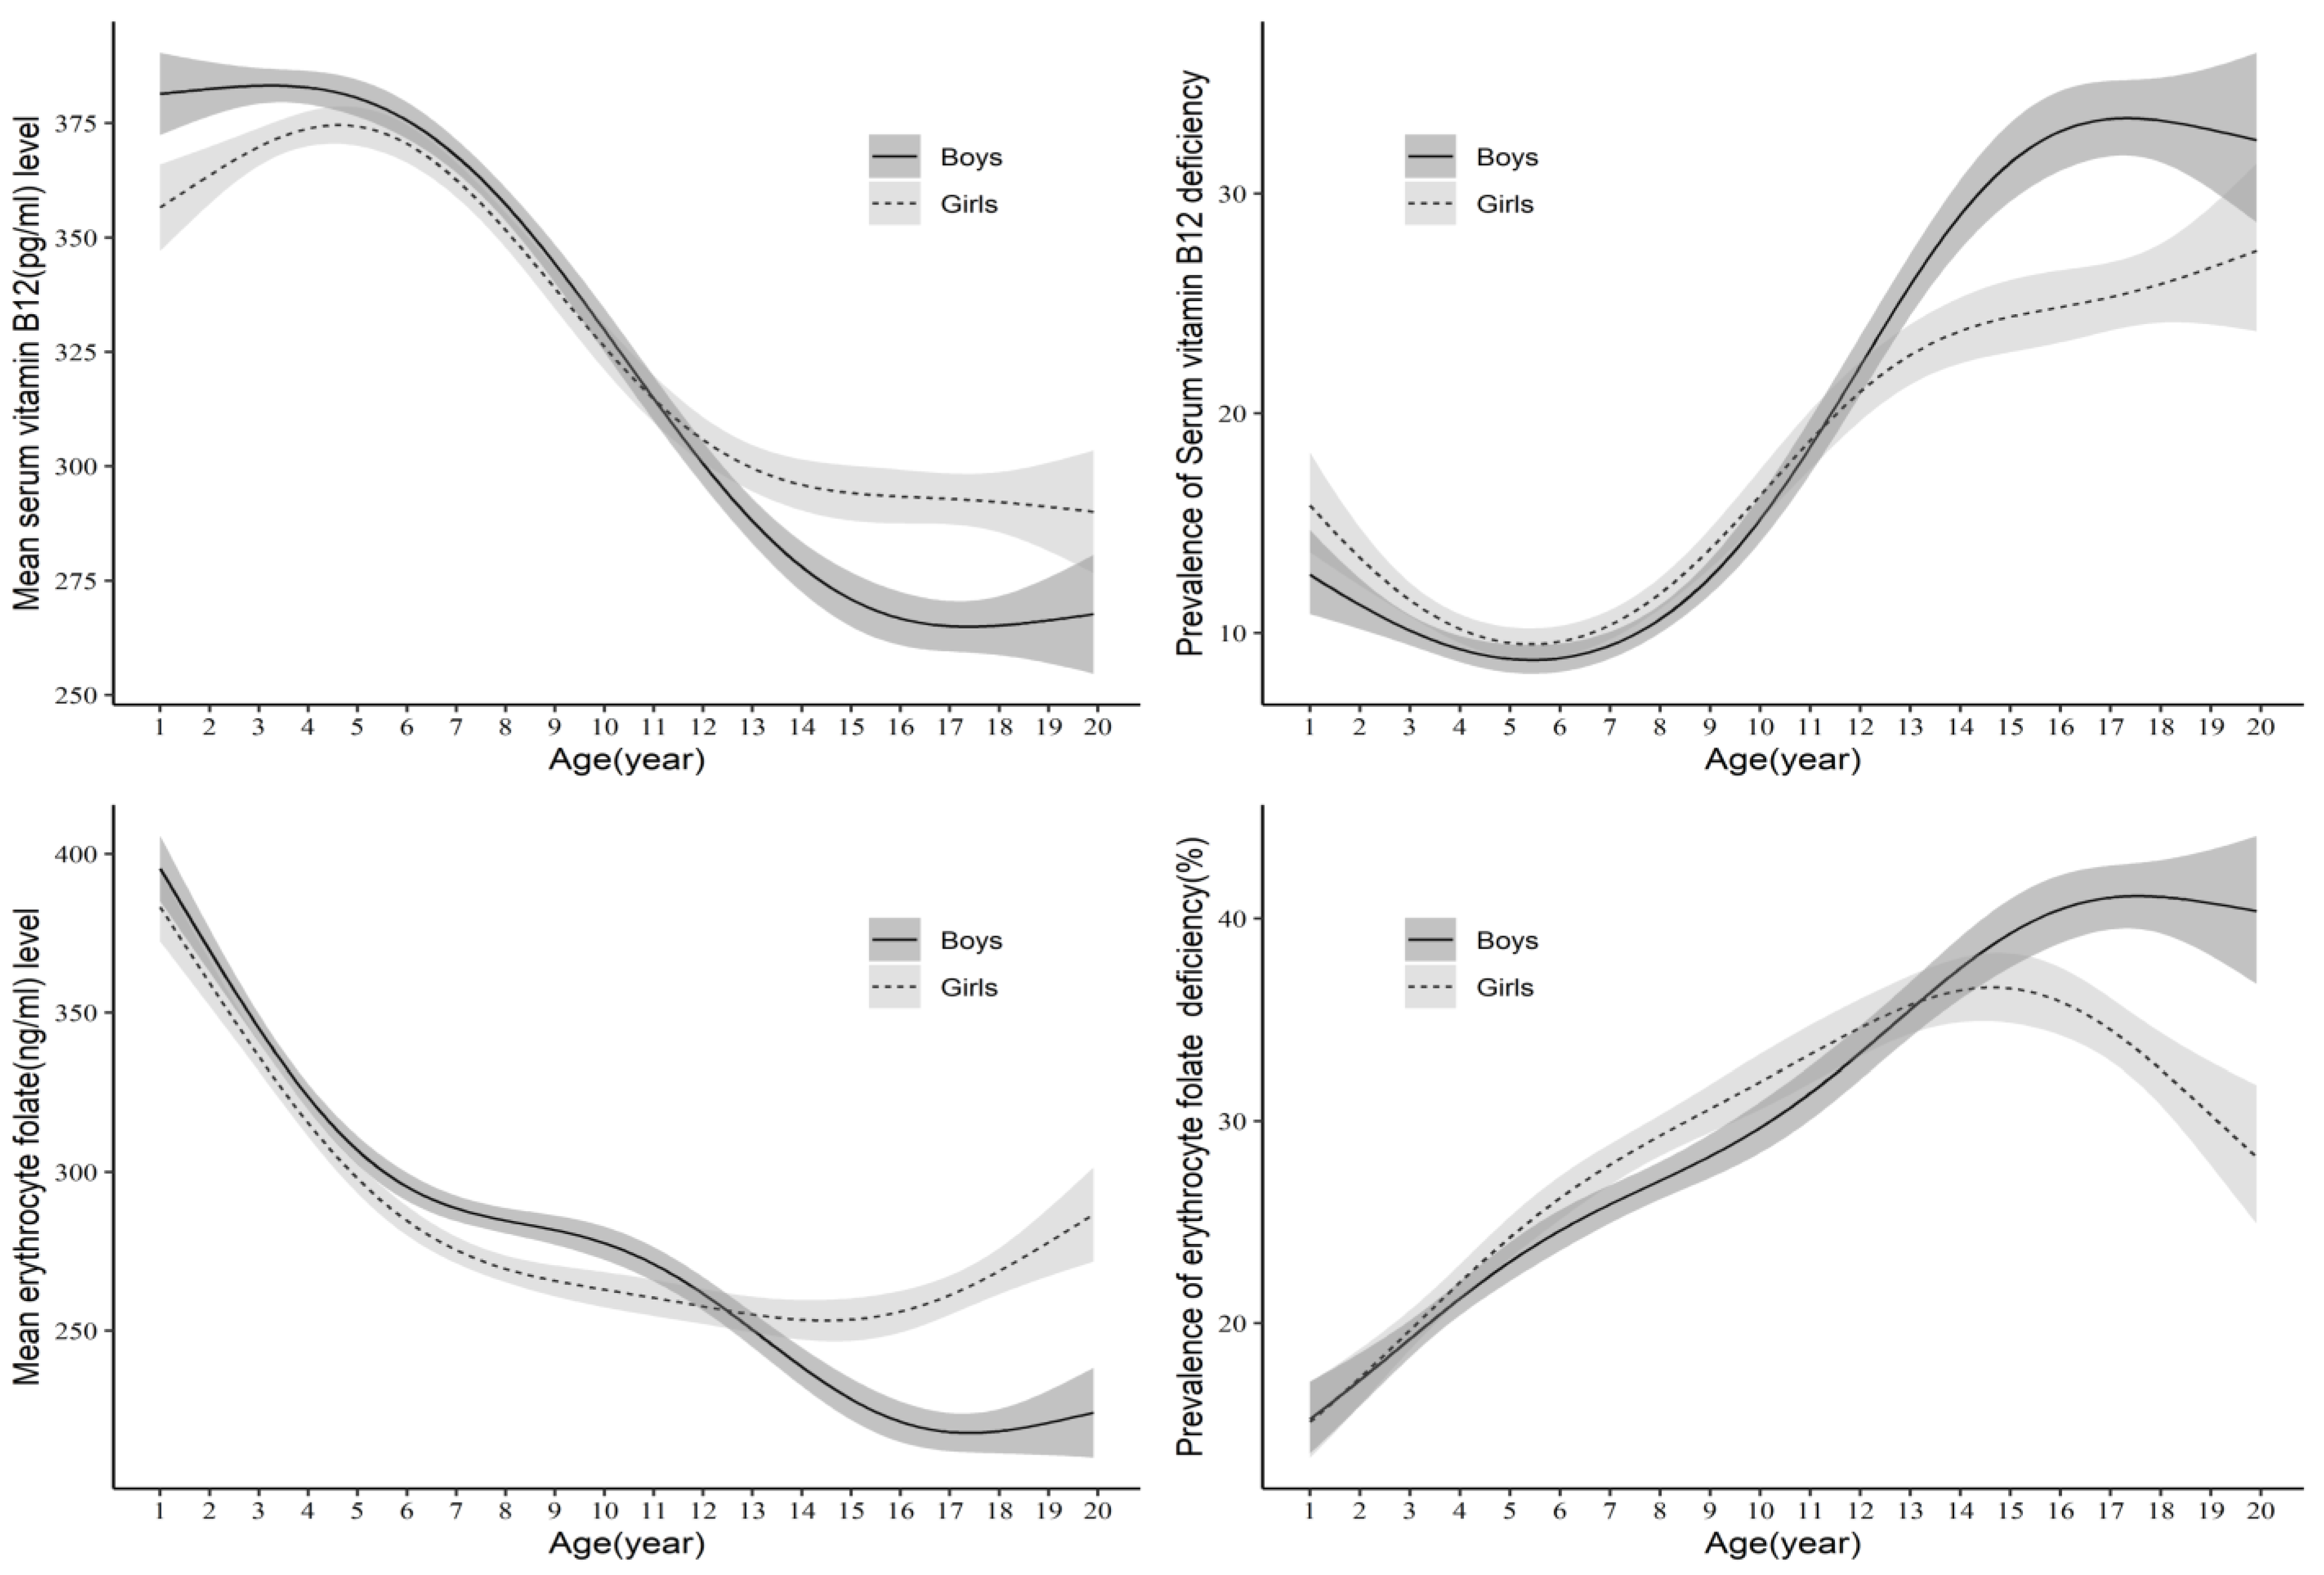
3.2. Serum B12 and Erythrocyte FA Concentration and Prevalence of B12 and FA Deficiency by Age and Sex

The GMs of serum B12 (pg/mL) and erythrocyte FA (ng/mL) concentration were significantly different among preschoolers, school-age children and adolescents (Table 2A,B). The national prevalence of B12 and FA deficiency was higher among adolescents (31.0%, CI: 28.7–33.5 and 35.6%, CI: 33.1–8.2) compared to school-age (17.3%, CI: 15.4–19.3 and 27.6%, CI: 25.5–29.9) and preschool children (13.8%, CI: 11.7–16.2 and 22.8%, CI: 20.5–25.2, respectively) (Table 2A,B). Though B12 and FA concentrations tended to decline with age (1–19 years) in both genders, the decline was significantly greater in adolescent boys compared to girls (Table 2A,B). As a consequence, the prevalence of B12 and FA deficiency increased with age (Figure 2), and adolescent boys had 8% higher B12 and 5% higher FA deficiency compared to girls (Table 2A,B).

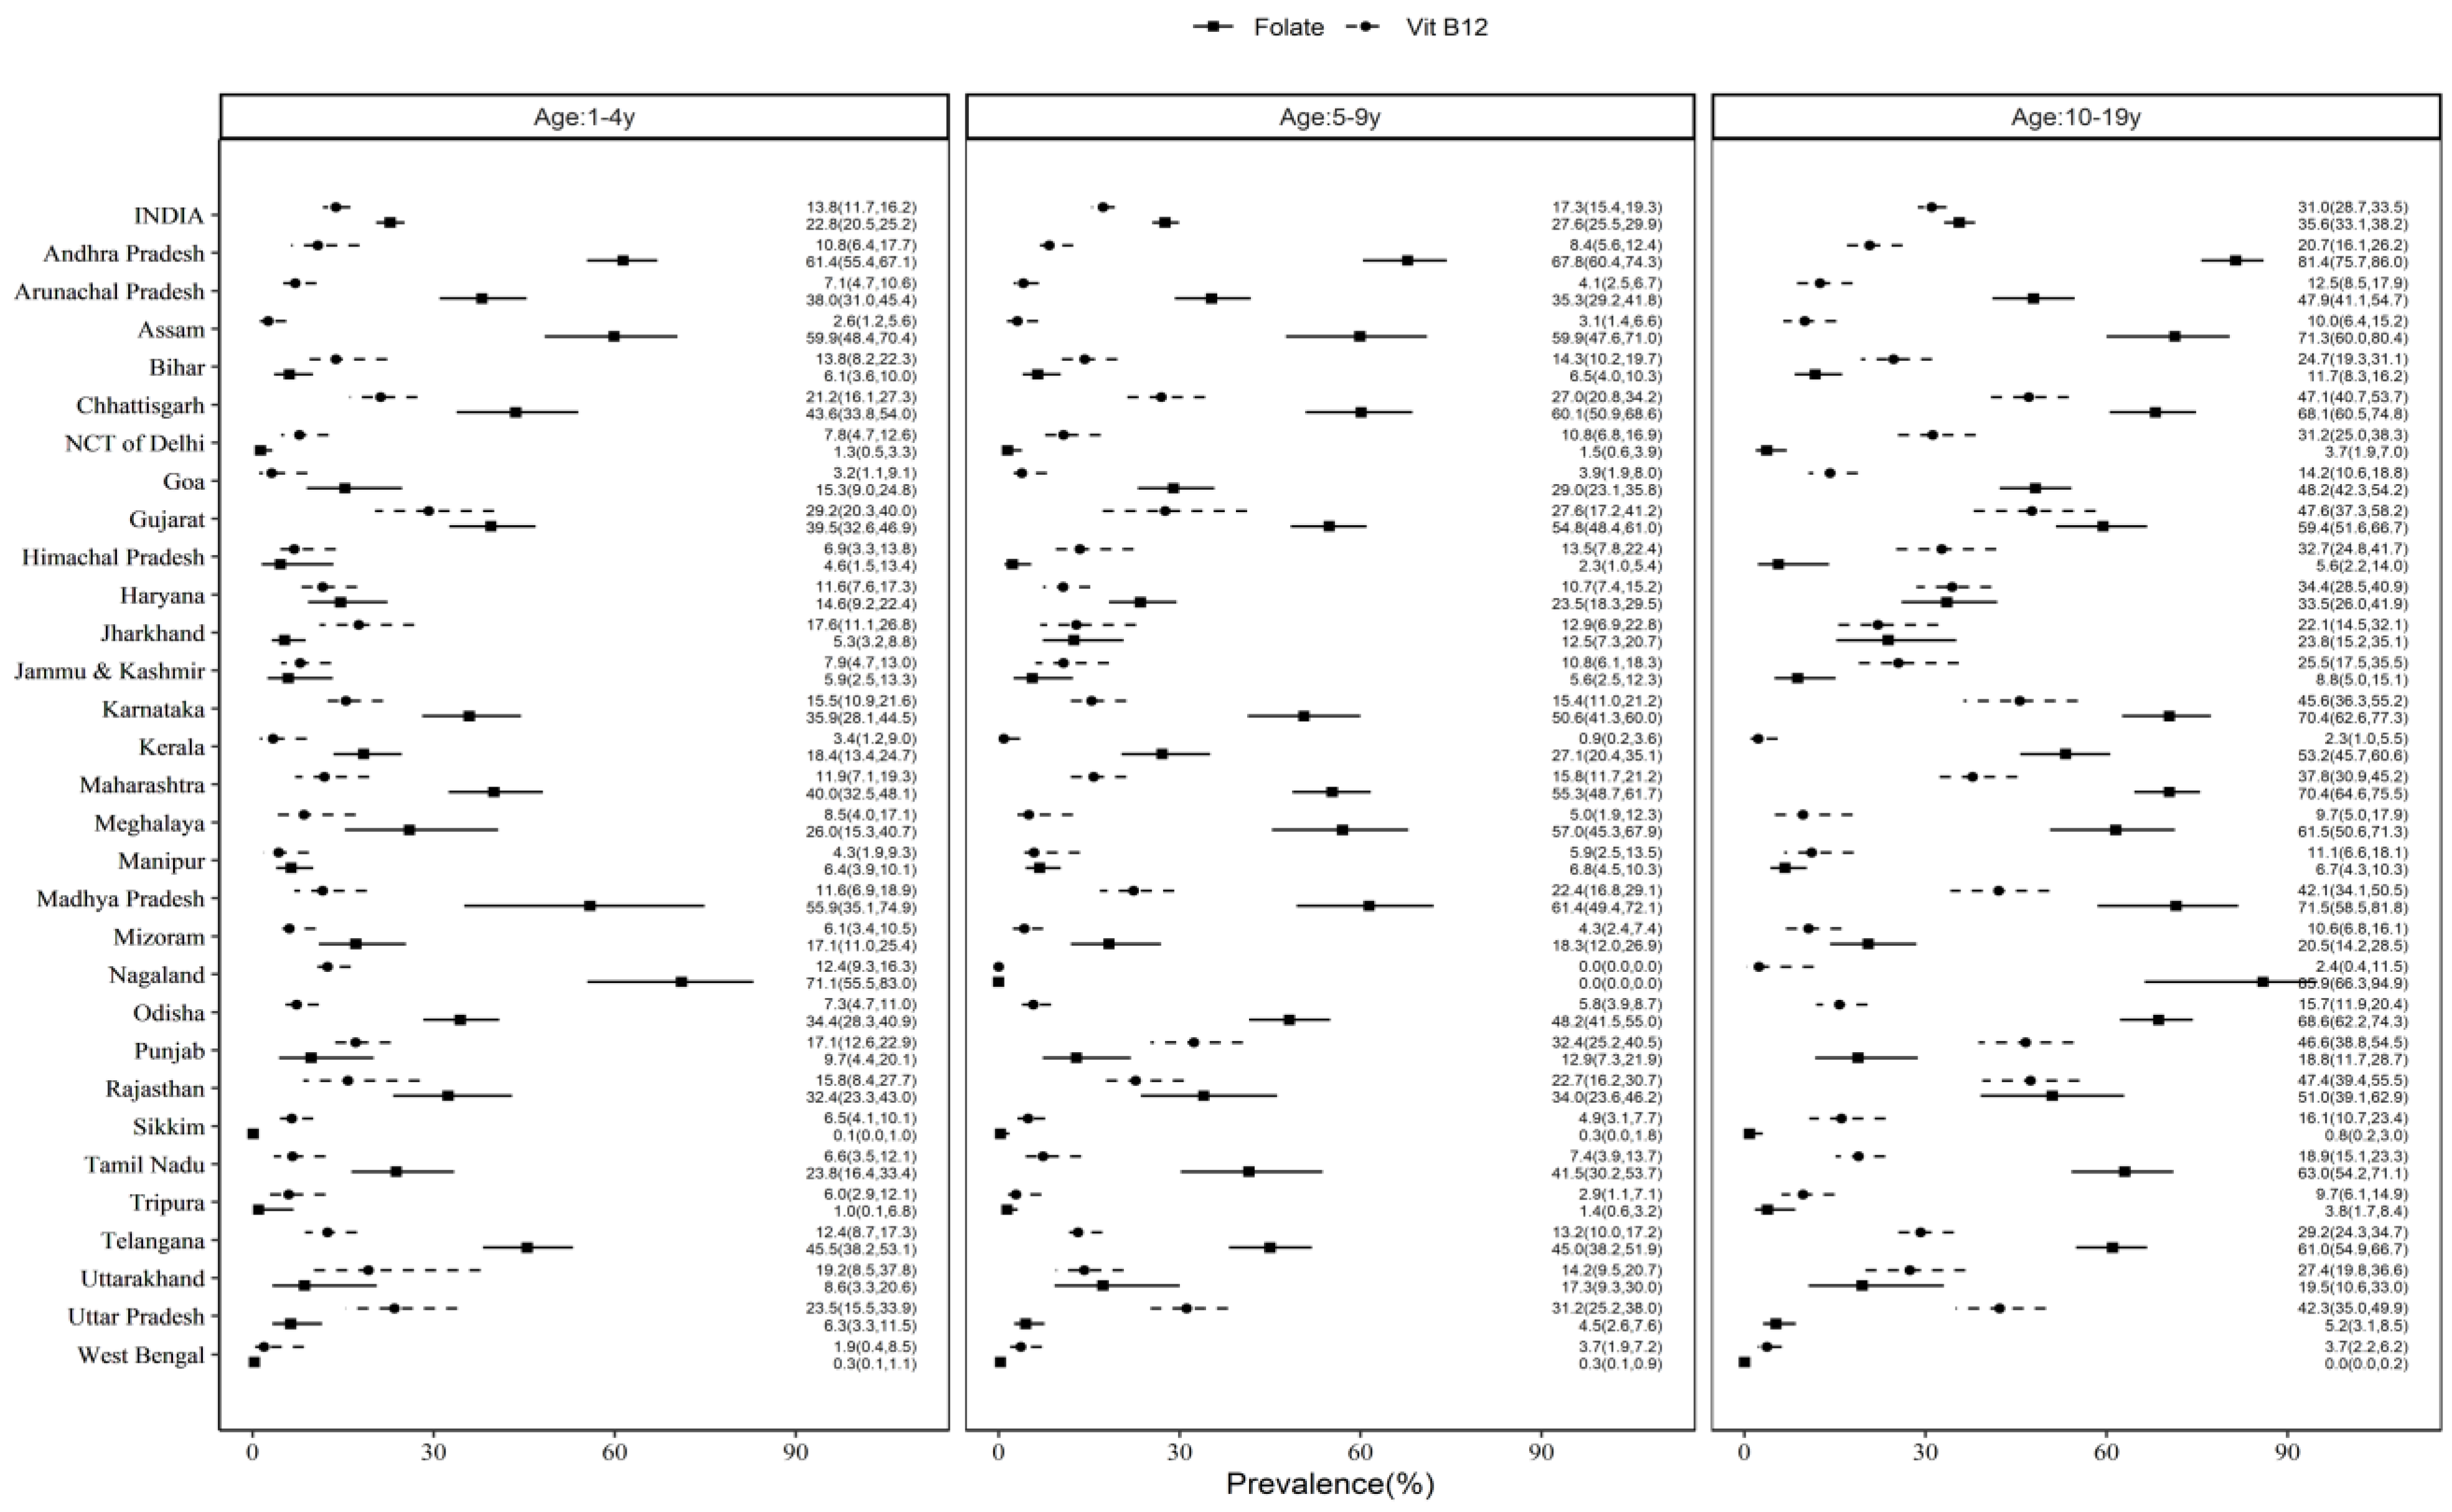
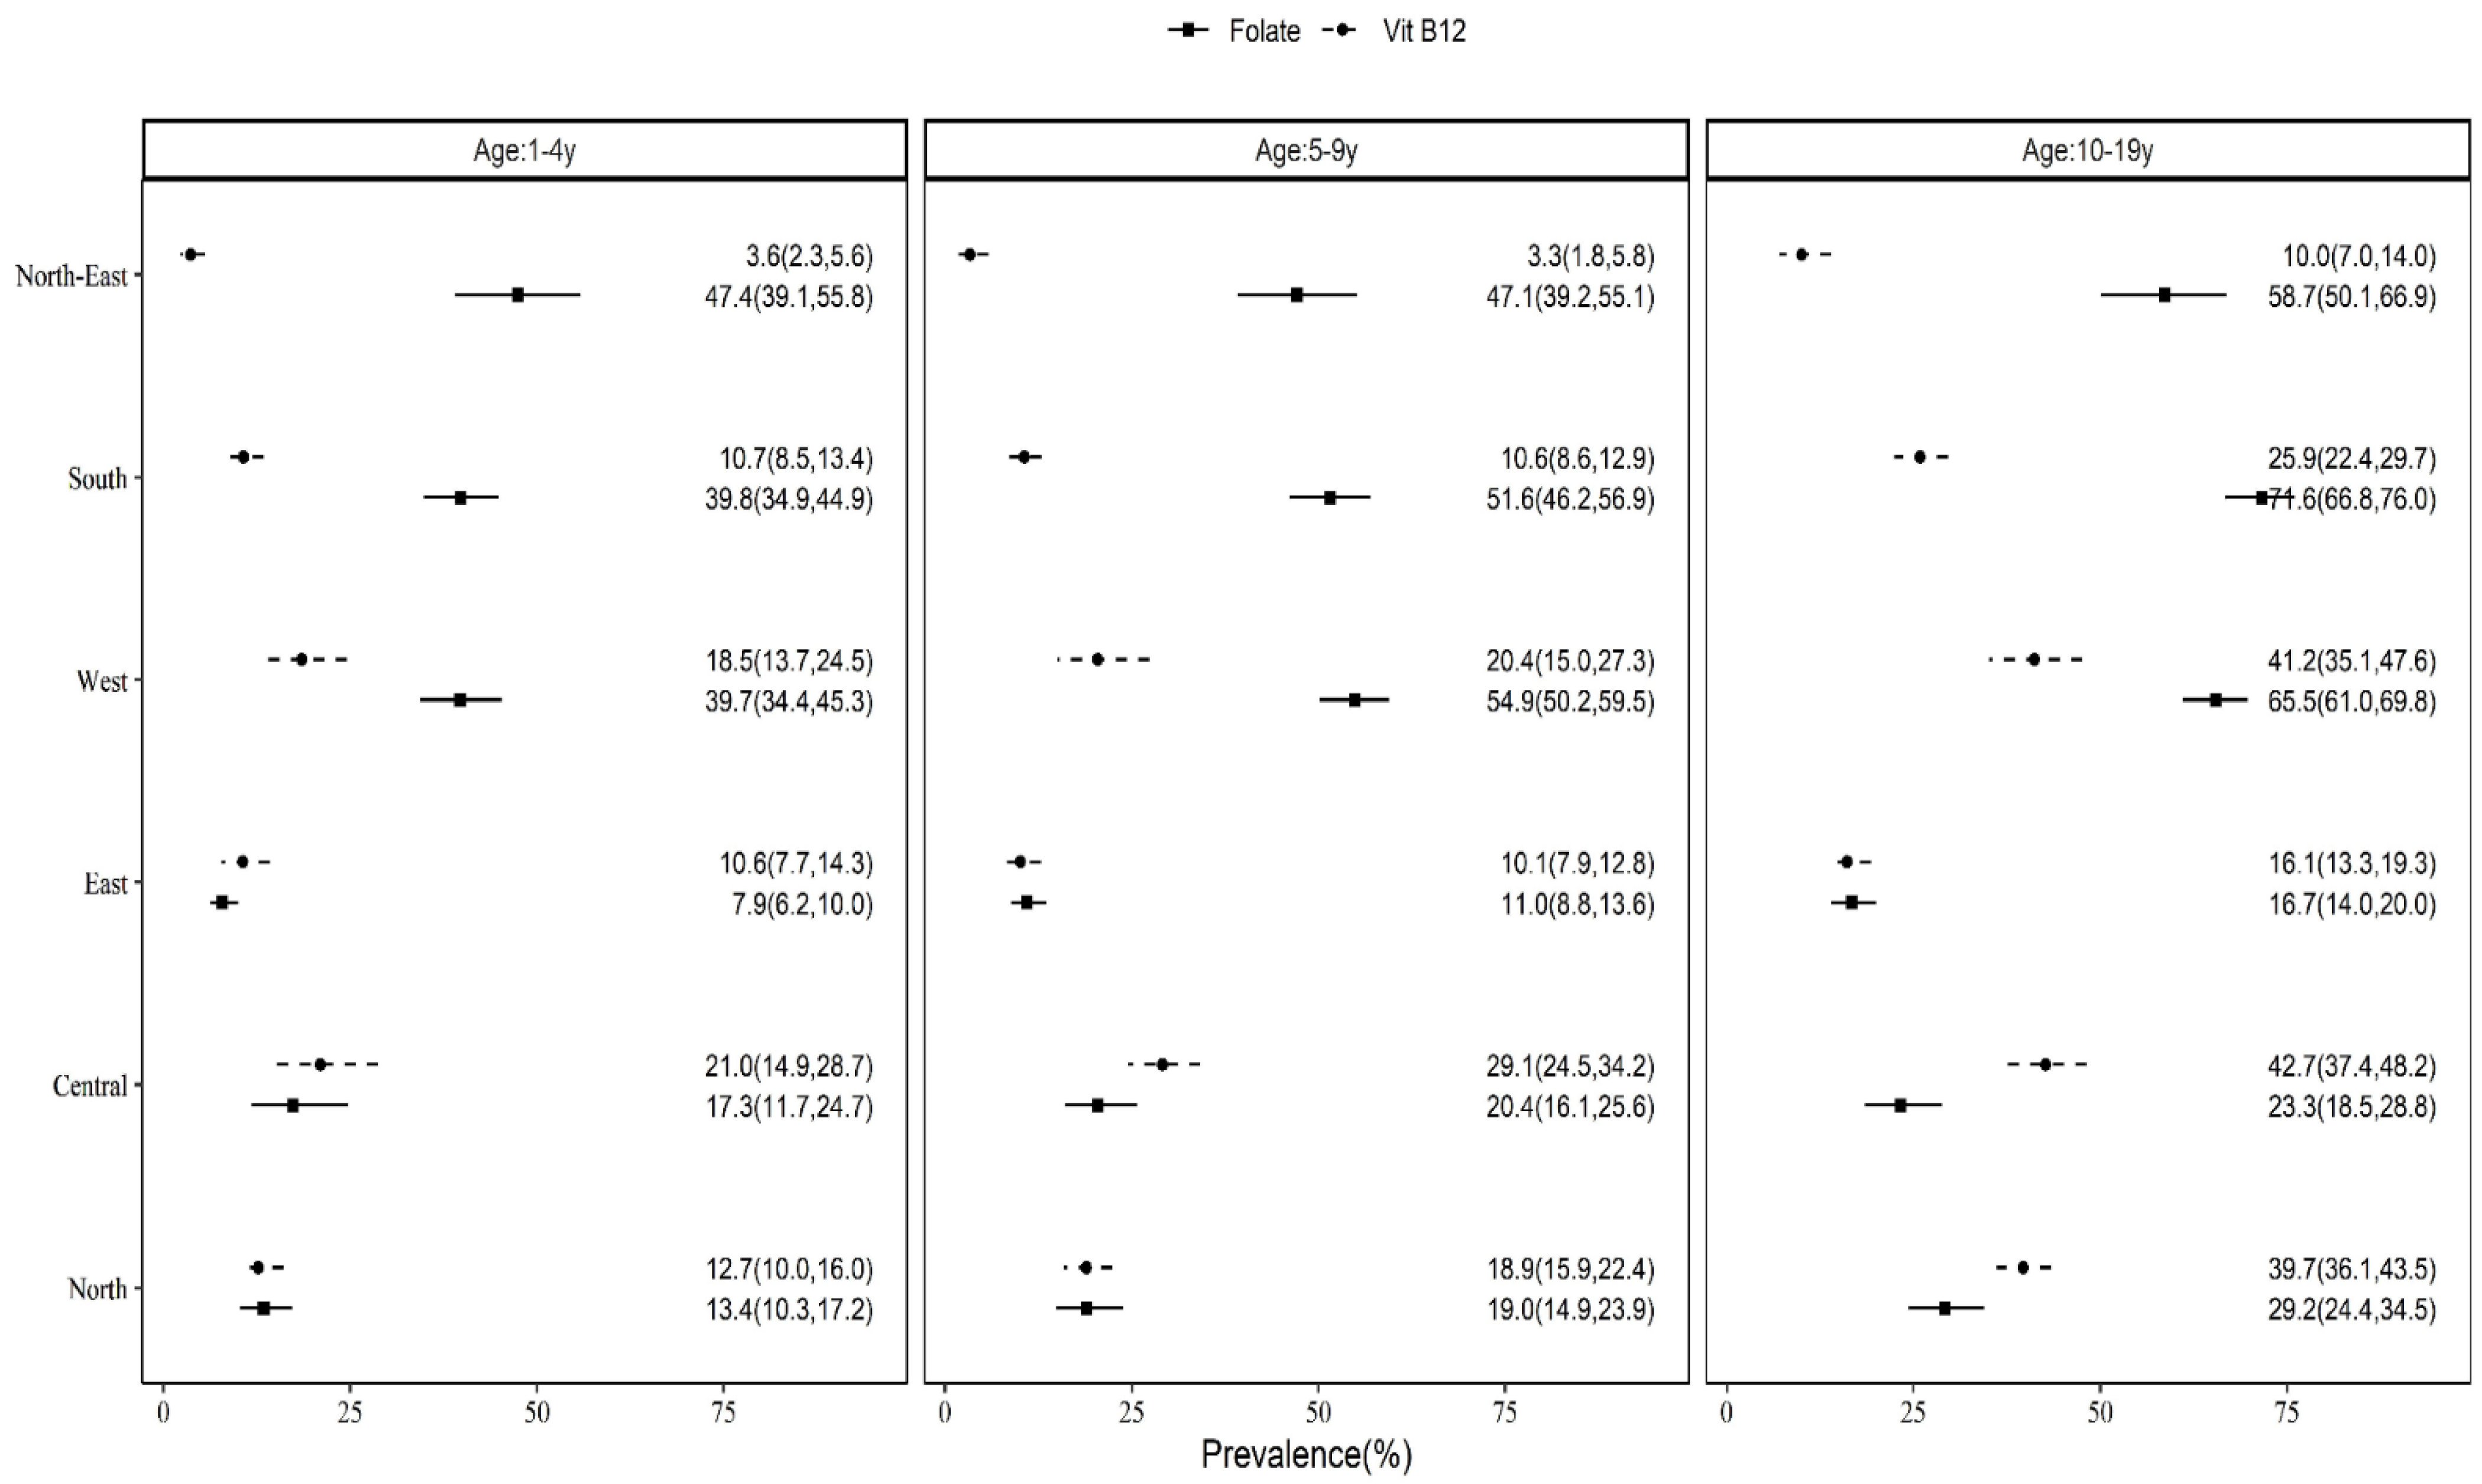
3.3. State-Based, Rural–Urban and Regional Differences in Prevalence of B12 and FA Deficiency

The point prevalence of B12 deficiency varied across states, being the highest in Gujarat (preschoolers—29.2%, CI: 20.3–40.0; adolescents—47.6%, CI: 37.3–58.2) and Punjab (school-age children—32.4%, CI: 25.2–40.5) and the lowest in West Bengal (preschoolers—1.9%, CI: 0.4–8.5) and Kerala (school-age children—0.9%, CI: 0.2–3.6; adolescents—2.3%, CI: 1.0–5.5) (Figure 3). Similarly, the point prevalence of FA deficiency was the highest in Nagaland (preschoolers—71.1%, CI: 55.5–83.0; adolescents—85.9%, CI: 63.3–94.9) and Andhra Pradesh (school-age children—67.8%, CI: 60.4–74.3) and the lowest in Sikkim for all age groups (0.1–0.8%) (Figure 3).
A significant positive relationship of B12 and FA deficiency prevalence between the age groups by state was noted (1–4 vs. 5–9 years: r = 0.888, p < 0.001 and r = 0.961, p < 0.001; 1–4 vs. 10–19 years: r = 0.747, p < 0.001 and r = 0.936, p < 0.001; 5–9 vs. 10–19 years: r = 0.938, p < 0.001 and r = 0.967, p < 0.001, respectively) (Figure S1A,B).
Further, there was wide regional variation in the prevalence of B12 and FA deficiency. While the prevalence of B12 deficiency was high in the central region across all the age groups (preschoolers—21.0%, CI: 14.9–28.7; school-age children—29.1%, CI: 24.5–34.2; adolescents—42.7%, CI: 37.4–48.2), the prevalence of FA deficiency was high in the northeast for preschoolers (47.4%, CI: 39.1–55.8), the west for school-age children (54.9%, CI: 50.2–59.5) and the south for adolescents (71.6%, CI: 66.8–76.0) (Figure 4). However, the B12 and FA prevalence was similar between rural and urban locations across all age groups (Table S2).

3.4. B12 and FA Deficiency by Sociodemographics, WASH Characteristics, Undernutrition and Morbidity

The prevalence of B12 deficiency was higher in school-age children of mothers who had lower education (Table S2). While no association was observed between B12 deficiency and WASH variables, the prevalence of FA deficiency was higher with unimproved drinking water among all the age groups (preschoolers: 35.8%, CI: 23.0–51.0, school-age children: 39.2%, CI: 30.4–48.8, adolescents: 54.7%, CI: 45.7–63.5). No association was observed between B12 deficiency and the wealth index across age groups. However, children and adolescents (5–19 years) from richer households (school-age children: 29.6%, CI: 26.6–32.8 and adolescents: 42.0%, CI: 37.2–47.0) had higher FA deficiency than those from poorer households (school-age children: 20.7%, CI: 15.4–27.1 and adolescents: 27.0%, CI: 21.6–33.2) (Table S2).
There was no association between anthropometric undernutrition and B12 and FA deficiency, except for a significantly lower prevalence of B12 deficiency among 5–9-year-old severely stunted children and 10–19-year-old severely wasted children (Table 3). Children with diarrhea (preschoolers: 14.9%, CI: 11.5–19.1 and school-age children: 20.2%, CI: 15.8–25.5) and fever (school-age children: 22.8%, CI: 19.6–26.4) in the two weeks preceding the survey had significantly lower FA deficiency than those without morbidity, while no association was found between B12 deficiency and morbidity (Table 3). Both serum B12 and erythrocyte FA concentrations were negatively associated with hemoglobin levels. In preschool-age children, FA deficiency was higher in those who did not receive the IFA supplement compared to those who had received it in the previous week (Table 4).

4. Discussion

This study provides the serum B12 and erythrocyte FA levels and their prevalence estimates in a representative sample of Indian children and adolescents at the national, state and regional levels. The prevalence of B12 deficiency was high among adolescents (31%), with ~50% lower prevalence in preschool (13.8%) and school-age (17.3%) children. Similarly, the prevalence of FA deficiency was also higher in adolescents (35.6%) compared to preschool (22.8%) and school-age (27.6%) children.
In the present study, the prevalence of B12 deficiency in children and adolescents was lower, while the prevalence of FA deficiency was almost similar to estimates from previous Indian and other studies [14,15,26,27,28]. However, except for the very recent study by Awasthi et al. [29], these previous studies had small sample sizes and were not nationally representative. Interestingly, a recent nationally representative study conducted soon after this CNNS study (2016–18) also reported almost similar trends of B12 deficiency, but FA deficiency was slightly lower. Further, similar to the findings reported in the present study, Awasthi et al. [29] also found a higher prevalence of B12 and FA deficiency with increased age, and more so in boys. However, this study is not state-representative and did not capture the regional differences and associated factors. While some nationally representative surveys in other countries have also demonstrated a low prevalence of B12 deficiency among 1–6-year-old children in Mexico (7.7%) [30] and school-aged children in Venezuela (11.4%) [31,32], a Guatemalan study reported the prevalence of B12 and FA deficiency to be 22.5% and 33.5%, respectively, among children aged 6–59 months [7]. In countries where animal foods constitute ~5–10% of the energy intake, the prevalence of B12 deficiency was high. For example, the prevalence of B12 deficiency was >70% in school children in Kenya [33] and 27% in preschoolers in New Delhi [14]. A study in Nepal revealed 41% B12 deficiency (serum B12 < 150 pmol/L) plus 16% depletion (150–200 pmol/L) in 6–35-month-old children with acute diarrhea [26]. Our recent studies among apparently healthy adults showed a high prevalence of B12 deficiency (~40%) that is associated with suboptimal dietary intakes [11,16].
The differences in the magnitude of the prevalence of deficiency among the reported studies, including the present study, might be multifactorial, including methodological issues. For example, in the case of FA, the data availability is complicated due to the large differences in the assay approaches (e.g., microbiological, immunoassay, and chromatography-based), analytes (e.g., total compared with major circulating types of folate) and antibodies used for immunoassay approaches, and because of the measurement of FA in serum or RBC. In addition, biomarkers such as serum methylmalonic acid (MMA) and Hcy could be more sensitive measures of B12 deficiency [34]. Serum holotranscobalamin concentration is an early marker with a better representation of the actual B12 status [35,36]. In a recent study in apparently healthy adults, we found a higher prevalence of B12 deficiency (46%) with holotranscobalamin compared to total B12 measurement (37%) [12].
Although deficiency of these vitamins can occur primarily as a result of insufficient dietary intake or malabsorption, various other factors such as gender, age and genetic, ethnic and sociocultural backgrounds are likely to influence their status [37]. Further, diets that are predominantly cereal-based and low in vegetables and fruits or animal-source food could contribute to the deficiency of these vitamins. The prevalence of B12 deficiency in the present study was higher in school-age children of mothers who had lower education. Similarly, the FA prevalence was higher among the participants with unimproved drinking water. However, intriguing trends were observed with a higher prevalence of FA deficiency in participants from higher socioeconomic status (SES) households (indicated by richer wealth quintiles than those from the lower SES. Nevertheless, a similar pattern of lower B12 deficiency in the low SES group was reported by a study on rural school children in Raigad, India [38].
Rural or urban residence represents an aggregate of multiple factors, with rural residents more likely to be from low SES households with poorer WASH facilities. Although the overall prevalence of B12 and FA deficiency was similar between urban and rural participants, significant regional differences were observed. The central region showed higher B12 prevalence across all age groups. Likewise, the state-wise prevalence of B12 and FA deficiency showed perplexing trends, with relatively richer states (in terms of per capita income as well consumption of milk and dairy products) such as Punjab and Gujarat showing higher prevalence. The inverse socioeconomic gradients of B12 and FA prevalence are difficult to explain and need further exploration.
Although the lower prevalence of B12 deficiency in severely stunted (5–9 years) and wasted (10–19 years) children is counter-intuitive, this could be a ramification of reduced metabolic requirements in the face of reduced growth and/or muscular activity. Further, in the frame of anemia, B12 and FA deficiency were earlier shown to be associated with 19–25% of anemia prevalence in children and adolescents in this survey [39]. In a more recent study on the same datasets, it was found that FA deficiency was negatively associated with anemia while vitamin B12 deficiency was not associated with anemia [40]. In addition to increased growth requirements in children and adolescents, chronic low intakes through predominantly vegetarian diets and poor absorption could induce the risk of these vitamin deficiencies [41].
Adolescent boys had a higher prevalence of B12 deficiency compared to girls, which is in line with a previous study in Venezuela, where the B12 deficiency prevalence was higher in adolescents compared to infants and children [31]. Similarly, other studies in adult population showed a higher prevalence of vitamin B12 deficiency in males compared to females, commensurate with higher Hcy in males [11,12,16]. A higher prevalence of vitamin B12 deficiency among boys may be explained by a higher requirement for micronutrients to sustain rapid muscular growth during adolescence as compared to girls. Furthermore, in a separate regional study, dietary vitamin B12 intake was lower among boys compared to girls [17]. The inverse relation between male sex or age with vitamin B12 status could be interpreted in light of greater requirements for more rapid growth in boys than girls and in older than younger children that are not being met with adequate dietary intake. At least in Colombia, older children were shown to be less likely to adhere to an animal protein intake pattern, which supports this possibility [42], whereas an Indian study found that rural youth with the lowest plasma vitamin B12 levels infrequently or never consumed dairy products/non-vegetarian foods [43].
The strengths of our study include a large sample, representative at regional, state and national levels, covering a wide range of age (1–19 years), and the estimates provided of the prevalence of B12 and FA deficiency. The important limitations include smaller sample sizes in some of the states and a lower proportion of 1–2-year-old children in the study sample, which may have resulted in the underestimation of B12 and FA deficiency prevalence in the 1–4-year-old age group. Another limitation pertains to the lack of data on other more sensitive biomarkers of B12 deficiency such as MMA, Hcy and holotranscobalamin.

5. Conclusions

Our study bridges a critical information gap on the prevalence of B12 and FA deficiency in Indian children and adolescents and demonstrates that about a third of adolescent boys are likely to be deficient in B12 and FA. The prevalence of these deficiencies, however, is lower in younger age groups. These findings are important to inform nutrition policy in India. More consistent use of thresholds to define deficiency is needed in order to assess the realistic public health significance of FA and B12 deficiency.

Supplementary Materials

The following supporting information can be downloaded at: https://www.mdpi.com/article/10.3390/nu15133026/s1, Table S1: Comparison of characteristics of the study (vitamin B12 and folate) sample with the total survey sample; Table S2: Prevalence of vitamin B12 and folate deficiency in children and adolescents by sociodemographic and WASH variables; Figure S1A: Association between the vitamin B12 deficiency prevalence by state across all the age groups (A) 1–4 years vs. 5–9 years (B) 1–4 years vs. 10–19 years and (C) 5–9 years vs. 10–19 years; Figure S1B: Association between the folate deficiency prevalence by state across all the age groups (A) 1–4 years vs. 5–9 years (B) 1–4 years vs. 10–19 years and (C) 5–9 years vs. 10–19 years.

Author Contributions

T.S., R.P., S.G., B.K., H.R., H.S.S., A.V.K. and G.B.R. performed initial statistical analyses on the CNNS data; further comments and iterations involved all authors. T.S., R.P., H.S.S., A.V.K. and G.B.R. wrote and edited the manuscript, and all authors were involved in every iteration of all analyses and approved the final manuscript. All authors have read and agreed to the published version of the manuscript.

Funding

The Comprehensive National Nutrition Survey (CNNS-2016-18) was conducted by the Ministry of Health and Family Welfare, Government of India, and UNICEF, with support from the Mittal Foundation.

Institutional Review Board Statement

The CNNS was conducted after obtaining due international ethical approval from the Population Council’s International Review Board, New York, USA, and national ethical approval from the Post-Graduate Institute of Medical Education and Research, Chandigarh, India (IEC # PGI/IEC/2015/1508) [17].

Informed Consent Statement

Informed consent from the parents/caregivers of children under 10 years, informed consent of parents/caregivers of adolescents (11–17 years old) as well as the latter’s agreement, and informed consent of adolescents above 17 years old were obtained.

Data Availability Statement

The data that support the findings of this study are available from the Ministry of Health and Family Welfare (MoHFW), Government of India, but restrictions apply to the availability of these data, which were used under license for the current study, and so are not publicly available. Data are, however, available from the authors upon reasonable request and with permission of MoHFW.

Conflicts of Interest

H.S.S. designed the draft protocol of the CNNS with consultancy support from UNICEF India. H.S.S. and A.V.K. were members of the Technical Advisory Committee of the CNNS, constituted by the Ministry of Health and Family Welfare of the Government of India, to oversee its conduct and analysis. S.G. has consultancy support for statistical analyses from UNICEF India. There are no other conflicts to declare. The views expressed here by the authors are their own and not of the institutions the authors belong to.

Abbreviations

CNNS: Comprehensive National Nutrition Survey; CRP: C-reactive protein; SES: socioeconomic status; WASH: water, sanitation and hygiene; IFA: iron–folic acid; NFHS: National Family Health Survey; BMI: body mass index; HAZ: height-for-age; WHZ: weight-for-height; WAZ: weight-for-age.

References

  1. Lyon, P.; Strippoli, V.; Fang, B.; Cimmino, L. B Vitamins and One-Carbon Metabolism: Implications in Human Health and Disease. Nutrients 2020, 12, 2867. [Google Scholar] [CrossRef] [PubMed]
  2. Stover, P.J. Physiology of folate and vitamin B12 in health and disease. Nutr. Rev. 2004, 62 Pt 2, S3–S12; discussion S13. [Google Scholar] [CrossRef] [PubMed]
  3. Allen, L.H.; Miller, J.W.; Groot, L.D.; Rosenberg, I.H.; Smith, A.D.; Refsum, H.; Raiten, D.J. Biomarkers of Nutrition for Development (BOND): Vitamin B-12 Review. J. Nutr. 2018, 148 (Suppl. S4), 1995S–2027S. [Google Scholar] [CrossRef] [PubMed] [Green Version]
  4. Bailey, L.B.; Stover, P.J.; McNulty, H.; Fenech, M.F.; Gregory, J.F., III; Mills, J.L.; Pfeiffer, C.M.; Fazili, Z.; Zhang, M.; Ueland, P.M.; et al. Biomarkers of Nutrition for Development-Folate Review. J. Nutr. 2015, 145, 1636S–1680S. [Google Scholar] [CrossRef] [Green Version]
  5. Dwarkanath, P.; Barzilay, J.R.; Thomas, T.; Thomas, A.; Bhat, S.; Kurpad, A.V. High folate and low vitamin B-12 intakes during pregnancy are associated with small-for-gestational age infants in South Indian women: A prospective observational cohort study. Am. J. Clin. Nutr. 2013, 98, 1450–1458. [Google Scholar] [CrossRef] [Green Version]
  6. Puri, M.; Kaur, L.; Walia, G.K.; Mukhopadhhyay, R.; Sachdeva, M.P.; Trivedi, S.S.; Ghosh, P.K.; Saraswathy, K.N. MTHFR C677T polymorphism, folate, vitamin B12 and homocysteine in recurrent pregnancy losses: A case control study among North Indian women. J. Perinat. Med. 2013, 41, 549–554. [Google Scholar] [CrossRef]
  7. Wong, E.; Molina-Cruz, R.; Rose, C.; Bailey, L.; Kauwell, G.P.A.; Rosenthal, J. Prevalence and Disparities in Folate and Vitamin B12 Deficiency Among Preschool Children in Guatemala. Matern. Child Health J. 2022, 26, 156–167. [Google Scholar] [CrossRef]
  8. Veena, S.R.; Krishnaveni, G.V.; Srinivasan, K.; Wills, A.K.; Muthayya, S.; Kurpad, A.V.; Yajnik, C.S.; Fall, C.H.D. Higher maternal plasma folate but not vitamin B-12 concentrations during pregnancy are associated with better cognitive function scores in 9- to 10- year-old children in South India. J. Nutr. 2010, 140, 1014–1022. [Google Scholar] [CrossRef] [Green Version]
  9. Sachdev, H.S.; Porwal, A.; Sarna, A.; Acharya, R.; Ramesh, S.; Kapil, U.; Kurpad, A.V. Intraindividual double-burden of anthropometric undernutrition and metabolic obesity in Indian children: A paradox that needs action. Eur. J. Clin. Nutr. 2021, 75, 1205–1217. [Google Scholar] [CrossRef]
  10. Gadgil, M.; Joshi, K.; Pandit, A.; Otiv, S.; Joshi, R.; Brenna, J.T.; Patwardhan, B. Imbalance of folic acid and vitamin B12 is associated with birth outcome: An Indian pregnant women study. Eur. J. Clin. Nutr. 2014, 68, 726–729. [Google Scholar] [CrossRef]
  11. Sivaprasad, M.; Shalini, T.; Balakrishna, N.; Sudarshan, M.; Lopamudra, P.; Suryanarayana, P.; Arlappa, N.; Ravikumar, B.P.; Radhika, M.S.; Reddy, G.B. Status of Vitamin B12 and Folate among the Urban Adult Population in South India. Ann. Nutr. Metab. 2016, 68, 94–102. [Google Scholar] [CrossRef]
  12. Sivaprasad, M.; Shalini, T.; Reddy, P.Y.; Seshacharyulu, M.; Madhavi, G.; Kumar, B.N.; Reddy, G.B. Prevalence of vitamin deficiencies in an apparently healthy urban adult population: Assessed by subclinical status and dietary intakes. Nutrition 2019, 63–64, 106–113. [Google Scholar] [CrossRef]
  13. Yajnik, C.S.; Deshpande, S.S.; Jackson, A.A.; Refsum, H.; Rao, S.; Fisher, D.J.; Bhat, D.S.; Naik, S.S.; Coyaji, K.J.; Joglekar, C.V.; et al. Vitamin B12 and folate concentrations during pregnancy and insulin resistance in the offspring: The Pune Maternal Nutrition Study. Diabetologia 2008, 51, 29–38. [Google Scholar] [CrossRef] [Green Version]
  14. Strand, T.A.; Taneja, S.; Ueland, P.M.; Refsum, H.; Bahl, R.; Schneede, J.; Sommerfelt, H.; Bhandari, N. Cobalamin and folate status predicts mental development scores in North Indian children 12-18 mo of age. Am. J. Clin. Nutr. 2013, 97, 310–317. [Google Scholar] [CrossRef] [Green Version]
  15. Kapil, U.; Sareen, N. Prevalence of ferritin, folate and vitamin B12 deficiencies amongst children in 5–18 years of age in Delhi. Indian J. Pediatr. 2014, 8, 312. [Google Scholar] [CrossRef] [Green Version]
  16. Shalini, T.; Sivaprasad, M.; Balakrishna, N.; Madhavi, G.; Radhika, M.S.; Boiroju, N.K.; Pullakhandam, R.; Reddy, G.B. Micronutrient intakes and status assessed by probability approach among the urban adult population of Hyderabad city in South India. Eur. J. Nutr. 2019, 58, 3147–3159. [Google Scholar] [CrossRef]
  17. Chakraborty, S.; Chopra, M.; Mani, K.; Giri, A.K.; Banerjee, P.; Sahni, N.S.; Siddhu, A.; Tandon, N.; Bharadwaj, D. Prevalence of vitamin B12 deficiency in healthy Indian school-going adolescents from rural and urban localities and its relationship with various anthropometric indices: A cross-sectional study. J. Hum. Nutr. Diet. 2018, 31, 513–522. [Google Scholar] [CrossRef]
  18. Comprehensive National Nutrition Survey (CNNS). National Report, Ministry of Health and Family Welfare (MoHFW); Government of India: New Delhi, India, 2019.
  19. International Institute for Population Sciences (IIPS) and ICF. National Family Health Survey (NFHS-4) 2015–2016; IIPS: Mumbai, India, 2017. [Google Scholar]
  20. World Health Organization (WHO)/United Nations International Children’s Emergency Fund (UNICEF). Joint Monitoring Programme (JMP) for Water Supply, Sanitation and Hygiene, JMP Methodology. Update & SDG Baselines. 2018. Available online: https://washdata.org/sites/default/files/documents/reports/2018-04/JMP-2017-update-methodology.pdf (accessed on 3 March 2021).
  21. World Health Organization (WHO). World Health Organization Child Growth Standards: Length/Height-for-Age, Weight-for-Age, Weight-for-Length, Weight-for-Height and Body Mass Index-for-Age: Methods and Development; WHO: Geneva, Switzerland, 2006. [Google Scholar]
  22. Sachdev, H.S.; Porwal, A.; Acharya, R.; Ashraf, S.; Ramesh, S.; Khan, N.; Kapil, U.; Kurpad, A.V.; Sarna, A. Haemoglobin thresholds to define anaemia in a national sample of healthy children and adolescents aged 1–19 years in India: A population-based study. Lancet. Glob. Health 2021, 9, e822–e831. [Google Scholar] [CrossRef]
  23. de Benoist, B. Conclusions of a WHO Technical Consultation on folate and vitamin B12 deficiencies. Food. Nutr. Bull. 2008, 29 (Suppl. 2), S238–S244. [Google Scholar] [CrossRef]
  24. World Health Organisation (WHO). Haemoglobin Concentrations for the Diagnosis of Anaemia and Assessment of Severity; WHO: Geneva, Switzerland, 2011; Available online: https://apps.who.int/iris/bitstream/handle/10665/85839/WHO_NMH_NHD_MNM_11.1_eng.pdf?ua=1 (accessed on 3 March 2021).
  25. Young, M.F.; Guo, J.; Williams, A.; Whitfield, K.C.; Nasrin, S.; Kancherla, V.; Suchdev, P.S.; Crider, K.S.; Pfeiffer, C.M.; Serdula, M. Interpretation of vitamin B-12 and folate concentrations in population-based surveys does not require adjustment for inflammation: Biomarkers Reflecting Inflammation and Nutritional Determinants of Anemia (BRINDA) project. Am. J. Clin. Nutr. 2020, 111, 919–926. [Google Scholar] [CrossRef] [Green Version]
  26. Ulak, M.; Chandyo, R.K.; Adhikari, R.K.; Sharma, P.R.; Sommerfelt, H.; Refsum, H.; Strand, T.A. Cobalamin and folate status in 6 to 35 months old children presenting with acute diarrhea in Bhaktapur, Nepal. PLoS ONE 2014, 9, e90079. [Google Scholar] [CrossRef] [Green Version]
  27. Shahab-Ferdows, S.; Engle-Stone, R.; Hampel, D.; Ndjebayi, A.O.; Nankap, M.; Brown, K.H.; Allen, L.H. Regional, Socioeconomic, and Dietary Risk Factors for Vitamin B-12 Deficiency Differ from Those for Folate Deficiency in Cameroonian Women and Children. J. Nutr. 2015, 145, 2587–2595. [Google Scholar] [CrossRef] [PubMed] [Green Version]
  28. Ng’eno, B.N.; Perrine, C.G.; Whitehead, R.D.; Subedi, G.R.; Mebrahtu, S.; Dahal, P.; Jefferds, M.E.D. High Prevalence of Vitamin B12 Deficiency and No Folate Deficiency in Young Children in Nepal. Nutrients 2017, 9, 72. [Google Scholar] [CrossRef] [PubMed] [Green Version]
  29. Awasthi, S.; Kumar, D.; Mahdi, A.A.; Agarwal, G.G.; Pandey, A.K.; Parveen, H.; Singh, S.; Awasthi, R.; Pande, H.; Anish, T.S.; et al. Prevalence of specific micronutrient deficiencies in urban school going children and adolescence of India: A multicenter cross-sectional study. PLoS ONE 2022, 17, e0267003. [Google Scholar] [CrossRef] [PubMed]
  30. Cuevas-Nasu, L.; Mundo-Rosas, V.; Shamah-Levy, T.; Méndez-Gómez Humaran, I.; Avila-Arcos, M.A.; Rebollar-Campos, M.R.; Villalpando, S. Prevalence of folate and vitamin B12 deficiency in Mexican children aged 1 to 6 years in a population-based survey. Salud. Publica Mex. 2012, 54, 116–124. [Google Scholar] [CrossRef] [Green Version]
  31. Garcia-Casal, M.N.; Osorio, C.; Landaeta, M.; Leets, I.; Matus, P.; Fazzino, F.; Marcos, E. High prevalence of folic acid and vitamin B12 deficiencies in infants, children, adolescents and pregnant women in Venezuela. Eur. J. Clin. Nutr. 2005, 59, 1064–1070. [Google Scholar] [CrossRef]
  32. McLean, E.; de Benoist, B.; Allen, L.H. Review of the magnitude of folate and vitamin B12 deficiencies worldwide. Food Nutr. Bull. 2008, 29 (Suppl. S2), S38–S51. [Google Scholar] [CrossRef]
  33. Siekmann, J.H.; Allen, L.H.; Bwibo, N.O.; Demment, M.W.; Murphy, S.P.; Neumann, C.G. Kenyan school children have multiple micronutrient deficiencies, but increased plasma vitamin B-12 is the only detectable micronutrient response to meat or milk supplementation. J. Nutr. 2003, 133 (Suppl. S2), 3972S–3980S. [Google Scholar] [CrossRef] [Green Version]
  34. Herrmann, W.; Obeid, R. Causes and early diagnosis of vitamin B12 deficiency. Dtsch. Arztebl. Int. 2008, 105, 680–685. [Google Scholar] [CrossRef]
  35. Hvas, A.M.; Nexo, E. Holotranscobalamin—A first choice assay for diagnosing early vitamin B deficiency? J. Intern. Med. 2005, 257, 289–298. [Google Scholar] [CrossRef]
  36. Nexo, E.; Hoffmann-Lucke, E. Holotranscobalamin, a marker of vitamin B-12 status: Analytical aspects and clinical utility. Am. J. Clin. Nutr. 2011, 94, 359S–365S. [Google Scholar] [CrossRef] [Green Version]
  37. Green, R.; Allen, L.H.; Bjørke-Monsen, A.L.; Brito, A.; Guéant, J.L.; Miller, J.W.; Molloy, A.M.; Nexo, E.; Stabler, S.; Toh, B.H.; et al. Vitamin B12 deficiency. Nat. Rev. Dis. Primers 2017, 3, 17040. [Google Scholar] [CrossRef]
  38. Bawaskar, H.S.; Bawaksar, P.H. Profile of Vitamin B12 and Vitamin D in Rural School children in Raigad, India. Indian Pediatr. 2020, 57, 871. [Google Scholar] [CrossRef]
  39. Sarna, A.; Porwal, A.; Ramesh, S.; Agrawal, P.K.; Acharya, R.; Johnston, R.; Khan, N.; Sachdev, H.P.S.; Madhavan Nair, K.; Ramakrishnan, L.; et al. Characterisation of the types of anaemia prevalent among children and adolescents aged 1-19 years in India: A population-based study. Lancet Child Adolesc. Health 2020, 4, 515–525. [Google Scholar] [CrossRef]
  40. Scott, S.; Lahiri, A.; Sethi, V.; de Wagt, A.; Menon, P.; Yadav, K.; Varghese, M.; Joe, W.; Vir, S.C.; Nguyen, P.H. Anaemia in Indians aged 10-19 years: Prevalence, burden and associated factors at national and regional levels. Matern. Child Nutr. 2022, 18, e13391. [Google Scholar] [CrossRef]
  41. Oussalah, A.; Levy, J.; Berthezène, C.; Alpers, D.H.; Guéant, J.L. Health outcomes associated with vegetarian diets: An umbrella review of systematic reviews and meta-analyses. Clin. Nutr. 2020, 39, 3283–3307. [Google Scholar] [CrossRef]
  42. Villamor, E.; Mora-Plazas, M.; Forero, Y.; Lopez-Arana, S.; Baylin, A. Vitamin B-12 status is associated with socioeconomic level and adherence to an animal food dietary pattern in Colombian school children. J. Nutr. 2008, 138, 1391–1398. [Google Scholar] [CrossRef] [Green Version]
  43. Ganpule-Rao, A.V.; Bhat, D.; Yajnik, C.S.; Rush, E. Dietary diversity scores, nutrient intakes and biomarkers vitamin B12, folate and Hb in rural youth from the Pune Maternal Nutrition Study. Br. J. Nutr. 2021, 126, 236–243. [Google Scholar] [CrossRef]
Figure 1. Flow chart for the recruitment of participants in the CNNS survey and the selection of samples for vitamin B12 and folate analyses.
Nutrients 15 03026 g001
Figure 2. Serum vitamin B12 and erythrocyte folate concentrations (left) and prevalence of vitamin B12 and folate deficiency (right) as a function of age and gender. The line indicates the geometric mean and the shaded areas are 95% confidence bands.
Nutrients 15 03026 g002
Figure 3. Prevalence of vitamin B12 and folate deficiency in children and adolescents across geographical states of India. The dots indicate means and bars are 95% CI. NCT: National Capital Territory.
Nutrients 15 03026 g003
Figure 4. Prevalence of vitamin B12 and folate deficiency by region in children and adolescents. The dots indicate means and bars are 95% CI.
Nutrients 15 03026 g004
Table 1. Characteristics of the study population.
Characteristics1–4 Years5–9 Years10–19 Years
Vitamin B12
(n = 9976)
% (95% CI)
Folate
(n = 11,004)
% (95% CI)
Vitamin B12
(n = 12,156)
% (95% CI)
Folate
(n = 14,125)
% (95% CI)
Vitamin B12
(n = 11,748)
% (95% CI)
Folate
(n = 13,621)
% (95% CI)
Age in yearsMean (95% CI)2.78
(2.74–2.83)
2.78
(2.74–2.83)
7.02
(6.97–7.06)
7.02
(6.98–7.07)
14.3
(14.2–14.4)
14.3
(14.2–14.4)
SexBoys52.9
(50.3–55.4)
52.5
(50.0–55.0)
51.6
(49.8–53.3)
51.2
(49.4–52.9)
50.6
(48.6–52.5)
50.6
(48.8–52.4)
Girls47.1
(44.6–49.7)
47.5
(45.0–50.0)
48.4
(46.7–50.2)
48.8
(47.1–50.6)
49.4
(47.5–51.4)
49.4
(47.6–51.2)
ResidenceUrban24.9
(21.7–28.4)
25.7
(22.5–29.1)
23.6
(20.7–26.8)
25.1
(22.1–28.2)
25.2
(22.1–28.6)
25.7
(22.6–29.0)
Rural75.1
(71.6–78.3)
74.3
(70.9–77.5)
76.4
(73.2–79.3)
74.9
(71.8–77.9)
74.8
(71.4–77.9)
74.3
(71.0–77.4)
Wealth IndexPoorest15.9
(13.8–18.3)
15.8
(13.7–18.1)
18.1
(16.2–20.3)
18.0
(15.8–20.4)
17.8
(15.5–20.4)
18.3
(16.0–20.8)
Poor21.2
(18.5–24.1)
20.5
(17.9–23.4)
21.3
(19.4–23.3)
20.2
(18.5–21.9)
20.5
(18.8–22.3)
20.6
(18.9–22.3)
Middle22.3
(20.4–24.3)
21.7
(19.9–23.5)
21.5
(19.9–23.3)
21.0
(19.4–22.5)
21.4
(19.8–23.1)
20.3
(18.8–21.9)
Rich20.8
(18.9–22.9)
21.7
(19.7–23.9)
21.0
(19.4–22.7)
21.6
(19.9–23.3)
20.9
(19.3–22.7)
21.0
(19.4–22.8)
Richest19.8
(17.7–22.0)
20.3
(18.3–22.5)
18.0
(16.4–19.8)
19.3
(17.6–21.1)
19.3
(17.5–21.2)
19.8
(17.9–21.8)
Mother’s SchoolingPrimary34.3
(31.7–36.9)
34.6
(31.9–37.3)
47.8
(45.4–50.3)
47.9
(45.6–50.3)
16.3
(14.3–18.4)
15.9
(14.1–18.0)
Secondary44.3
(41.8–46.8)
43.6
(41.3–46.0)
40.1
(38.0–42.3)
39.8
(37.8–41.8)
68.7
(66.2–71.1)
69.3
(67.0–71.5)
Higher secondary10.8
(9.3–12.5)
11.4
(9.9–13.1)
6.7
(6.0–7.6)
6.9
(6.2–7.8)
9.7
(7.7–12.1)
9.5
(7.7–11.6)
Graduation and above10.7
(9.2–12.4)
10.4
(9.0–12.0)
5.3
(4.7–6.1)
5.4
(4.8–6.1)
5.3
(4.4–6.3)
5.3
(4.5–6.3)
Father’s OccupationProfessional7.9
(6.8–9.2)
8.5
(7.4–9.9)
9.4
(8.1–10.8)
9.5
(8.3–10.8)
10.0
(8.5–11.7)
9.4
(8.0–10.9)
Sales and services26.8
(24.6–29.1)
28.0
(25.7–30.4)
23.1
(21.4–25.0)
24.2
(22.3–26.1)
24.4
(22.7–26.2)
24.1
(22.5–25.8)
Manual, agriculture51.5
(48.8–54.1)
50.4
(47.6–53.2)
54.8
(52.2–57.4)
53.8
(51.4–56.2)
51.3
(48.8–53.7)
52.4
(50.0–54.7)
Others13.8
(11.8–16.0)
13.1
(11.3–15.1)
12.7
(11.1–14.5)
12.5
(11.0–14.2)
14.3
(12.5–16.4)
14.2
(12.4–16.1)
Child schoolingYes--92.2
(91.1–93.2)
92.1
(91.1–93.0)
80.7
(78.9–82.4)
80.9
(79.2–82.5)
No--7.8
(6.8–8.9)
7.9
(7.0–8.9)
19.3
(17.6–21.1)
19.1
(17.5–20.8)
StuntingNo stunting (HAZ < −2SD)64.4
(62.1–66.7)
64.5
(62.3–66.7)
79.3
(77.7–80.8)
78.6
(76.9–80.3)
73.0
(71.0–74.9)
73.4
(71.6–75.2)
Moderate (HAZ: −3 to −2SD)24.0
(22.2–26.0)
23.3
(21.6–25.0)
15.5
(14.3–16.8)
16.4
(15.1–17.8)
21.3
(19.6–23.1)
20.7
(19.2–22.3)
Severe (HAZ < −3SD)11.5
(10.1–13.2)
12.2
(10.7–13.9)
5.1
(4.3–6.1)
5.0
(4.2–5.8)
5.7
(4.9–6.6)
5.9
(5.1–6.7)
UnderweightNot present (WAZ < −2SD)64.8
(62.0–67.6)
65.1
(62.5–67.6)
----
Moderate (WAZ: −3 to −2SD)26.2
(23.7–28.8)
26.7
(24.3–29.2)
----
Severe (WAZ < −3SD)9.0
(7.8–10.3)
8.2
(7.2–9.4)
----
Wasting/
Thinness
Not present (WHZ < −2SD)84.0
(82.1–85.6)
85.0
(83.5–86.5)
76.4
(74.8–78.0)
76.6
(75.2–78.0)
75.5
(73.7–77.2)
75.7
(74.0–77.2)
Moderate (WHZ:−3 to −2SD)12.2
(10.8–13.8)
11.6
(10.4–12.9)
18.5
(17.1–19.9)
18.4
(17.1–19.8)
18.1
(16.6–19.7)
17.9
(16.6–19.4)
Severe (WHZ < −3SD)3.8
(3.0–4.8)
3.4
(2.8–4.1)
5.1
(4.3–6.0)
5.0
(4.3–5.8)
6.4
(5.7–7.3)
6.4
(5.6–7.3)
Drinking water sourcePiped and improved85.0
(82.4–87.3)
85.2
(82.6–87.5)
84.9
(82.5–87.0)
85.2
(82.9–87.2)
85.6
(83.5–87.5)
86.2
(84.2–87.9)
Non-piped and improved8.9
(7.0–11.2)
9.2
(7.4–11.3)
8.2
(6.6–10.2)
8.1
(6.7–9.9)
8.1
(6.8–9.6)
7.7
(6.5–9.1)
Unimproved6.1
(4.8–7.6)
5.6
(4.3–7.4)
7.0
(5.7–8.4)
6.7
(5.3–8.4)
6.3
(5.1–7.9)
6.1
(5.0–7.6)
HandwashingBasic50.3
(47.5–53.1)
52.4
(49.7–55.2)
46.8
(44.1–49.5)
49.3
(46.7–51.9)
47.8
(45.3–50.3)
48.7
(46.2–51.3)
Limited36.1
(33.4–38.8)
33.8
(31.3–36.5)
39.4
(36.6–42.3)
37.2
(34.6–39.8)
35.5
(33.1–38.0)
34.7
(32.5–37.1)
No facility13.6
(11.7–15.9)
13.7
(11.8–15.9)
13.8
(12.1–15.8)
13.5
(11.8–15.4)
16.7
(14.7–19.0)
16.5
(14.4–18.8)
SanitationImproved and not shared43.8
(40.5–47.2)
44.1
(41.0–47.1)
39.7
(37.2–42.3)
40.5
(38.0–43.0)
47.8
(45.3–50.4)
47.1
(44.5–49.7)
Improved and shared12.2
(10.8–13.7)
13.0
(11.6–14.6)
12.3
(11.0–13.8)
12.3
(11.0–13.8)
8.7
(7.7–9.8)
9.0
(8.0–10.1)
Unimproved44.0
(40.1–48.0)
43.0
(39.3–46.7)
48.0
(44.8–51.2)
47.2
(44.1–50.4)
43.5
(40.6–46.4)
43.9
(41.1–46.8)
History of diarrhea in the two weeks prior to surveyYes15.0
(12.9–17.5)
15.3
(13.3–17.6)
9.4
(8.2–10.7)
9.0
(8.0–10.2)
--
No85.0
(82.5–87.1)
84.7
(82.4–86.7)
90.6
(89.3–91.8)
91.0
(89.8–92.0)
--
History of fever in the two weeks prior to surveyYes30.7
(28.3–33.2)
31.5
(29.2–33.9)
21.8
(19.8–24.0)
22.2
(20.5–24.0)
--
No69.3
(66.8–71.7)
68.5
(66.1–70.8)
78.2
(76.0–80.2)
77.8
(76.0–79.5)
--
HAZ; height-for-age, WHZ; weight-for-height, WAZ; weight-for-age.
Table 2. (A) Serum vitamin B12 levels and prevalence of vitamin B12 deficiency (B) Erythrocyte folate levels and prevalence of folate deficiency among children and adolescents stratified based on sex and age groups.
(A)
Sex1–4 Years (n = 9976)5–9 Years (n = 12,156)10–19 Years (n = 11,748)
Vitamin B12 (pg/mL)
Geometric Mean (95% CI)
Vitamin B12 
Deficiency % (95% CI)
Vitamin B12 (pg/mL)
Geometric Mean (95% CI)
Vitamin B12 
Deficiency % (95% CI)
Vitamin B12 (pg/mL)
Geometric Mean (95% CI)
Vitamin B12
Deficiency % (95% CI)
Boys310.3 a
(301.4–319.3)
14.3 a
(11.4–17.7)
297.3 a
(290.0–304.7)
16.7 a
(14.7–18.9)
241.6 a
(235.2–248.2)
35.0 a
(31.8–38.3)
Girls313.3 a
(304.1–322.8)
13.3 a
(10.9–16.2)
291.7 a
(283.5–300.2)
17.9 a
(15.3–20.8)
257.1 b
(250.6–263.8)
27.0 b
(24.4–29.7)
Total311.7 *
(305.0–318.5)
13.8
(11.7–16.2)
294.6 #
(288.2–301.0)
17.3
(15.4–19.3)
249.2 $
(243.9–254.6)
31.0
(28.7–33.5)
(B)
Sex1–4 Years (n = 11,004)5–9 Years (n = 14,125)10–19 Years (n = 13,621)
Folate (ng/mL)
Geometric Mean
(95% CI)
Folate
Deficiency %
(95% CI)
Folate (ng/mL)
Geometric Mean (95% CI)
Folate
Deficiency % (95% CI)
Folate (ng/mL)
Geometric Mean (95% CI)
Folate
Deficiency %
(95% CI)
Boys245.8 a
(233.4–258.9)
22.6 a
(19.7–25.8)
217.7 a
(208.0–228.0)
27.7 a
(25.1–30.4)
173.3 a
(164.4–182.6)
38.3 a
(35.3–41.4)
Girls237.8 a
(225.1–251.1)
22.9 a
(20.2–25.9)
212.2 a
(201.8–223.2)
27.6 a
(25.1–30.3)
196.7 b
(186.6–207.3)
32.9 a
(30.2–35.7)
Total241.9 *
(231.4–252.9)
22.8
(20.5–25.2)
215.0 #
(206.4–224.1)
27.6
(25.5–29.9)
184.5 $
(176.3–193.0)
35.6 §
(33.1–38.2)
Superscripts ab in the same column indicate estimates with non-overlapping CIs. Superscripts *#$ and †‡ in the same row for serum vitamin B12 levels and vitamin B12 deficiency, and superscripts *#$ and †‡§ in the same row for erythrocyte folate levels and folate deficiency, respectively.
Table 3. Prevalence of vitamin B12 and folate deficiency by under-nutrition and morbidity variable.
Characteristics1–4 Years5–9 Years10–19 Years
Vitamin B12 Deficiency
% (95% CI)
Folate
Deficiency
% (95% CI)
Vitamin B12 Deficiency % (95% CI)Folate
Deficiency
% (95% CI)
Vitamin B12 Deficiency % (95% CI)Folate
Deficiency
% (95% CI)
StuntingNo Stunting
(HAZ < −2 SD)
12.7 a
(10.2–15.8)
22.9 a
(20.5–25.5)
17.8 a
(15.8–20.0)
28.1 a
(25.9–30.4)
31.2 a
(28.8–33.7)
37.2 a
(34.4–40.1)
Moderate
(HAZ: −3 to −2 SD)
15.1 a
(12.2–18.5)
23.5 a
(19.9–27.5)
18.9 a
(15.2–23.2)
27.2 a
(23.4–31.4)
31.5 a
(26.3–37.3)
31.8 a
(27.9–35.9)
Severe
(HAZ < −3 SD)
18.9 a
(12.7–27.3)
21.6 a
(16.8–27.4)
8.2 b
(5.2–12.8)
22.2 a
(16.7–28.8)
27.6 a
(20.3–36.3)
29.1 a
(23.5–35.5)
Wasting/ThinnessNot present
(WAZ < −2 SD)
14.8 a
(12.3–17.6)
22.8 a
(20.3–25.5)
18.0 a
(15.9–20.3)
27.4 a
(25.1–29.9)
32.9 a
(30.0–35.9)
35.8 a
(32.9–38.7)
Moderate
(WAZ: −3 to −2 SD)
11.1 a
(8.2–14.8)
21.5 a
(17.5–26.2)
17.0 a
(13.7–20.8)
29.1 a
(25.6–32.9)
26.8 ac
(23.0–30.8)
35.0 a
(31.1–39.1)
Severe
(WAZ < −3 SD)
7.8 a
(4.7–12.7)
24.0 a
(17.1–32.7)
12.1 a
(8.0–18.0)
26.4 a
(20.5–33.4)
21.6 bc
(16.6–27.5)
34.0 a
(28.4–40.1)
UnderweightNot present
(WHZ < −2 SD)
13.6 a
(11.1–16.5)
23.1 a
(20.5–25.9)
----
Moderate
(WHZ: −3 to −2 SD)
15.8 a
(12.2–20.2)
22.6 a
(18.9–26.8)
----
Severe
(WHZ < −3 SD)
11.8 a
(8.1–16.9)
20.4 a
(16.5–24.9)
----
History of diarrhea in the two weeks prior to surveyYes19.1 a
(12.1–28.8)
14.9 a
(11.5–19.1)
23.8 a
(18.1–30.5)
20.2 a
(15.8–25.5)
--
No12.9 a
(11.1–15.0)
24.2 b
(21.8–26.7)
16.6 a
(14.8–18.6)
28.4 b
(26.1–30.7)
--
History of fever in the two weeks prior to surveyYes16.9 a
(11.6–23.9)
19.6 a
(16.4–23.3)
15.8 a
(12.5–19.8)
22.8 a
(19.6–26.4)
--
No12.5 a
(10.7–14.4)
24.2 a
(21.5–27.1)
17.7 a
(15.9–19.7)
29.0 b
(26.7–31.4)
--
Superscripts abc in the same column indicate estimates with non-overlapping CIs. HAZ; height-for-age, WHZ; weight-for-height, WAZ; weight-for-age.
Table 4. Prevalence of vitamin B12 and folate deficiency with iron–folic acid supplementation in all age groups.
IFA1–4 Years5–9 Years10–19 Years
Vitamin B12
Deficiency %
(95% CI)
Folate
Deficiency %
(95% CI)
Vitamin B12
Deficiency %
(95% CI)
Folate
Deficiency %
(95% CI)
Vitamin B12
Deficiency %
(95% CI)
Folate
Deficiency %
(95% CI)
Yes11.2 a
(7.2–16.9)
14.6 a
(9.9–21.0)
18.1 a
(13.8–23.2)
28.9 a
(23.4–35.1)
28.5 a
(23.6–34.0)
38.9 a
(33.2–45.0)
No14.0 a
(11.7–16.7)
23.3 b
(21.0–25.7)
17.2 a
(15.4–19.2)
27.5 a
(25.3–29.9)
31.2 a
(28.7–33.7)
35.5 a
(32.9–38.1)
IFA, iron–folic acid. Superscripts ab in the same column indicate estimates with non-overlapping CIs.
Disclaimer/Publisher’s Note: The statements, opinions and data contained in all publications are solely those of the individual author(s) and contributor(s) and not of MDPI and/or the editor(s). MDPI and/or the editor(s) disclaim responsibility for any injury to people or property resulting from any ideas, methods, instructions or products referred to in the content.

