Abstract
This study aims to evaluate the determinants and clinical markers of patients at risk for severe hypoglycemia (SH) in children and adolescents with type 1 diabetes. In the EPI-GLUREDIA study, clinical parameters and continuous glucose monitoring metrics from children and adolescents with type 1 diabetes were retrospectively analyzed between July 2017 and June 2022. Their clinical parameters were collected during traditional and quarterly medical consultations according to whether they experienced severe hypoglycemia or not. Then, continuous glucose monitoring metrics were analyzed on days surrounding SH during specific periods. According to the glycemic parameters, glycemic hemoglobin and glycemic mean were significantly lower in the three months preceding a SH compared with during three normal months (p < 0.05). Moreover, the time spent in hypoglycemia(time below the range, TBR<3.3) and its strong correlation (R = 0.9, p < 0.001) with the frequency of SH represent a sensitive and specific clinical parameter to predict SH (cut-off: 9%, sensitivity: 71%, specificity: 63%). The second finding of the GLUREDIA study is that SH is not an isolated event in the glycemic follow-up of our T1DM patients. Indeed, most of the glycemic parameters (i.e., glycemic mean, glycemic variability, frequency of hypoglycemia, and glycemic targets) vary considerably in the month preceding an SH (all p < 0.05), whereas most of these studied glycemic parameters remain stable in the absence of a severe acute complication (all p > 0.05). Furthermore, the use of ROC curves allowed us to determine for each glycemic parameter a sensitive or specific threshold capable of more accurately predicting SH. For example, a 10% increase in the frequency of hypoglycemia predicts a risk of near SH with good combination of sensitivity and specificity (sensitivity: 80%, specificity: 60%). The GLUREDIA study aimed to target clinical and glycemic parameters to predict patients at risk for SH. First, we identified TBR<3.3 < 9% as a sensitive and specific tool to reduce the frequency of SH. In addition, SH was not an isolated event but rather it was accompanied by glycemic disturbances in the 30 days before SH.
1. Introduction
Type 1 diabetes mellitus (T1D) is characterized by chronic hyperglycemia and insulinopenia consecutive to an autoimmune reaction that massively reduces the function of pancreatic β cells. Shortly after the initiation of insulin therapy, a majority of patients enter partial remission, a transient period defined by an increase in residual β-cell insulin secretion that clinically translates in both reduced daily insulin requirements and improved glycemic control. After partial remission, a progressive increase in exogenous insulin dependence leads to a rise in glycemic variability and difficulties in avoiding hypoglycemia [1]. Even under conventional intensive insulin therapy, a high frequency of hypoglycemia (estimated at 5–15% of total blood glucose measurements) is necessary to maintain the glycemic mean within treatment targets (i.e., <8.25 mmol/L) [2,3].
Hypoglycemia, characterized by low levels of blood (i.e., plasma or capillary) or subcutaneous glucose (i.e., <3.3 mmol/L), is thus the most frequent acute complication of T1D and results from an imbalance between insulin requirements, insulin dose, and carbohydrate intake [4]. Depending on the severity of related symptoms, hypoglycemia is graded from mild to severe, with severe hypoglycemia (SH) corresponding to any blood glucose level below 2.97 mmol/L accompanied by an alteration in patient consciousness [5].
Symptomatic hypoglycemia is responsible for reduced quality of life in children with T1D and their families. Several studies have highlighted that SH fosters symptoms of depression and anxiety in a significant proportion of patients with T1D and their parents. Parents may also be worried about potential acute and long-term complications of hypoglycemic events [6,7]. Moreover, an episode of SH can trigger a psychological and physiological barrier to optimal diabetes management in the weeks following an episode [3]. Unfortunately, SH remains sudden for most patients and for the diabetes care team, especially since no markers or tools exist that can effectively predict the occurrence of SH in patients with T1D.
For many years, studies have shown that glycated hemoglobin (HbA1C) and glycemic mean were significantly lower in patients with the highest risk of SH [8]. However, several recent longitudinal studies have shown a decrease in the frequency of SH in parallel with a reduction in the mean level of HbA1C, partly related to an improvement in the overall therapeutic management of diabetes [9,10,11,12], leaving us without usable markers to identify patients at risk of SH. The objective of this analysis is to identify glycemic and clinical markers of risk for SH in children and adolescents with type 1 diabetes.
2. Methodology
2.1. Study Design and Participants
The Epi-GLUREDIA study, a subsidiary part of the GLUREDIA consortium study, is a retrospective, monocentric clinical study designed to characterize SH in children and adolescents with type 1 diabetes. The study took place entirely in the pediatric diabetes department of Cliniques universitaires Saint-Luc (CUSL, Brussels, Belgium). All data were collected and analyzed in accordance with the ethical Declaration of Helsinki. The GLUREDIA study was approved by the Hospital-Faculty Ethics Committee of the CUSL (2022/02/FEV/043). Patient enrollment began on 1 July 2017 and ended on 30 June 2022.
Patients eligible to participate in the Epi-GLUREDIA study were 2 to 20 years old and were diagnosed with type 1 diabetes according to American Diabetes Association (ADA) criteria, such as fasting blood glucose ≥ 6.93 mmol/L and/or blood glucose ≥ 11 mmol/L at the 120th minute of OGTT; HbA1C ≥ 6.5%; and/or symptoms of hyperglycemia/hyperglycemic crisis with random glucose ≥ 11 mmol/L and presence of one or more anti-islet autoantibodies (i.e., anti-insulin, anti-IA2, anti-GAD65, and anti-ZnT8) in the serum [1,13].
Exclusion criteria for the study were age <2 years or >20 years; absence of anti-islet autoantibodies; use of drugs that may interfere with insulin secretion or sensitivity (i.e., sulfonylureas, diazoxide, somatostatin, methylxanthic derivatives, corticosteroids, biguanides, and incretins); the presence, at inclusion, of celiac disease diagnosed by a pathological duodenal biopsy within one month; the presence, at inclusion, of an autoimmune or autoinflammatory disease other than T1D or of an active malignant disease; morbid obesity defined by a body mass index (BMI) with a Z-score greater than three standard deviations; hepatic, renal, or adrenal insufficiency; dysmorphia with suspected underlying genetic syndrome; a history of bone marrow allograft or post-hemolytic-uremic syndrome diabetes; or participation in another study within the previous three months, with administration of blood derivatives or potentially immunomodulatory treatments.
2.2. Study Procedure
The Epi-GLUREDIA retrospective study consisted of an analysis of the clinical and glycemic parameters encoded in the medical records (EPIC® software, © 1979–2022 Epic System Corporation, Verona, WI, USA) of patients currently enrolled in the CUSL pediatric diabetes convention of care. Clinical data (clinical and glycemic parameters) were recorded at each report of clinical follow-up visit of all our patients.
2.3. Severe Hypoglycemia
Severe hypoglycemia is characterized by an abnormally low blood glucose level, below 2.97 mmol/L. It manifests itself as altered consciousness in patients with diabetes [2]. The diagnosis is made by a diabetologist during consultation following an episode of severe hypoglycemia. Blood glucose levels and altered consciousness are assessed to confirm the condition.
2.4. Partial Remission
Remission status was determined using the IDAA1C score, as follows: HbA1c (%) + 4 × insulin dose (U/kg body weight per 24 h). The remission status is defined by a IDAA1C score below 9 [14].
2.5. Continuous Glucose Monitoring
Raw continuous glucose monitoring metrics from a 90-day interval were extracted at each outpatient clinical visit from various continuous glucose monitoring devices (i.e., Freestyle Libre®, Abbott; Dexcom®, Dexcom; EnliteTM, Medtronic MiniMed). Raw glycemic data were pre-processed using the R (R Core Team (2021)) statistical package cgmanalysis. Hypoglycemia was defined as a value below 60 mg/dL (3.3 mmol/L), and hyperglycemia was defined as a value above 160 mg/dL (8.8 mmol/L), for all glycemic measurements (i.e., capillary and subcutaneous). Glycemic values below 20 mg/dL (1.1 mmol/L) or contiguous values with a dynamic change >100 mg/dL (5.6 mmol/L) in less than 5 min were considered as artifacts and were excluded from the analysis. Among the glycemic parameters studied were the proportion of time spent affected by hypoglycemia (time below the range; TBR<3.3), the proportion of time spent affected by normoglycemia (time in range; TIR3.3–8.8), and proportion of time spent affected by hyperglycemia (time above the range; TAR>8.8).
2.6. Statistical Analyses
All statistical analyses were performed R (R Core Team (2021). R: A language and environment for statistical computing. R Foundation for Statistical Computing, Vienna, Austria. URL [https://www.R-project.org/, accessed on 20 December 2022]). The level of statistical significance used for all analyzes was 0.05. Demographic and clinical data are reported as mean ± standard deviation for continuous variables and as numbers and proportions for categorical variables. Linear regression was used for continuous variables. The comparisons between groups were made using Student t-test (if two groups) or their non-parametric equivalent (Mann–Whitney U test), as appropriate. The comparisons between proportions were made using Chi-square test. The correlations were estimated by Pearson’s correlation coefficient. p-values were adjusted for multiple testing with the Bonferroni procedure [15].
3. Results
In our pediatric cohort of patients with T1D, we selected 441 medical outpatient visits from 356 pediatric patients occurring between July 2017 and June 2022, and divided these visits in two groups: one (severe hypoglycemia group or SH group) composed of all consultations (n = 162) that followed a recent SH episode (less than 3 weeks between SH and consultation; mean = 17 days), whereas the other (i.e., non-SH group) was composed of 279 random consultations not preceded by a severe acute complication (SH or ketoacidosis) in the 12 months preceding the consultation (flow chart; Figure 1).
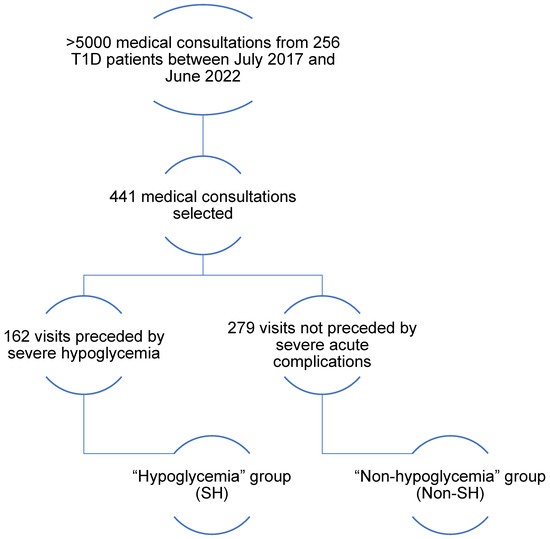
Figure 1.
Flowchart. Between July 2017 and June 2022, there were over 5000 pediatric diabetes visits; 441 medical consultations were selected from the 5000: 162 consultations were preceded by severe hypoglycemia in the past 3 weeks; these 162 consultations constitute SH; 279 consultations were randomly selected and not preceded by severe hypoglycemia in the previous 12 months; these 279 consultations represent the non-SH.
First, we wanted to evaluate clinical and diabetes parameters that might distinguish SH and non-SH groups (Table 1). Although there was no difference in gender distribution and diabetes duration between the two groups (all p > 0.05), girls in the SH were slightly younger than girls in the non-SH. The proportion of girls treated with insulin pumps in the SH was significantly lower than controls. These differences were not observed in boys. Moreover, no significant difference existed between the two groups of patients regarding the frequency and average duration of partial remission, or the proportion of patients currently in partial remission.

Table 1.
Description of cohorts.
Regarding glycemic parameters, we observed a significantly lower glycemic mean and HbA1C in patients from the SH compared with the non-SH (Table 1). Furthermore, HbA1C correlated intensely but inversely with the proportion of consultations preceded by SH (number of consultations SH/total number of consultations according to the value of HbA1C rounded to the decimal point) (R = −0.87; p < 0.001). In opposition, time spent affected by hypoglycemia (time below the range < 3.3 mmol/L; TBR<3.3) was significantly greater for patients in the SH (vs. non-SH). Additionally, we demonstrated an intense positive correlation between TBR<3.3 and the proportion of visits preceded by SH (R = 0.9; p < 0.001). Next, we performed a preliminary logistic regression to determine the most reliable parameter for predicting severe hypoglycemia. The first three parameters considered were mean blood glucose (Pr < 0.001), glycated hemoglobin (Pr < 0.001), and target glucose level (Pr < 0.001). Finally, the ROC curve analysis showed a TBR<60 at 9% to be the value with the best combination of sensitivity and specificity for determining a risk of SH (sensitivity: 71%, specificity: 63%, relative risk: 2.9) (Figure 2).
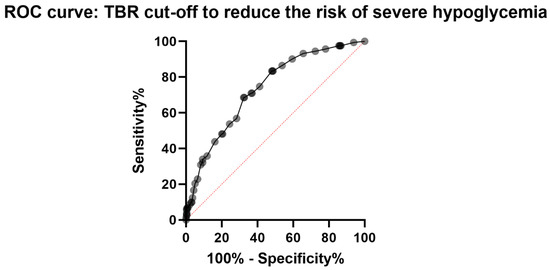
Figure 2.
Representation of the ROC curves used to determine a TBR cut-off to reduce the risk of occurring severe hypoglycemia.
In a second step, we were able to collect and analyze 42 CGM records having recorded a SH event. The glycemic parameters analyzed were glycemic mean, coefficient of glycemic variability (CV), frequency of hypoglycemia, mean duration of hypoglycemia, time spent affected by normoglycemia (time in range (3.3; 8.8 mmol/L); TIR3.3–8.8), time spent affected by hypoglycemia (time below the range (<3.3 mmol/L); TBR<3.3), and time spent affected by hyperglycemia (time above the range (>8.8 mmol/L); TAR>8.8).
First, we analyzed the temporal evolution of glycemic parameters during the five days preceding SH. Specifically, we assessed whether the different glycemic parameters varied daily according to a specific pattern during the 5 days preceding SH (Figure 3A). While there were significant inter-day variations for the majority of glycemic parameters studied (p < 0.05), we observed no specific pattern of temporal evolution of the different glycemic parameters studied during these five days (p > 0.05). Indeed, no glycemic parameter remained stable during the five days preceding SH, yet the daily modification of these parameters was not uniform for all patients (Figure 4).
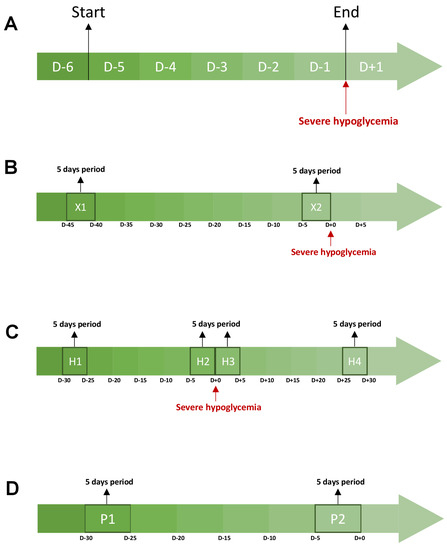
Figure 3.
Description of the periods studied during the CGMs analysis. Each graph represents a cgms analysis. The orange areas correspond to the periods studied. (A) represents the evolution of glycemic parameters during the 5 days preceding a severe hypoglycemia. (B) compares the glycemic parameters between a 5-day period directly preceding a severe hypoglycemia and a 5-day period more than 30 days away from any acute severe complication (ketoacidosis and severe hypoglycemia). (C) studies the evolution of glycemic parameters between four periods around a severe hypoglycemia. H1 is a 5-day period starting 30 days before severe hypoglycemia. H2 is a 5-day period directly preceding a severe hypoglycemia. H3 is a 5-day period directly following a severe hypoglycemia. H4 a 5-day period that ends 30 days after a severe hypoglycemia. (D) studies the evolution of glycemic parameters between two periods of 5 days and 20 days apart from any acute severe complication (ketoacidosis and severe hypoglycemia). Abbreviations: D-(number), number of days before severe hypoglycemia (A–C) or the end of the evaluation of glycemic parameters (D).
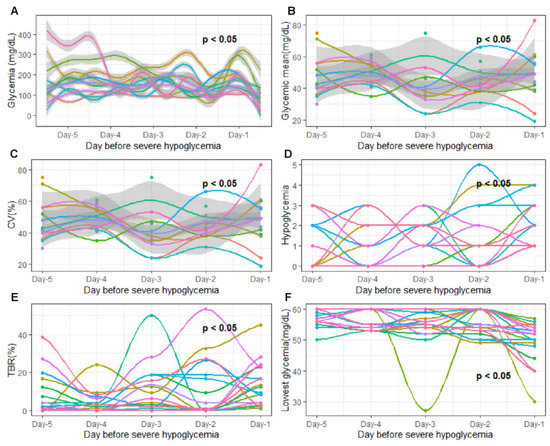
Figure 4.
Evolution of glycemic parameters 5 days before severe hypoglycemia. The x-axis represents the 5 days studied before severe hypoglycemia. Day-5, 5 days before severe hypoglycemia; Day-4, 4 days before severe hypoglycemia; Day-3, 3 days before severe hypoglycemia; Day-2, 2 days before severe hypoglycemia; Day-1; 24 h before severe hypoglycemia The y axis corresponds to the glycemic parameters: (A) glycemia (mg/dL); (B) daily glycemic mean (mg/dL); (C) glycemic variability; (D) hypoglycemia frequency (n/day); (E) time spent affected by hypoglycemia (<3.3 mmol/L); (F) lowest recorded glycemic value (mg/dL). The curve on the graph models the variation in the studied glycemic parameters via polynomial regression. The gray areas following the blue curve represent the confidence interval of the polynomial regression. Each color of the graph corresponds to a single patient. On all graphs, p-values are written. Each p-value determines the variation in each glycemic parameter as a specific temporal evolution pattern. Temporal evolution pattern was considered as significant when p-value was under 0.05. p-values were adjusted for multiple testing with the Bonferroni procedure after a paired test.
Next, we compared the glycemic parameters between a period of five days directly preceding a SH (X1) and a period of five days (X2) more than 30 days away from any acute severe complication (SH or diabetic ketoacidosis) (Figure 3B). First, we observed a significantly lower TAR>8.8 and glycemic mean on the five days prior to SH compared with the five days away from any severe acute complication (all p < 0.05). In contrast, CV, hypoglycemia frequency, mean duration of hypoglycemia, and TBR<3.3 were significantly greater during X1 compared with the X2 period (All p < 0.05). Finally, we observed no significant difference for TIR3.3–8.8 between the two periods (p > 0.05) (Figure 5).
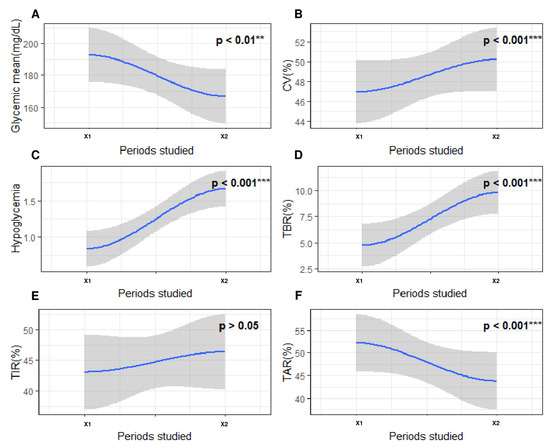
Figure 5.
Evolution of glycemic parameters between a period of five days directly preceding a SH episode and a period of five days more than 30 days away from any acute severe complication (SH or diabetic ketoacidosis). The x-axis represents the 2 periods studied around severe hypoglycemia. X1, a 5-day period more than 30 days away from severe hypoglycemia; X2, a 5-day period directly preceding severe hypoglycemia. The y axis corresponds to the glycemic parameters: (A) glycemic mean (mg/dL); (B) coefficient of variability (%); (C) frequency of hypoglycemia (n/day); (D) time spent affected by hypoglycemia (<3.3 mmol/L; %); (E) time spent affected by normoglycemia (3.3–8.8 mmol/L; %); (F) time spent affected by hyperglycemia (>8.8 mmol/L; %). The blue curve on the graph models the variation in the studied glycemic parameters via polynomial regression. The gray areas following the blue curve represent the confidence interval of the polynomial regression. On all graphs, p-values are written. Each p-value represents the statistical significance of the variation in the studied blood glucose parameter between the two periods concerned. Differences between two periods were considered as significant when p-value was under 0.05. The level of significance is represented as follows: nonsignificant (), p < 0.01 (**), p < 0.001 (***).
Subsequently, we studied the evolution of glycemic parameters during a 60-day period that starts 30 days before SH and ends 30 days after SH. For this purpose, we divided this timing into four distinct parts of 5 days: H1, a period that started 30 days before SH; H2, a period that directly preceded SH; H3, a period that directly followed SH; and H4, a period that ended 30 days after SH (Figure 3C). In this way, we observed that all glycemic parameters evolved differently and significantly frequently between each of these periods (Figure 6). For example, glycemic mean and TAR>160 decreased between H1 and H2 (p < 0.05), remained stable between H2 and H3 (p > 0.05), and then increased between H3 and H4 (p > 0.05). On the other hand, the CV did not significantly change across the four periods (p > 0.05). Finally, the frequency of hypoglycemia reached its maximum during H2 and then decreased.
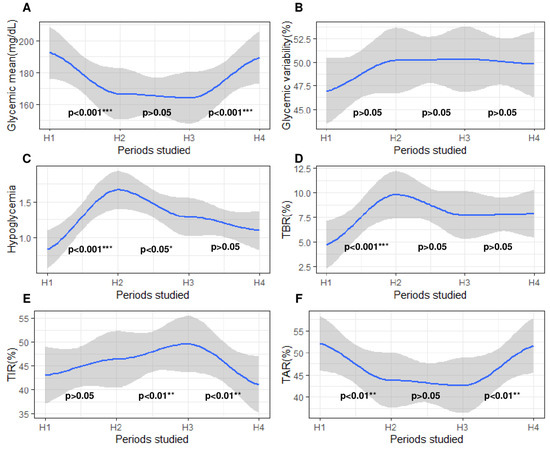
Figure 6.
Evolution of glycemic parameters 30 days before and 30 days after severe hypoglycemia. The x-axis represents the 4 periods studied around severe hypoglycemia. H1, a 5-day period beginning 30 days before severe hypoglycemia; H2, a 5-day period directly preceding severe hypoglycemia; H3, a 5-day period directly following severe hypoglycemia; H4, a 5-day period ending 30 days after severe hypoglycemia. The y-axis corresponds to the glycemic parameters: (A) glycemic mean; (B) coefficient of variability; (C) frequency of hypoglycemia; (D) time spent affected by hypoglycemia (<3.3 mmol/L); (E) time spent affected by normoglycemia (3.3–8.8 mmol/L); (F) time spent affected by hyperglycemia (>8.8 mmol/L). On all graphs, 3 p-values are written, each located between two periods. The blue curve on the graph models the variation in the studied glycemic parameters by polynomial regression. The gray areas following the blue curve represent the confidence interval of the polynomial regression. Each p-value represents the statistical significance of the variation in the studied blood glucose parameter between the two periods concerned. Differences between two periods were considered as significant when p-value was under 0.05. p-values were adjusted for multiple testing with the Bonferroni procedure after a paired test. The level of significance is represented as follows: nonsignificant (), p < 0.05 (*), p < 0.01 (**), p < 0.001 (***).
Finally, we compared these glycemic parameters between two periods (P1–P2) of 5 days separated by 20 days without any severe acute complication related to T1D (Figure 3D). The objective was to determine how glycemic parameters naturally varied over time, outside of severe events. Most glycemic parameters remained stable over time (P1 vs. P2, all p > 0.05). Only TIR3.3–8.8 and TBR<3.3 varied (All p < 0.05) between these two uncomplicated periods (Figure 7).
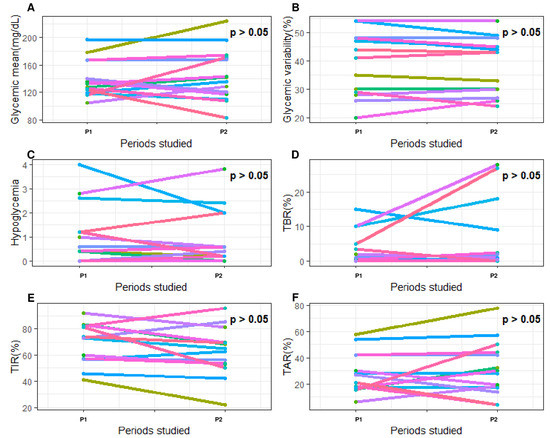
Figure 7.
Evolution of glycemic parameters between two periods (P1–P2) of 5 days separated by 20 days without any severe acute complication related to type 1 diabetes. The x-axis represents the 2 periods studied around severe hypoglycemia. P1, the first 5-day period; P2, the second 5-day period. The y-axis corresponds to the glycemic parameters: (A) glycemic mean (mg/dL); (B) coefficient of variability (%); (C) frequency of hypoglycemia (n/day); (D) time spent affected by hypoglycemia (<3.3 mmol/L; %); (E) time spent affected by hyperglycemia (>8.8 mmol/L; %); (F) time in range (3.3–8.8 mmol/L; %). Each color of the graph corresponds to a single patient. On all graphs, p-values are written. Each p-value represents the statistical significance of the variation in the studied blood glucose parameter between the two periods concerned. Differences between two periods were considered as significant when p-value was under 0.05.
Finally, these differences in the variation in glycemic parameters between two uncomplicated periods (P1–P2) and a group of periods preceding SH (H1–H2) encouraged us to calculate the intensity of the variation in glycemic parameters between these two periods separated by 20 days. The variation in glycemic parameters was calculated on CGM data either containing SH (H1–H2 periods) or including no severe acute diabetes-related complications (P1–P2 periods).These periods have been described above. Finally, the intensity of the variation in the glycemic parameters was calculated using the following formula ([H2–H1]/H1) or ([P2–P1]/P1). With these calculated data, we used ROC curves to determine the thresholds of variation in all glycemic parameters to predict a risk of SH. For each parameter studied (i.e., glycemic mean, frequency of hypoglycemia, TAR>8.8, and TBR<3.3), we identified cut-offs that occurred with the best combination of sensitivity and specificity. Above the absolute values of these cut-offs, we observed a significant increased risk of SH. For example, an increase of more than 50% in TAR>160 is associated with an increased risk of SH (sensitivity: 75%, specificity: 53%). Furthermore, we found that variation in the frequency of hypoglycemia (threshold: 10%, sensitivity: 80%, specificity: 60%) offers the best combination of sensitivity and specificity for predicting the risk of SH (Table 2).
Table 2.
Specific threshold to anticipate severe hypoglycemia.
4. Discussion
The first message of our study is the absence of a specific profile of patients particularly at risk of SH based solely on clinical parameters. Indeed, in our investigation, the duration of the disease, the age of the patient, and the gender of the patient did not have any major impacts on the frequency of SH. In other words, SH appeared to be an acute complication that can occur at any time in all our diabetic patients. Only pubertal girls seemed to be partially protected against SH, compared with boys. This observation could be explained, in part, by a decrease in insulin sensitivity related to sex hormones [16]. Moreover, while the insulin pump generally allows for a better glycemic balance and a better control of diabetes [17,18], this treatment seems to partially protect only girls from SH and not boys. Therefore, it seems essential that all patients with de novo diabetes should be adequately and regularly educated by the medical team at diagnosis to recognize and to better treat SH [1,2,19].
Additionally, our study shows that patients in partial remission were not protected from SH. Moreover, the duration or the frequency of partial remission did not protect patients from SH in the long term. Therefore, partial residual insulin secretion does not seem to play a major direct role in the pathophysiology of SH.
While the GLUREDIA study did not find any clinical parameters that effectively predicted SH, there were significant differences in the glycemic parameters between the SH and the non-SH. Although some parameters (i.e., mean glycemia and HbA1C) were previously discussed in smaller-cohort or older clinical studies [8,12], we identified new glycemic parameters to distinguish patients at risk of SH. To select the appropriate clinical parameter, we performed a preliminary logistic regression to determine the most reliable parameter for predicting severe hypoglycemia. The first three parameters considered were mean blood glucose, HbA1C, and TBR<3.3. However, the first two parameters occurred with a major drawback. Increasing mean blood glucose and HbA1C could reduce the risk of severe hypoglycemia, but it could also increase the risk of long-term chronic complications. We therefore chose to focus on reducing TBR<3.3.Time spent affected by hypoglycemia and its strong correlation with the frequency of SH represented a sensitive and specific clinical parameter to predict SH. Therefore, it may be important to revise the management of patients with T1D [20,21,22] and aim for a TBR<3.3 below 9% at each medical visit. Having a TBR<3.3 below 9% would reduce the risk of SH by 60%.
The clinical and glycemic parameters collected at each medical consultation offered us a new therapeutic target to consider when planning therapeutic management and to reduce the risk of SH. However, as mentioned above, SH is always an unexpected event for the patient and their relatives.
The second message of the GLUREDIA study is that SH is not an isolated event in the glycemic follow-up of our patients with T1D. Indeed, most glycemic parameters vary considerably in the thirty days preceding a SH, whereas most of these studied glycemic parameters remained stable in the absence of a severe acute complication. As most of the glycemic parameters vary significantly before SH while they remain stable in the absence of severe acute complications, the great advantage of these observations is that it would be possible to determine the exact moment of occurrence of hypoglycemia according to the intensity of variation in these glycemic parameters.
Thus, with the help of ROC curves, we determined for each parameter a sensitive or specific cut-off point capable of more accurately predicting SH. Consequently, the calculated sensitive and specific thresholds of variation in theses glycemic parameters could become new tools to prevent the risk of a near occurrence of SH. For example, a 10% increase in the frequency of hypoglycemia predicts a risk of near SH with a good combination of sensitivity and specificity (Se: 80%, Sp: 60%). To our knowledge, these observations have not yet been described in the literature and they could allow for improvements in the quality of life of the patients in the future based on their predictive characteristics.
5. Conclusions
The GLUREDIA study aimed to target clinical and glycemic parameters to predict patients at risk of SH. While no clinical parameters were found to predict the risk of SH, we identified TBR < 9% as a sensitive and specific tool to reduce the frequency of SH. Furthermore, when analyzing CGM records, our GLUREDIA study demonstrated that SH was not an isolated event but was accompanied by glycemic disturbances in the 30 days preceding SH. In addition, thresholds of variation in the calculated glycemic parameters could be a new tool to predict a SH event quite accurately.
6. Limitations
One of the main limitations of the GLUREDIA study is caused by the small amount of glycemic data (42 CGMs) available in the medical records of the patients recruited for the study. A second limitation is that GLUREDIA is a single-center and not a multicenter study.
7. Perspectives
A first possibility is to analyze a composite of biological parameters to better target patients at risk of SH. Another possibility is to add additional glycemic parameters in the patient medical records to compare which patient is at risk of SH.
Author Contributions
Conceptualization, P.L.; Methodology, A.H.; Formal analysis, A.H.; Investigation, A.H.; Data curation, A.H., M.B., L.B., E.C. and C.B.; Writing—original draft, A.H.; Writing—review & editing, A.H. and P.L.; Visualization, A.H. and P.L.; Supervision, P.L.; Project administration, P.L.; Funding acquisition, P.L. All authors have read and agreed to the published version of the manuscript.
Funding
Grant funding was obtained from the Leona M. and Harry B. Helmsley Charitable Trust and Fondation Saint-Luc. The funders had no role in the study design, data collection and analysis, decision to publish, or preparation of the manuscript.
Institutional Review Board Statement
The study was conducted in accordance with the ethical declaration of Helsinki and approved by the Hospital-Faculty Ethics Committee of the CUSL (2022/02/FEV/043).
Informed Consent Statement
Informed consent was obtained from all subjects involved in the study.
Data Availability Statement
The data presented in this study are available in the article.
Acknowledgments
The work was supported by grant funding from the Leona M. and Harry B. Helmsley Charitable Trust and Fondation Saint-Luc. We thank the team of pediatric diabetes nurses (Gaëtan de VALENSART, Thierry BARREA) of the CUSL. Our center is a reference center and part of the Endo-ERN rare diabetes study group (MTG3).
Conflicts of Interest
The authors declare no conflict of interest.
References
- Couper, J.J.; Haller, M.J.; Greenbaum, C.J.; Ziegler, A.G.; Wherrett, D.K.; Knip, M.; Craig, M.E. ISPAD Clinical Practice Consensus Guidelines 2018: Stages of type 1 diabetes in children and adolescents. Pediatr. Diabetes 2018, 19, 20–27. [Google Scholar] [CrossRef] [PubMed]
- Ly, T.T.; Maahs, D.M.; Rewers, A.; Dunger, D.; Oduwole, A.; Jones, T.W. Assessment and management of hypoglycemia in children and adolescents with diabetes. Pediatr. Diabetes 2014, 15, 180–192. [Google Scholar] [CrossRef] [PubMed]
- Cryer, P.E. The barrier of hypoglycemia in diabetes. Diabetes 2008, 57, 3169–3176. [Google Scholar] [CrossRef] [PubMed]
- Sanchez-Rangel, E.; Deajon-Jackson, J.; Hwang, J.J. Pathophysiology and management of hypoglycemia in diabetes. Ann. N. Y. Acad. Sci. 2022, 1518, 25–46. [Google Scholar] [CrossRef]
- American Diabetes Association. 6. Glycemic targets: Standards of medical care in diabetes—2021. Diabetes Care 2021, 44, S73–S84. [Google Scholar] [CrossRef]
- Rossi, M.C.; Nicolucci, A.; Ozzello, A.; Gentile, S.; Aglialoro, A.; Chiambretti, A.; Cucinotta, D. Impact of severe and symptomatic hypoglycemia on quality of life and fear of hypoglycemia in type 1 and type 2 diabetes. Results of the Hypos-1 observational study. Nutr. Metab. Cardiovasc. Dis. 2019, 29, 736–743. [Google Scholar] [CrossRef]
- Johnson-Rabbett, B.; Seaquist, E.R. Hypoglycemia in diabetes: The dark side of diabetes treatment. A patient-centered review. J. Diabetes 2019, 11, 711–718. [Google Scholar] [CrossRef]
- Diabetes Control and Complications Trial Research Group. Hypoglycemia in the diabetes control and complications trial. Diabetes 1997, 46, 271–286. [Google Scholar] [CrossRef]
- Fredheim, S.; Johansen, A.; Thorsen, S.U.; Kremke, B.; Nielsen, L.B.; Olsen, B.S.; Svensson, J. Nationwide reduction in the frequency of severe hypoglycemia by half. Acta Diabetol. 2015, 52, 591–599. [Google Scholar] [CrossRef]
- Cooper, M.N.; O’Connell, S.M.; Davis, E.A.; Jones, T.W. A population-based study of risk factors for severe hypoglycaemia in a contemporary cohort of childhood-onset type 1 diabetes. Diabetologia 2013, 56, 2164–2170. [Google Scholar] [CrossRef]
- American Diabetes Association. Standards of medical care in diabetes—2017 abridged for primary care providers. Clin. Diabetes 2017, 35, 5. [Google Scholar] [CrossRef]
- Haynes, A.; Hermann, J.M.; Clapin, H.; Hofer, S.E.; Karges, B.; Jones, T.W.; Holl, R.W. Decreasing trends in mean HbA1c are not associated with increasing rates of severe hypoglycemia in children: A longitudinal analysis of two contemporary population-based pediatric type 1 diabetes registries from Australia and Germany/Austria between 1995 and 2016. Diabetes Care 2019, 42, 1630–1636. [Google Scholar]
- Craig, M.E.; Jefferies, C.; Dabelea, D.; Balde, N.; Seth, A.; Donaghue, K.C. Definition, epidemiology, and classification of diabetes in children and adolescents. Pediatr. Diabetes 2014, 15, 4–17. [Google Scholar] [CrossRef]
- Mortensen, H.B.; Hougaard, P.; Swift, P.; Hansen, L.; Holl, R.W.; Hoey, H.; Åman, J. New definition for the partial remission period in children and adolescents with type 1 diabetes. Diabetes Care 2009, 32, 1384–1390. [Google Scholar] [CrossRef]
- Simes, R.J. An improved Bonferroni procedure for multiple tests of significance. Biometrika 1986, 73, 751–754. [Google Scholar] [CrossRef]
- Kelsey, M.M.; Zeitler, P.S. Insulin resistance of puberty. Curr. Diabetes Rep. 2016, 16, 1–6. [Google Scholar] [CrossRef]
- Cardona-Hernandez, R.; Schwandt, A.; Alkandari, H.; Bratke, H.; Chobot, A.; Coles, N.; Jefferies, C. Glycemic outcome associated with insulin pump and glucose sensor use in children and adolescents with type 1 diabetes. Data from the international pediatric registry SWEET. Diabetes Care 2021, 44, 1176–1184. [Google Scholar] [CrossRef]
- Guzmán, G.; Martínez, V.; Yara, J.D.; Mina, M.A.; Solarte, J.S.; Victoria, A.M.; Fériz, K. Glycemic control and hypoglycemia in patients treated with insulin pump therapy: An observational study. J. Diabetes Res. 2020, 2020, 1581726. [Google Scholar] [CrossRef]
- Lange, K.; Swift, P.; Pańkowska, E.; Danne, T. Diabetes education in children and adolescents. Pediatr. Diabetes 2014, 15, 77–85. [Google Scholar] [CrossRef]
- DiMeglio, L.A.; Acerini, C.L.; Codner, E.; Craig, M.E.; Hofer, S.E.; Pillay, K.; Maahs, D.M. ISPAD Clinical Practice Consensus Guidelines 2018: Glycemic control targets and glucose monitoring for children, adolescents, and young adults with diabetes. Pediatr. Diabetes 2018, 19, 105–114. [Google Scholar] [CrossRef]
- Danne, T.; Bangstad, H.J.; Deeb, L.; Jarosz-Chobot, P.; Mungaie, L.; Saboo, B.; Hanas, R. Insulin treatment in children and adolescents with diabetes. Pediatr. Diabetes 2014, 15, 115–134. [Google Scholar] [CrossRef] [PubMed]
- Smart, C.E.; Annan, F.; Bruno, L.P.; Higgins, L.A.; Acerini, C.L. Nutritional management in children and adolescents with diabetes. Pediatr. Diabetes 2014, 15, 135–153. [Google Scholar] [CrossRef] [PubMed]
Disclaimer/Publisher’s Note: The statements, opinions and data contained in all publications are solely those of the individual author(s) and contributor(s) and not of MDPI and/or the editor(s). MDPI and/or the editor(s) disclaim responsibility for any injury to people or property resulting from any ideas, methods, instructions or products referred to in the content. |
© 2023 by the authors. Licensee MDPI, Basel, Switzerland. This article is an open access article distributed under the terms and conditions of the Creative Commons Attribution (CC BY) license (https://creativecommons.org/licenses/by/4.0/).